Article

Evolution of Cherries (Prunus Subgenus Cerasus) Based on Chloroplast Genomes

1
Institute of Tree Breeding, Zhejiang Academy of Forestry, 399 Liuhe Road, Hangzhou 310023, China
2
State Key Laboratory of Systematic & Evolutionary Botany, Institute of Botany, Chinese Academy of Sciences, Beijing 100093, China
*
Authors to whom correspondence should be addressed.
Int. J. Mol. Sci. 2023, 24(21), 15612; https://doi.org/10.3390/ijms242115612
Submission received: 24 August 2023 / Revised: 20 October 2023 / Accepted: 24 October 2023 / Published: 26 October 2023
(This article belongs to the Special Issue Plant Phylogenomics and Genetic Diversity)

Abstract

:
Cherries (Prunus Subgenus Cerasus) have economic value and ecological significance, yet their phylogeny, geographic origin, timing, and dispersal patterns remain challenging to understand. To fill this gap, we conducted a comprehensive analysis of the complete chloroplast genomes of 54 subg. Cerasus individuals, along with 36 additional genomes from the NCBI database, resulting in a total of 90 genomes for comparative analysis. The chloroplast genomes of subg. Cerasus exhibited varying sizes and consisted of 129 genes, including protein-coding, transfer RNA, and ribosomIal RNA genes. Genomic variation was investigated through InDels and SNPs, showcasing distribution patterns and impact levels. A comparative analysis of chloroplast genome boundaries highlighted variations in inverted repeat (IR) regions among Cerasus and other Prunus species. Phylogeny based on whole-chloroplast genome sequences supported the division of Prunus into three subgenera, I subg. Padus, II subg. Prunus and III subg. Cerasus. The subg. Cerasus was subdivided into seven lineages (IIIa to IIIg), which matched roughly to taxonomic sections. The subg. Padus first diverged 51.42 Mya, followed by the separation of subg. Cerasus from subg. Prunus 39.27 Mya. The subg. Cerasus started diversification at 15.01 Mya, coinciding with geological and climatic changes, including the uplift of the Qinghai–Tibet Plateau and global cooling. The Himalayans were the refuge of cherries, from which a few species reached Europe through westward migration and another species reached North America through northeastward migration. The mainstage of cherry evolution was on the Qing–Tibet Plateau and later East China and Japan as well. These findings strengthen our understanding of the evolution of cherry and provide valuable insights into the conservation and sustainable utilization of cherry’s genetic resources.

1. Introduction

Cherries are members of the Prunus subgenus Cerasus (Mill.) A. Gray, which is predominantly distributed in the temperate and subtropical regions of the northern hemisphere [1,2]. It encompasses 50–60 species with high economic values owing to their ornamental flowers and edible fruits, as well as serving as valuable resources for cherry genetic improvement [1,3]. Nonetheless, the phylogeny, geographic origin, timing, and biogeography of subg. Cerasus species have not been explored. Close genetic relationships among species and frequent interspecific hybridization [4,5,6] are believed to be major obstacles to addressing these uncertainties.
Early attempts to classify and determine the phylogeny of subg. Cerasus primarily relied on the morphological features of leaf, inflorescence, flower, and fruit [3,7,8]. However, due to the extensive overlap in the distribution of species and hysteranthy, it is very difficult to discriminate interspecific differentiations from intraspecific variations [9,10,11], and the circumscription of species in this subgenus remains a contentious issue. Even the subdivision within the subgenus based on morphology needs to be seriously tested using molecular data.
With advances in molecular biology and sequencing technology, subg. Cerasus has undergone some phylogenetic studies using molecular markers, gene fragments, and even the complete chloroplast (cp) genome [6,12,13,14,15,16,17,18]. Unfortunately, one of the two clades revealed by previous studies consists of only one species (P. mahaleb), with all other species in the other clade [12,14,15,16]. The phylogenetic relationships of Cerasus species are actually unresolved due to low resolutions of the markers used [19,20,21,22]. The phylogenetic reconstruction of woody plants with a long life history or a short evolutionary history, such as cherries, requires molecular markers of more informative sites or markers of high resolution. Due to technical limits, phylogeny based on whole cp genomes was made affordable only recently. Another limitation of previous molecular systematics of the subg. Cerasus is that many species were absent from the studies. This is probably because of sampling challenges due to vast but scattered distribution and specimen-identification difficulties because of the hysteranthy of most species.
The subg. Cerasus displays a notable geographic distribution pattern characterized by a disjunct distribution between Eurasia and North America, as well as the Sino-Japanese floristic region. Chin et al. [15] postulated that the ancestor of the subg. Cerasus expanded from East Asia to the western part of North America during the Paleocene–Eocene Thermal Maximum (PETM) and Early Eocene Climatic Optimum (EECO) through the ice-free Bering Land Bridge. However, other biogeographical studies suggested that the most closely related species with disjunct distribution likely migrated from East Asia to North America during the Miocene Epoch [23]. The time when the migration of subg. Cerasus plants between East Asia and North America happened remains to be estimated. Moreover, the formation of the Sino-Japanese disjunct distribution seems more complex due to diverse terrain and climatic conditions, as well as the complex geological and climatic history and sea-level changes the plants in this region experienced [24,25]. These factors are critical driving forces for the formation of the geographic distribution pattern of species [26]. About 90% of the cherry species occur in the Sino-Japanese floristic region, and the biogeographical relationships of cherry species in this region have drawn a lot of attention.
In this study, we determined 54 cp genomes and downloaded other 36 cp genomes of the Prunus species from the National Center for Biotechnology Information (NCBI) database, representing almost all cherry species. Comprehensive analyses of the cp genome data of Prunus species were conducted to (1) explore sequence variations in the cp genomes, (2) reveal the phylogenetic relationships among cherry species, (3) estimate the divergence times of lineages within the subg. Cerasus, and (4) elucidate the geographic relationships among cherry species.

2. Results

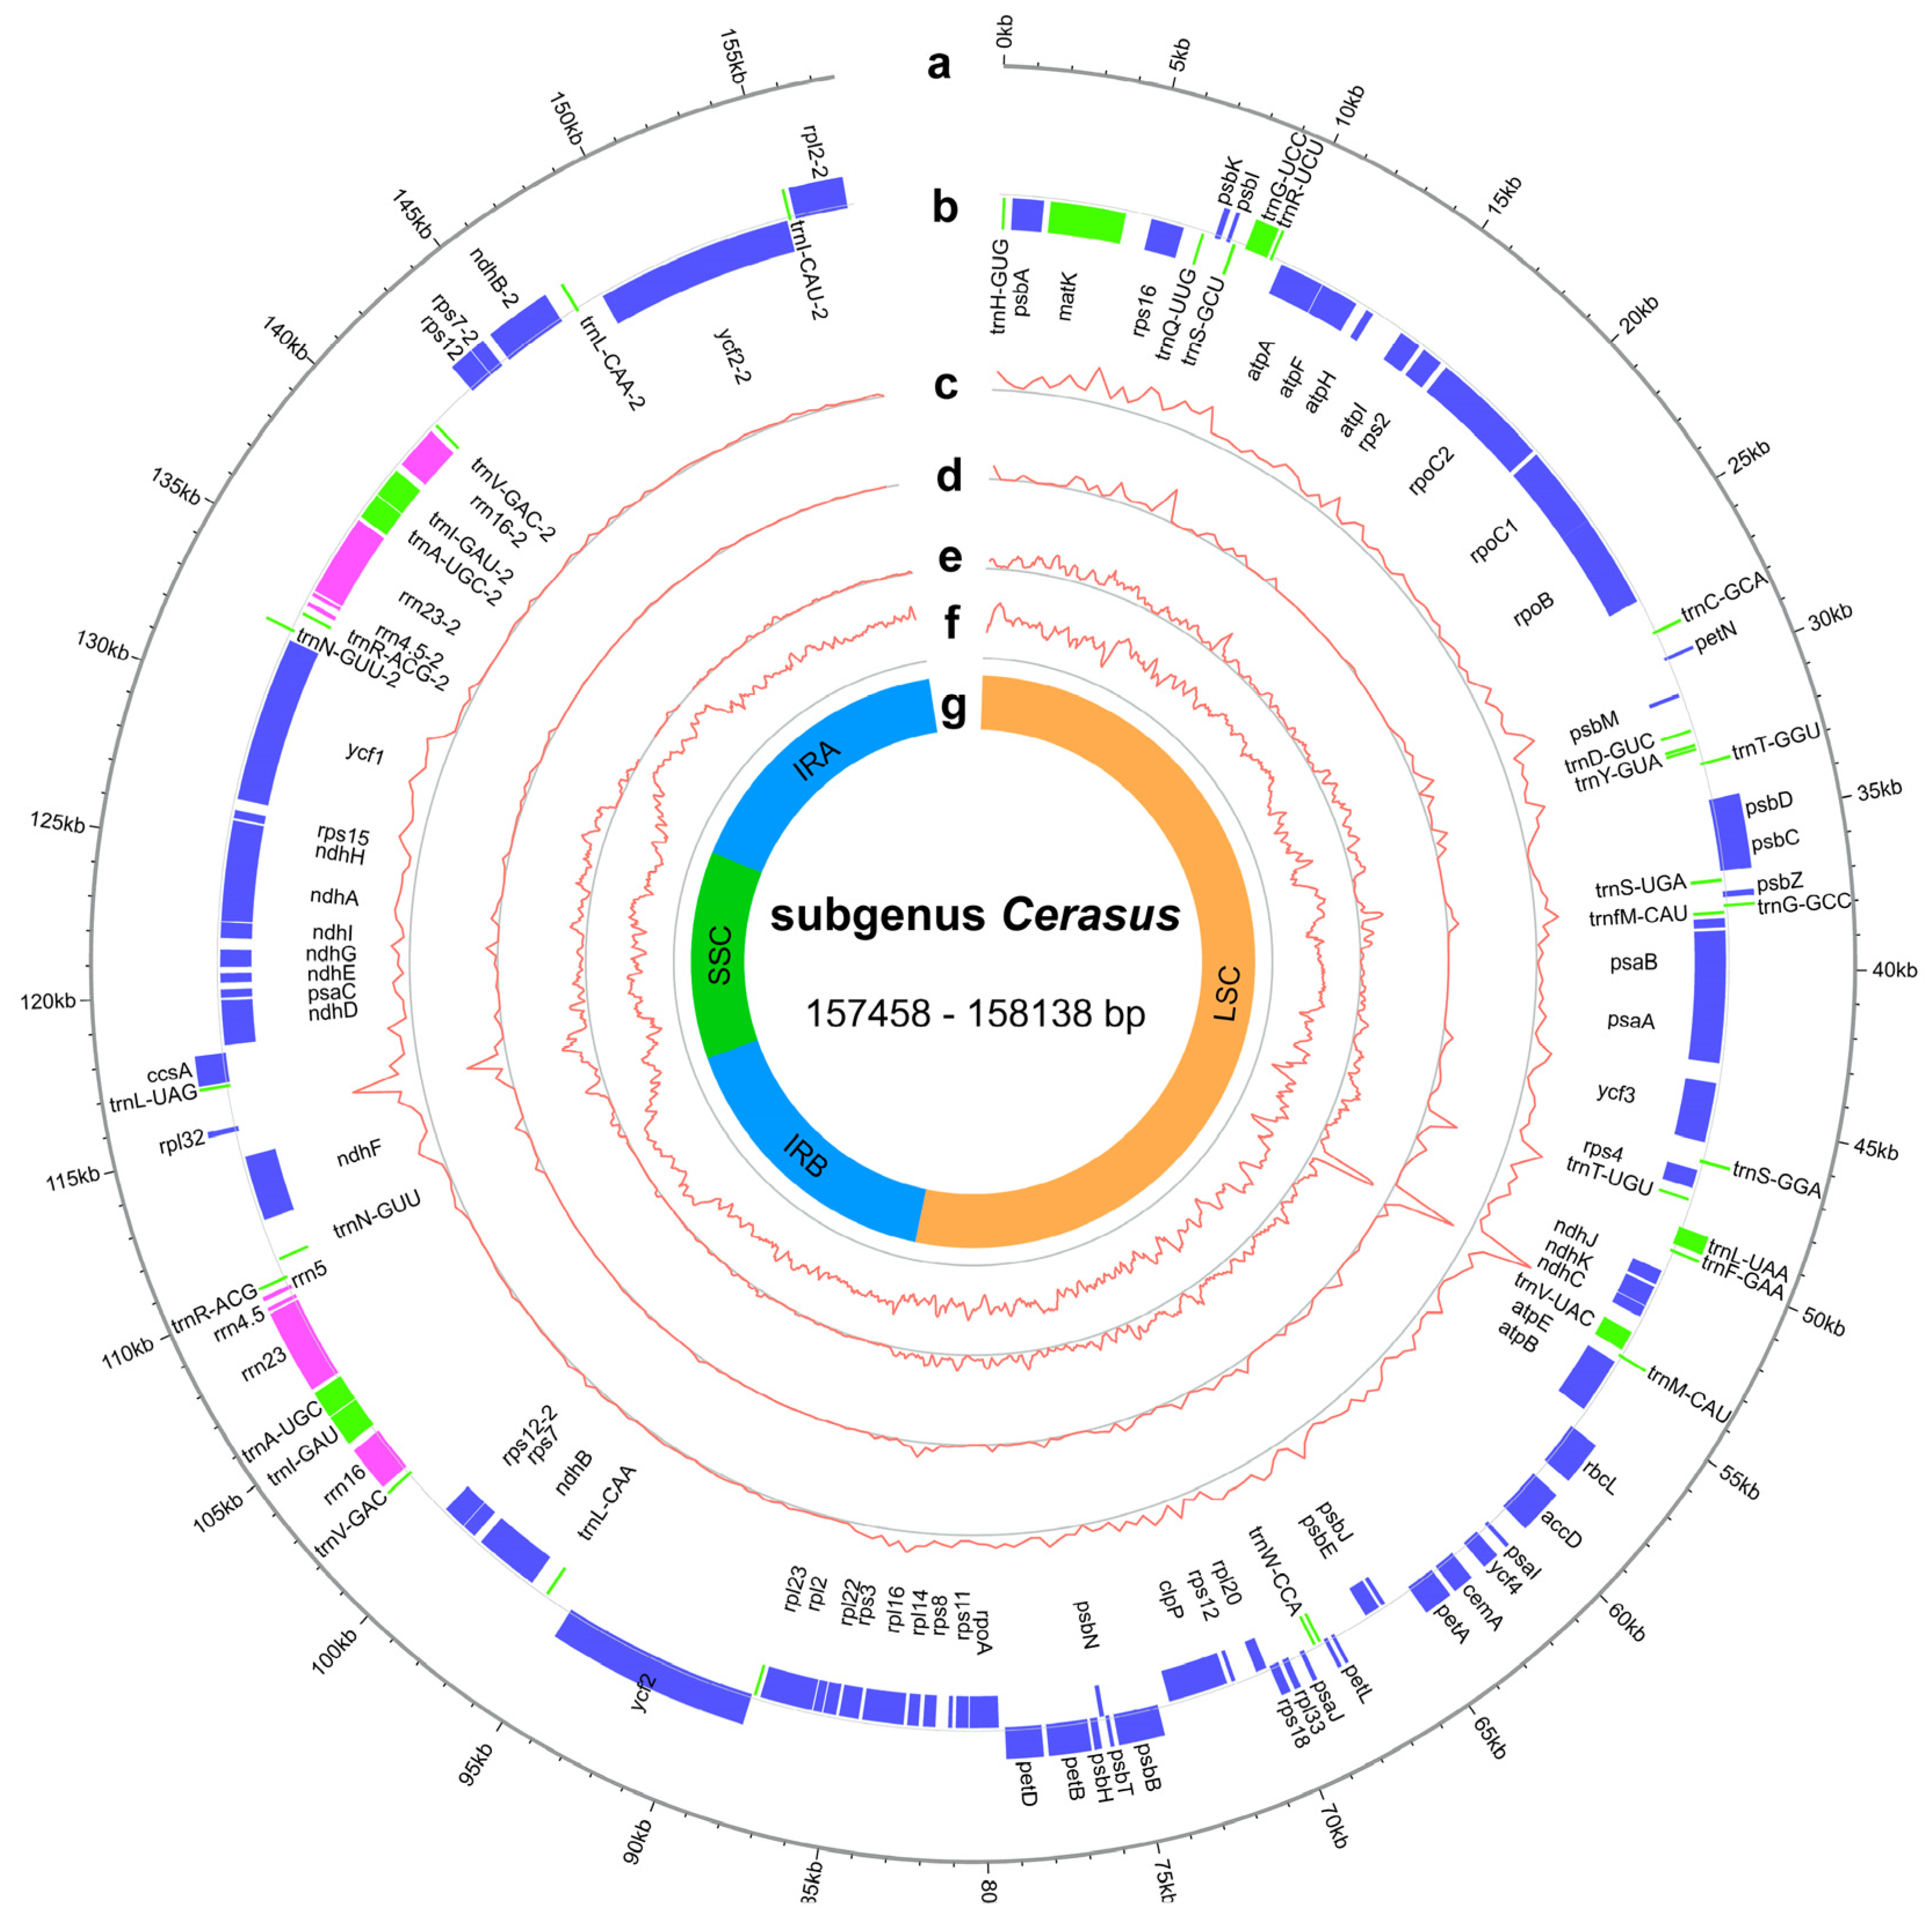
2.1. Chloroplast Genome Features

We sequenced and de novo assembled 54 cp genomes of Prunus species (Tables S1 and S2). Furthermore, we incorporated 36 additional cp genomes from the NCBI database, resulting in a total of 90 cp genomes (Table S1), representing 55 species of subg. Cerasus, thirteen species (nine species of subg. Prunus, three species of subg. Padus) of other subgenera, and two outgroups (one species of Malus and one species of Spiraea).
The cp genomes of subg. Cerasus exhibited a range of size variations, from 157,458 base pairs (bp) to 158,138 bp, with GC content ranging from 36.6% to 36.9% (Figure 1, Table S3). These genomes had a typical quadripartite structure consisting of a large single-copy (LSC, 85,567–86,261 bp) and a small single-copy (SSC, 19,046–19,253 bp) region that were separated by a pair of inverted repeats (Irs, 26,351–26,468 bp) (Table S3). The GC contents of the LSC, SSC, and IRs were 33.6–34.6%, 30.0–30.8%, and 42.5–42.6%, respectively (Table S3).
In the assembled accessions of subg. Cerasus, the synteny and gene number were found to be highly conserved. Gene annotation revealed a total of 129 genes in all assembled cp genomes, among which 95 genes were single-copy genes and 17 were multi-copy genes, including 84 protein-coding genes, 37 transfer ribonucleic acid (tRNA) genes, and 8 ribosomal ribonucleic (rRNA) genes (Table S4). Introns were found in 18 annotated genes in all species, with two introns for ycf3 and clpP and one intron for the other 16 genes (atpF, ndhA, ndhB, rpoC1, rps12, rps16, rpl2, rpl16, petB, petD, trnK-UUU, trnG-UCC, trnL-UAA, trnV-UAC, trnI-GAU, and trnA-UGC) (Table S4). Within the IR region, there were six protein-coding genes, four rRNA genes, and seven tRNA genes. The SSC region contained 12 protein-coding genes and 1 tRNA gene. The LSC region consisted of 82 genes (excluding rps12), including 60 protein-coding genes and 22 tRNA genes. Notably, rps12 had two introns, but with trans-splicing, where one of its exons was located in the LSC region and the other was duplicated by the IRs.

2.2. Chloroplast Microsatellite, InDel, SNP, and Genome Structure Variation

The simple sequence repeats (SSR or microsatellites) of the cp genome that display high variability in copy numbers serve as valuable markers for investigating phylogenetic relationships and the biogeography of related taxa. In this study, MISA analyses revealed 7593 microsatellite repeats in 87 Prunus plastid genomes (Table S5). The commonest motifs were mononucleotides (60.22~72.34%), followed by dinucleotides (14.44~23.68%), tetranucleotides (9.57~14.12%), hexanucleotides (0~3.61%), pentanucleotides (0~2.41%), and trinucleotides (0~2.22%). Dinucleotide SSRs contained 79 AG/CT and 1284 AT/AT. Interestingly, ACT/AGT-type trinucleotide SSRs were only present in the cp genomes of P. humilis, P. padus, and P. brachypoda, while ACAT/ATGT-type tetranucleotide SSRs and AAAAG/CTTTT-type pentanucleotide SSRs were only identified in the cp genomes of the subg. Padus (Table S5).
To investigate mutational hotspots in Prunus plastomes, we conducted an analysis of insertions/deletions (InDels) and single-nucleotide polymorphisms (SNPs) by mapping the 86 Prunus cp genomes to the reference genome of P. cerasoides (no. MF621234) (Tables S6 and S7). Our examination of the Prunus cp genomes revealed that InDels and SNPs were primarily distributed in the upstream and downstream regions of protein-coding genes (Tables S8 and S9). Overall, we identified a total of 2928 InDel loci and 5424 SNP loci, with effect numbers of 23,566 and 41,999, respectively (Tables S6 and S7). For InDel variants, the insertions exceeded the deletions by 662, with up to 16 allele types and 85 bp in length in one locus. Furthermore, the impact level with the highest count was the modifier, with 23,361 occurrences, accounting for approximately 99.13% of all impact levels (Table S8). Among the identified SNP loci, the most common nucleotide substitution across the taxonomic groups was the transition from G to A, whereas the transversion mutation from C to G was the rarest (Table S10). Remarkably, out of a total of 1924 SNPs, there were 883 non-synonymous SNPs, making up 45.89% of the total (Table S9). Among these non-synonymous SNPs, 878 were missense mutations, while five were nonsense mutations. Furthermore, when considering all cp genes, it was noteworthy that rps12 exhibited a notably higher frequency of SNPs, while ycf1 accumulated the highest number of mutations at the high and moderate levels (Tables S11 and S12).
To elucidate the contraction and expansion of the IR regions among subg. Cerasus species and other Prunus species, comparative analyses of the boundaries between the LSC region and the IR regions, as well as analyses of the boundaries between the IR regions and the SSC region, were performed and are illustrated in Figures S1 and S2. In comparison to other Prunus species, IR regions in the subg. Cerasus species exhibited varying degrees of contraction and expansion. For instance, rps19 had a segment located in the IRb region with a length ranging from 175 to 217 bp, while another segment was positioned in the LSC region, spanning from 62 to 104 bp. As a result, this gene was not completely duplicated, and the replicated lengths differed among different species. The ndhF gene commonly underwent variations at the boundary between the IRb and SSC regions. In species of the subg. Padus and subgenus Prunus, ndhF spanned both the SSC and IRb regions, with a portion of 4 to 20 bp located within the IRb region. However, in the subg. Cerasus species, ndhF was predominantly found within the SSC region, positioned 1 to 28 bp away from the IRb region. Except for P. mahaleb, P. setulosa, and P. tianshanica, where ycf1 was entirely located in the IRa regions, the ycf1 in other species spanned both the IRa and SSC regions, resulting in incomplete duplication and the formation of a pseudogene (Figure S1).
In order to explore potential DNA barcodes, we screened 75 cp genomes from 55 species of subg. Cerasus for hypervariable regions. By using multiple sequence alignment, we identified the following hypervariable regions: matK-rps16, petN-psbM, psbD, trnF-GAA-ndhJ, atpB-rbcL, psbE-petL, psbB, ndhE, ndhE-ndhG, trnN-GUU-trnR-ACG, and trnR-ACG-rrn5 (Figure S3). A total of 312 variable sites were identified in these 11 regions, and the nucleotide diversity per site (Pi) ranged from 0.0045 to 0.0058 (Figure S3). These results revealed the existence of mutations in the hypervariable regions of the consistently stable chloroplast genome, which could be potential candidates for developing DNA barcodes for molecular delimitation of subg. Cerasus.

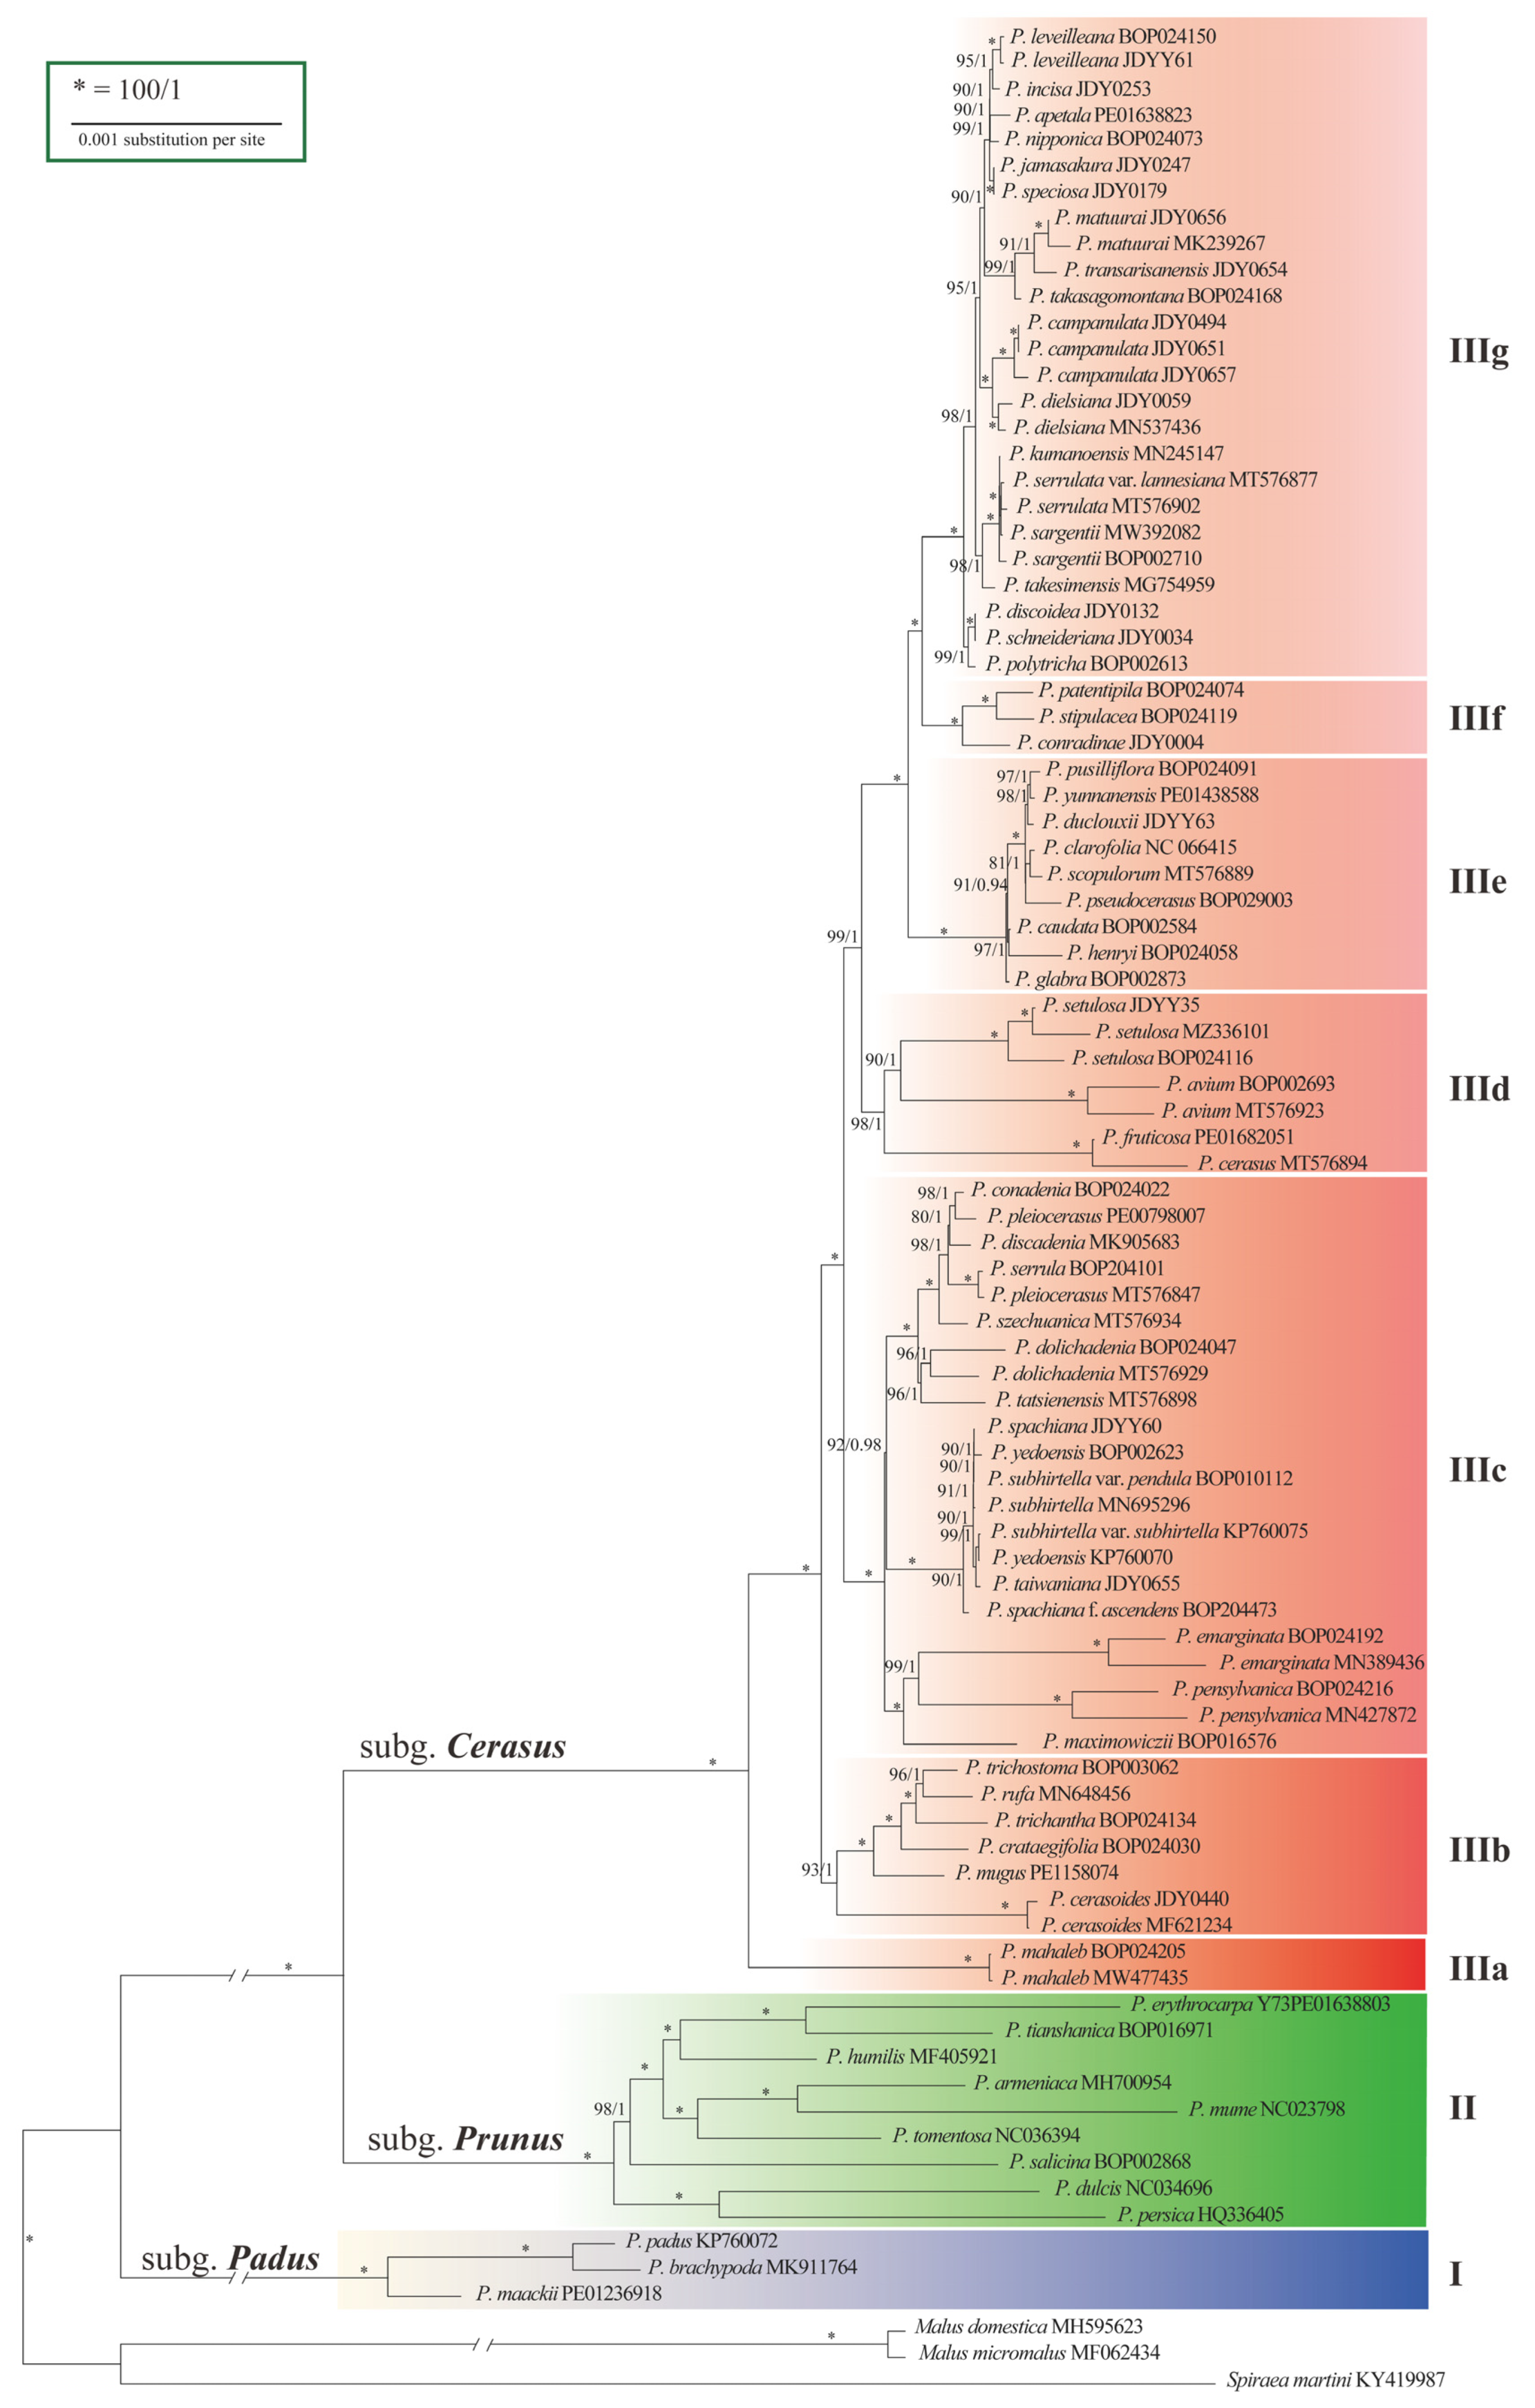
2.3. Phylogenetic Relationships among Lineages

The aligned dataset of 90 cp genomes contained 856 variable sites and 384 parsimony-informative sites (Figure S3, Table S13). Trees constructed using maximum-likelihood (ML) and Bayesian inference (BI) methods had identical topologies (Figure S4). The phylogeny revealed three strongly supported lineages (I, II, and III) (Figure 2), with confidence levels of 100% bootstrap support (BS) and 1.00 posterior probability (PP). Lineages I and II comprised species of subg. Padus and subg. Prunus, respectively, while Lineage III comprised species of subg. Cerasus, indicating monophyly of the subgenera. Lineage III had diverged into seven sublineages numbered from IIIa to IIIg according to the branch lengths and BS and PP values. Although structural analysis suggested three groups (K = 3) in subg. Cerasus (Figure S5, Table S14), the phylogenetic trees did not show remarkable differences between IIIb and IIIc-IIIg.
The basal sublineage IIIa was the SW Asian and European species P. mahaleb with corymbose–racemose inflorescences. Sublineage IIIb consisted of six species occurring in Southwest China (Figure 2). Sublineage IIIc consisted of species in the Far East, North America, and West China. There are three small groups of species in this sublineage: (1) the far eastern P. maximowiczii and its North American alliance; (2) Sino-Japan island element P. subhirtella and its variants; and (3) seven western China elements. Sublineage IIId included four Eurasian cherries, P. avium, P. cerasus, and P. fruticosa, and a species in western China, P. setulosa. Sublineage IIIe comprised taxa mostly occurring in southwestern and central China. Sublineage IIIf consisted of three species endemic to western, central and southwestern China. Sublineage IIIg is the largest group encompassed taxa distributed in eastern China (four species), Taiwan Island (three species), Japan (eight species) and the Korean Peninsula (three species).

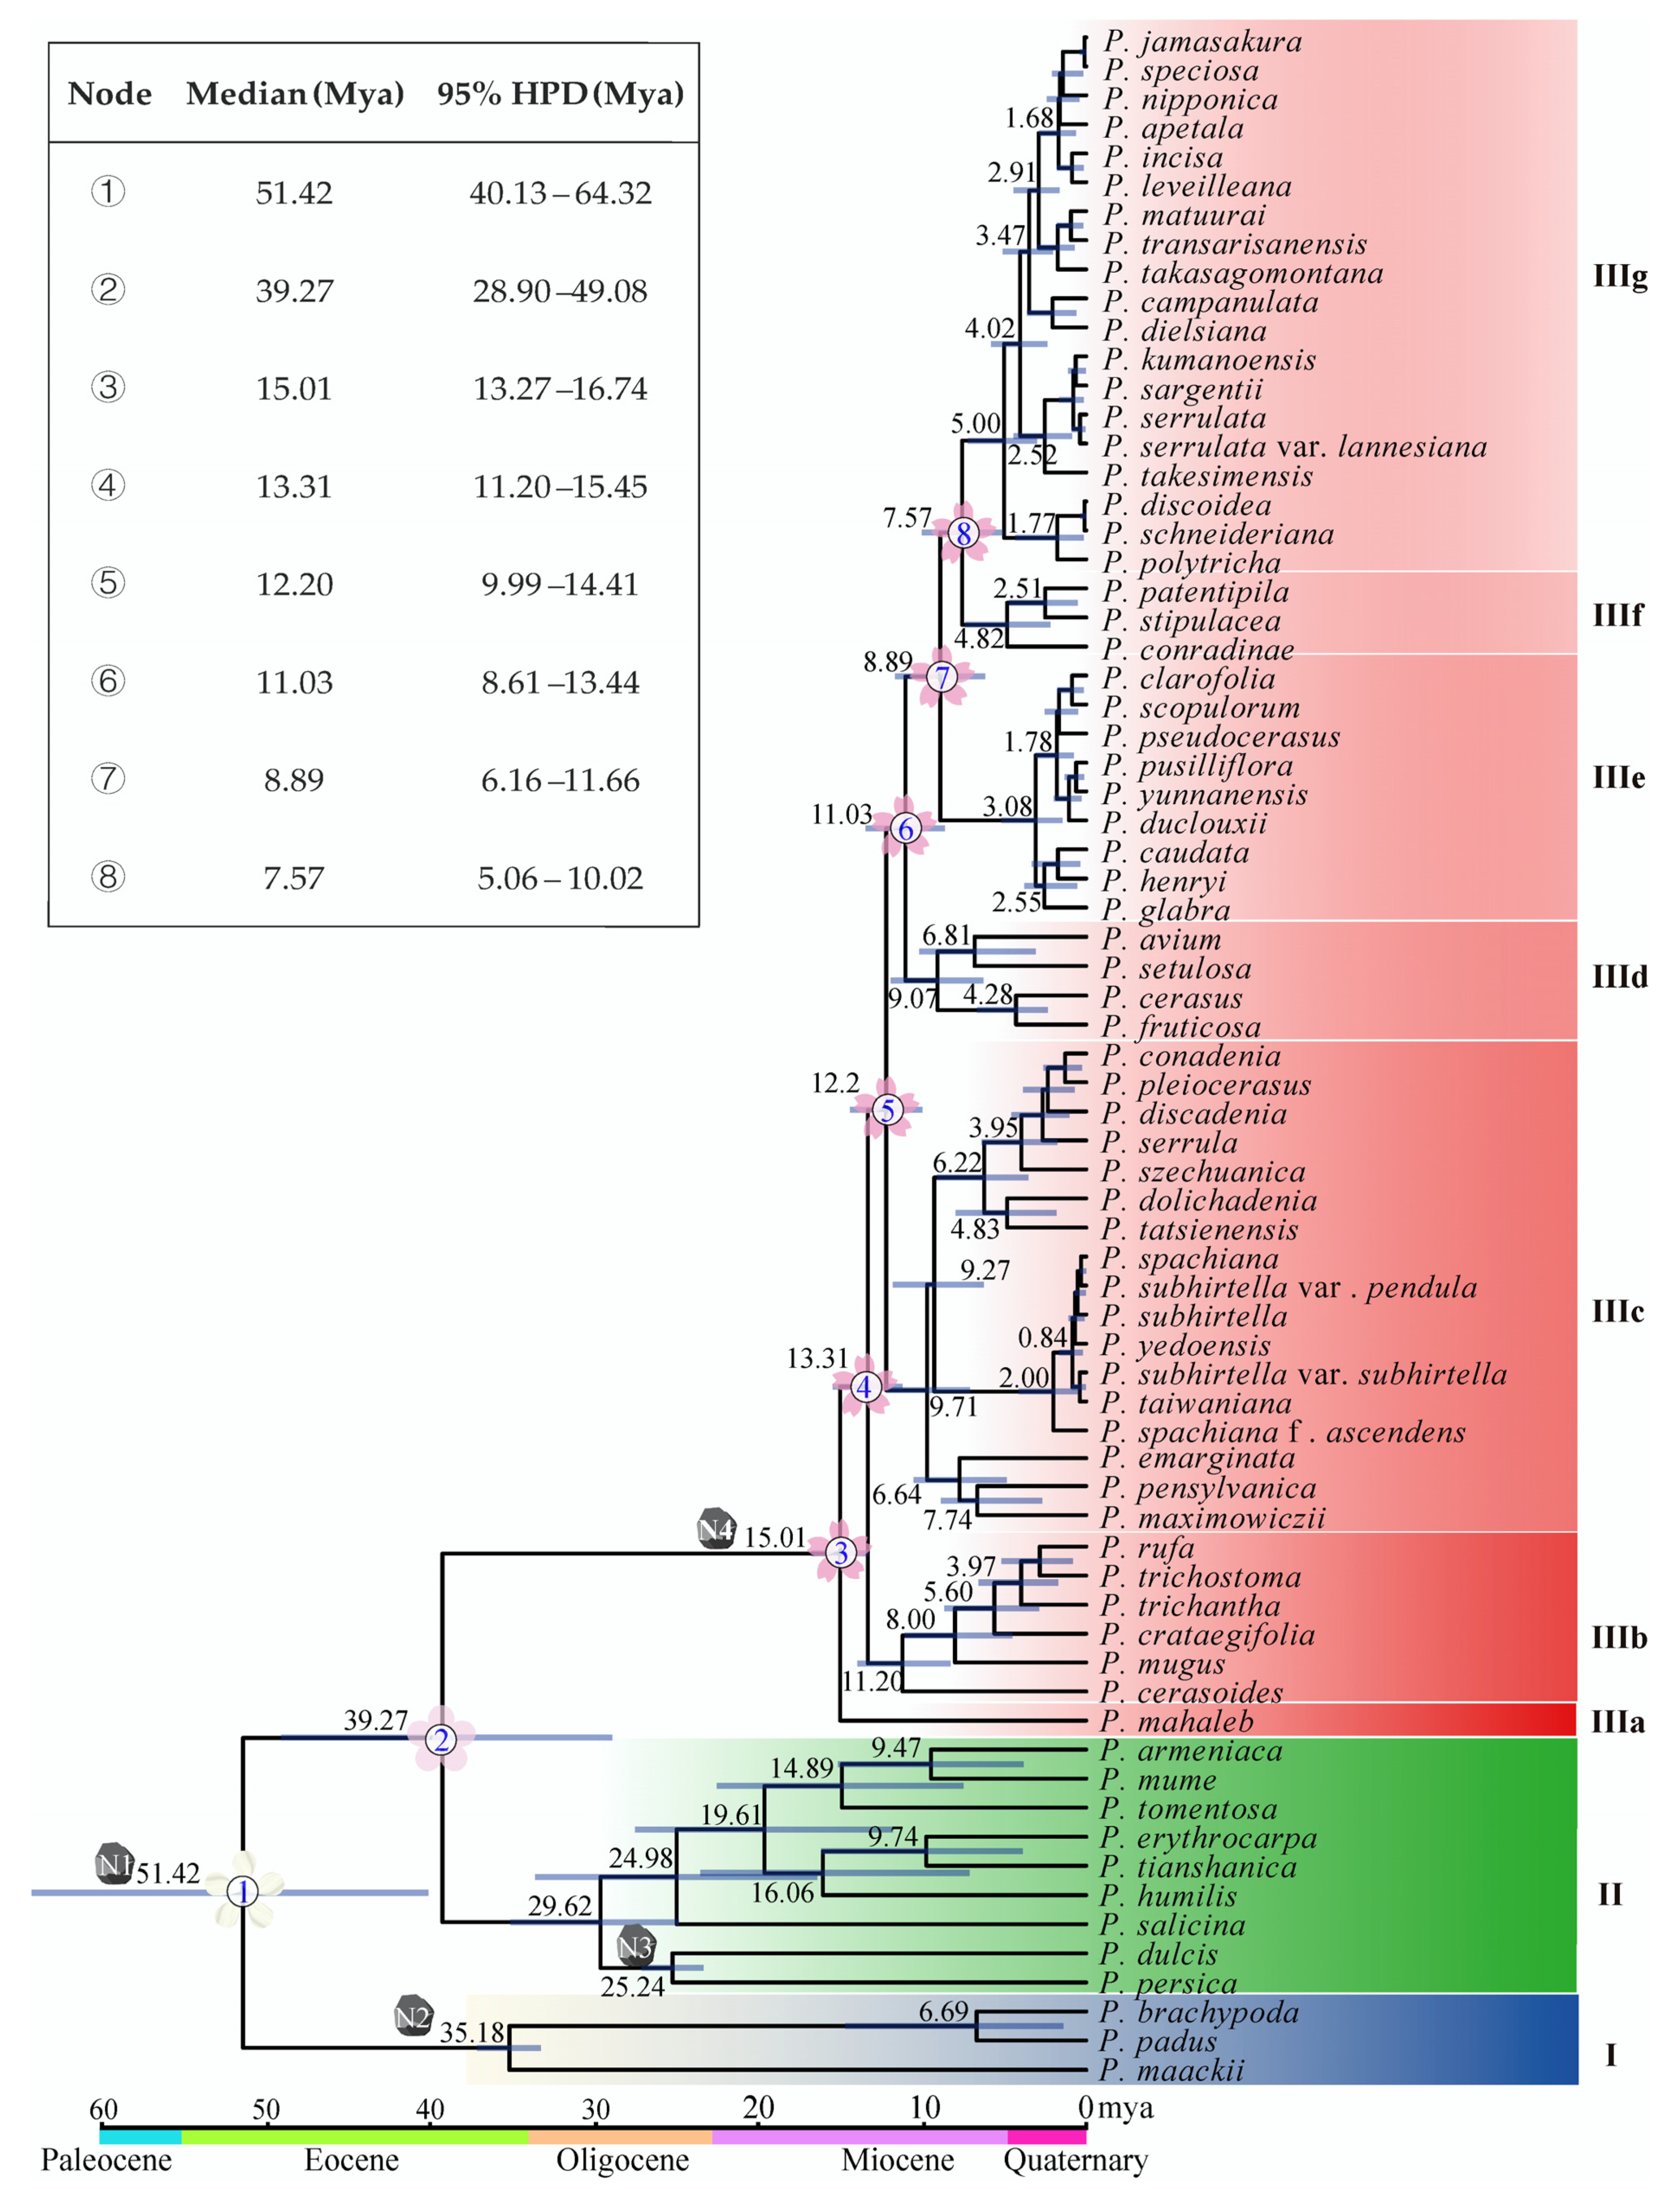
2.4. Divergence Time

The estimation of divergence times provided valuable insights into the evolutionary history of Prunus. Molecular dating in this study indicated that subg. Padus diverged from subg. Cerasus and subg. Prunus in the early Eocene approximately 51.42 million years ago (Mya), with a 95% highest posterior density (HPD) ranging from 40.13 to 64.32 Mya. The subg. Cerasus separated from subg. Prunus in the middle Eocene around 39.27 Mya (95% HPD: 28.90–49.08 Mya) (Figure 3). However, the species in subg. Cerasus are much younger. The first divergence event within subg. Cerasus happened in the middle Miocene about 15.01 Mya (95% HPD: 13.27–16.74 Mya) when P. mahaleb diverged from the common ancestor (Figure 3). Soon, the lineage IIIb diverged 13.31 Mya (95% HPD: 11.20–15.45 Mya) and so forth. Noteworthily, (1) the Far East/North America taxa diverged from their sister members 9.71 Mya (95% HPD: 7.10–12.18 Mya, IIIc); (2) the eastern Chinese–Japanese–Korean members (IIIg) diverged from their close relatives (IIIf) 7.57 Mya (95% HPD: 5.06–10.02 Mya) (Figure 3).

3. Discussion

The subg. Cerasus comprises a diverse array of plant species that hold significant value in terms of their ornamental and economic attributes. Despite their potential, the majority of cherry species remain in their wild state and have not been subjected to extensive exploitation and cultivation except in Japan [27]. In contrast to their cultivated counterparts, wild cherry species have undergone prolonged adaptation to the changing environmental conditions, equipping them with resilient mechanisms to sustain both biotic and abiotic stresses. The evolutionary journey has facilitated the accumulation of extensive genetic variations and the acquisition of valuable gene reservoirs within wild populations. These genetic resources assume a pivotal role in genetic-enhancement programs, enabling the targeted selection of desirable traits [28]. However, to ensure the effective preservation and utilization of germplasm resources, a fundamental prerequisite lies in unraveling the phylogenetic relationships that govern the intricate web of species within the subg. Cerasus. In this study, we conducted comprehensive phylogenetic analyses of the subg. Cerasus by integrating a dataset consisting of 54 newly assembled cp genomes of subg. Cerasus and its closely related taxa, along with 36 publicly accessible cp genomes, representing 45 species in mainland China, 5 species in island Taiwan, 11 species in Japan, 6 species in the Korean Peninsula, 6 species in Russia, 4 species in Europe, 4 species in South Asia, 3 species in West Asia, 2 species in Central Asia, and 2 species in North America [3,7,29,30,31,32,33]. This dataset encompassed nearly all known species within subg. Cerasus, providing a robust foundation for our investigation.

3.1. Phylogenetic Relationship within Subg. Cerasus

In our phylogenetic trees, the subgenus Cerasus was composed of seven distinct subclades, referred to as subclades IIIa to IIIg for the first time. The basal position of the subclade IIIa with a single species, P. mahaleb, is consistent with previous studies [12,14,15,16] and supports the notion that in Prunus raceme is a plesiomorphic trait [5,18]. P. mahaleb bridges the gap between the basal subg. Padus with raceme and subg. Cerasus mostly with cymose. The second breakthrough is the determination of the earliest divergence of six Himalayan cherry species (IIIb). The Himalayans are the cradle and divergence center of cherry species. The third one is that the phylogenetic relationship between two North American species, P. pensylvanica and P. emarginata, and the Eurasian cherry species has been resolved. The North Asian P. maximowiczii is more closely related to the North American P. pensylvanica and P. emarginata, suggesting links among North American, North Asian, and Himalayan cherry species in IIIc.
In previous classification studies, the central Asian and European P. fruticosa, P. Cerasus, and P. avium were considered closely related and placed in sect. Cerasus [8,34,35], with P. cerasus being a hybrid between P. fruticosa and P. avium [36]. Their close genetic relationships were confirmed in this study and formed a clade together with P. setulosa (IIId). Although the Chinese P. setulosa and the European P. avium share a common ancestor, they have diverged for a long time, judging from long stem branch lengths. Clade IIIe and clade IIIf consist of species endemic to China.
Clade IIIg comprises species predominantly occurring in eastern China, Taiwan Island, Japan, and the Korean Peninsula. Previous studies have suggested morphological similarities among P. serrulataerrulate, P. jamasakura, and P. leveilleana, leading to their classification as the P. serrulataerrulate complex [11]. However, this study did not indicate a close phylogenetic relationship among them. Instead, P. serrulata, P. sargentii, P. takesimensis, P. kumanoensis, and P. serrulata var. lannesiana formed a clade, while P. jamasakura and P. leveilleana exhibited a closer phylogenetic relationship with P. apetala, P. incisa, P. nipponica, and P. speciosa. Notably, P. takesimensis, which was found on Ulleung Island in the Korean Peninsula, shares morphological similarities with P. sargentii, suggesting that P. sargentii may serve as the continental progenitor of P. takesimensis [37]. However, our results indicated that P. takesimensis had significantly diverged from P. sargentii and P. serrulata var. lannesiana. According to the flora of Japan, P. serrulata var. lannesiana is a cultivated variety, possibly derived from P. speciosa, P. jamasakura, and P. sargentii [38]. Our phylogenetic tree suggested that P. serrulataampanula var. lannesiana is indeed closely related to P. sargentii. Furthermore, three species in Taiwan Island, namely P. takasagomontana, P. transarisanensis, and P. matuurai, formed a clade, indicating their close phylogenetic relationship and distinctness from other sympatric cherry species with (P. campanulata and P. dielsiana). The species endemic to Japan, P. speciosa, P. jamasakura, P. nipponica, P. apetala, P. incisa, and P. leveilleana, are natural except P. jamasakura, which is very similar to P. serrulata var. lannesiana morphologically. Therefore, the systematic position of both P. serrulata and P. jamasakura remains to be determined.

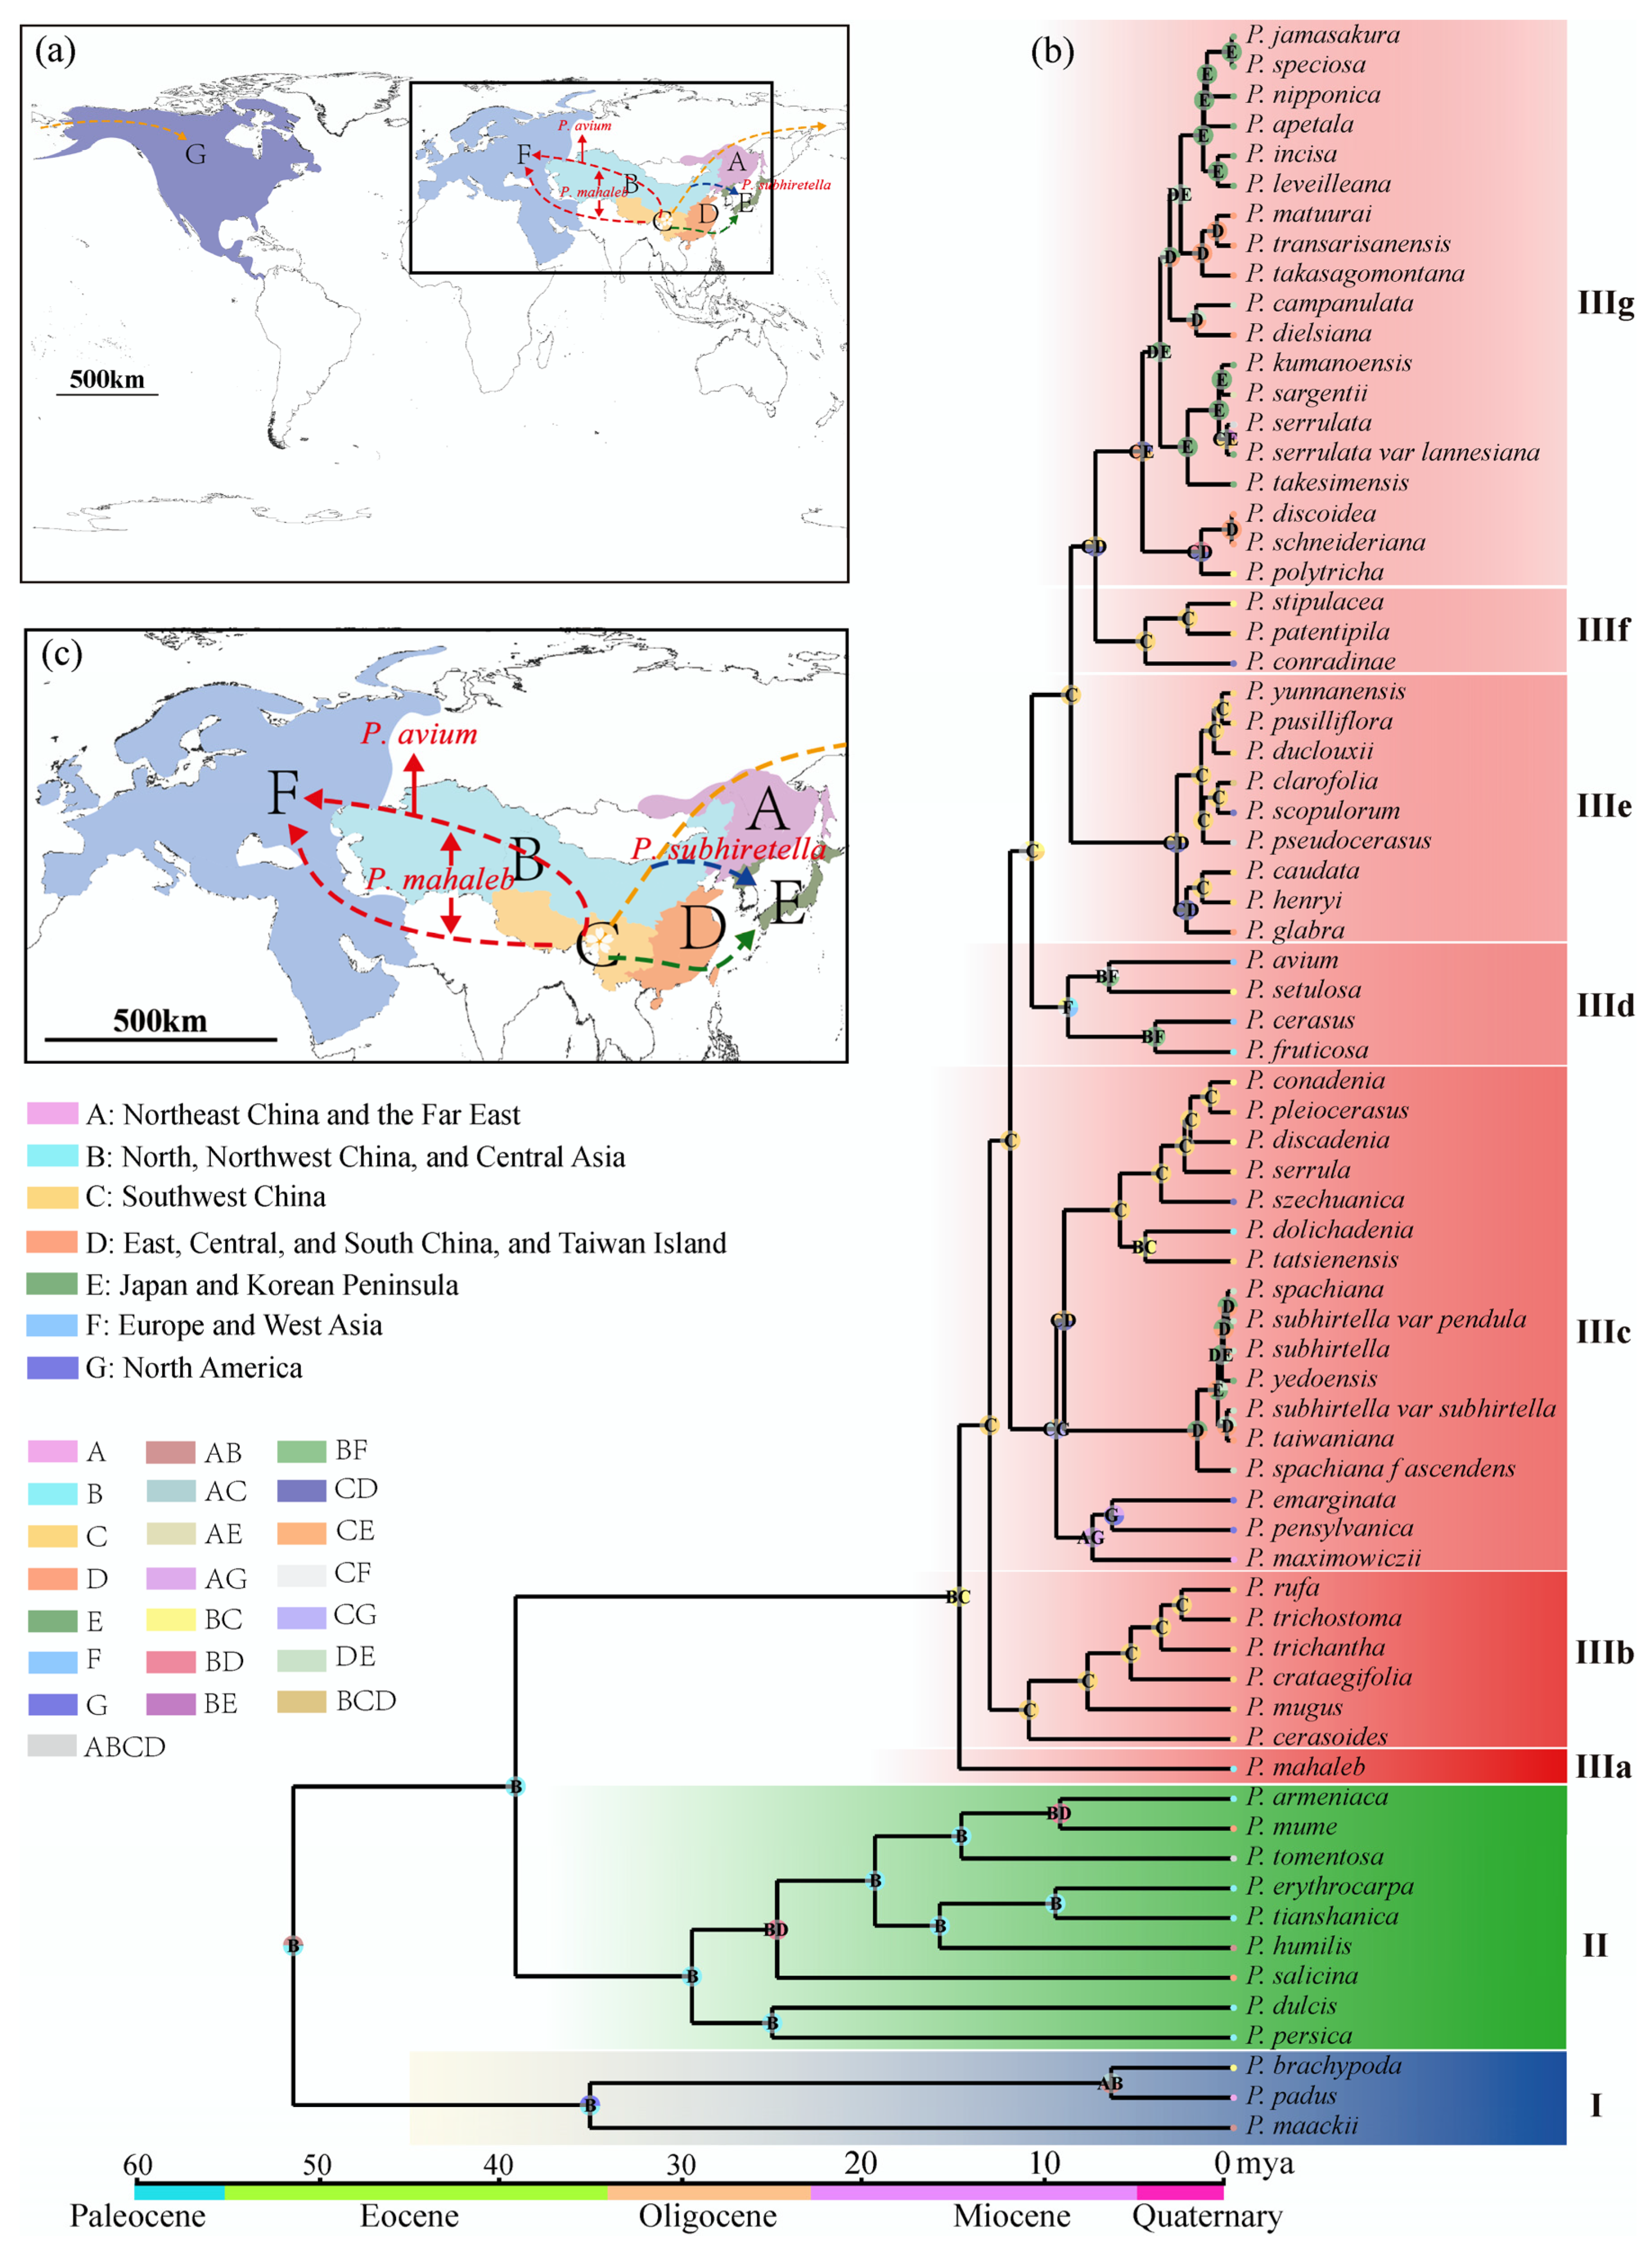
3.2. Origin and Dispersal of Subg. Cerasus Species

The genus Prunus comprises three subgenera: subg. Padus, subg. Cerasus, and subg. Prunus. Based on the morphological characteristics of their inflorescences, these subgenera correspond to racemose, corymbose, and solitary inflorescences, respectively. According to Chin et al., the subgenera have diverged for 54 to 56 Mya [15]. The divergence time of subg. Padus is roughly confirmed in this study at 51.42 Mya. Around 51–53 Mya, during the Early Eocene, there was a period of sustained warm climate known as the early Eocene climatic optimum [39]. This warm climate may have facilitated the early differentiation of the genus Prunus. However, subg. Cerasus and subg. Prunus were estimated to be much younger in this study, about 39.27 Mya than the estimate by Chin et al., but much older than the estimate by Zhang et al. [14]. It has been suggested that the Eocene–Oligocene transition (EOT) around 30–40 Mya marked a period of global cooling that resulted in significant flora turnovers [40,41,42].
Although subg. Cerasus started diverging from subg. Prunus around 39.27 Mya, no species has survived today until 15.01 Mya. Now, cherries are common trees in the Northern Hemisphere (Figure 4a). Based on the Bayes–DIVA analysis, the ancestral distribution areas were western China and Central Asia (Figure 4b), especially the Himalayan region [15,28]. Ancestral cherries took several routes to conquer the Northern Hemisphere (Figure 4c) besides the in situ diversifications in the Himalayan area. The first one was taken by the relic P. mahaleb from the refuge in the mid-Miocene climatic optimum (MMCO, 15–17 Mya) through Central Asia and western Asia into Europe. It was suggested that plants in the Himalayan region spread from East Asia to Europe during the Oligocene, with the Qinghai–Tibet Plateau (QTP) and the lowlands of the Himalayas serving as corridors. However, the rise of the QTP during the Miocene led to the disappearance of this migration route [43]. The pathway through Central Asia to Europe was facilitated by the closure of the Turgai Strait in the Middle Eocene (∼29 Mya), allowing East Asian plants to enter Europe via Central Asia. Furthermore, under the warm and humid climate during the MMCO and the enhanced Asian summer monsoon [44], the ancestor of the subg. Cerasus migrated from high-altitude regions in the west to temperate deciduous forests and warm-temperate evergreen forests in the eastern altitudinal zone. The first differentiation occurred around 15 Mya and coincided with the rapid uplift of the QTP and the onset of global cooling and aridification [39,45,46], indicating significant geological and climatic changes during this period that drove subsequent diversifications of cherry species.
In situ diversifications are well exemplified by the species in IIIb. The species in this clade is mainly distributed in the southern and southeastern parts of the QTP, specifically the Himalayans and the Hengduan Mountains (HHM) (Figure 4b). Their differentiation times ranged from 11.2 Mya to 2.83 Mya, indicating constant speciation in this area before the onset of the Quaternary glaciation. The disjunct biogeographical relationships between East Asia and North America are exemplified by species in IIIc. The species in this clade had diverged into three groups about 9.71–9.27 Mya (Figure 4b,c). The first group migrated southeastward to central to western China and underwent in situ diversification, forming seven species. The second group migrated into the Korean Peninsula, Japan, and Taiwan Island, substantially remaining one or two species. And the third group migrated to Northeast China, the Far East of Russia, and North America through the Bering Land Bridge and diverged into three species, with one (P. maximowiczii) in Northeast China and the Far East of Russia and two (P. emarginata and P. pensylvanica) in North America. The time for cherries to reach Eastern North America is quite similar to that for other species [23,47].
The floristic relationships between Asian and European cherries are represented by species in clade IIId besides the relic species P. mahaleb. This is a small clade with three species (excluding hybrid P. cerasus), including one species (P. setulosa) in China and two species (P. avium and P. fruticosa) from Central Asia to Europe. They have diverged for 6.81–9.07 Mya (Figure 4b). Similarly to IIIc, P. setulosa migrated southeastward into northwestern China, and P. avium and P. fruticosa migrated westward from Asia to Europe (Figure 4c). Unlike American cherries, which diverged into two species after reaching North America, the two central Asian and European cherries diverged in Asia and then migrated to Europe instead. The Chinese P. setulosa and the central and European P. avium are sibling species. Prunus fruticosa diverged earlier.
Western China was the mainstage of cherry speciation after the uplift of QTP. However, with the intensification of the East Asian monsoon at 3.6 Mya, central and eastern China became the mainstages of species formation. The most typical example is the species on the second gradient terrains of China (IIIe and IIIf). In IIIe, their ancestor diverged 8.89 Mya, but species burst happened after 3.08 Mya. The intensified East Asian monsoon at 3.6 Mya may have promoted their differentiation [48,49], especially for cherries in eastern China, Taiwan Island, Japan, and the Korean Peninsula (IIIg). Undoubtedly, cherry species in Taiwan Island, Japan, and the Korean Peninsula in this clade were from China (Figure 4c). Although it was believed that the Japanese archipelago began to be separated from the Eurasian continent around 24 Mya, the two regions had repeated connections through land bridges, including the East China Sea Land Bridge, the Korea Strait Land Bridge, and the Taiwan Land Bridge, since the middle Miocene, owing to sea-level fluctuations caused by climate changes [50,51,52]. According to the divergence times of species groups in IIIg, their ancestors had already reached Taiwan Island, Japan, and the Korean Peninsula before the Pleistocene. The rising sea levels caused the previously connected populations to become isolated, which has been an important driving force for population differentiation and speciation [24,52,53].
According to the differentiation times shown in Figure 4b, 59.3% of the species and varieties in the subg. Cerasus originated from climate-driven vicariance during the Pleistocene and were mainly distributed in the Sino-Japan forest subkingdom. This indicates that the climatic changes during the Quaternary had a substantial impact on the speciation of the cherry species in this region. In contrast, species that originated before the Pleistocene were mostly distributed in the Sino-Himalayan forest subkingdom, suggesting that the uplift of the QTP and the associated geological and climatic changes were important drivers for the speciation of the cherry plants in this region.

3.3. Taxonomic Implications

The modern taxonomic subdivision of a taxon is evidence-based, especially on phylogenetic relationships. Even so, the grouping of clades into formal taxonomic rank is actually optional to taxonomists. The phylogeny of subg. Cerasus (Figure 2) provides a backbone for sectional subdivision, and the division of clades is believed to be helpful to determine sections. For example, IIIa matches sect. Mahaleb (Koehne) Yu et Li, IIId matches sect. Cerasus, and IIIe roughly matches sect. Lobopetalum (Koehne) Yu et Li [1]. The seven-clade subdivision does not completely fit the existing taxonomic sections but agrees with geographical distribution patterns. It is probably because the phylogeny was based on maternally transmitting cp genomes.
About half of cherry species have evolutionary histories of a few million years. Such species are too young to build strict reproductive isolation mechanisms. Therefore, interspecific hybridization happens occasionally where they meet. According to the biological concept of species, they are semispecies, formerly known as subspecies. However, such instances are very common in East Asian flora, and most of them were treated as distinct species. In subg. Cerasus, there are some typical examples. The species P. itosakura, P. pendula, P. spachiana f. ascendens, P. subhirtella, and P. taiwaniana in IIIc are closely related and are better treated as one species. Some Japanese cherries in IIIg are vicarious species. Similarly, the species status of cherries in IIIe is open to question.
It seems premature to make a formal taxonomic revision of subg. Cerasus either at the sectional or at species ranks before a reliable phylogeny based on nuclear genomes (or genes) is available. Given this, we intend to employ nuclear genome sequences for identifying potential hybridization events among subg. Cerasus taxa. On this basis, we aim to construct a more detailed backbone phylogeny of subg. Cerasus through comparison with the outcomes of this study in future research.

4. Materials and Methods

4.1. Plant Material and Taxon Sampling

A total of 90 cp genomes were included in our study, representing all three subgenera of Prunus sensu lato [16] and three outgroup species (Malus domestica, M. micromalus, Spiraea martini), among which 54 genomes were determined in this study and 36 genomes were downloaded from the NCBI database. The 87 ingroup represented 55 species of subg. Cerasus (75 cp genomes), 9 species from subg. Prunus, and three 3 from subg. Padus. The samples used in this study for cp genome sequencing were collected from the field (47 samples) or obtained from DNA Bank of China (7 samples).

4.2. DNA Extraction and Sequencing

Total genomic DNA was extracted from the silica-gel-dried leaf materials using a modified cetyltrimethylammonium bromide (mCTAB) protocol [54] and purified using the Wizard DNA Clean-Up System (A7280, Promega Corporation, Madison, WI, USA). DNA concentration was assessed using the Qubit 2.0 Fluorometer (Thermo Fisher Scientific, Waltham, MA, USA). Agarose gel electrophoresis was employed to quantitatively determine the lengths of DNA fragments. The genomic DNA was used to construct a short-insert (<800 bp) paired-end sequencing library. Paired-end sequencing was performed on the HiSeq X Ten analyzer (Illumina, San Diego, CA, USA) at Novogene Co., Ltd. (Tianjin, China). The sequencing process yielded a large volume of data for most samples: approximately 10 gigabases (Gb) of 150 bp paired-end reads each sample.

4.3. Chloroplast Genome Assembly and Annotation

Each raw data set was cleaned and filtered with Trimmomatic v0.39 [55]. Clean reads were assembled de novo into contigs with SPAdes v3.9 [56]. The cp genome contigs were screened in Blastn v2.8.10 [57] using the close-related and published species of P. cerasoides (no. MF621234) [58] as a reference. The extracted contigs were preliminary assembled with Sequencher v5.4.5, and the gaps between contigs were filled with clean reads. The cp genomes were further assembled and checked by mapping against the original reads. Subsequently, manual curation and validation were performed to ensure the precision and fidelity of the assembled cp genome using Geneious R10.2.3 [59]. The cp genome annotation and correction were conducted using Plann v1.1.2 and Sequin [60]. The genome map was drawn using Circos v0.69-9 [61].

4.4. Chloroplast Genome Alignment and Polymorphism Assessment

The whole-genome dataset was divided into a series of datasets using Geneious R10.2.3—including the protein-coding gene dataset, intergenic region dataset, LSC region dataset, SSC region dataset, and IR region dataset—for variation analyses. Each dataset was aligned with MAFFT v7.408 [62] and adjusted manually with Se-Al v2.0 a11 [63] if necessary. The complete cp genomes of Prunus were compared using mVISTA software with the Shuffle-LAGAN mode (https://genome.lbl.gov/vista/mvista/submit.shtml (accessed on 15 March 2023)) [64] against the reference P. cerasoides (no. MF621234). Comparative analysis of genes near boundaries of LSC/IRb/SSC/IRa regions in cp genomes was executed using the IRscope software (https://irscope.shinyapps.io/irapp (accessed on 26 March 2023)) [65].
A total of 84 protein-coding genes were extracted from the cp genome of the subg. Cerasus dataset. Additionally, 78 unique protein-coding genes were used for subsequent variation analyses after removing duplicate sequences. We employed DnaSP v6.12.03 [66] and MEGA v7.0.26 [67] to analyze the nucleotide polymorphisms of different datasets.

4.5. Genomic Variation Analyses

We aligned Prunus cp genome sequences to P. cerasoides (no. MF621234) using nucmer (parameters: -mum-g 1000-c 90-| 40-t 20) in the MUMmer v4.0.0 [68]. The alignment table was filtered with delta-filter (parameters: −1-i 90-| 40). The filtered alignments were then transformed into a readable format using show-coords (parameters: -THrd). Using show-coords outputs, we identified SNPs and InDels using SyRi v1.6.3 with default parameters except –no-chrmatch [69]. Independent SNP and InDel files obtained from different individuals were transformed and merged into a unified variant call format (vcf) file using BCFTools v1.9 [70]. To assess the distribution patterns and potential effects of SNPs and InDels across the cp genomes, we utilized BEDTools v2.27.0 [71] and SnpEff v4.2 [72].
Simple sequence repeats (SSRs) in each cp genome were screened using MISA software (https://webblast.ipk-gatersleben.de/misa (accessed on 5 April 2023)) [73] with the following parameters: at least 10 repeat units for mononucleotides, 5 repeat units for dinucleotides, 4 repeat units for trinucleotides, and 3 repeat units for tetra-, penta-, and hexanucleotides. In addition, the maximal number of interrupting bases between two SSRs in a compound microsatellite was 100 bases.
In order to quantify selective pressure, we utilized EasyCodeML v1.0 [74] to compare the rates of non-synonymous (dN) and synonymous (dS) substitutions. This analysis allowed us to assess the impact of selective pressures on the genes of interest. We calculated the ratios (ω) of dN/dS, where ω = 1, ω > 1, and 0 < ω < 1 represented neutral, positive, and purifying selection, respectively. We used the species phylogenetic tree obtained via reconstruction as the input tree file and conducted a site model to detect selection (Table S15).

4.6. Phylogenetic Analyses

To ensure the accuracy of subsequent phylogenetic analyses, we assessed the nucleotide substitution saturation of the whole-genome dataset using DAMBE v7.3.2 [75] and the phylogenetic signal using IQ-TREE v1.6.12 [76]. We selected the best-fit models using ModelFinder for each phylogenetic analysis based on the Bayesian information criterion (BIC) [77]. We utilized ML methods to generate phylogenetic trees for the whole-genome dataset using the IQ-TREE plugin in PhyloSuite v1.2.3 with 10,000 regular bootstrap replicates [78]. BI analyses were performed with MrBayes [79] on XSEDE v3.2.6 in CIPRES Science Gateway V 3.3 [80], based on the best-fit model GTR + F + I + G4, Nst = 6, rates = invgamma, using a Markov chain Monte Carlo (MCMC) algorithm with 1,000,000,000 generations and sampling every 10,000 generations. PP was calculated from the majority consensus of all the sampled trees when the standard deviation of the split frequencies permanently fell below 0.01, and the first 25% of trees sampled during the burn-in phase were discarded.
The genetic structure was estimated using Structure v2.3.4 [81,82], with the pre-defined genetic clusters (K) ranging from 2 to 7; the analysis was repeated 10 times. The optimal number of K was determined based on the ΔK value calculated using Evanno’s method [83].

4.7. Divergence Time Estimation and Ancestral Geographic Distribution Inference

We employed BEAST v1.8.0 [84] to estimate the divergence times of Prunus using the Prunus cp genome dataset. Four calibration priors from the Paleobiology database (http://paleobiodb.org accessed on 10 April 2023) were utilized in this study (Table S16): (1) a fossilized P. wutuensis endocarp discovered in Shandong province, China, was used to calibrate the divergence of the most recent common ancestor of the subg. Cerasus, subg. Prunus, and subg. Padus, with a mean of 55 Mya [85]; (2) a P. triloba fossil was used to calibrate the divergence of the sect. Amygdalus within the subg. Prunus (offset = 25.72 Mya) [86]; (3) a P. hirsutipetala fossil was used to calibrate the divergence of the subg. Padus and subg. Cerasus, at approximately 33.90–37.20 Mya in the Late Eocene [87]; and (4) a P. mahaleb fossil was used as an indirect calibration point [88,89]. We ran analyses with a GTR + Gamma + Invariant Sites model, relaxed clock lognormal to account for rate variation among lineages, Yule tree speciation models, and six independent runs with the MCMC method, each with 300,000,000 generations and sampling every 1000 generations. The adequacy of the parameters was assessed using Tracer v1.7.2 [90] to evaluate convergence and ensure a satisfactory effective sample size (ESS) exceeding 200. Tree files and log files from the six independent runs were combined with LogCombiner after discarding the first 20% of trees as burn-in. A maximum clade credibility tree was generated using TreeAnnotator.
Based on the documented information regarding the native distribution ranges of species within the subg. Cerasus, subg. Prunus, and subg. Padus, along with specimen and sampling data, the distribution area of the subg. Cerasus was divided into seven regions, including Region A: Northeast China and the Far East; Region B: North, Northwest China, and Central Asia; Region C: Southwest China; Region D: East, Central, and South China, and Taiwan Island; Region E: Japan and Korean Peninsula; Region F: Europe and West Asia; and Region G: North America. The ancestral geographic distribution reconstruction was conducted using the S-DIVA (Statistical Dispersal-Vicariance Analysis) method in RASP v4.2 software [91], with the same strategy and data matrix as the divergence time estimation.

Supplementary Materials

The supporting information can be downloaded at https://www.mdpi.com/article/10.3390/ijms242115612/s1.

Author Contributions

Conceptualization, D.J. and S.Z.; methodology, X.S. and D.J.; software, D.J. and W.Z.; validation, F.Z. and X.L.; formal analysis, X.S., Q.Z. and Y.L.; investigation, Q.Z. and F.Z.; resources, D.J. and X.L.; data curation, X.S.; writing—original draft preparation, X.S. and D.J.; writing—review and editing, X.S. and S.Z.; visualization, W.Z. and D.J.; supervision, Y.L. and X.L.; project administration, D.J.; funding acquisition, X.S. and D.J. All authors have read and agreed to the published version of the manuscript.

Funding

This research was funded by the National Natural Science Foundation of China, grant number 32101585. The research was supported by the Zhejiang Science and Technology Major Program on Agricultural New Variety Breeding, grant number 2021C02071-4. The Cooperative Program of Zhejiang Province and CAF on Forestry Science and Technology, grant number 2021SY10.

Institutional Review Board Statement

Not applicable.

Informed Consent Statement

Not applicable.

Data Availability Statement

The data presented in this study are available under Genbank accession OR687382-OR687433, ON186529, and ON186527 at NCBI database.

Acknowledgments

We thank members of National Innovation Alliance of Flowering Cherry Industry for their support and help in this study. We also thank Yanlei Liu at Hebei University of Engineering for his assistance with the software.

Conflicts of Interest

The authors declare no conflict of interest.

References

  1. Yu, D.; Li, C.-L. Flora Reipublicae Popularis Sinicae; Science Press: Beijing, China, 1986; Volume 38, pp. 41–87. [Google Scholar]
  2. Rehder, A. Manual of Cultivated Trees and Shrubs Hardy in North America: Exclusive of the Subtropical and Warmer Temperate Regions, 2nd ed.; Macmillan: New York, NY, USA, 1940; pp. 466–477. [Google Scholar]
  3. Kawasaki, T. The distribution of Prunus subgenus Cerasus in East-Asia and classification of Japanese wild species. Sakura Sci. 1991, 1, 28–45. [Google Scholar]
  4. Hodel, G.J.R.; Zimmer, E.; Wen, J. A phylogenomic approach resolves the backbone of Prunus (Rosaceae) and identifies signals of hybridization and allopolyploidy. Mol. Phylogenetics Evol. 2021, 160, 107–118. [Google Scholar] [CrossRef]
  5. Su, N.; Hodel, R.G.J.; Wang, X.; Wang, J.-R.; Xie, S.-Y.; Gui, C.-X.; Zhang, L.; Chang, Z.-Y.; Zhao, L.; Potter, D.; et al. Molecular phylogeny and inflorescence evolution of Prunus (Rosaceae) based on RAD-Seq and genome skimming analyses. Plant Divers. 2023, 45, 397–408. [Google Scholar] [CrossRef]
  6. Yan, J.; Li, J.; Yu, L.; Bai, W.; Nie, D.; Xiong, Y.; Wu, S. Comparative chloroplast genomes of Prunus subgenus Cerasus (Rosaceae): Insights into sequence variations and phylogenetic relationships. Tree Genet. Genomes 2021, 17, 50. [Google Scholar] [CrossRef]
  7. Li, C.; Bartholomew, B. Flora of China: Cerasus Miller; Science Press: Beijing, China, 2003; Volume 9, pp. 404–420. [Google Scholar]
  8. Koehne, E. Neue chinesische arten und formen von Prunus. Feddes Repert. 1912, 11, 264–267. [Google Scholar] [CrossRef]
  9. Jiang, D.; Shen, X.; Chen, Y.; Zou, Y.; Wu, F.; Li, Y.; Liu, X. Morphological variation analysis of leaf and branch traits of wild Cerasus spp. in Zhejiang. J. Zhejiang Agric. For. Univ. 2019, 36, 723–732. [Google Scholar]
  10. Khadivi, A.; Mohammadi, M.; Asgari, K. Morphological and pomological characterizations of sweet cherry (Prunus avium L.), sour cherry (Prunus cerasus L.) and duke cherry (Prunus × gondouinii Rehd.) to choose the promising selections. Sci. Hortic. 2019, 257, 108719. [Google Scholar] [CrossRef]
  11. Chang, K.; Chang, C.; Park, T.Y.; Roh, M.S. Reconsideration of the Prunus serrulata complex (Rosaceae) and related taxa in Eastern Asia. Bot. J. Linn. Soc. 2007, 154, 35–54. [Google Scholar] [CrossRef]
  12. Wan, T.; Qiao, B.; Zhou, J.; Shao, K.; Pan, L.; An, F.; He, X.; Liu, T.; Li, P.; Cai, Y. Evolutionary and phylogenetic analyses of 11 Cerasus species based on the complete chloroplast genome. Front. Plant Sci. 2023, 14, 1070600. [Google Scholar] [CrossRef]
  13. Li, M.; Song, Y.-F.; Sylvester, S.P.; Sylvester, S.P.; Wang, X.-R. Comparative analysis of the complete plastid genomes in Prunus subgenus Cerasus (Rosaceae): Molecular structures and phylogenetic relationships. PLoS ONE 2022, 17, e0266535. [Google Scholar] [CrossRef]
  14. Zhang, J.; Wang, Y.; Chen, T.; Chen, Q.; Wang, L.; Liu, Z.; Wang, H.; Xie, R.; He, W.; Li, M.; et al. Evolution of Rosaceae plastomes highlights unique Cerasus diversification and independent origins of fruiting cherry. Front. Plant Sci. 2021, 12, 736053. [Google Scholar] [CrossRef]
  15. Chin, S.-W.; Shaw, J.; Haberle, R.; Wen, J.; Potter, D. Diversification of almonds, peaches, plums and cherries—Molecular systematics and biogeographic history of Prunus (Rosaceae). Mol. Phylogenet. Evol. 2014, 76, 34–48. [Google Scholar] [CrossRef]
  16. Shi, S.; Li, J.; Sun, J.; Yu, J.; Zhou, S. Phylogeny and classification of Prunus sensu lato (Rosaceae). J. Integr. Plant Biol. 2013, 55, 1069–1079. [Google Scholar] [CrossRef]
  17. Wen, J.; Berggren, S.T.; Lee, C.-H.; Ickert-Bond, S.; Yi, T.-S.; Yoo, K.-O.; Xie, L.; Shaw, J.; Potter, D. Phylogenetic inferences in Prunus (Rosaceae) using chloroplast ndhF and nuclear ribosomal ITS sequences. J. Syst. Evol. 2008, 46, 322. [Google Scholar] [CrossRef]
  18. Bortiri, E.; Heuvel, B.V.; Potter, D. Phylogenetic analysis of morphology in Prunus reveals extensive homoplasy. Plant Syst. Evol. 2006, 259, 53–71. [Google Scholar] [CrossRef]
  19. Kato, S.; Matsumoto, A.; Yoshimura, K.; Katsuki, T.; Iwamoto, K.; Kawahara, T.; Mukai, Y.; Tsuda, Y.; Ishio, S.; Nakamura, K.; et al. Origins of Japanese flowering cherry (Prunus subgenus Cerasus) cultivars revealed using nuclear SSR markers. Tree Genet. Genomes 2014, 10, 477–487. [Google Scholar] [CrossRef]
  20. Ohta, S.; Yamamoto, T.; Nishitani, C.; Katsuki, T.; Iketani, H.; Omura, M. Phylogenetic relationships among Japanese flowering cherries (Prunus subgenus Cerasus) based on nucleotide sequences of chloroplast DNA. Plant Syst. Evol. 2007, 263, 209–225. [Google Scholar] [CrossRef]
  21. Zhu, H.; Yi, X.-G.; Li, Y.-F.; Zhu, S.-X.; Li, M.; Duan, Y.-F.; Wang, X.-R. Phylogeography and population genetic structure of flowering cherry species Cerasus dielsiana in subtropical China. Syst. Biodivers. 2019, 17, 622–633. [Google Scholar] [CrossRef]
  22. Cho, M.-S.; Kim, C.-S.; Kim, S.-H.; Kim, T.O.; Heo, K.-I.; Jun, J.; Kim, S.-C. Molecular and morphological data reveal hybrid origin of wild Prunus yedoensis (Rosaceae) from Jeju island, Korea: Implications for the origin of the flowering cherry. Am. J. Bot. 2014, 101, 1976–1986. [Google Scholar] [CrossRef]
  23. Donoghue, M.J.; Smith, S.A. Patterns in the assembly of temperate forests around the Northern hemisphere. Phil. Trans. R. Soc. Lond. B 2004, 359, 1633–1644. [Google Scholar] [CrossRef]
  24. Qiu, Y.-X.; Fu, C.-X.; Comes, H.P. Plant molecular phylogeography in China and adjacent regions: Tracing the genetic imprints of Quaternary climate and environmental change in the world’s most diverse temperate flora. Mol. Phylogenet. Evol. 2011, 59, 225–244. [Google Scholar] [CrossRef]
  25. Qian, H.; Ricklefs, R.E. Large-Scale processes and the Asian bias in species diversity of temperate plants. Nature 2000, 407, 180–182. [Google Scholar] [CrossRef]
  26. Favre, A.; Päckert, M.; Pauls, S.U.; Jähnig, S.C.; Uhl, D.; Michalak, I.; Muellner-Riehl, A.N. The role of the uplift of the Qinghai-Tibetan plateau for the evolution of Tibetan biotas. Biol. Rev. 2015, 90, 236–253. [Google Scholar] [CrossRef]
  27. Jiang, D.; Li, X.; Li, Y.; Zhou, S.; Zhou, Q.; Liu, X.; Shen, X. Chromosome-Level Assembly of Flowering Cherry (Prunus campanulata) Provides Insight into Anthocyanin Accumulation. Genes 2023, 14, 389. [Google Scholar] [CrossRef]
  28. Das, B.; Ahmed, N.; Singh, P. Prunus diversity- early and present development: A review. Int. J. Biodvers. Conserv. 2011, 3, 721–734. [Google Scholar] [CrossRef]
  29. Bufford, D.; Hsieh, C.; Huang, T. Flora of Taiwan; Epoch Pub. Co.: Taipei, Taiwan, 1993. [Google Scholar]
  30. Lee, Y.N. New Flora of Korea; Kyo-Hak Publ.: Seoul, Republic of Korea, 2006; ISBN 89-09-11802-4. [Google Scholar]
  31. Moore, D.M. Flora Europaea Check-List and Chromosome Index; Cambridge University Press: Cambridge, UK, 1982; Volume 1, ISBN 0-521-23759-9. [Google Scholar]
  32. Rechinger, K.H. Flora Iranica; Graz: Vienna, Austria, 1963; Volume 150, pp. 148–149. [Google Scholar]
  33. Burrows, G.E.; Tyrl, R.J. Toxic Plants of North America; John Wiley & Sons: Hoboken, NJ, USA, 2013; ISBN 0-8138-2034-0. [Google Scholar]
  34. Rehder, A. Manual of Cultivated Trees and Shrubs; Macmillan: New York, NY, USA, 1949; p. 996. [Google Scholar]
  35. Schneider, C.K. Illustriertes Handbuch Der Laubholzkunde; Verlag von Gustav Fischer: Jena, Germany, 1912; pp. 589–590. [Google Scholar]
  36. Brettin, T.; Karle, R.; Crowe, E.; Lezzoni, A. Chloroplast inheritance and DNA variation in sweet, sour, and ground cherry. J. Hered. 2000, 91, 75–79. [Google Scholar] [CrossRef]
  37. Cho, M.-S.; Yang, J.Y.; Kim, S.-C. Complete chloroplast genome of Ulleung island endemic flowering cherry, Prunus takesimensis (Rosaceae), in Korea. Mitochondrial DNA Part B 2018, 3, 274–275. [Google Scholar] [CrossRef]
  38. Ohba, H.; Iwatsuki, K.; Boufford, D.E. Genus Cerasus; Kodasha: Tokyo, Japan, 2001; pp. 128–144. [Google Scholar]
  39. Zachos, J.; Pagani, M.; Sloan, L.; Thomas, E.; Billups, K. Trends, rhythms, and aberrations in global climate 65 Ma to present. Science 2001, 292, 686–693. [Google Scholar] [CrossRef]
  40. Deng, W.; Su, T.; Wappler, T.; Liu, J.; Li, S.; Huang, J.; Tang, H.; Low, S.L.; Wang, T.; Xu, H.; et al. Sharp changes in plant diversity and plant-herbivore interactions during the Eocene–Oligocene transition on the southeastern Qinghai-Tibetan plateau. Glob. Planet. Chang. 2020, 194, 103293. [Google Scholar] [CrossRef]
  41. Prothero, D.R. The late Eocene-Oligocene extinctions. Annu. Rev. Earth Planet. Sci. 1994, 22, 145–165. [Google Scholar] [CrossRef]
  42. Sun, J.; Ni, X.; Bi, S.; Wu, W.; Ye, J.; Meng, J.; Windley, B.F. Synchronous turnover of flora, fauna and climate at the Eocene–Oligocene boundary in Asia. Sci. Rep. 2014, 4, 7463. [Google Scholar] [CrossRef]
  43. Jiang, X.; Hipp, A.L.; Deng, M.; Su, T.; Zhou, Z.; Yan, M. East Asian origins of European holly oaks (Quercus section Ilex Loudon) via the Tibet-Himalaya. J. Biogeogr. 2019, 46, 2203–2214. [Google Scholar] [CrossRef]
  44. Sun, X.; Wang, P. How old is the Asian monsoon system?—Palaeobotanical records from China. Palaeogeogr. Palaeoclimatol. Palaeoecol. 2005, 222, 181–222. [Google Scholar] [CrossRef]
  45. Lewis, A.R.; Marchant, D.R.; Ashworth, A.C.; Hemming, S.R.; Machlus, M.L. Major middle Miocene global climate change: Evidence from East Antarctica and the Transantarctic Mountains. GSA Bull. 2007, 119, 1449–1461. [Google Scholar] [CrossRef]
  46. Spicer, R.A.; Harris, N.B.W.; Widdowson, M.; Herman, A.B.; Guo, S.; Valdes, P.J.; Wolfe, J.A.; Kelley, S.P. Constant elevation of Southern Tibet over the past 15 million years. Nature 2003, 421, 622–624. [Google Scholar] [CrossRef]
  47. Wen, J.; Ickert-Bond, S.; Nie, Z.-L.; Li, R. Timing and modes of evolution of Eastern Asian-North American biogeographic disjunctions in seed plants. In Darwin’s Heritage Today: Proceedings of the Darwin 200 Beijing International Conference; High Education Press: Beijing, China, 2010; pp. 252–269. [Google Scholar]
  48. Lu, H.; Guo, Z. Evolution of the monsoon and dry climate in East Asia during Late Cenozoic: A review. Sci. China Earth Sci. 2014, 57, 70–79. [Google Scholar] [CrossRef]
  49. Zheng, H.; Powell, C.M.; Rea, D.K.; Wang, J.; Wang, P. Late Miocene and Mid-Pliocene Enhancement of the East Asian monsoon as viewed from the land and sea. Glob. Planet. Chang. 2004, 41, 147–155. [Google Scholar] [CrossRef]
  50. Kimura, M. Paleogeography of the Ryukyu Islands. Tropics 2000, 10, 5–24. [Google Scholar] [CrossRef]
  51. Lambeck, K.; Chappell, J. Sea level change through the last glacial cycle. Science 2001, 292, 679–686. [Google Scholar] [CrossRef]
  52. Chou, Y.-W.; Thomas, P.I.; Ge, X.-J.; LePage, B.A.; Wang, C.-N. Refugia and phylogeography of Taiwania in East Asia. J. Biogeogr. 2011, 38, 1992–2005. [Google Scholar] [CrossRef]
  53. Keally, C.T. Japanese Pleistocene Landbridges and the Earliest Watercraft. Japanese Archaeology. [Homepage on the Internet] Tama Cable Network, Tokyo, Japan. [Cited 21 July 2010]. 2005. Available online: http://www.tnet.ne.jp/~keally/MiddlePalaeol/landbridges.html (accessed on 8 May 2023).
  54. Li, J.; Wang, S.; Yu, J.; Wang, L.; Zhou, S. A modified CTAB protocol for plant DNA extraction. Chin. Bull. Bot. 2013, 48, 72. [Google Scholar] [CrossRef]
  55. Bolger, A.M.; Lohse, M.; Usadel, B. Trimmomatic: A flexible trimmer for illumina sequence data. Bioinformatics 2014, 30, 2114–2120. [Google Scholar] [CrossRef]
  56. Bankevich, A.; Nurk, S.; Antipov, D.; Gurevich, A.A.; Dvorkin, M.; Kulikov, A.S.; Lesin, V.M.; Nikolenko, S.I.; Pham, S.; Prjibelski, A.D.; et al. SPAdes: A new genome assembly algorithm and its applications to single-cell sequencing. J. Comput. Biol. 2012, 19, 455–477. [Google Scholar] [CrossRef] [PubMed]
  57. Altschul, S.F.; Gish, W.; Miller, W.; Myers, E.W.; Lipman, D.J. Basic local alignment search tool. J. Mol. Biol. 1990, 215, 403–410. [Google Scholar] [CrossRef]
  58. Xu, X.; Wen, J.; Wang, W.; Zheng, W. The complete chloroplast genome of the threatened Prunus cerasoides, a rare winter blooming cherry in the Himalayan region. Conserv. Genet. Resour. 2018, 10, 499–502. [Google Scholar] [CrossRef]
  59. Kearse, M.; Moir, R.; Wilson, A.; Stones-Havas, S.; Cheung, M.; Sturrock, S.; Buxton, S.; Cooper, A.; Markowitz, S.; Duran, C.; et al. Geneious basic: An integrated and extendable desktop software platform for the organization and analysis of sequence data. Bioinformatics 2012, 28, 1647–1649. [Google Scholar] [CrossRef]
  60. Huang, D.I.; Cronk, Q.C.B. Plann: A command-line application for annotating plastome sequences. Appl. Plant Sci. 2015, 3, 1500026. [Google Scholar] [CrossRef]
  61. Krzywinski, M.; Schein, J.; Birol, İ.; Connors, J.; Gascoyne, R.; Horsman, D.; Jones, S.J.; Marra, M.A. Circos: An Information Aesthetic for Comparative Genomics. Genome Res. 2009, 19, 1639–1645. [Google Scholar] [CrossRef]
  62. Katoh, K.; Standley, D.M. Mafft multiple sequence alignment software version 7: Improvements in performance and usability. Mol. Biol. Evol. 2013, 30, 772–780. [Google Scholar] [CrossRef]
  63. Rambaut, A. Se-Al: Sequence Alignment Editor, Version 2.0 A11. 2007. Available online: http://tree.bio.ed.ac.uk/software/seal/ (accessed on 1 March 2023).
  64. Frazer, K.A.; Pachter, L.; Poliakov, A.; Rubin, E.M.; Dubchak, I. VISTA: Computational tools for comparative genomics. Nucleic Acids Res. 2004, 32, W273–W279. [Google Scholar] [CrossRef]
  65. Amiryousefi, A.; Hyvönen, J.; Poczai, P. IRscope: An online program to visualize the junction sites of chloroplast genomes. Bioinformatics 2018, 34, 3030–3031. [Google Scholar] [CrossRef]
  66. Librado, P.; Rozas, J. DnaSP v5: A software for comprehensive analysis of DNA polymorphism data. Bioinformatics 2009, 25, 1451–1452. [Google Scholar] [CrossRef]
  67. Kumar, S.; Stecher, G.; Tamura, K. MEGA7: Molecular evolutionary genetics analysis version 7.0 for bigger datasets. Mol. Biol. Evol. 2016, 33, 1870–1874. [Google Scholar] [CrossRef] [PubMed]
  68. Marçais, G.; Delcher, A.L.; Phillippy, A.M.; Coston, R.; Salzberg, S.L.; Zimin, A. MUMmer4: A fast and versatile genome alignment system. PLoS Comput. Biol. 2018, 14, e1005944. [Google Scholar] [CrossRef] [PubMed]
  69. Goel, M.; Sun, H.; Jiao, W.; Schneeberger, K. SyRI: Finding Genomic Rearrangements and Local Sequence Differences from Whole-Genome Assemblies. Genome Biol. 2019, 20, 1–13. [Google Scholar] [CrossRef]
  70. Danecek, P.; Bonfield, J.K.; Liddle, J.; Marshall, J.; Ohan, V.; Pollard, M.O.; Whitwham, A.; Keane, T.; McCarthy, S.A.; Davies, R.M.; et al. Twelve years of SAMtools and BCFtools. GigaScience 2021, 10, giab008. [Google Scholar] [CrossRef]
  71. Quinlan, A.R.; Hall, I.M. BEDTools: A flexible suite of utilities for comparing genomic features. Bioinformatics 2010, 26, 841–842. [Google Scholar] [CrossRef]
  72. Cingolani, P.; Platts, A.; Wang, L.L.; Coon, M.; Nguyen, T.; Wang, L.; Land, S.J.; Lu, X.; Ruden, D.M. A program for annotating and predicting the effects of single nucleotide polymorphisms, snpeff. Fly 2012, 6, 80–92. [Google Scholar] [CrossRef]
  73. Thiel, T.; Michalek, W.; Varshney, R.; Graner, A. Exploiting EST databases for the development and characterization of gene-derived SSR-markers in Barley (Hordeum vulgare L.). Theor. Appl. Genet. 2003, 106, 411–422. [Google Scholar] [CrossRef] [PubMed]
  74. Gao, F.; Chen, C.; Arab, D.A.; Du, Z.; He, Y.; Ho, S.Y.W. EasyCodeML: A visual tool for analysis of selection using CodeML. Ecol. Evol. 2019, 9, 3891–3898. [Google Scholar] [CrossRef]
  75. Xia, X. DAMBE7: New and improved tools for data analysis in molecular biology and evolution. Mol. Biol. Evol. 2018, 35, 1550–1552. [Google Scholar] [CrossRef]
  76. Nguyen, L.-T.; Schmidt, H.A.; von Haeseler, A.; Minh, B.Q. IQ-TREE: A fast and effective stochastic algorithm for estimating maximum-likelihood phylogenies. Mol. Biol. Evol. 2015, 32, 268–274. [Google Scholar] [CrossRef]
  77. Kalyaanamoorthy, S.; Minh, B.Q.; Wong, T.K.F.; von Haeseler, A.; Jermiin, L.S. ModelFinder: Fast model selection for accurate phylogenetic estimates. Nat. Methods 2017, 14, 587–589. [Google Scholar] [CrossRef]
  78. Zhang, D.; Gao, F.; Jakovlić, I.; Zou, H.; Zhang, J.; Li, W.X.; Wang, G.T. PhyloSuite: An integrated and scalable desktop platform for streamlined molecular sequence data management and evolutionary phylogenetics studies. Mol. Ecol. Resour. 2020, 20, 348–355. [Google Scholar] [CrossRef] [PubMed]
  79. Ronquist, F.; Huelsenbeck, J.P. MrBayes 3: Bayesian phylogenetic inference under mixed models. Bioinformatics 2003, 19, 1572–1574. [Google Scholar] [CrossRef] [PubMed]
  80. Miller, M.A.; Pfeiffer, W.; Schwartz, T. Creating the CIPRES science gateway for inference of large phylogenetic trees. In Proceedings of the 2010 Gateway Computing Environments Workshop (GCE), New Orleans, LA, USA, 14 November 2010; pp. 1–8. [Google Scholar]
  81. Pritchard, J.K.; Stephens, M.; Donnelly, P. Inference of population structure using multilocus genotype data. Genetics 2000, 155, 945–959. [Google Scholar] [CrossRef] [PubMed]
  82. Porras-Hurtado, L.; Ruiz, Y.; Santos, C.; Phillips, C.; Carracedo, Á.; Lareu, M. An overview of STRUCTURE: Applications, parameter settings, and supporting software. Front. Genet. 2013, 4, 98. [Google Scholar] [CrossRef]
  83. Evanno, G.; Regnaut, S.; Goudet, J. Detecting the number of clusters of individuals using the software structure: A simulation study. Mol. Ecol. 2005, 14, 2611–2620. [Google Scholar] [CrossRef]
  84. Drummond, A.J.; Rambaut, A. BEAST: Bayesian evolutionary analysis by sampling trees. BMC Evol. Biol. 2007, 7, 214. [Google Scholar] [CrossRef]
  85. Li, Y.; Smith, T.; Liu, C.-J.; Awasthi, N.; Yang, J.; Wang, Y.-F.; Li, C.-S. Endocarps of Prunus (Rosaceae: Prunoideae) from the early Eocene of Wutu, Shandong Province, China. TAXON 2011, 60, 555–564. [Google Scholar] [CrossRef]
  86. Dorofeev, P.I. Tretichnye Flory Zapadnoi Sibiri; Akad. Nauk: Moscow, Russia, 1963. [Google Scholar]
  87. Sokoloff, D.D.; Ignatov, M.S.; Remizowa, M.V.; Nuraliev, M.S.; Blagoderov, V.; Garbout, A.; Perkovsky, E.E. Staminate flower of Prunus s. l. (Rosaceae) from Eocene rovno amber (Ukraine). J. Plant Res. 2018, 131, 925–943. [Google Scholar] [CrossRef] [PubMed]
  88. Szafer, W. Miocene Flora from Stare Gliwice in Upper Silesia: Instytut Geologiczny; Prace: Avenue Fenton, MI, USA, 1961. [Google Scholar]
  89. Tiffney, B.H. Dicotyledonous angiosperm flower from the upper cretaceous of Martha’s Vineyard, Massachusetts. Nature 1977, 265, 136–137. [Google Scholar] [CrossRef]
  90. Rambaut, A.; Drummond, A.J.; Xie, D.; Baele, G.; Suchard, M.A. Posterior summarization in bayesian phylogenetics using Tracer 1.7. Syst. Biol. 2018, 67, 901–904. [Google Scholar] [CrossRef]
  91. Yu, Y.; Harris, A.J.; Blair, C.; He, X. RASP (Reconstruct Ancestral State in Phylogenies): A tool for historical biogeography. Mol. Phylogenetics Evol. 2015, 87, 46–49. [Google Scholar] [CrossRef] [PubMed]
Figure 1. Representative genome map of the subg. Cerasus cp genomes. (a) Subg. Cerasus cp ideogram, scale in kb. (b) Gene distribution (blue, protein-coding genes; green, tRNAs; pink, rRNAs). (c) Density of single-nucleotide polymorphism (SNP) (400 bp window). (d) Density of insertion/deletion (InDel) (400 bp window). (e) Nucleotide diversity (Pi) (400-bp window). (f) GC content distribution (400 bp window). (g) The structure of cp genomes, including LSC region, SSC region, and IR regions.
Ijms 24 15612 g001
Figure 2. Phylogenetic tree of Prunus based on cp genome data, showing divergences within subg. Cerasus. Bootstrap supports (BS)/Bayesian posterior probabilities (PP) are shown above the branches.
Ijms 24 15612 g002
Figure 3. Chronogram of Prunus based on cp genome data. N1, N2, N3, and N4 mean the position of the calibration points. Median values and 95% HPD are shown on the branches, with the length of the blue bar indicating the range of HPD. The divergences of subgenera and the clades of subg. Cerasus are numbered, and the 95% HPD ranges are given in the upper left corner.
Ijms 24 15612 g003
Figure 4. Reconstruction of ancestral areas for Prunus. (a) Map of possible dispersal routes of the subgenus Cerasus. The black square is enlarged for specification in Figure 4c. The capital letters correspond to the ancestral regions as illustrated below. (b) Ancestral area reconstructions based on the Statistical-Dispersal–Vicariance-Analysis (S-DIVA) method. Each pie chart at the node represents the frequency of each ancestral area through the proportion of different colors, with the maximum area set to 4. Letters in the pie charts indicate the areas with the highest relative probabilities. (c) Enlargement of possible dispersal routes of the subgenus Cerasus. Two red dotted lines represent the putative dispersal route of P. mahaleb, of which the top line represents the putative dispersal route of P. avium; the blue dotted line represents the possible dispersal route of P. subhiretella.
Ijms 24 15612 g004
Disclaimer/Publisher’s Note: The statements, opinions and data contained in all publications are solely those of the individual author(s) and contributor(s) and not of MDPI and/or the editor(s). MDPI and/or the editor(s) disclaim responsibility for any injury to people or property resulting from any ideas, methods, instructions or products referred to in the content.

