Article

Investigating the Metabolism of Plants Germinated in Heavy Water, D2O, and H218O-Enriched Media Using High-Resolution Mass Spectrometry

1
Skolkovo Institute of Science and Technology, Bolshoy Boulevard 30, Bld. 1, 121205 Moscow, Russia
2
Institute for Translational Medicine and Biotechnology, First Moscow State Medical University, 119991 Moscow, Russia
*
Author to whom correspondence should be addressed.
Int. J. Mol. Sci. 2023, 24(20), 15396; https://doi.org/10.3390/ijms242015396
Submission received: 8 August 2023 / Revised: 23 August 2023 / Accepted: 30 August 2023 / Published: 20 October 2023
(This article belongs to the Special Issue Advances in Metabolomics and Small Molecules Analysis)

Abstract

:
Mass spectrometry has been an essential technique for the investigation of the metabolic pathways of living organisms since its appearance at the beginning of the 20th century. Due to its capability to resolve isotopically labeled species, it can be applied together with stable isotope tracers to reveal the transformation of particular biologically relevant molecules. However, low-resolution techniques, which were used for decades, had limited capabilities for untargeted metabolomics, especially when a large number of compounds are labelled simultaneously. Such untargeted studies may provide new information about metabolism and can be performed with high-resolution mass spectrometry. Here, we demonstrate the capabilities of high-resolution mass spectrometry to obtain insights on the metabolism of a model plant, Lepidium sativum, germinated in D2O and H218O-enriched media. In particular, we demonstrated that in vivo labeling with heavy water helps to identify if a compound is being synthesized at a particular stage of germination or if it originates from seed content, and tandem mass spectrometry allows us to highlight the substructures with incorporated isotope labels. Additionally, we found in vivo labeling useful to distinguish between isomeric compounds with identical fragmentation patterns due to the differences in their formation rates that can be compared by the extent of heavy atom incorporation.

1. Introduction

Plants can produce a diverse set of metabolites, though only a small fraction of them are identified and organized into databases [1]. Untargeted plant metabolomics is the most promising approach to uncover new plant metabolites and obtain insights into metabolic pathways [2]. Advances in mass spectrometry instrumentation made possible the simultaneous detection of thousands of compounds in one analytical run, and the developed approaches for structure elucidation with mass spectrometry data in many cases allow us to correctly annotate primary and secondary metabolites [3,4,5,6,7,8].
To follow the biotransformation of a particular molecule involved in metabolism, stable isotope tracers can be used, though this requires advanced analytical techniques to resolve isotopologues. In vivo stable isotope labeling has found a broad application in mass spectrometry-based metabolomics studies [9,10,11,12,13,14,15,16] In vivo deuterium labelling was used to elucidate the biosynthesis of cytokinins [17,18] and the metabolism of indole-3-acetic acid [19]; deuterium and 18O-labeled choline were used to study betaine oxidative formation [20], while 15N-tracers [21] are valuable for investigating protein synthesis. The majority of studies, however, implement 13C (mainly in the form of 13CO2) labeling of plants [22,23,24,25,26] to follow carbon skeleton transformations in living cycles [27].
Besides the opportunity to highlight the routes of molecules in metabolic cycles, stable isotopes provide valuable techniques to elucidate chemical structures and discriminate between isobaric compounds [28]. Although such techniques are often deployed ex vivo, for example as in-solution [29,30,31] or in-source H/D [32,33,34,35] and 16O/18O exchange [36,37,38,39,40], it was shown that in vivo labelling may improve molecular formula assignment [41] and the identification of unknown flavonoids [42]. In vivo labeling is also applied to evaluate metabolic turnover rates in mammals [43,44,45] or rodents [46].
All plant metabolomics studies that involve isotope labelling can be roughly divided into two groups. The first group includes targeted studies, where specific molecules were labelled and their transformation was followed; the second group includes untargeted research using basic substrates, such as CO2, H2O and O2, to introduce isotopic labels to the metabolites. The latter requires a more complicated analytical approach as the label may appear in a wide range of biologically relevant molecules. To our surprise, the number of studies that implement an untargeted approach with D2O as the labelling source is very limited, and we could not find any mention of in vivo plant labelling for untargeted metabolomics with H218O.
The use of heavy water (D2O and H218O) as a heavy isotope source has the potential for simultaneously labeling large numbers of plant metabolites in a technically simple and cost-efficient way. Here, using the example of a model plant Lepidium sativum (garden cress), we implement in vivo plant labelling with D2O and H218O to evaluate the capabilities of untargeted mass spectrometry-based metabolomics with stable isotope tracers.

2. Results

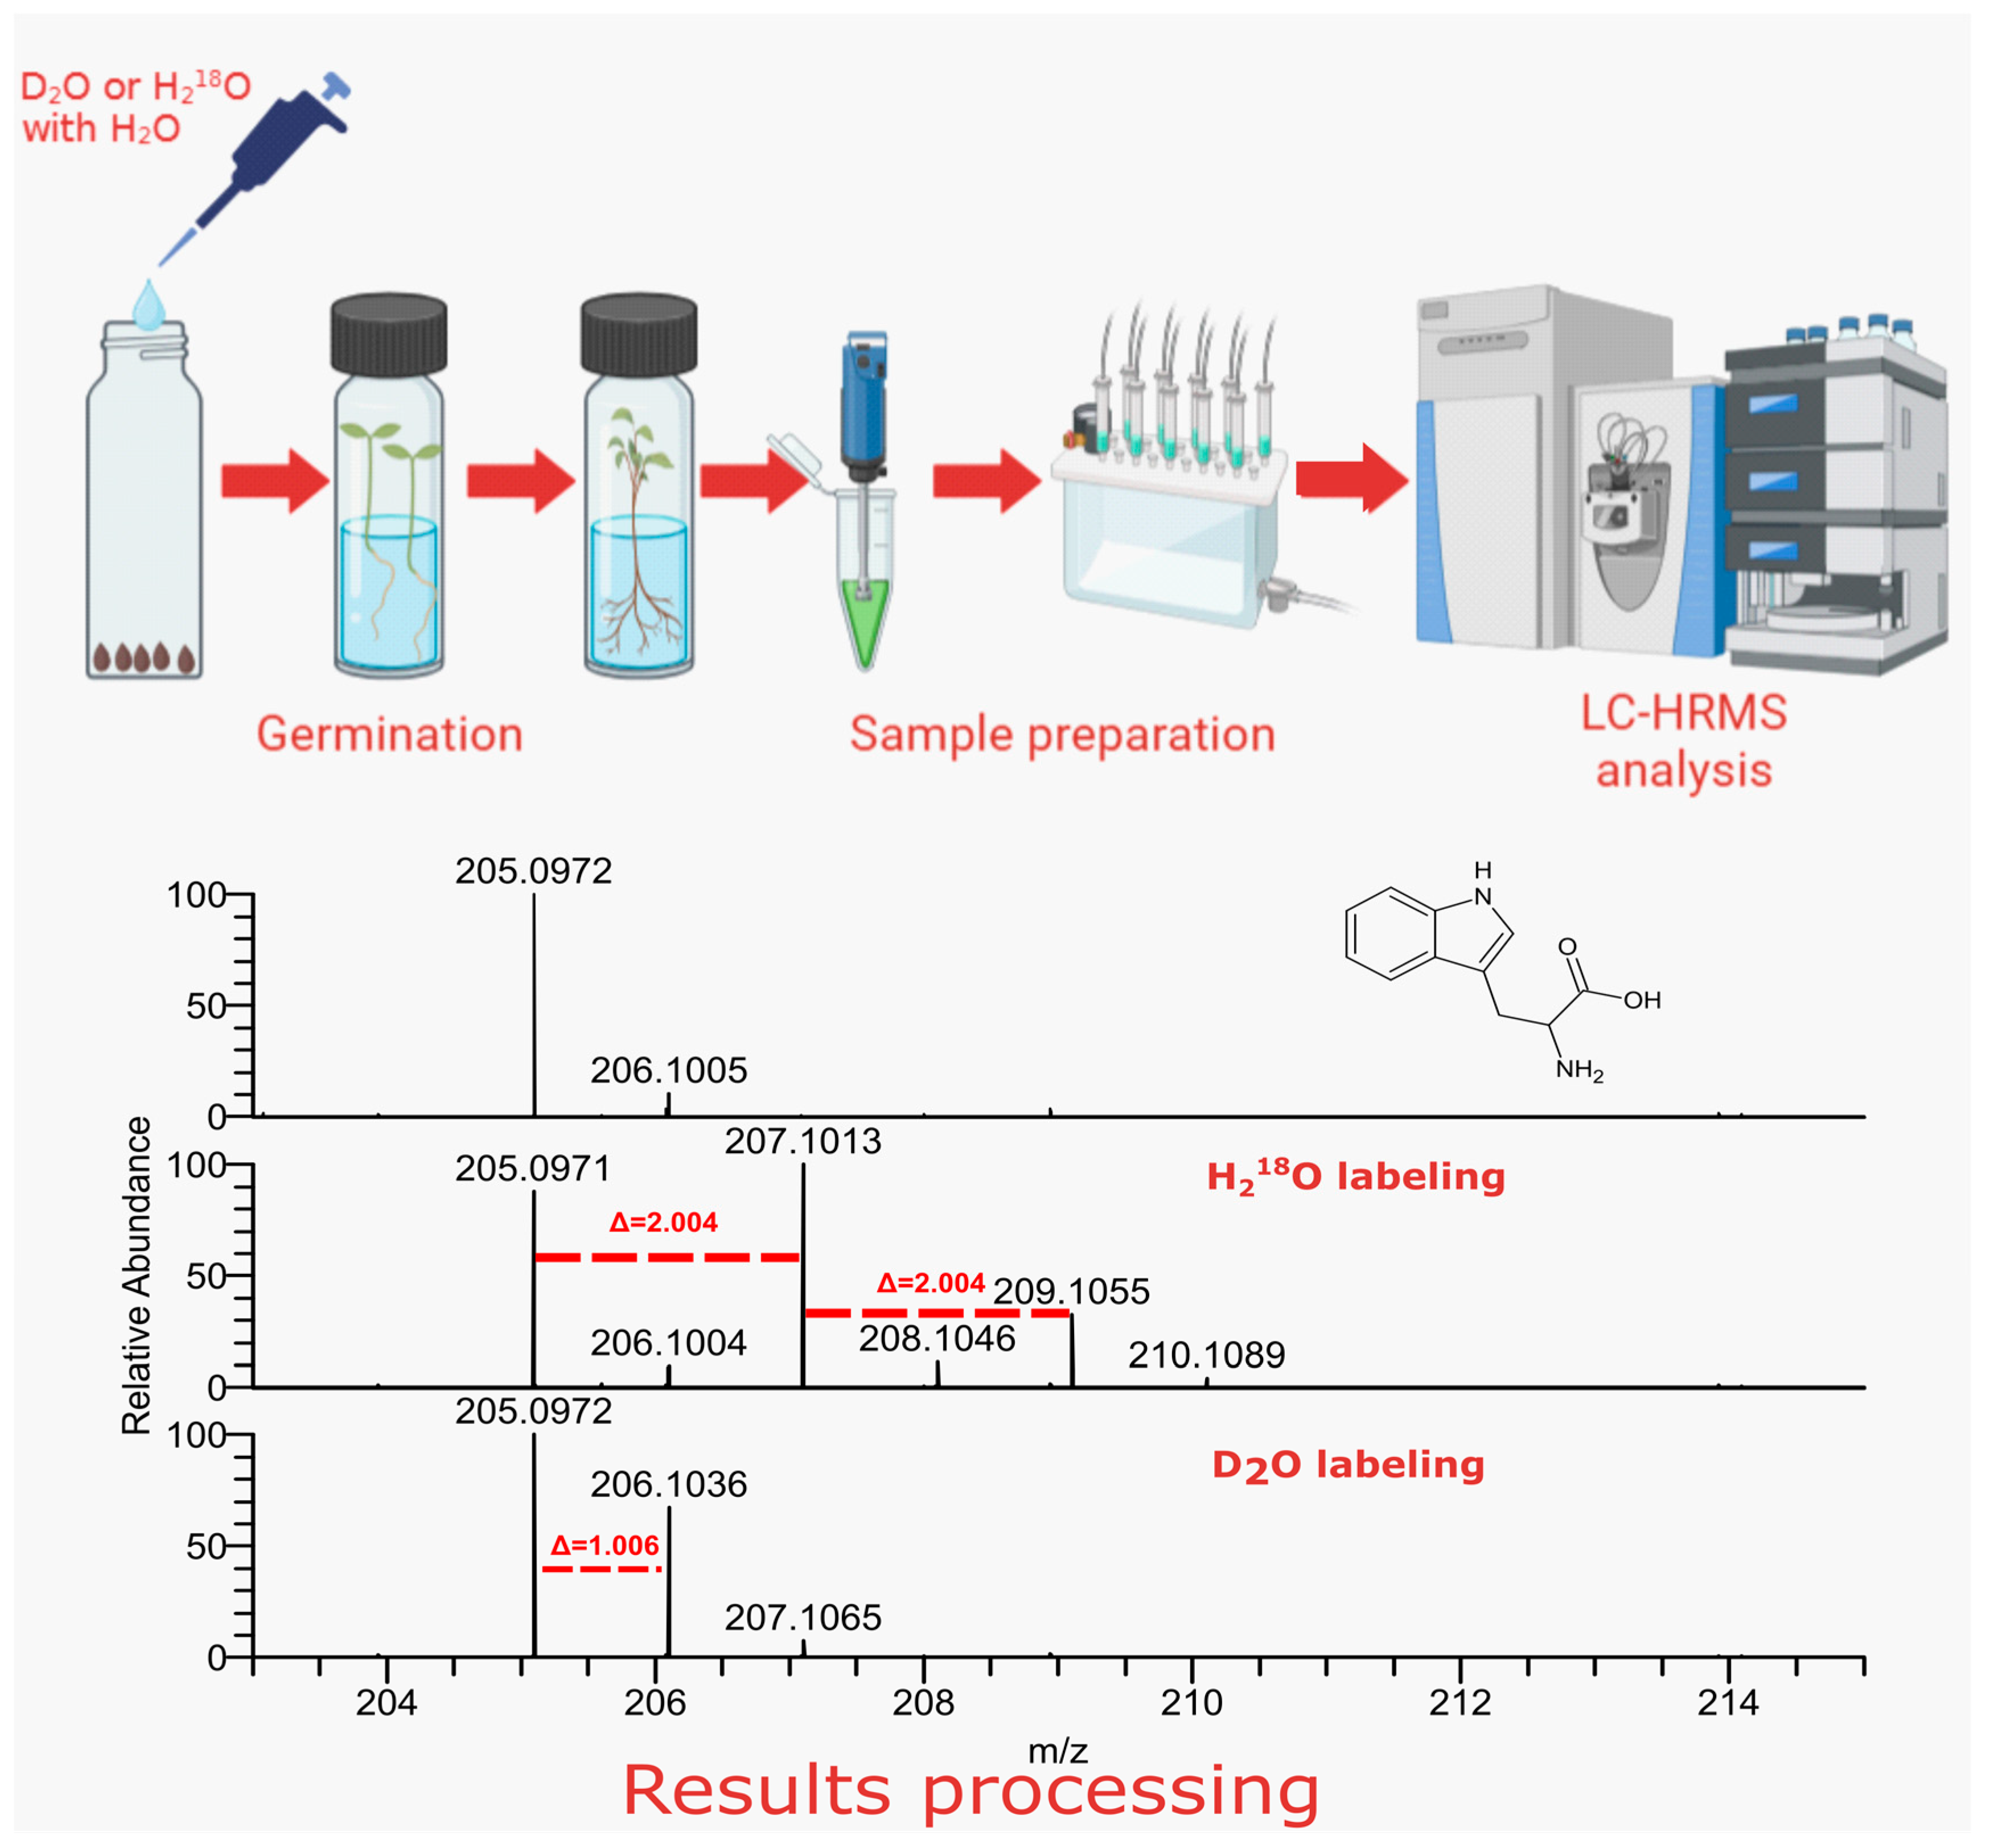
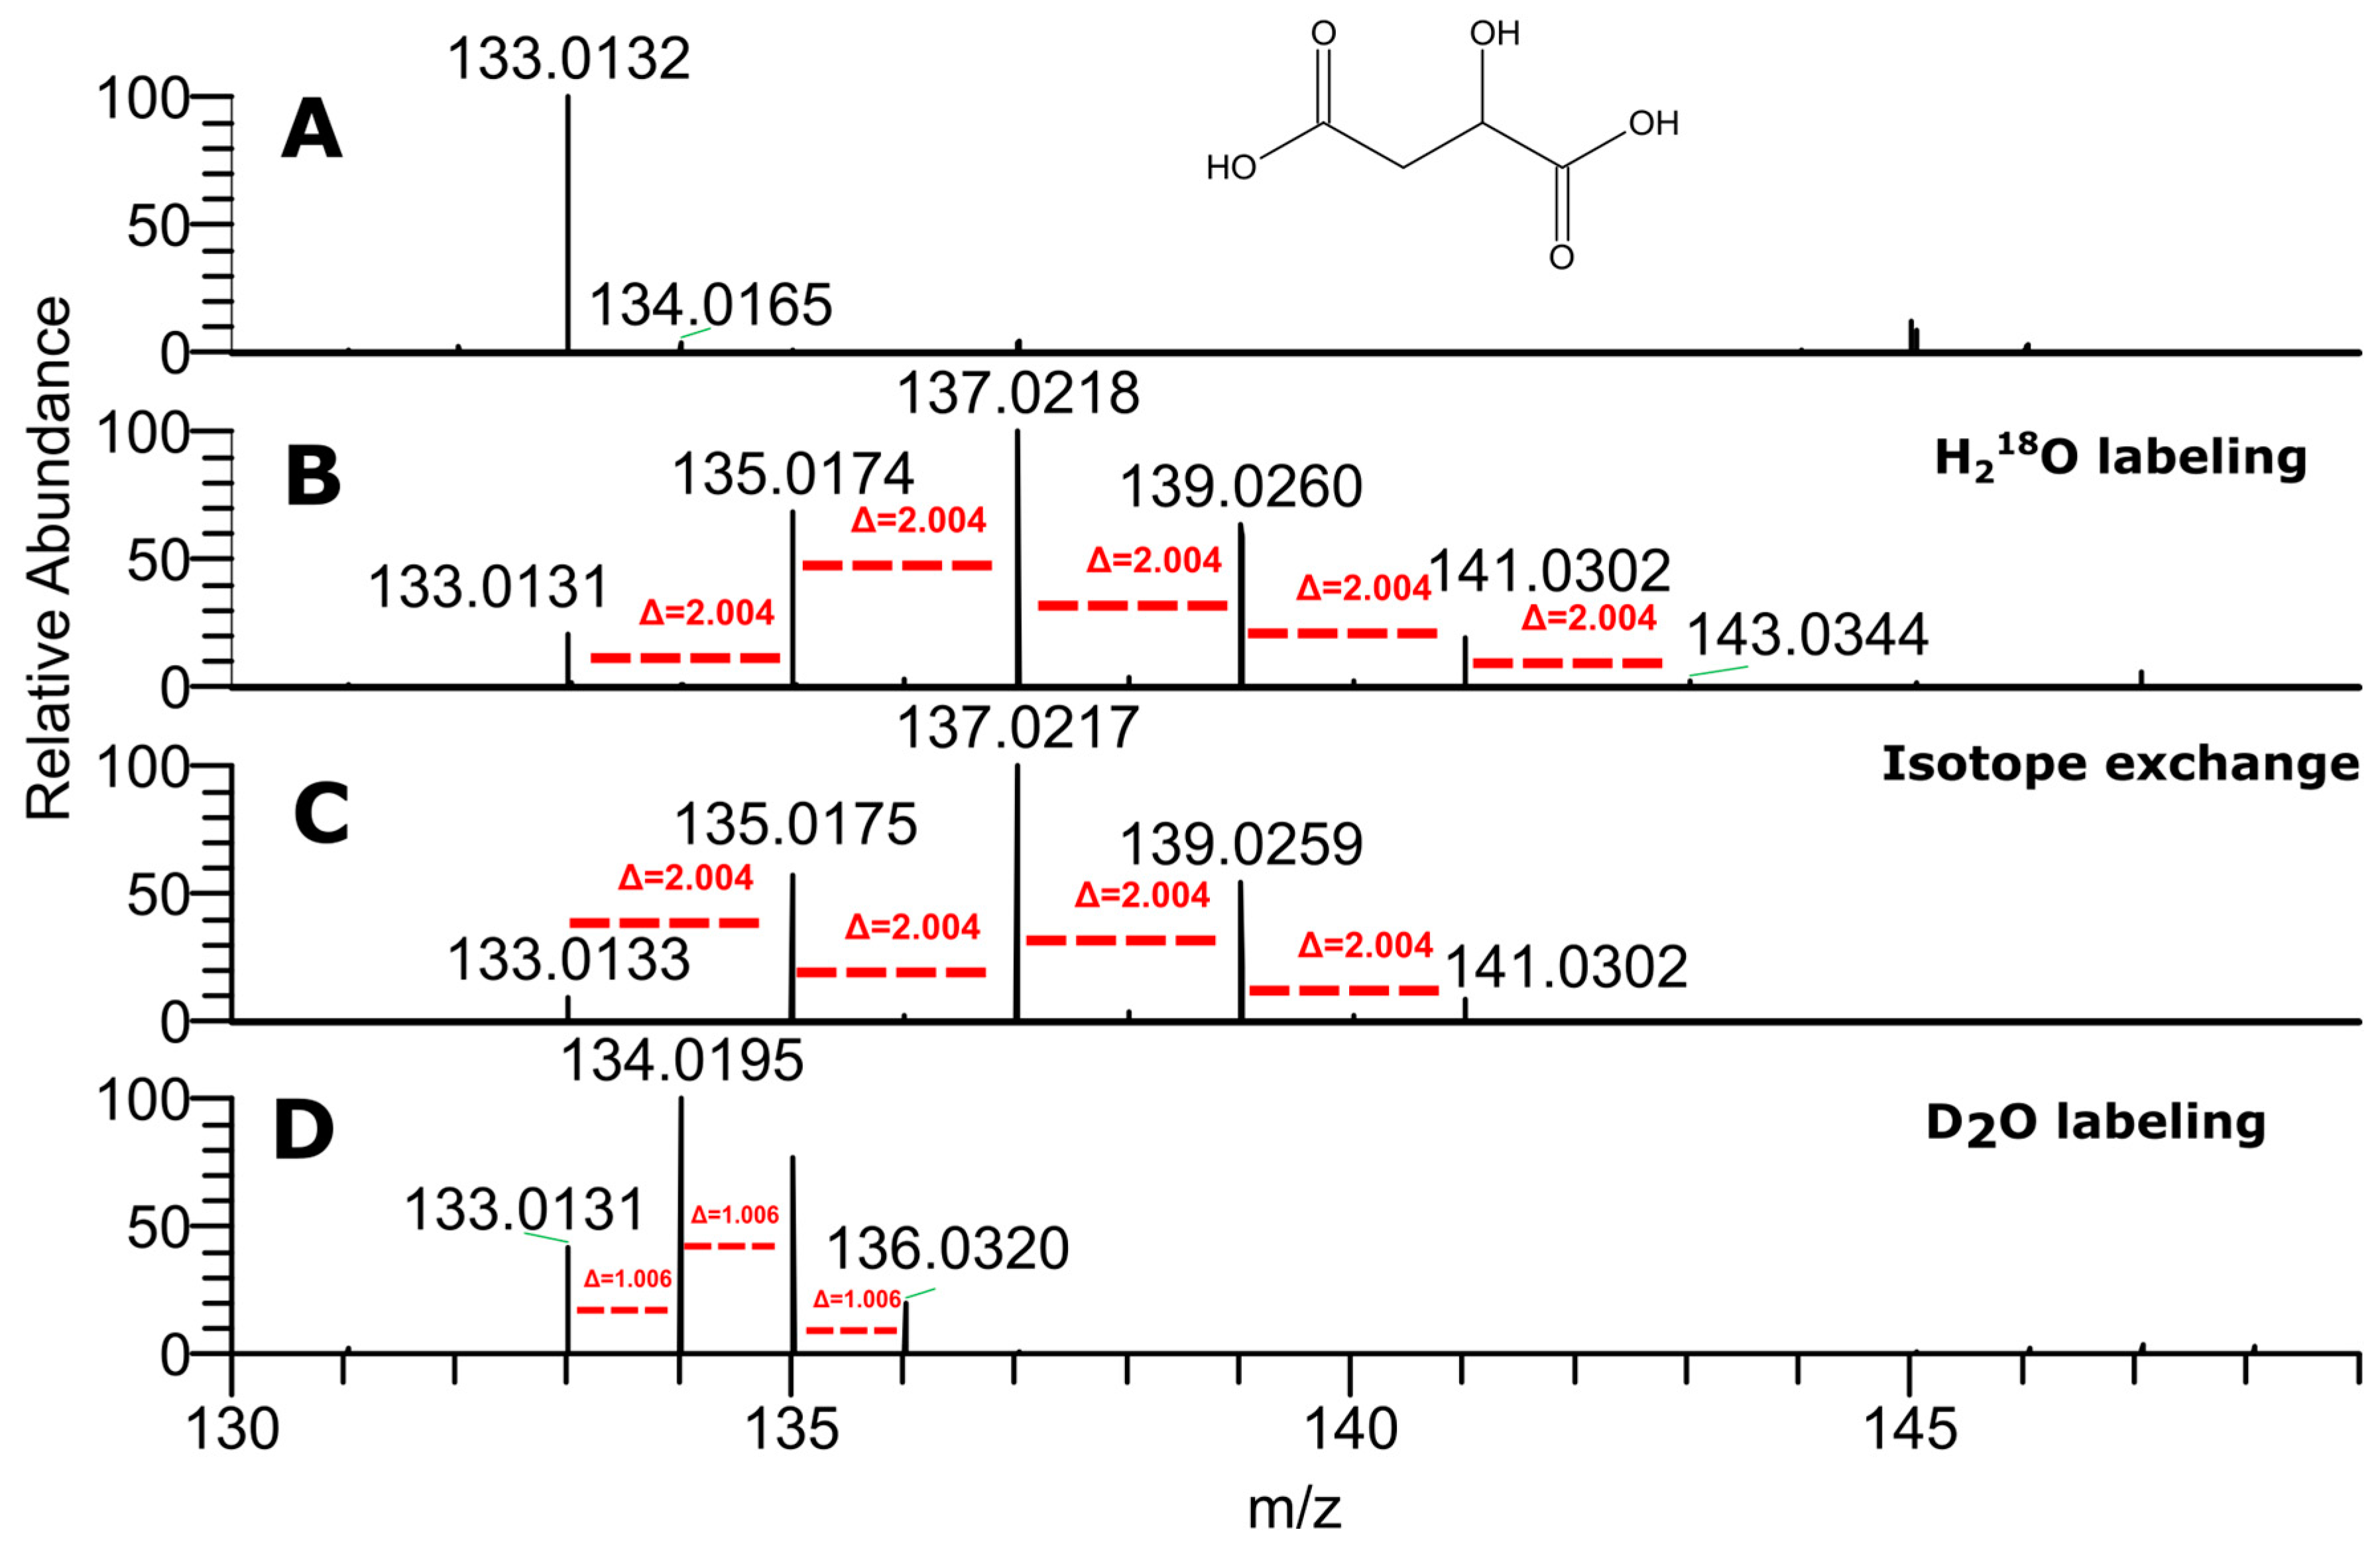
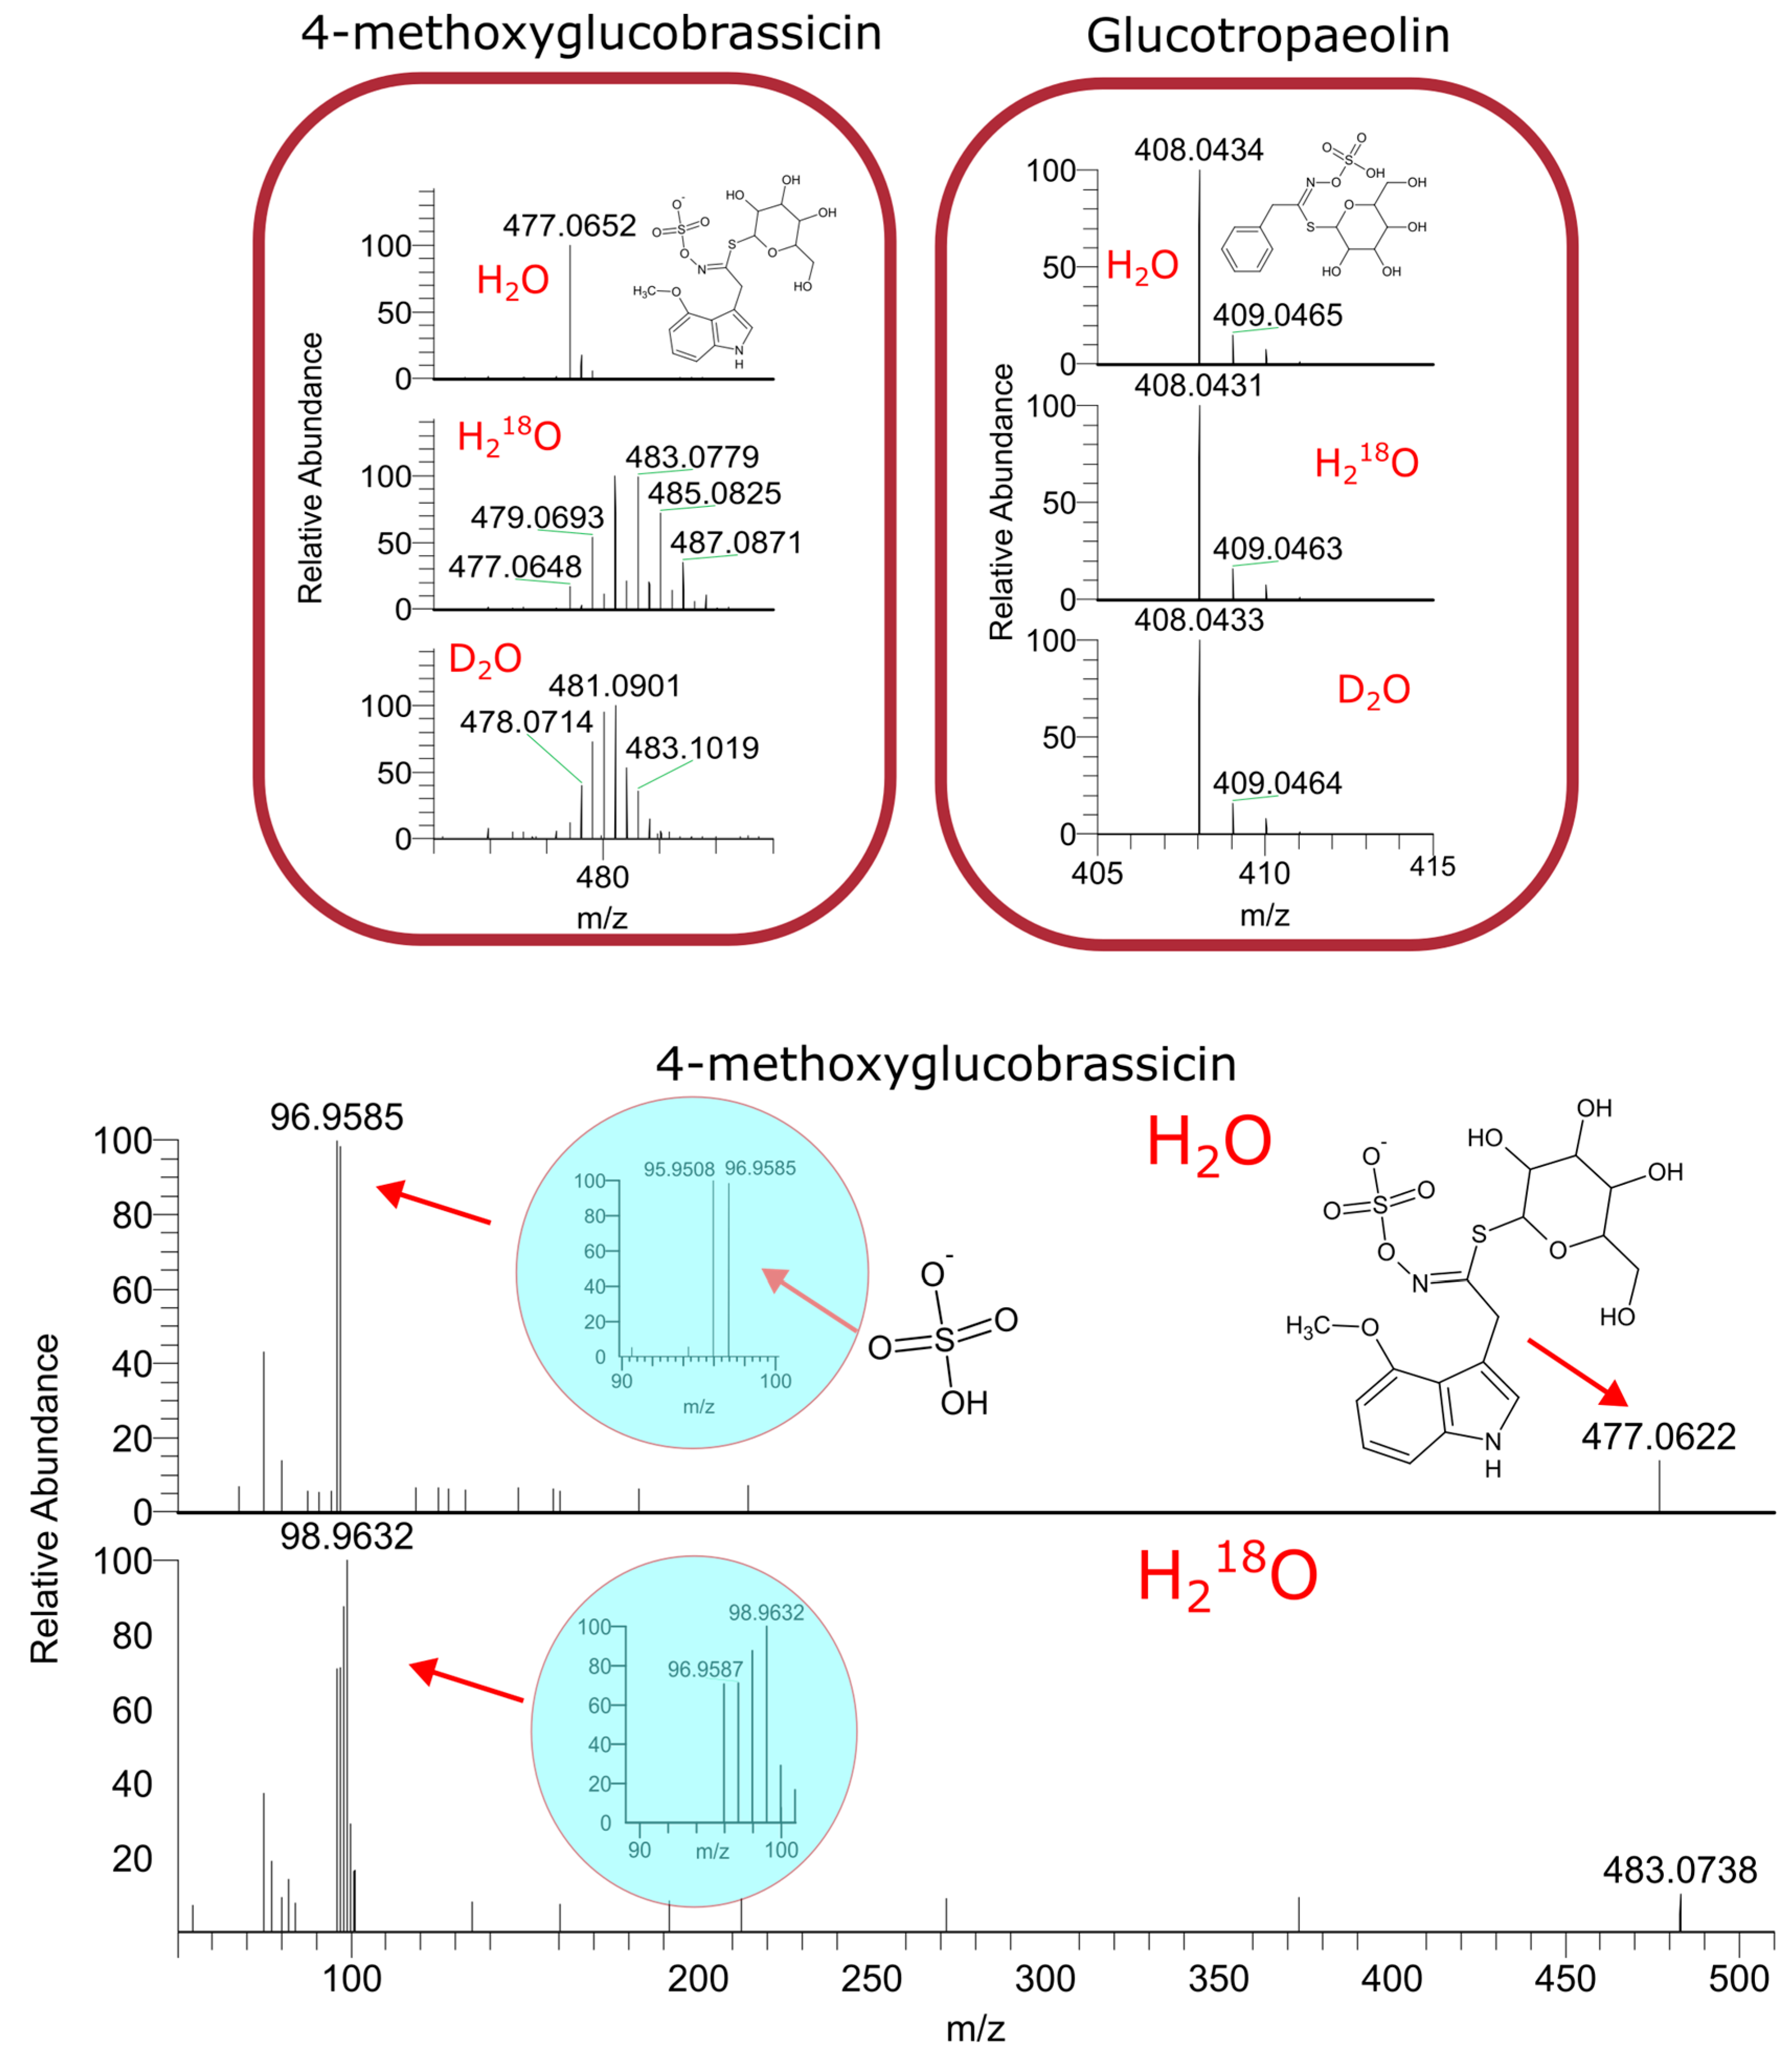
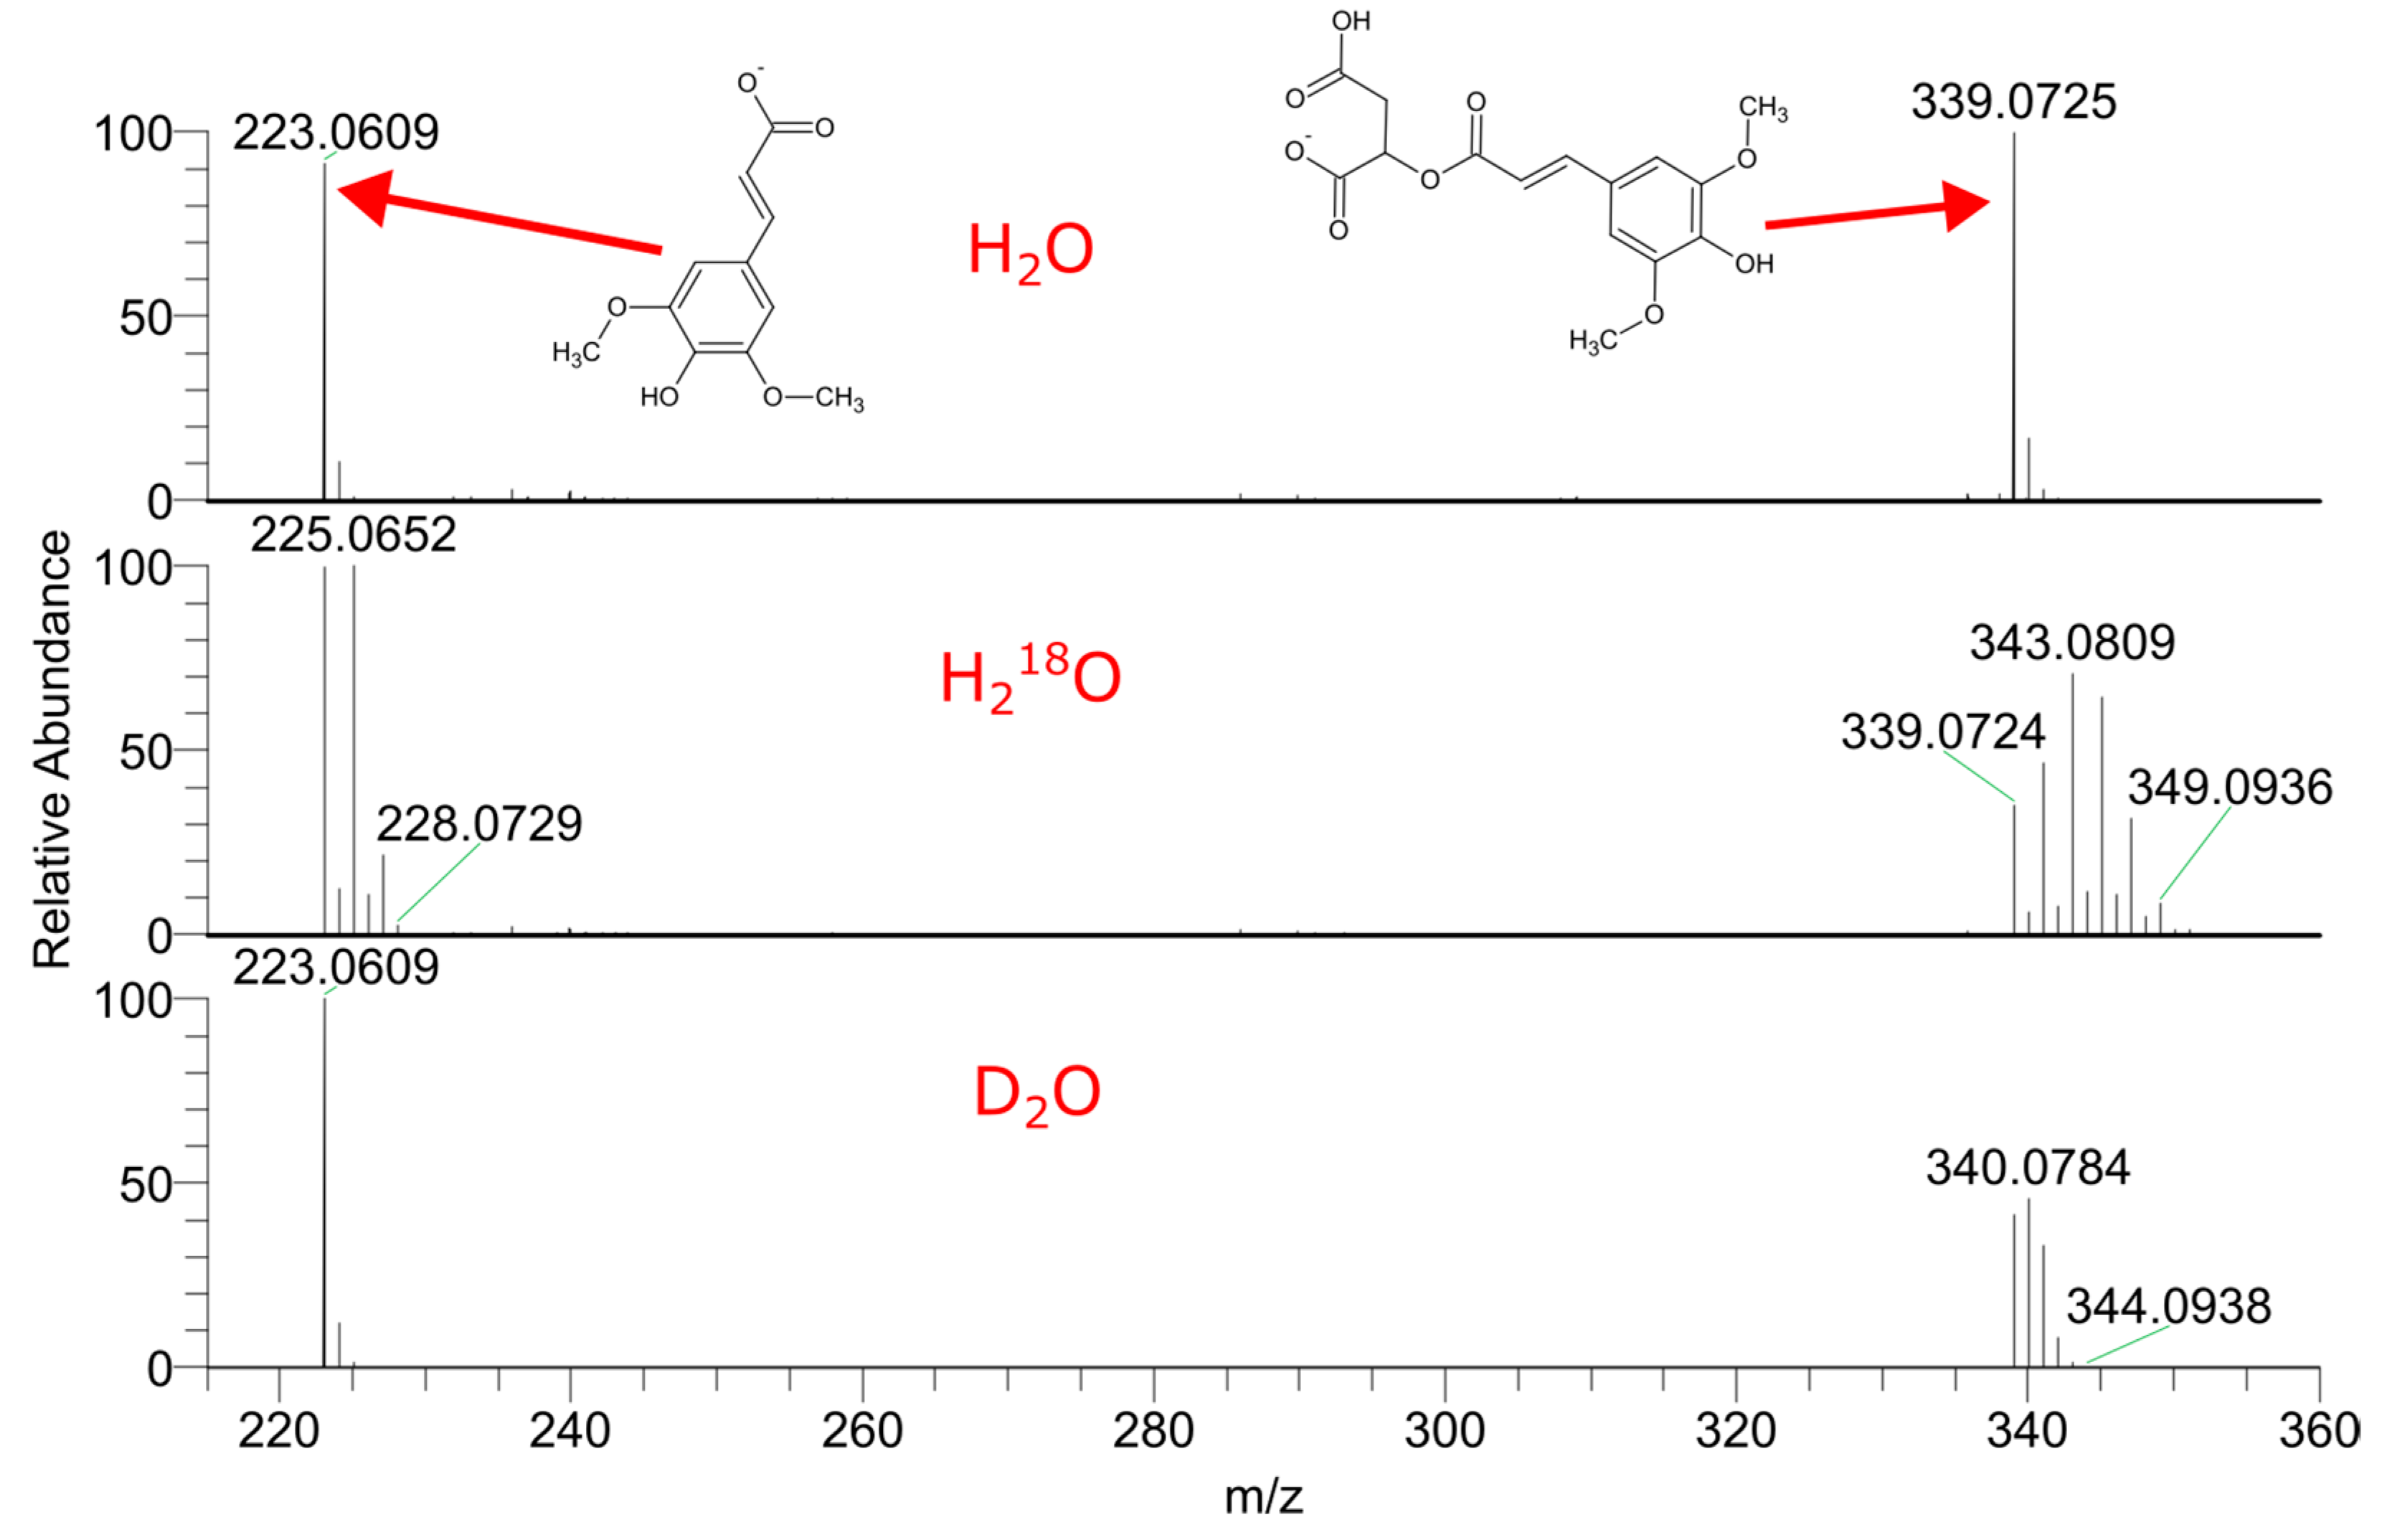
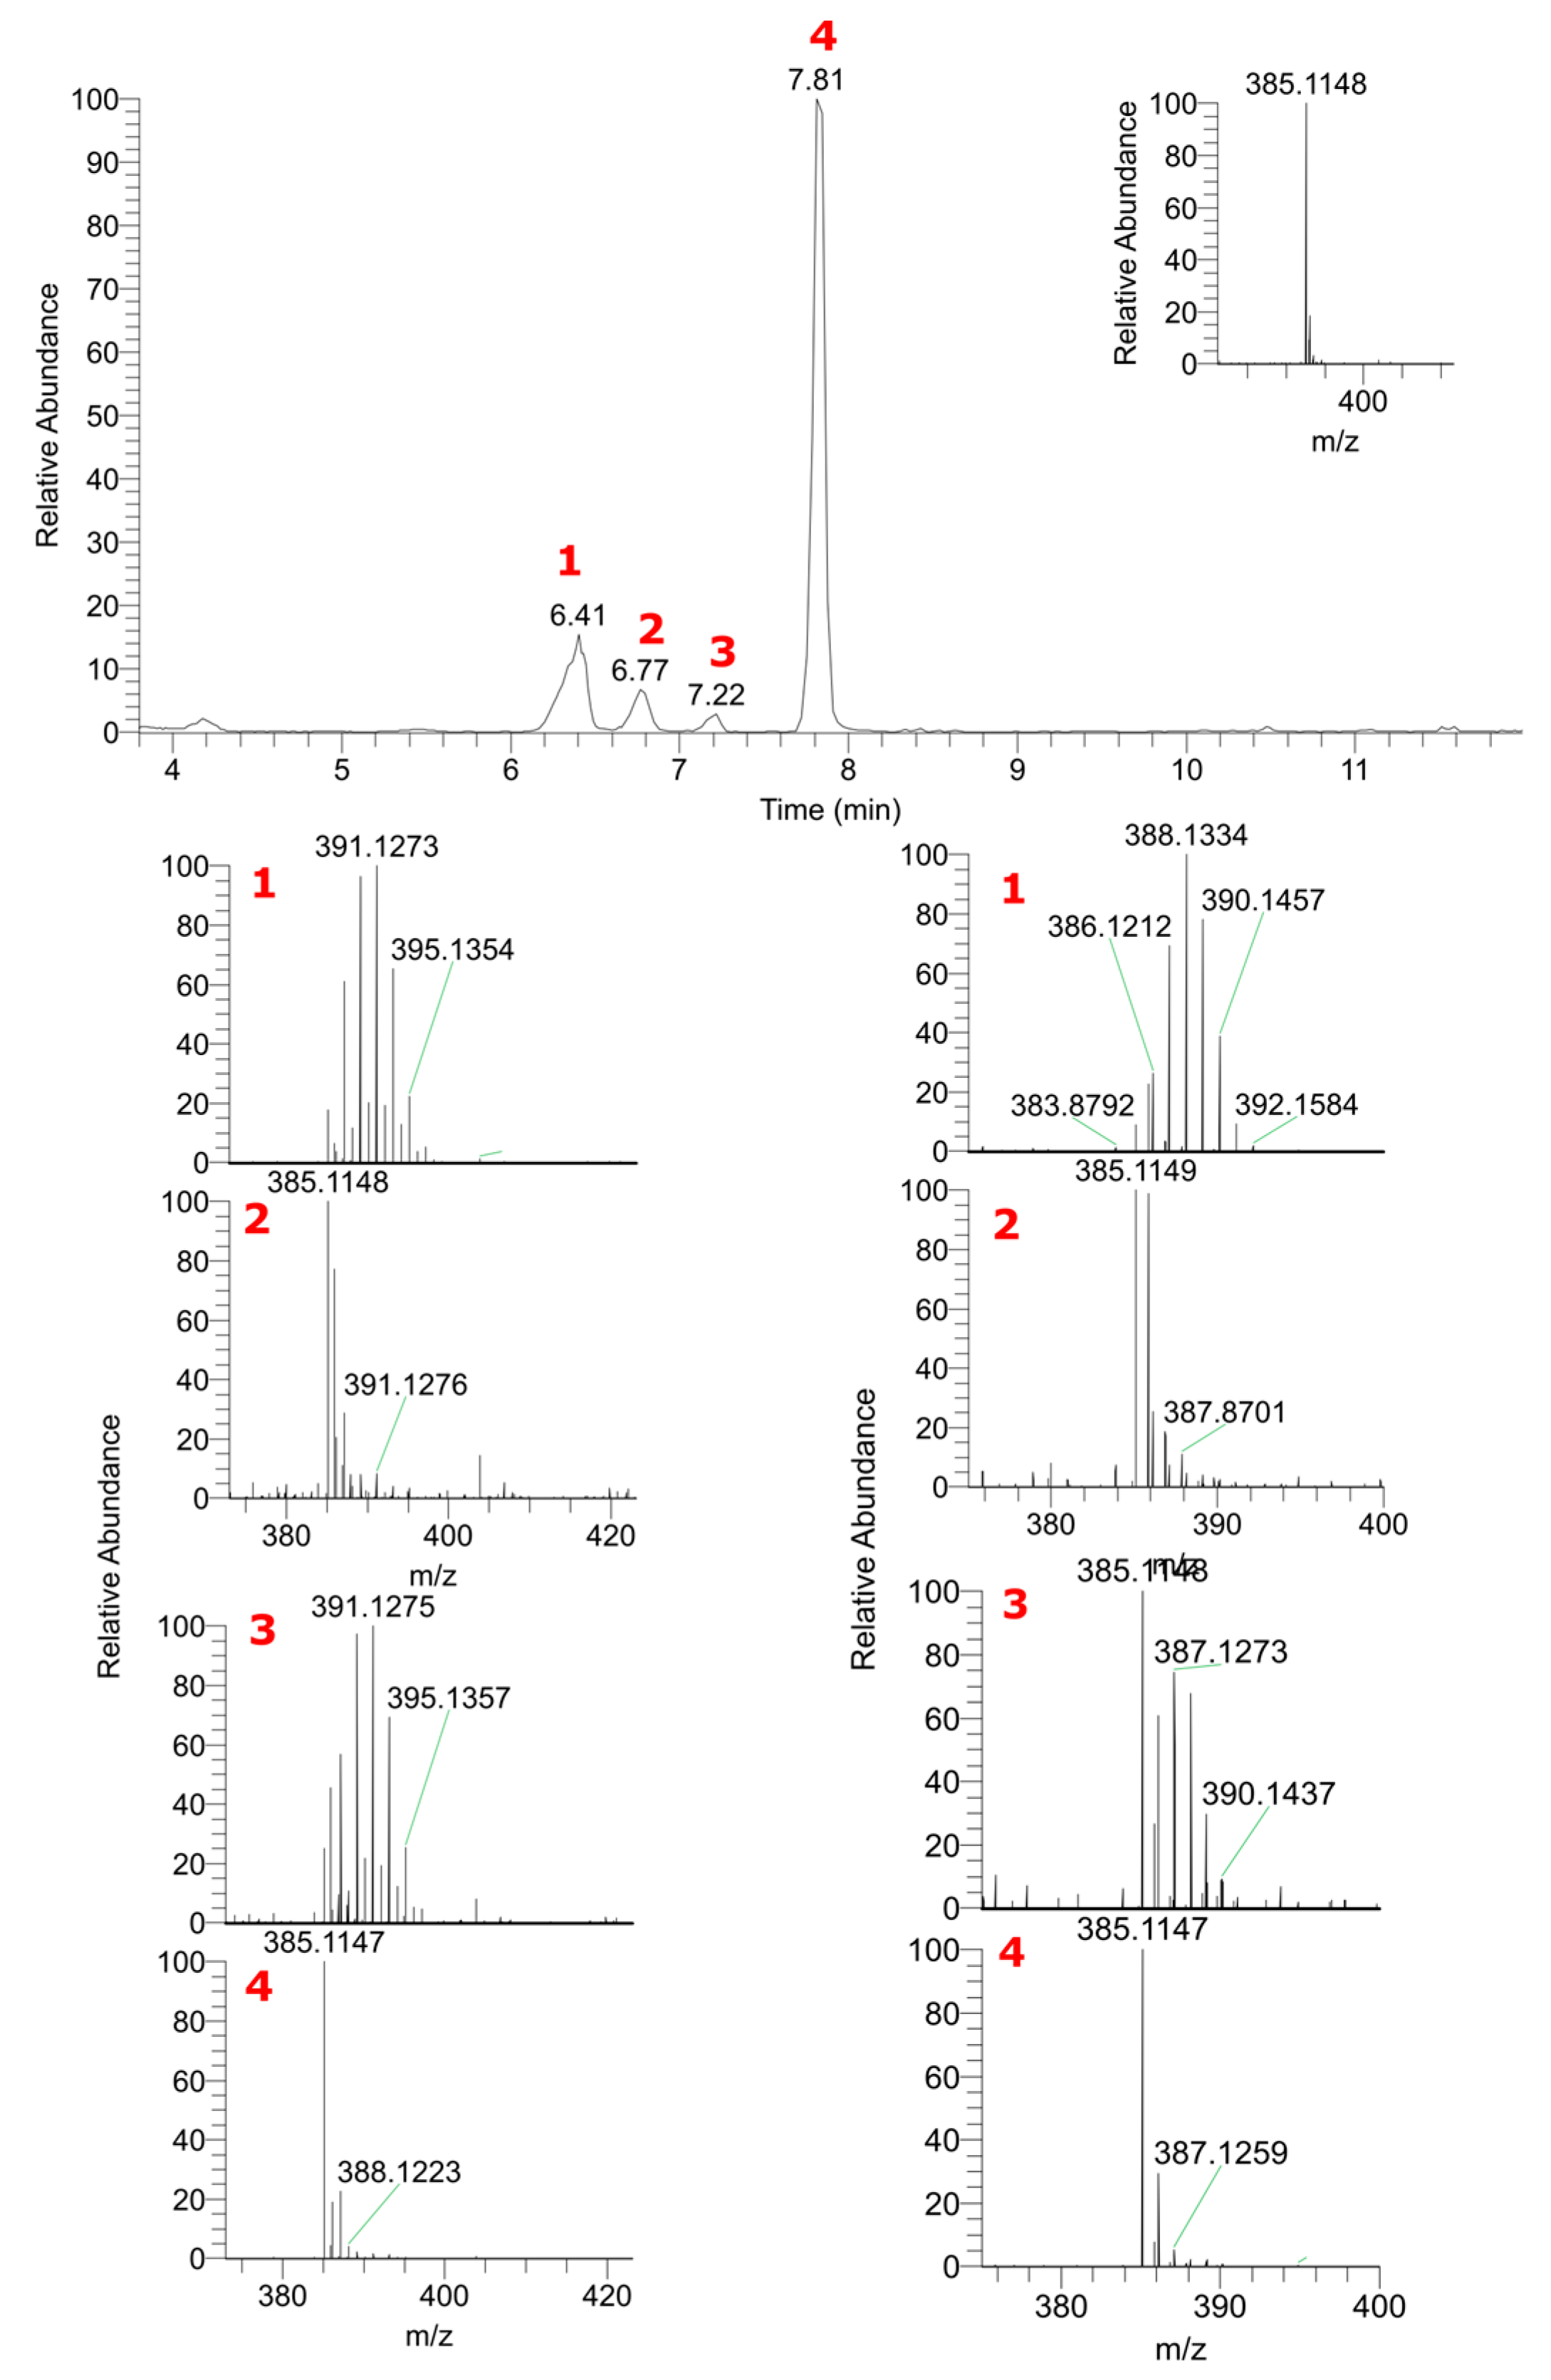
2.1. LC–HRMS Analysis of Labeled Plant Extracts

Garden cress was germinated with 1:1 mixtures of D2O and H2O and H218O:H2O for 12 days in 12 mL vials with a total heavy water uptake of 1.5 mL. Mixing with H2O was essential for the D2O experiments, as pure deuterium oxide is toxic and prevents the growing of plants. This effect is well known and was observed in our preliminary experiments.
LC–HRMS analysis was performed in both positive and negative DDA modes; we managed to annotate a number of primary metabolites, such as amino acids, carbohydrates and organic acids, and secondary metabolites, including glucosinolates, cinnamic acid derivatives and flavonoids. For each annotated compound, we calculated the number of incorporated heavy atoms by counting additional peaks in the mass spectra of labeled plants with characteristic mass shifts of 1.0063 and 2.0042 for deuterium and 18O, respectively, as shown in Figure 1, with the example of tryptophan. Table 1 summarizes the annotated compounds with the calculated number of stable isotope labels. Annotation was performed via an MS/MS library search against the mzCloud and MassBank libraries. The results of a supplementary GC–MS analysis are given in the Table S1.

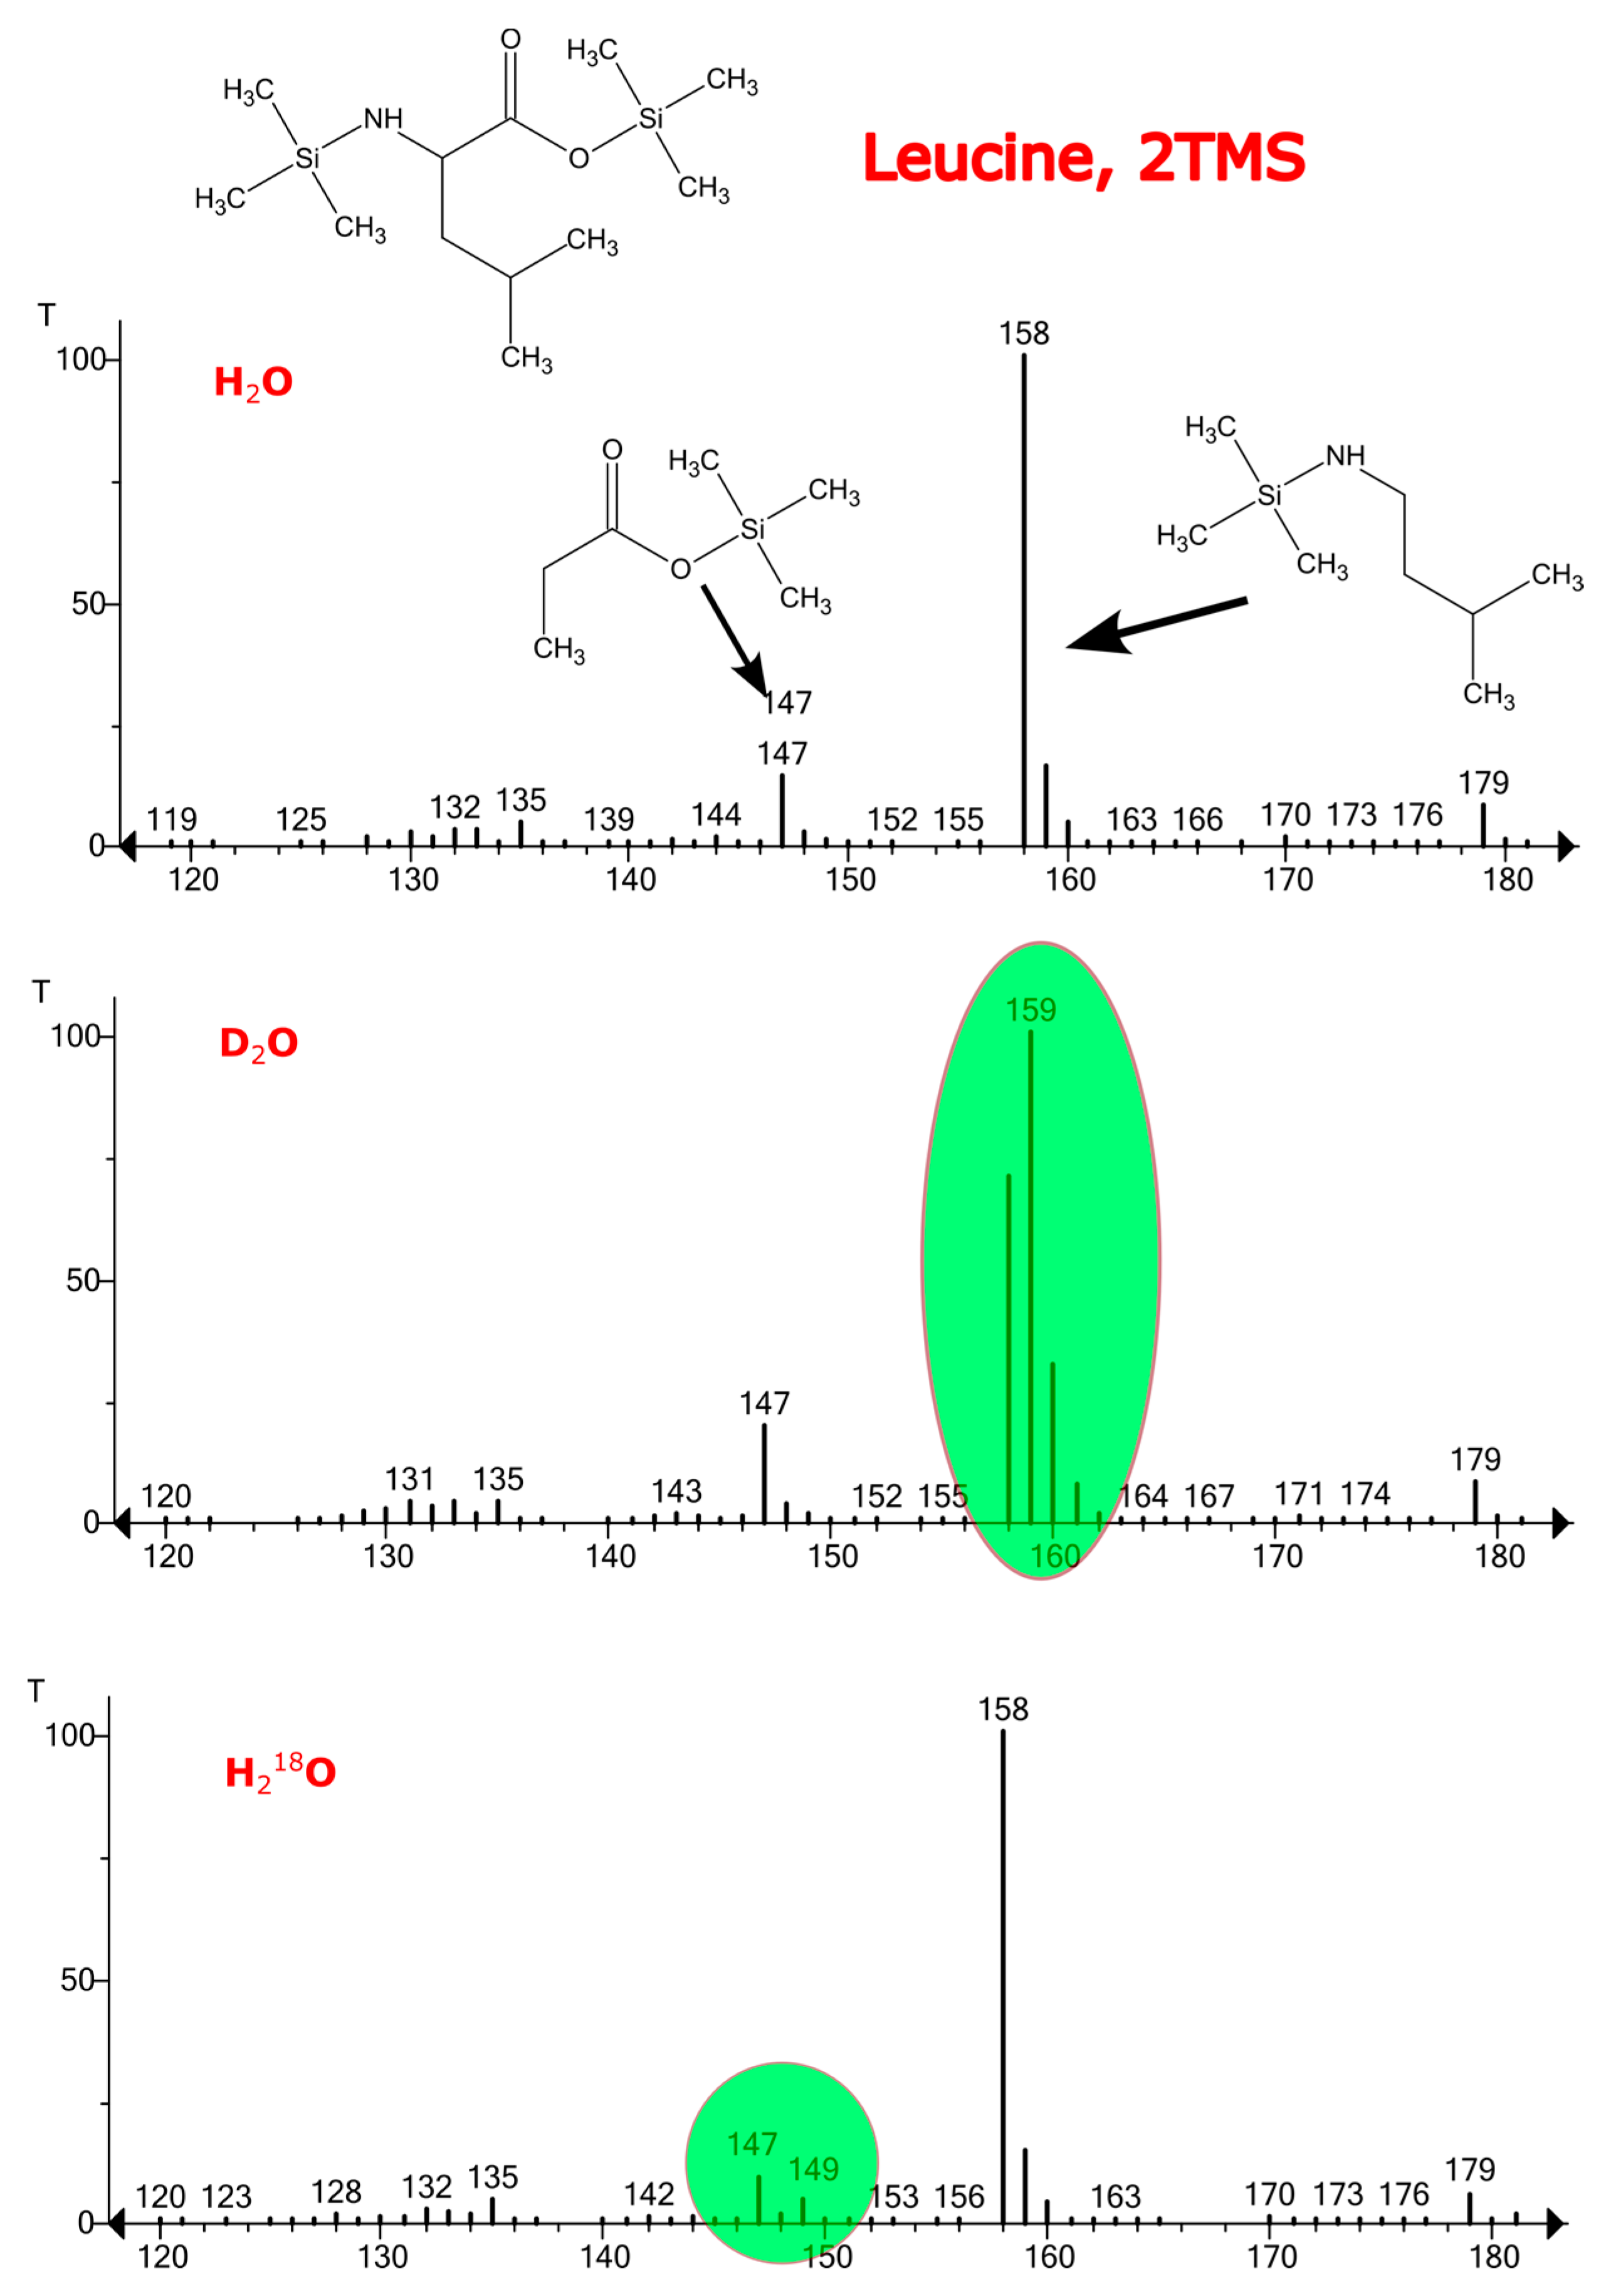
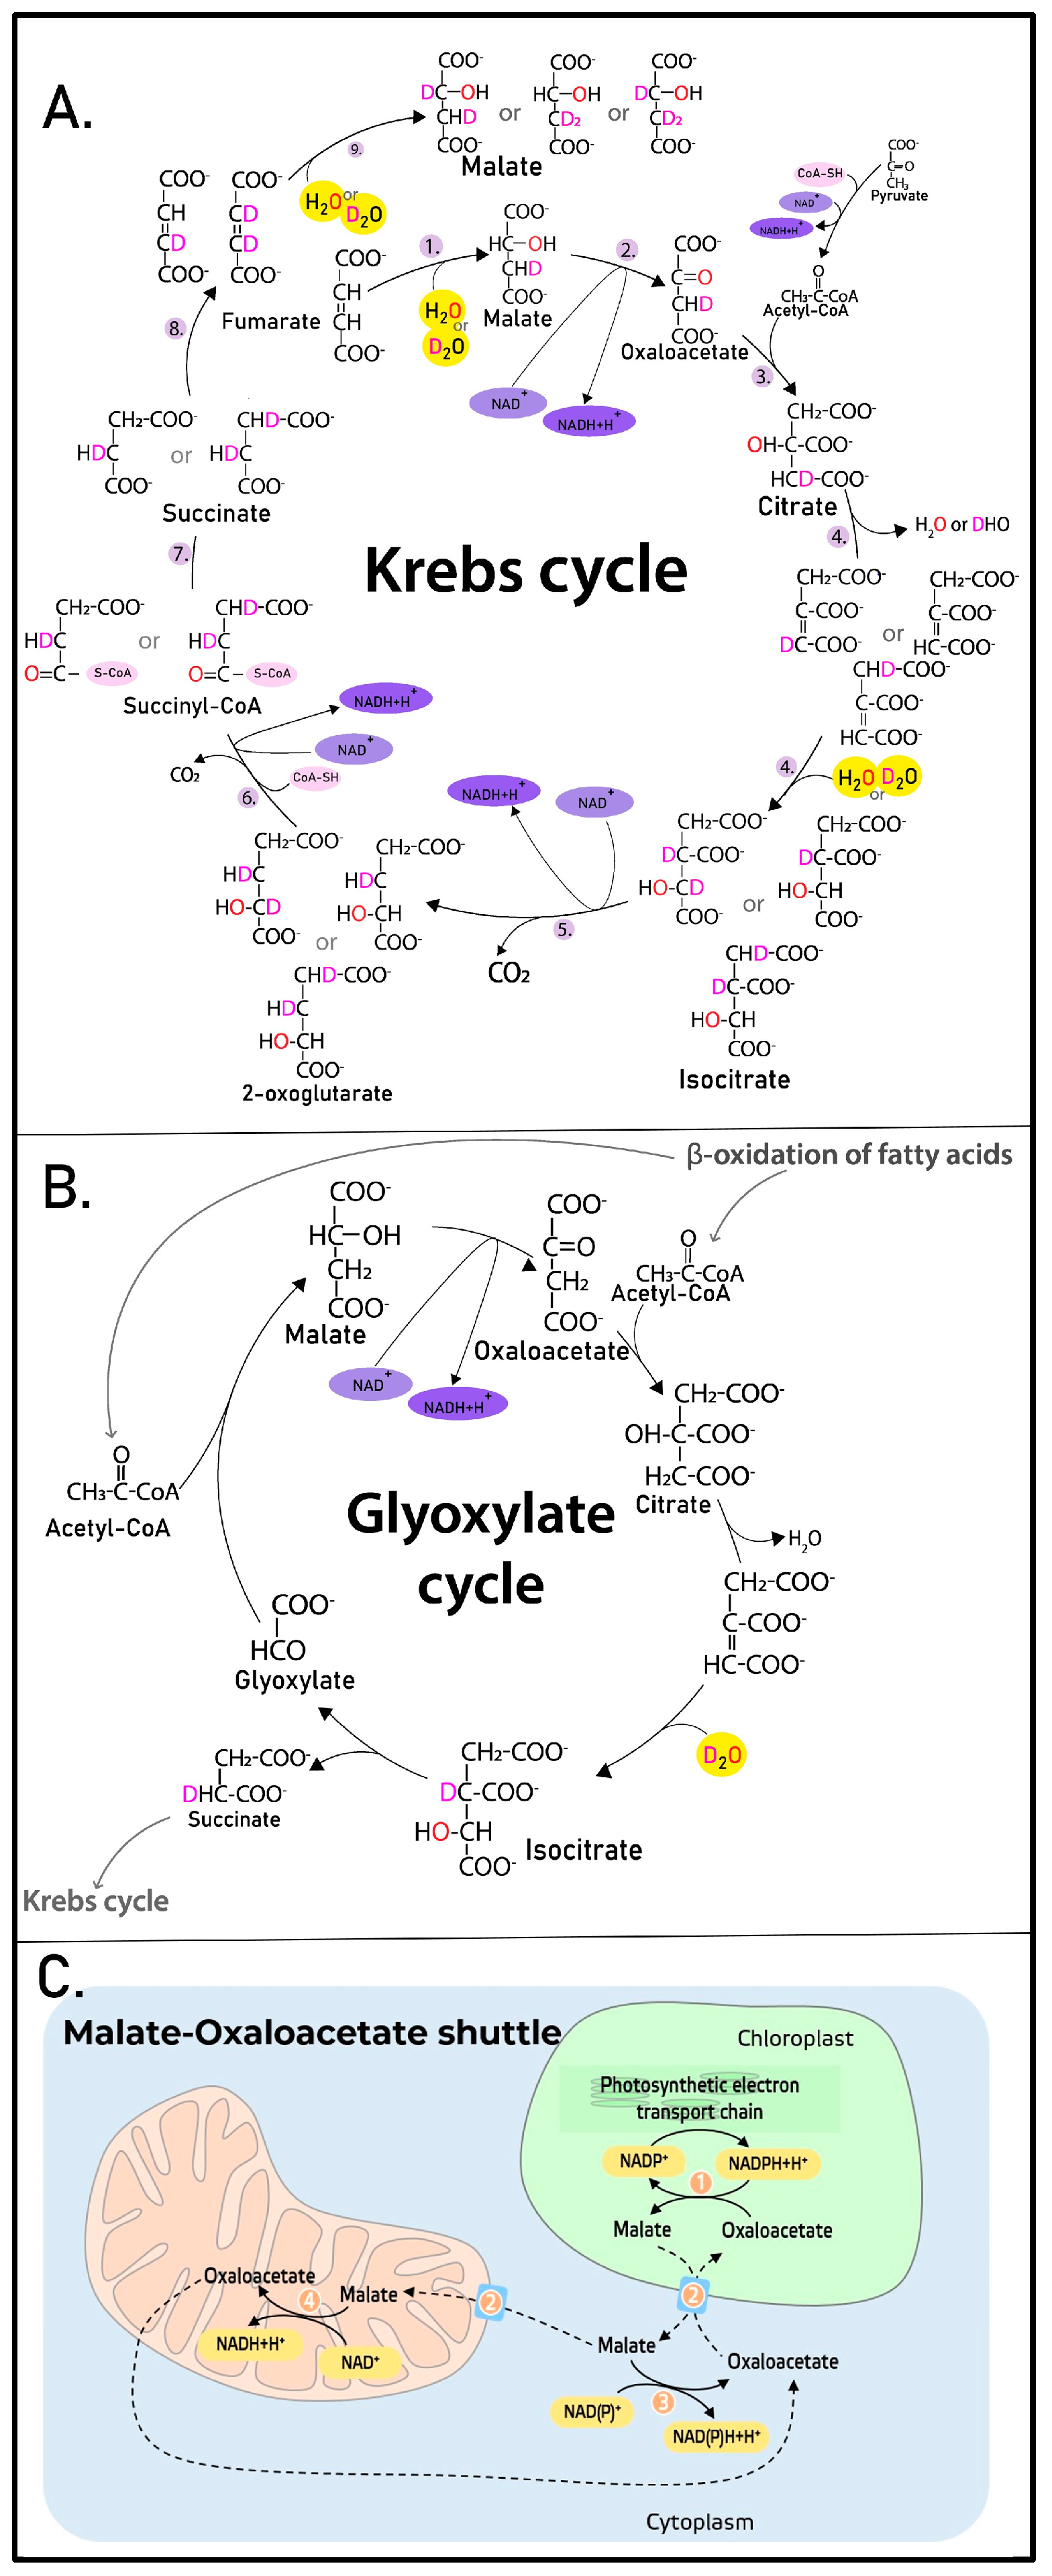
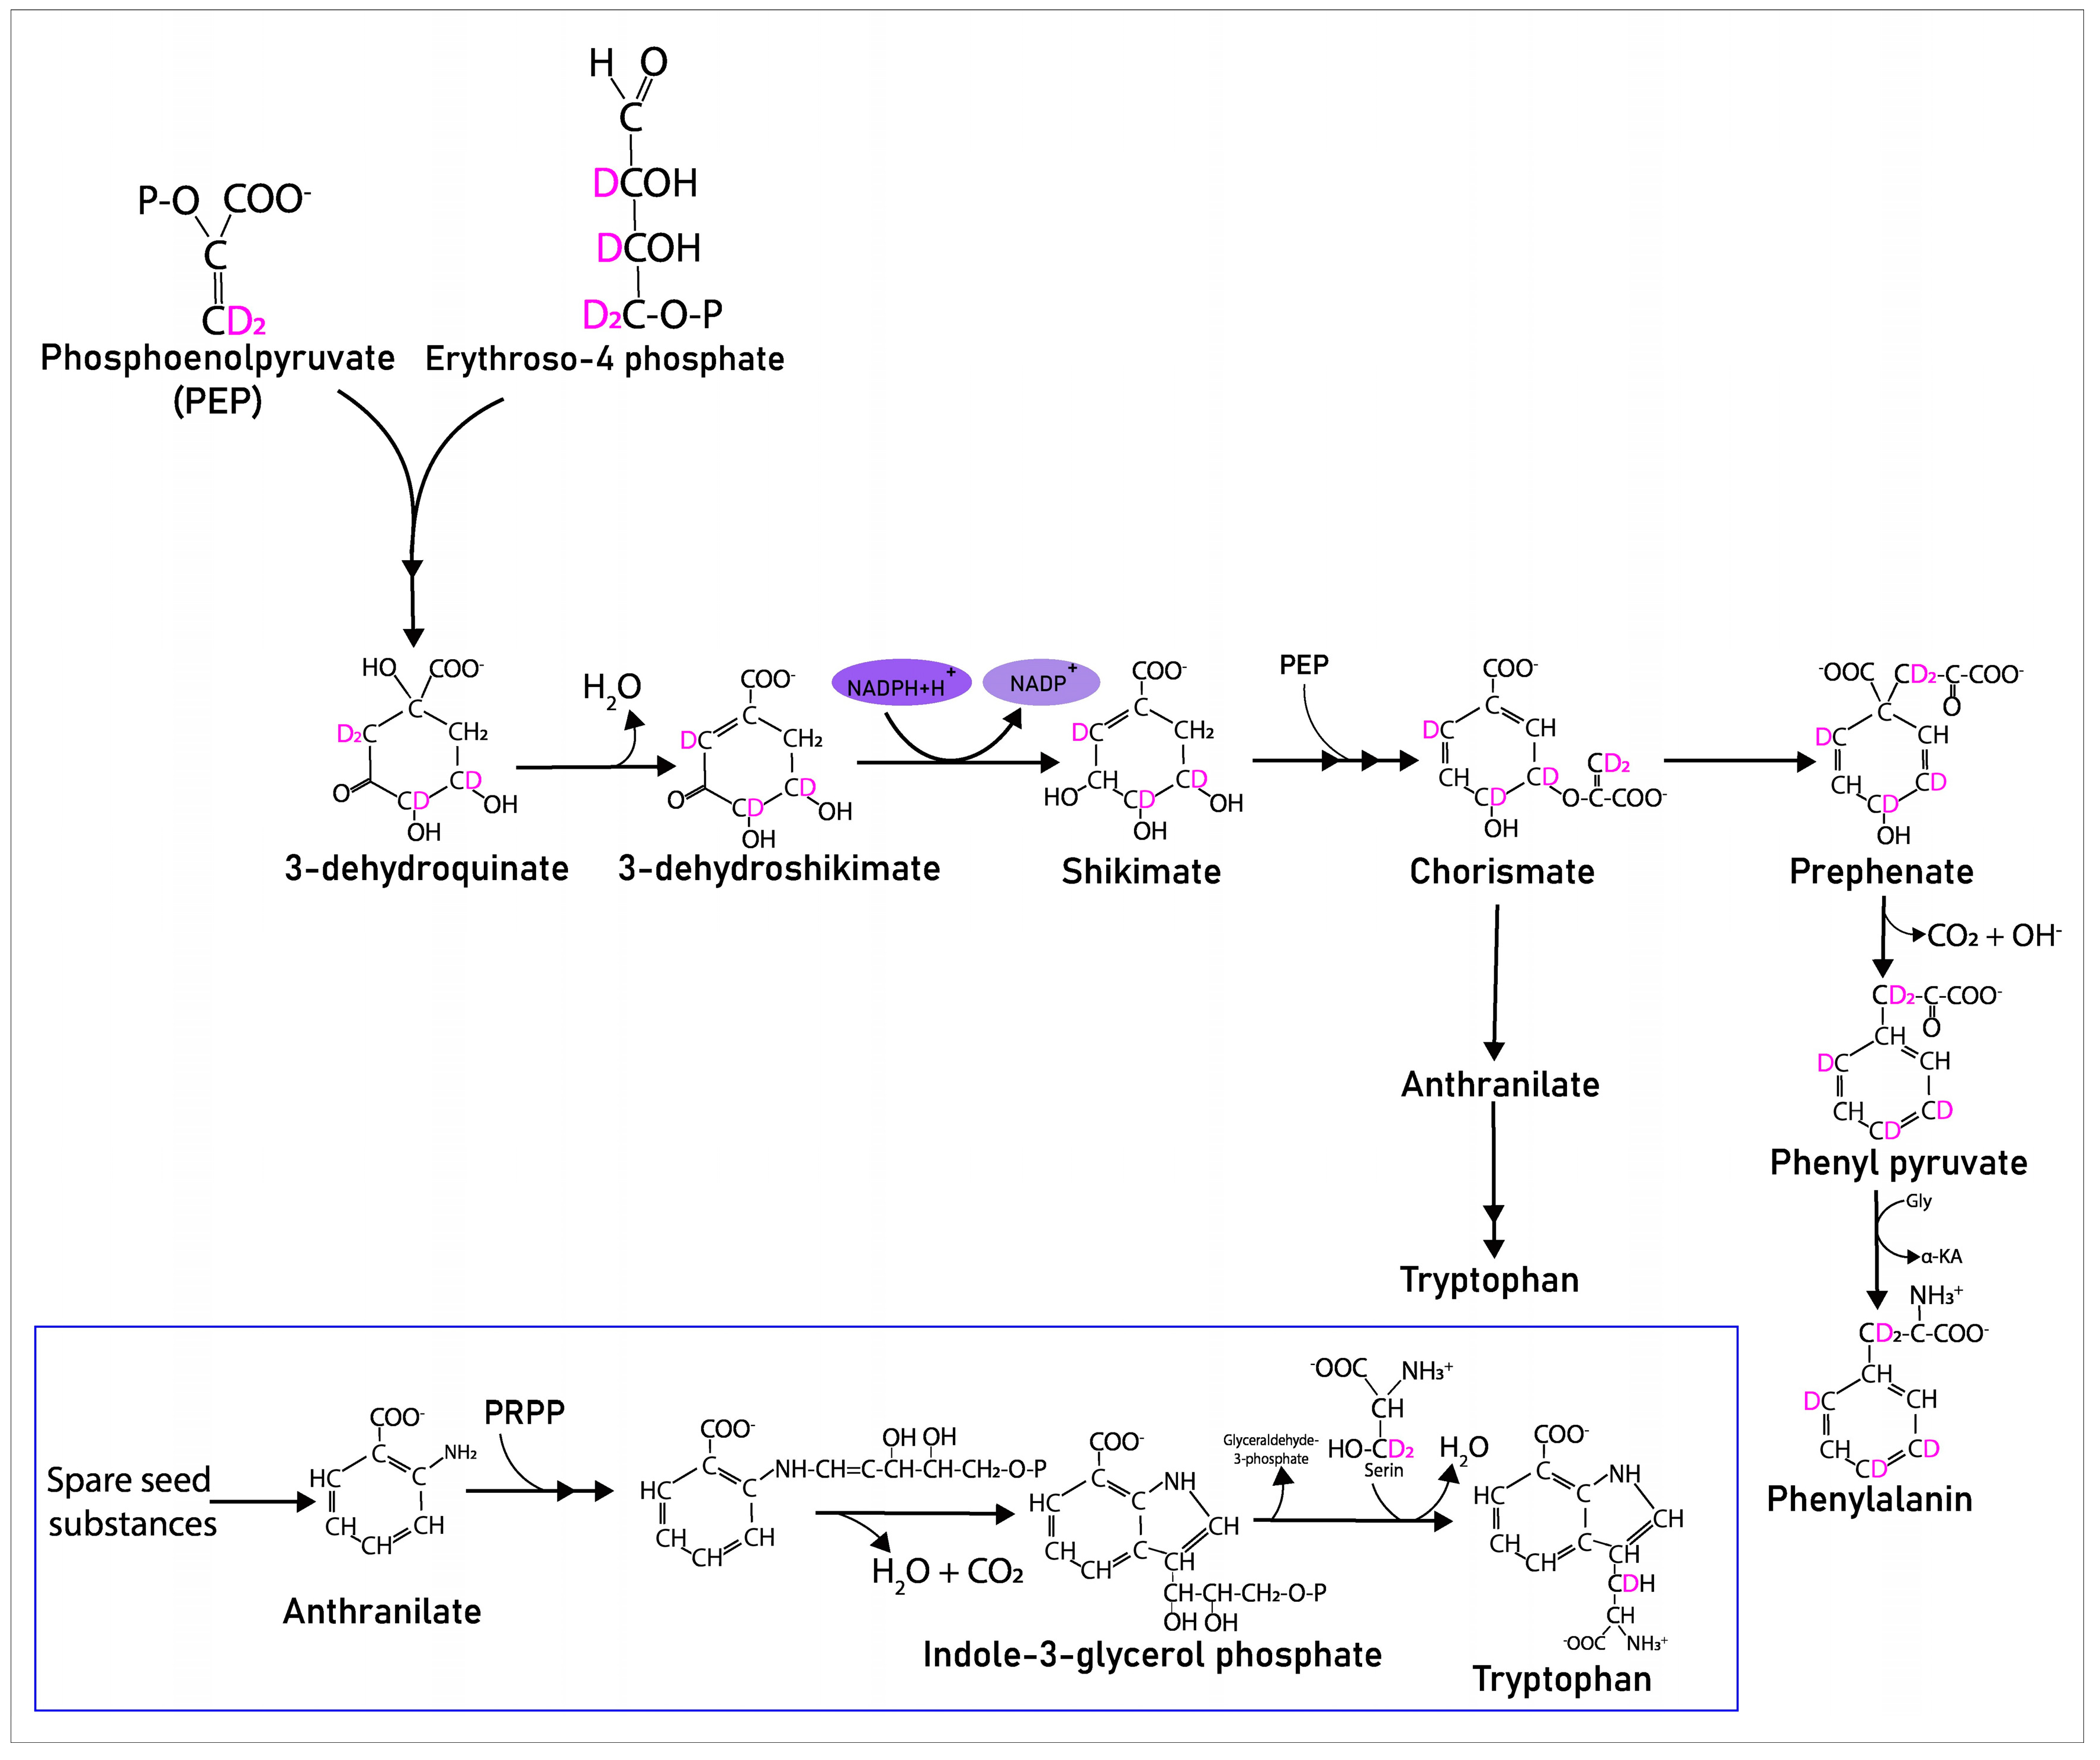
2.2. The Contribution of the Isotope Exchange Reaction

For malic acid, it was demonstrated that oxygen-18O incorporation may not only be the result of an exchange reaction but also occurs during biosynthesis. Indeed, in the mass spectrum of malic acid from 18O-labeled garden cress, we observed five inclusions of the 18O atom (Figure 2A,B). Four exchanges of carboxyl oxygen atoms were expected, but we had to verify if the atom in the hydroxyl group was introduced due to exchange. For verification, we incubated pure malic acid (1 mg/mL) with H218O for 21 days at room temperature; however, only four exchanges were detected (Figure 2C). Therefore, at least one of the five oxygen atoms in malic acid were incorporated into the malic acid molecule as the result of biosynthesis. The mass spectrum of malate from the D2O labeled plant (Figure 2D) demonstrates the inclusion of three deuterium atoms, which indicates that hydrogen atoms from water are also involved in its biosynthesis.
In vivo labeling of primary metabolites. Although the separation method used, based on reversed phase HPLC, is not suitable for polar compounds, which include most of the primary metabolites, we detected amino acids, organic acids, vitamins and carbohydrates. For all detected amino acids, at least two oxygen-18O atoms were observed, most likely due to the isotope exchange reaction. For amino acids with additional oxygen-containing functional groups (glutamine, asparagine, tyrosine and threonine), we detected molecules where all oxygen atoms were replaced by 18O, which reflects the amino acid synthesis. However, for the deuterated plants, the extent of label incorporation was different for various amino acids. For example, for tryptophan, only one deuterium atom was detected, while for phenylalanine we observed an ion with 5 deuterium atoms. Both compounds are produced in the shikimate metabolic pathway; however, the deuterium label in tryptophan is located in the aliphatic chain, while for phenylalanine, labeling of the aromatic ring is observed according to the MS/MS data. A possible explanation is that tryptophan precursors (anthranilate or indole) originated from seeds, while phenylalanine predecessors were also formed during germination.
In vivo labeling of secondary metabolites. A number of known secondary metabolites were detected and identified by MS/MS in the garden cress samples, including sinapic acid derivatives, glucosinolates [47,48] and flavonoids. Figure 3 shows the mass spectra of glucotropaeolin and 4-methoxyglucobrassicin, which were reported to be major representatives of the glucosinolate class in garden cress [49]. Although these compounds are structurally similar, glucotropaeolin likely originates from seeds, while 4-methoxyglucobrassicin demonstrates extensive labeling. The MS/MS spectra of its 18O-labeled analogue indicates that the labels are not only in the glucose residue, but also in the sulfonic group.
Figure 4 shows the mass spectra of sinapoyl malate from labeled and non-labeled garden cress. Sinapoyl malate handles three deuterium and six 18O labels, and in-ESI fragmentation shows that all the deuterium atoms are in the malate residue, while 18O is also in the sinapinic acid fragment. We also did not observe any evidence of sinapic acid biosynthesis when studying the mass spectra of its other derivatives. Thus, sinapine demonstrates no exchanges, and sinapoyl hexose and sinapoyl dihexose carry the labels only in carbohydrate fragments. Figure 5 shows an extracted ion chromatogram for sinapoyl hexose and the mass spectra of all corresponding detected peaks. These peaks are not distinguishable by the fragmentation; however, they demonstrate the differing extents of label incorporation.

3. Discussion

Garden cress (Lepidium sativum) is a fast-growing edible herb, and its chemical composition has previously been estimated, with the main focuses on nutritional value [50,51,52], seed oil composition [49,53,54,55,56] or phenolic content [54,57,58,59,60,61,62,63]. Garden cress has been used as a model plant to investigate the metabolism of xenobiotics [64,65,66,67] due its ability for hydroponic cultivation in the laboratory and fast growth. Being well-characterized and easy to handle, Lepidium sativum was chosen as a model plant for experiments with heavy-water-enrichment experiments.
A wide range of plant primary and secondary metabolites can be easily labeled in vivo by germinating plants in D2O or H218O with their reasonable consumption of heavy water. High-resolution mass spectrometry allows the measuring of the number of incorporated heavy atoms by counting the characteristic mass shifts with m/z 1.0063 and 2.0042 for deuterium and 18O, respectively. The main advantage of HRMS is its capability to distinguish between isotopologues; this, in turn, allows us to detect traces of incorporated labels. Low resolution techniques, including conventional GC–MS, also have the capability to detect label incorporation via comparing the isotopic distributions in mass spectra (Figure 6). However, the determination of the replaced atoms by GC–MS is more complicated. First, as most GCs are equipped with low-resolution quadrupole mass analyzers, it is impossible to assign the last peaks of the isotopic distribution with a correct annotation, as they may correspond to external labeling, natural 13C isotopes or to the noise/co-eluting compounds. In addition, the resolution of quadrupole instruments may be insufficient to resolve co-eluting compounds. The last problem is related to the electron ionization technique, which causes intensive fragmentation, and in many cases the molecular ion is not registered. As a result, different ions may have different numbers of labels. For example, in the electron ionization mass spectrum of leucine 2TMS derivative, a mass shift of ions with m/z 158 was detected only in the deuterium-labeled sample, while the peak with m/z 147 shifted in the H218O-labeled sample. The reason for this is that the ion with m/z 158 does not contain oxygen atoms.
It is well known that the labile hydrogen atoms as well as oxygen atoms from some functional groups can be replaced by their heavy isotopes if a molecule is placed into the heavy isotope-enriched media [32]. This effect should be kept in mind since it may influence the interpretation of the results of in vivo plant labeling. In particular, it may be not clear if the incorporation of the isotope label is the result of biosynthesis or if it is observed due to the isotope exchange equilibrium. As for H/D exchange, this should affect the results to less of an extent because of fast exchange rates in small molecules. As a result, all the exchanged labile atoms will back-exchange during sample preparation and chromatographic separation. Therefore, all the observed deuterium atoms are skeletal (from C-H groups), and their appearance clearly indicates that they were introduced during biosynthesis. On the other hand, 16O/18O exchange is rather slow, and the introduced label is stable. Previously, we reported 16O/18O exchange to occur in carbonyl, carboxyl groups and hydroxyl groups in allyl and benzyl positions and in carbohydrates [36,37,38].
Moreover, our results, as shown with the example of malic acid, demonstrate that the 18O label is included in metabolites both due to the equilibrium and during biosynthesis. These results are in accordance with the common knowledge regarding the tricarboxylic acid cycle.
It is worth noting that malate in plants can also be produced in the glyoxylate cycle and the malate-oxaloacetate shuttle. However, as shown in Figure 7B,C, malate with three deuterium atoms and one 18O cannot be produced using D2O and H218O as the labeling source. If we follow the transformations of substances in the Krebs cycle (Figure 7A), it can be seen that the inclusion of deuterium and 18O can occur in two reactions involving water (Figure 7A, reaction number one—catalyzed by fumarase, reaction number 4—catalyzed by aconitase), and only due to the cyclic nature of the process and the symmetry of some intermediates, deuterium and oxygen can be included in the composition of the malate in the observed MS spectra number. Thus, we assume that the glyoxylate pathway and the malate-oxaloacetate shuttle are not extensively expressed in the studied plants.
Stable isotope in vivo labeling provides information not only on active metabolic pathways, but also highlights the particular reactions that occur during germination. For example, tryptophan and phenylalanine are produced by plants in the shikimate metabolic pathway [68,69,70]. Since we have observed five deuterium atoms in phenylalanine, and at least some of them are in the aromatic ring, we can assume that phenylalanine was synthesized from the initial precursors of the shikimate biosynthesis pathway (Figure 8) and consider this pathway active. However, tryptophan has only one deuterium atom in its aliphatic chain. This seems strange because if it was synthesized by the shikimate biosynthesis pathway, at least two deuterium atoms should have entered into its aromatic ring from its common precursors with phenylalanine. From this, we can assume that anthranilic acid, formed in the shikimate pathway, was not synthesized during germination. It is likely that anthranilic acid accumulates during the formation of seeds in the female plant before their germination. Anthranilic acid is the predecessor of indole, which condenses with serine to form tryptophan. Although serine was not detected with LC–MS analysis, we could calculate the amount of deuterium from its 3TMS derivative in GC–MS analysis and found that serine has three deuterium labels. Serine reacting with indole results in H2O elimination, and in this case at least two deuterium atoms should be found in tryptophan formed from serine-d3. Perhaps, one deuterium is lost during proton migration in the transformations of serine bound to pyridoxal phosphate (a tryptophan synthase coenzyme that performs the final stage of tryptophan synthesis). Here, we have a contradiction that will be the subject of a separate study with additional experiments.
Stable in vivo labeling also allows us to highlight active pathways that lead to the formation of secondary metabolites. The example of sinapoyl malate shows that compounds originating from seeds may interact with newly biosynthesized primary metabolites. Similar observations were made for alkaloid lepidine and semilepidinosides [71]. While lepidines demonstrated no inclusions of heavy isotopes, their glycosides contain both deuterium and 18O atoms. For glucosinolates, it was shown that very similar compounds of the same class may be produced at different stages of germination. Thus, there is no evidence of the active synthesis of glucotropaeolin, while for 4-methoxyglucobrassicin we observed labeling in not only the glucose residue but also in the sulfonic group and the aglycone.
The example of sinapoyl hexose demonstrates that, in some cases, stable in vivo labeling may provide an additional dimension for distinguishing between isomeric compounds. In this particular case, four isomers have similar MS/MS spectra and differ only by their retention time. Therefore, for their correct annotation, reference materials are required. At the same time, different labeling extents allow us to make assumptions regarding the structures of metabolites considering their biosynthesis pathways.

4. Materials and Methods

4.1. Plant Germination and Sample Preparation

Approximately 100 mg of garden cress seeds were sterilized with 70% ethanol, placed into 12 mL glass vials with caps, and 0.3 mL of the corresponding media was added (Day 0). On day 1, 0.9 mL of media was added; on days 4, 7 and 9, we added an additional 0.6 mL of media. Caps were closed to reduce the evaporation of heavy water. Deionized D2O:H2O (1:1 v/v) and H218O:H2O (1:1 v/v) water mixtures were used as media. On day 12, plants were taken out of the vials and flushed with deionized water to remove seed coatings.
Plants were homogenized with 70% ice-cold methanol (1 mL per 50 mg of fresh plant weight) with a manual homogenizer. Homogenates were centrifuged at 14,000 rpm, and aliquots of 1.5 mL were evaporated to dryness before being re-dissolved in 1 mL of water.
Solid-phase extraction cartridges (Agilent Bond Elut C18, 3 mL, 100 mg sorbent) were conditioned with 2 mL of methanol and equilibrated with 2 mL of 2% formic acid. After application of 1 mL of the sample, the cartridge was flushed with 2 mL of 2% formic acid and the sample was eluted with 2 mL of acetonitrile. The eluate was evaporated to dryness under vacuum at room temperature, and the residue was re-dissolved in 200 μL of deionized water and put into a micro vial for LC–MS analysis.
To prepare samples for GC–MS analysis, SPE eluate was evaporated in a glass vial (nominal volume 2 mL) under vacuum at room temperature. Residues were dissolved in 50 mkl ethyl acetate: BSTFA (with 1% TMCS) (1:1) mixture and incubated at 60 °C for 30 min. Probes were transferred into a glass inserter and placed into a GC–MS autosampler.

4.2. LC–MS Analysis

LC–MS analysis was performed on a Q Exactive system (Thermo Scientific Inc., Waltham, MA, USA) coupled with an ACQUITY UPLC system (Waters Corp., Milford, MA, USA). Separation was performed on an ACQUITY UPLC BEH C18 column (2.1 × 100 mm, 1.7 μ) in the following gradient: 5% mobile phase B at 0–5 min, 5% to 75% mobile phase B at 5–25 min, 75% to 100% mobile phase B at 25–26 min, 100% B at 26–33 min, 100% to 5% mobile phase B at 33–35 min, 5% mobile phase B at 35–40 min. The flow rate was set at 0.4 mL min−1. Column temperature was maintained at 60 °C. Solutions of 0.1% formic acid in water and acetonitrile were used as mobile phases A and B, respectively. MS analysis was performed in both ESI-positive and negative modes with ESI voltages of 4.5 kV, and 3.5 kV. Data acquisition was performed in DDA mode (Top10) with stepped collision energy (10, 30, 45 V). Resolution and automatic gain control (AGC) were set at 70,000 and 5 × 10⁵ for MS1 and 17,500 and 5 × 10⁴ for MS2. The isolation window was set at 0.4 Da. A representative TIC can be found in Figure S2.

4.3. GC–MS Analysis

For analysis, a GC–MS system was used that consisted of a capillary gas chromatograph Agilent 6890 (Agilent, Santa Clara, CA, USA) and an MS detector Agilent 5973N (Agilent, Santa Clara, CA, USA). The column used for analysis was an Agilent HP-5ms column (30 m × 0.25 mm × 0.25 μm). The initial temperature of 60 °C was maintained for 2 min, then ramped up to 290 °C at 10 °C/min and held for 20 min. The injection port temperature was 280 °C, the injection volume was 1 μL and injector was operated in splitless mode. The carrier gas was high-purity helium at a flow rate of 0.9 mL/min. Electron ionization was used with an ionization energy of 70 eV, transmission line temperature of 280 °C, ion source temperature of 230 °C and scan range of 50–550 m/z. Solvent delay was set to 5 min.

4.4. Data Processing

LC–MS data was processed with XCalibur 4.0 and Compound Discoverer 3.3 software (Thermo Scientific, Inc.) and with MS Dial [72,73]. A common routine including peak picking, deconvolution and deisotoping was used to detect components. For primary components annotation, accurate masses and MS/MS spectra of detected components were searched against the mzCloud and MassBank [74] databases with either Compound Discoverer or with MS Dial 4.20 software. Delta m/z was set at 10 ppm and the annotation score threshold was set at 85. Additionally, we performed a targeted search of compounds that were previously reported to be found in Lepidium sativum. These compounds were searched by accurate mass and the annotation was confirmed via the manual interpretation of MS/MS spectra. An example interpretation is presented in Figure S1. All the annotations were checked manually to increase the confidence in the results.
GC–MS data were analyzed with ChemStation Data Analysis E.02.02.1431 software. Components from GC–MS data were finally determined using AMDIS software and annotated with a library search against the NIST20 library with a match factor threshold of 85. The Top-1 candidate is reported.

4.5. Data Availability

Raw data are available via the following link: https://drive.google.com/file/d/1j5mpxW5hgdQp40CcKsB3XuQ6UI-KnJAU/view?usp=sharing (accessed 31 August 2023).

5. Conclusions

Stable isotope in vivo labeling of plants with D2O and H218O followed by a combination of LC–HRMS and conventional GC–MS analysis may provide new insights into plant metabolic pathways and aid metabolite annotation. Varying the design of in vivo labeling experiments may be a subject of future studies to investigate metabolism at particular stages of germination or to evaluate the effects of external conditions on the metabolome and metabolic pathways.

Supplementary Materials

The supporting information can be downloaded at: https://www.mdpi.com/article/10.3390/ijms242015396/s1.

Author Contributions

Conceptualization—S.O. and A.V.; experiments—S.O. and L.R.; sample preparation—L.R.; HPLC–MS—S.O. and B.T.; GC–MS—A.B.; data processing—A.V., L.R., S.O., A.B., A.K. (Albert Kireev), A.K. (Anna Kovalenko) and A.L.; writing—S.O., A.B., A.V., Y.K. and E.N. All authors have read and agreed to the published version of the manuscript.

Funding

This research was funded by RSF grant N 18-79-10127.

Institutional Review Board Statement

Not applicable.

Informed Consent Statement

Not applicable.

Data Availability Statement

All data can be requested from authors.

Conflicts of Interest

The authors declare no conflict of interest.

References

  1. Kisiel, A.; Krzemińska, A.; Cembrowska-Lech, D.; Miller, T. Data Science and Plant Metabolomics. Metabolites 2023, 13, 454. [Google Scholar] [CrossRef]
  2. Zhu, M.Z.; Chen, G.L.; Wu, J.L.; Li, N.; Liu, Z.H.; Guo, M.Q. Recent development in mass spectrometry and its hyphenated techniques for the analysis of medicinal plants. Phytochem. Anal. 2018, 29, 365–374. [Google Scholar] [CrossRef]
  3. Ruttkies, C.; Schymanski, E.L.; Strehmel, N.; Hollender, J.; Neumann, S.; Williams, A.J.; Krauss, M. Supporting non-target identification by adding hydrogen deuterium exchange MS/MS capabilities to MetFrag. Anal. Bioanal. Chem. 2019, 411, 4683–4700. [Google Scholar] [CrossRef] [PubMed]
  4. Kostyukevich, Y.; Sosnin, S.; Osipenko, S.; Kovaleva, O.; Rumiantseva, L.; Kireev, A.; Zherebker, A.; Fedorov, M.; Nikolaev, E.N. PyFragMS—A Web Tool for the Investigation of the Collision-Induced Fragmentation Pathways. ACS Omega 2022, 7, 9710–9719. [Google Scholar] [CrossRef] [PubMed]
  5. Osipenko, S.; Bashkirova, I.; Sosnin, S.; Kovaleva, O.; Fedorov, M.; Nikolaev, E.; Kostyukevich, Y. Machine learning to predict retention time of small molecules in nano-HPLC. Anal. Bioanal. Chem. 2020, 412, 7767–7776. [Google Scholar] [CrossRef] [PubMed]
  6. Osipenko, S.; Botashev, K.; Nikolaev, E.; Kostyukevich, Y. Transfer learning for small molecule retention predictions. J. Chromatogr. A 2021, 1644, 462119. [Google Scholar] [CrossRef]
  7. Osipenko, S.; Nikolaev, E.; Kostyukevich, Y. Retention Time Prediction with Message-Passing Neural Networks. Separations 2022, 9, 291. [Google Scholar] [CrossRef]
  8. Capellades, J.; Navarro, M.; Samino, S.; Garcia-Ramirez, M.; Hernandez, C.; Simo, R.; Vinaixa, M.; Yanes, O. geoRge: A computational tool to detect the presence of stable isotope labeling in LC/MS-based untargeted metabolomics. Anal. Chem. 2016, 88, 621–628. [Google Scholar] [CrossRef]
  9. Klein, S.; Heinzle, E. Isotope labeling experiments in metabolomics and fluxomics. Wiley Interdiscip. Rev. Syst. Biol. Med. 2012, 4, 261–272. [Google Scholar] [CrossRef]
  10. Bueschl, C.; Krska, R.; Kluger, B.; Schuhmacher, R. Isotopic labeling-assisted metabolomics using LC–MS. Anal. Bioanal. Chem. 2013, 405, 27–33. [Google Scholar] [CrossRef]
  11. Pang, Q.; Zhang, T.; Wang, Y.; Kong, W.; Guan, Q.; Yan, X.; Chen, S. Metabolomics of early stage plant cell–microbe interaction using stable isotope labeling. Front. Plant Sci. 2018, 9, 760. [Google Scholar] [CrossRef]
  12. Huang, X.; Regnier, F.E. Differential metabolomics using stable isotope labeling and two-dimensional gas chromatography with time-of-flight mass spectrometry. Anal. Chem. 2008, 80, 107–114. [Google Scholar] [CrossRef] [PubMed]
  13. Pinnick, K.E.; Gunn, P.J.; Hodson, L. Measuring human lipid metabolism using deuterium labeling: In vivo and in vitro protocols. In Metabolic Signaling Methods and Protocols; Springer: Berlin/Heidelberg, Germany, 2019; pp. 83–96. [Google Scholar]
  14. Dufner, D.; Previs, S.F. Measuring in vivo metabolism using heavy water. Curr. Opin. Clin. Nutr. Metab. Care 2003, 6, 511–517. [Google Scholar] [CrossRef]
  15. Diraison, F.; Pachiaudi, C.; Beylot, M. In vivo measurement of plasma cholesterol and fatty acid synthesis with deuterated water: Determination of the average number of deuterium atoms incorporated. Metabolism 1996, 45, 817–821. [Google Scholar] [CrossRef] [PubMed]
  16. Castro-Perez, J.; Previs, S.F.; McLaren, D.G.; Shah, V.; Herath, K.; Bhat, G.; Johns, D.G.; Wang, S.-P.; Mitnaul, L.; Jensen, K. In vivo D2O labeling to quantify static and dynamic changes in cholesterol and cholesterol esters by high resolution LC/MS. J. Lipid Res. 2011, 52, 159–169. [Google Scholar] [CrossRef] [PubMed]
  17. Åstot, C.; Dolezal, K.; Moritz, T.; Sandberg, G. Deuterium in vivo labelling of cytokinins in Arabidopsis thaliana analysed by capillary liquid chromatography/frit-fast atom bombardment mass spectrometry. J. Mass Spectrom. 2000, 35, 13–22. [Google Scholar] [CrossRef]
  18. Tarkowski, P.; Floková, K.; Václavíková, K.; Jaworek, P.; Raus, M.; Nordström, A.; Novák, O.; Doležal, K.; Šebela, M.; Frébortová, J. An Improved in Vivo Deuterium Labeling Method for Measuring the Biosynthetic Rate of Cytokinins. Molecules 2010, 15, 9214–9229. [Google Scholar] [CrossRef]
  19. Pengelly, W.L.; Bandurski, R.S. Analysis of Indole-3-acetic Acid Metabolism in Zea mays Using Deuterium Oxide as a Tracer 1. Plant Physiol. 1983, 73, 445–449. [Google Scholar] [CrossRef]
  20. Lerma, C.; Hanson, A.D.; Rhodes, D. Oxygen-18 and Deuterium Labeling Studies of Choline Oxidation by Spinach and Sugar Beet 1. Plant Physiol. 1988, 88, 695–702. [Google Scholar] [CrossRef]
  21. Ippel, J.H.; Pouvreau, L.; Kroef, T.; Gruppen, H.; Versteeg, G.; van den Putten, P.; Struik, P.C.; van Mierlo, C.P.M. In vivo uniform 15N-isotope labelling of plants: Using the greenhouse for structural proteomics. Proteomics 2004, 4, 226–234. [Google Scholar] [CrossRef]
  22. Cegelski, L.; Schaefer, J. Glycine metabolism in intact leaves by in vivo 13C and 15N labeling. J. Biol. Chem. 2005, 280, 39238–39245. [Google Scholar] [CrossRef]
  23. Hasunuma, T.; Harada, K.; Miyazawa, S.-I.; Kondo, A.; Fukusaki, E.; Miyake, C. Metabolic turnover analysis by a combination of in vivo 13C-labelling from 13CO2 and metabolic profiling with CE-MS/MS reveals rate-limiting steps of the C3 photosynthetic pathway in Nicotiana tabacum leaves. J. Exp. Bot. 2010, 61, 1041–1051. [Google Scholar] [CrossRef]
  24. Cegelski, L.; Schaefer, J. NMR determination of photorespiration in intact leaves using in vivo 13CO2 labeling. J. Magn. Reson. 2006, 178, 1–10. [Google Scholar] [CrossRef] [PubMed]
  25. Huege, J.; Sulpice, R.; Gibon, Y.; Lisec, J.; Koehl, K.; Kopka, J. GC-EI-TOF-MS analysis of in vivo carbon-partitioning into soluble metabolite pools of higher plants by monitoring isotope dilution after 13CO2 labelling. Phytochemistry 2007, 68, 2258–2272. [Google Scholar] [CrossRef] [PubMed]
  26. Kutzner, E.; Manukyan, A.; Eisenreich, W. Profiling of terpene metabolism in 13CO2-labelled Thymus transcaucasicus. Metabolomics 2014, 4, 2153–07691000129. [Google Scholar]
  27. Kikuchi, J.; Shinozaki, K.; Hirayama, T. Stable isotope labeling of Arabidopsis thaliana for an NMR-based metabolomics approach. Plant Cell Physiol. 2004, 45, 1099–1104. [Google Scholar] [CrossRef] [PubMed]
  28. Damont, A.; Legrand, A.; Cao, C.; Fenaille, F.; Tabet, J.-C. Hydrogen/deuterium exchange mass spectrometry in the world of small molecules. Mass Spectrom. Rev. 2023, 42, 1300–1331. [Google Scholar] [CrossRef]
  29. Kipping, M.; Schierhorn, A. Improving hydrogen/deuterium exchange mass spectrometry by reduction of the back-exchange effect. J. Mass Spectrom. 2003, 38, 271–276. [Google Scholar] [CrossRef]
  30. Liu, D.Q.; Hop, C.E.C.A.; Beconi, M.G.; Mao, A.; Chiu, S.H.L. Use of on-line hydrogen/deuterium exchange to facilitate metabolite identification. Rapid Commun. Mass Spectrom. 2001, 15, 1832–1839. [Google Scholar] [CrossRef]
  31. Liu, T.; Du, F.; Wan, Y.; Zhu, F.; Xing, J. Rapid identification of phase I and II metabolites of artemisinin antimalarials using LTQ-Orbitrap hybrid mass spectrometer in combination with online hydrogen/deuterium exchange technique. J. Mass Spectrom. 2011, 46, 725–733. [Google Scholar] [CrossRef]
  32. Kostyukevich, Y.; Acter, T.; Zherebker, A.; Ahmed, A.; Kim, S.; Nikolaev, E. Hydrogen/deuterium exchange in mass spectrometry. Mass Spectrom. Rev. 2018, 37, 811–853. [Google Scholar] [CrossRef]
  33. Osipenko, S.; Nikolaev, E.; Kostyukevich, Y. Amine additives for improved in-ESI H/D exchange. Analyst 2022, 147, 3180–3185. [Google Scholar] [CrossRef]
  34. Lam, W.; Ramanathan, R. In electrospray ionization source hydrogen/deuterium exchange LC-MS and LC-MS/MS for characterization of metabolites. J. Am. Soc. Mass Spectrom. 2002, 13, 345–353. [Google Scholar] [CrossRef]
  35. Shi, C.; Jia, H.; Chen, S.; Huang, J.; Peng, Y.e.; Guo, W. Hydrogen/deuterium exchange aiding metabolite identification in single-cell nanospray high-resolution mass spectrometry analysis. Anal. Chem. 2021, 94, 650–657. [Google Scholar] [CrossRef]
  36. Osipenko, S.; Zherebker, A.; Rumiantseva, L.; Kovaleva, O.; Nikolaev, E.N.; Kostyukevich, Y. Oxygen Isotope Exchange Reaction for Untargeted LC–MS Analysis. J. Am. Soc. Mass Spectrom. 2022, 33, 390–398. [Google Scholar] [CrossRef]
  37. Rumiantseva, L.; Osipenko, S.; Zharikov, A.; Kireev, A.; Nikolaev, E.N.; Kostyukevich, Y. Analysis of 16O/18O and H/D Exchange Reactions between Carbohydrates and Heavy Water Using High-Resolution Mass Spectrometry. Int. J. Mol. Sci. 2022, 23, 3585. [Google Scholar] [CrossRef] [PubMed]
  38. Rumiantseva, L.; Osipenko, S.; Podolskiy, I.I.; Burmykin, D.A.; Kovaleva, O.; Nikolaev, E.N.; Kostyukevich, Y. Increasing the reliability of compound identification in biological samples using 16O/18O-exchange mass spectrometry. Anal. Bioanal. Chem. 2022, 414, 2537–2543. [Google Scholar] [CrossRef] [PubMed]
  39. Tupertsev, B.; Osipenko, S.; Kireev, A.; Nikolaev, E.; Kostyukevich, Y. Simple In Vitro 18O Labeling for Improved Mass Spectrometry-Based Drug Metabolites Identification: Deep Drug Metabolism Study. Int. J. Mol. Sci. 2023, 24, 4569. [Google Scholar] [CrossRef]
  40. Ling-Fei, K.; Yu-Nan, C.; Pan, Y.; Tuo, Q.; Xin-Tang, W.; Rui-Qi, L.; Xiao-Juan, R.; Cai, T. 16O/18O-exchange internal standard preparation enhancing reliability of bio-sample natural bioactive compounds absolute quantitation. J. Chromatogr. B 2023, 1219, 123651. [Google Scholar] [CrossRef]
  41. Hegeman, A.D.; Schulte, C.F.; Cui, Q.; Lewis, I.A.; Huttlin, E.L.; Eghbalnia, H.; Harms, A.C.; Ulrich, E.L.; Markley, J.L.; Sussman, M.R. Stable Isotope Assisted Assignment of Elemental Compositions for Metabolomics. Anal. Chem. 2007, 79, 6912–6921. [Google Scholar] [CrossRef] [PubMed]
  42. Kera, K.; Fine, D.D.; Wherritt, D.J.; Nagashima, Y.; Shimada, N.; Ara, T.; Ogata, Y.; Sumner, L.W.; Suzuki, H. Pathway-specific metabolome analysis with 18O2-labeled Medicago truncatula via a mass spectrometry-based approach. Metabolomics 2018, 14, 71. [Google Scholar] [CrossRef]
  43. Ando, S.; Tanaka, Y.; Toyoda, Y.; Kon, K. Turnover of myelin lipids in aging brain. Neurochem. Res. 2003, 28, 5–13. [Google Scholar] [PubMed]
  44. Schoenheimer, R.; Rittenberg, D. The application of isotopes to the study of intermediary metabolism. Science 1938, 87, 221–226. [Google Scholar]
  45. Duarte, J.A.G.; Carvalho, F.; Pearson, M.; Horton, J.D.; Browning, J.D.; Jones, J.G.; Burgess, S.C. A high-fat diet suppresses de novo lipogenesis and desaturation but not elongation and triglyceride synthesis in mice. J. Lipid Res. 2014, 55, 2541–2553. [Google Scholar] [PubMed]
  46. Kostyukevich, Y.; Stekolshikova, E.; Levashova, A.; Kovalenko, A.; Vishnevskaya, A.; Bashilov, A.; Kireev, A.; Tupertsev, B.; Rumiantseva, L.; Khaitovich, P.; et al. Untargeted Lipidomics after D2O Administration Reveals the Turnover Rate of Individual Lipids in Various Organs of Living Organisms. Int. J. Mol. Sci. 2023, 24, 11725. [Google Scholar] [CrossRef] [PubMed]
  47. Rochfort, S.J.; Trenerry, V.C.; Imsic, M.; Panozzo, J.; Jones, R. Class targeted metabolomics: ESI ion trap screening methods for glucosinolates based on MSn fragmentation. Phytochemistry 2008, 69, 1671–1679. [Google Scholar] [CrossRef] [PubMed]
  48. Mohn, T.; Cutting, B.; Ernst, B.; Hamburger, M. Extraction and analysis of intact glucosinolates—A validated pressurized liquid extraction/liquid chromatography–mass spectrometry protocol for Isatis tinctoria, and qualitative analysis of other cruciferous plants. J. Chromatogr. A 2007, 1166, 142–151. [Google Scholar]
  49. Gil, V.; MacLeod, A.J. Studies on glucosinolate degradation in Lepidium sativum seed extracts. Phytochemistry 1980, 19, 1369–1374. [Google Scholar]
  50. Jain, T.; Grover, K. A comprehensive review on the nutritional and nutraceutical aspects of garden cress (Lepidium sativum Linn.). Proc. Natl. Acad. Sci. India Sect. B Biol. Sci. 2018, 88, 829–836. [Google Scholar]
  51. Painuli, S.; Quispe, C.; Herrera-Bravo, J.; Semwal, P.; Martorell, M.; Almarhoon, Z.M.; Seilkhan, A.; Ydyrys, A.; Rad, J.S.; Alshehri, M.M. Nutraceutical profiling, bioactive composition, and biological applications of Lepidium sativum L. Oxidative Med. Cell. Longev. 2022, 2022, 2910411. [Google Scholar]
  52. Lijina, P.; Manjunatha, J.R.; Kumar, B.S.G. Characterization of free oligosaccharides from garden cress seed aqueous exudate using PGC LC-MS/MS and NMR spectroscopy. Carbohydr. Res. 2023, 532, 108914. [Google Scholar] [PubMed]
  53. Alqahtani, F.Y.; Aleanizy, F.S.; Mahmoud, A.Z.; Farshori, N.N.; Alfaraj, R.; Al-Sheddi, E.S.; Alsarra, I.A. Chemical composition and antimicrobial, antioxidant, and anti-inflammatory activities of Lepidium sativum seed oil. Saudi J. Biol. Sci. 2019, 26, 1089–1092. [Google Scholar]
  54. Kaiyrkulova, A.; Li, J.; Aisa, H. Chemical constituents of Lepidium sativum seeds. Chem. Nat. Compd. 2019, 55, 736–737. [Google Scholar]
  55. Singh, B.; Jain, D.; Joshi, A.; Namrata; Dodiya, N.S.; Chauhan, S.; Mittal, J.; Singh, A. Molecular diversity analysis and metabolic profiling of seed oil in Lepidium sativum L. Genotypes. Plant Mol. Biol. Rep. 2020, 38, 641–654. [Google Scholar]
  56. Macleod, A.J.; Islam, R. Volatile flavour components of garden cress. J. Sci. Food Agric. 1976, 27, 909–912. [Google Scholar]
  57. Oszmiański, J.; Kolniak-Ostek, J.; Wojdyło, A. Application of ultra performance liquid chromatography-photodiode detector-quadrupole/time of flight-mass spectrometry (UPLC-PDA-Q/TOF-MS) method for the characterization of phenolic compounds of Lepidium sativum L. sprouts. Eur. Food Res. Technol. 2013, 236, 699–706. [Google Scholar] [CrossRef]
  58. Radwan, H.; El-Missiry, M.; Al-Said, W.; Ismail, A.; Abdel Shafeek, K.; Seif-El-Nasr, M. Investigation of the glucosinolates of Lepidium sativum growing in Egypt and their biological activity. Res. J. Med. Med. Sci. 2007, 2, 127–132. [Google Scholar]
  59. Sakran, M.; Selim, Y.; Zidan, N. A new isoflavonoid from seeds of Lepidium sativum L. and its protective effect on hepatotoxicity induced by paracetamol in male rats. Molecules 2014, 19, 15440–15451. [Google Scholar]
  60. Akash, S.S.; Singh, S.K. Phytoconstituents estimation of Lepidium sativum L. seed extract using GC-MS spectroscopy. World J. Pharm. Res. 2017, 7, 1360–1367. [Google Scholar]
  61. Al-Snafi, A. Chemical constituents and pharmacological effects of Lepidium sativum. Int. J. Curr. Pharm. Res. 2019, 11, 1–10. [Google Scholar]
  62. El-Haggar, M.; El-Hosseiny, L.; Ghazy, N.M.; El-Fiky, F.K.; El-Hawiet, A. Phytochemical investigation, antimicrobial and cytotoxic activities of suspension cultures of Lepidium sativum L. S. Afr. J. Bot. 2021, 138, 500–505. [Google Scholar]
  63. Nazir, S.; El-Sherif, A.A.; Abdel-Ghani, N.T.; Ibrahim, M.A.; Hegazy, M.-E.F.; Atia, M.A. Lepidium sativum secondary metabolites (Essential Oils): In vitro and in silico studies on human hepatocellular carcinoma cell lines. Plants 2021, 10, 1863. [Google Scholar]
  64. Reichl, B.; Himmelsbach, M.; Emhofer, L.; Klampfl, C.W.; Buchberger, W. Uptake and metabolism of the antidepressants sertraline, clomipramine, and trazodone in a garden cress (Lepidium sativum) model. Electrophoresis 2018, 39, 1301–1308. [Google Scholar] [CrossRef]
  65. Emhofer, L.; Himmelsbach, M.; Buchberger, W.; Klampfl, C.W. High-performance liquid chromatography drift-tube ion-mobility quadrupole time-of-flight/mass spectrometry for the identity confirmation and characterization of metabolites from three statins (lipid-lowering drugs) in the model plant cress (Lepidium sativum) after uptake from water. J. Chromatogr. A 2019, 1592, 122–132. [Google Scholar]
  66. Sarvin, B.; Himmelsbach, M.; Baygildiev, T.; Shpigun, O.; Rodin, I.; Stavrianidi, A.; Buchberger, W. Nerve agent markers screening after accumulation in garden cress (Lepidium sativum) used as a model plant object. J. Chromatogr. A 2019, 1597, 214–219. [Google Scholar] [CrossRef] [PubMed]
  67. Mlynek, F.; Himmelsbach, M.; Buchberger, W.; Klampfl, C.W. Time study on the uptake of four different beta-blockers in garden cress (Lepidium sativum) as a model plant. Environ. Sci. Pollut. Res. 2021, 28, 59382–59390. [Google Scholar]
  68. Maeda, H.; Dudareva, N. The Shikimate Pathway and Aromatic Amino Acid Biosynthesis in Plants. Annu. Rev. Plant Biol. 2012, 63, 73–105. [Google Scholar] [CrossRef]
  69. Bentley, R.; Haslam, E. The shikimate pathway—A metabolic tree with many branche. Crit. Rev. Biochem. Mol. Biol. 1990, 25, 307–384. [Google Scholar]
  70. Herrmann, K.M.; Weaver, L.M. The shikimate pathway. Annu. Rev. Plant Biol. 1999, 50, 473–503. [Google Scholar]
  71. Maier, U.H.; Gundlach, H.; Zenk, M.H. Seven imidazole alkaloids from Lepidium sativum. Phytochemistry 1998, 49, 1791–1795. [Google Scholar] [CrossRef]
  72. Tsugawa, H.; Nakabayashi, R.; Mori, T.; Yamada, Y.; Takahashi, M.; Rai, A.; Sugiyama, R.; Yamamoto, H.; Nakaya, T.; Yamazaki, M.; et al. A cheminformatics approach to characterize metabolomes in stable-isotope-labeled organisms. Nat. Methods 2019, 16, 295–298. [Google Scholar] [CrossRef] [PubMed]
  73. Lai, Z.; Tsugawa, H.; Wohlgemuth, G.; Mehta, S.; Mueller, M.; Zheng, Y.; Ogiwara, A.; Meissen, J.; Showalter, M.; Takeuchi, K.; et al. Identifying metabolites by integrating metabolome databases with mass spectrometry cheminformatics. Nat. Methods 2018, 15, 53–56. [Google Scholar] [CrossRef] [PubMed]
  74. Horai, H.; Arita, M.; Kanaya, S.; Nihei, Y.; Ikeda, T.; Suwa, K.; Ojima, Y.; Tanaka, K.; Tanaka, S.; Aoshima, K. MassBank: A public repository for sharing mass spectral data for life sciences. J. Mass Spectrom. 2010, 45, 703–714. [Google Scholar] [CrossRef] [PubMed]
Figure 1. Overview of the proposed in vivo labeling approach. The spectra on the bottom correspond to tryptophan found in non-labeled Lepidium sativum extract and in the extracts of Lepidium sativum, germinated in D2O or H218O water mixtures. Red dashed lines mark shifts in mass spectra, corresponding to heavy atom incorporation.
Ijms 24 15396 g001
Figure 2. Mass spectra of malic acid from unlabeled plant extract (A), plant labeled with H218O (B), pure malic acid after 21-day incubation with H218O (C) and from D2O plant labeled extract (D) in negative ion mode. Red dashed lines indicate shifts in the mass spectrum, corresponding to heavy atom incorporation.
Ijms 24 15396 g002
Figure 3. Mass spectra of glucotropaeolin (right) and 4-methoxyglucobrassicin (left) from isotopically labeled plants. On the bottom figure, the MS/MS of labeled 4-methoxyglucobrassicin is shown.
Ijms 24 15396 g003
Figure 4. Mass spectra of sinapoyl malate from extracts of unlabeled Lepidium sativum seedlings, and of Lepidium sativum labeled in vivo with D2O and H218O.
Ijms 24 15396 g004
Figure 5. Mass spectra of sinapoyl hexose isomers detected in Lepidium sativum samples in vivo-labeled with D2O (left column) and H218O (right column).
Ijms 24 15396 g005
Figure 6. Electron ionization mass spectra of leucine 2TMS derivative from Lepidium sativum sample in vivo-labeled with D2O and H218O.
Ijms 24 15396 g006
Figure 7. Metabolic pathways and the shuttle in which malate is involved. The inclusion of isotopic labels (red O—heavy oxygen atom 18O, pink D—deuterium) is shown. Experimentally, the inclusion of different isotope labels occurred in different experimental systems, not simultaneously. Krebbs cycle (A), Glyoxylate cycle (B), Malate-Oxaliacetate shuttle (C).
Ijms 24 15396 g007
Figure 8. Presumptive inclusion of deuterium into aromatic amino acids during their biosynthesis.
Ijms 24 15396 g008
Table 1. Compounds annotated in Lepidium sativum extracts after in vivo labeling.
CompoundFormulaNumber of Detected DNumber of Detected 18O
ArginineC6H14N4O202
AsparagineC4H8N2O333
AspartateC4H7NO434
GlutamineC5H10N2O353
HistidineC6H9N3O232
IsoleucineC6H13NO262
LeucineC6H13NO262
LysineC6H14N2O212
PhenylalanineC9H11NO252
ThreonineC4H9NO323
TryptophanC11H12N2O212
TyrosineC9H11NO343
ValineC5H11NO252
ProlineC5H9NO212
MethionineC5H11NO2S32
Pyroglutamic acidC5H7NO352
Malic acidC4H6O532
Fumaric acidC4H4O422
Succinic acidC4H6O442
Benzoic acidC7H6O202
Glucose-6-phosphateC6H13O9P52
BetaineC5H11NO262
PhosphocholineC5H15NO4P+02
p-Coumaric acidC9H8O322
Acetyl-L-CarnitineC9H17NO4ND2
GlucotropaeolinC14H19NO9S202
4-methoxyglucobrassicinC17H22N2O10S292
Sinapoyl malateC15H16O932
SinapineC16H24NO502
Kaempferol rhamnose-hexosideC33H40O2002
Semilepidinoside AC16H20N2O662
Semilepidinoside BC17H22N2O782
Lepidine A/CC21H20N4O200
Lepidine B/D/E/FC20H18N4O200
Disclaimer/Publisher’s Note: The statements, opinions and data contained in all publications are solely those of the individual author(s) and contributor(s) and not of MDPI and/or the editor(s). MDPI and/or the editor(s) disclaim responsibility for any injury to people or property resulting from any ideas, methods, instructions or products referred to in the content.

