
Genetic Architecture of Salt Tolerance in Cowpea (Vigna unguiculata (L.) Walp.) at Seedling Stage Using a Whole Genome Resequencing Approach


 ,
, 
Abstract
:1. Introduction
2. Results
2.1. Leaf SPAD Chlorophyll under Salt Stress
2.2. Relative Tolerance Index for Chlorophyll Content
2.3. Leaf Injury Score under Salt Stress
2.4. Protein Homologs and Gene Ontology
2.5. Overlapping SNPs and Functional Annotations
3. Discussion
4. Materials and Methods
4.1. Plant Materials and Phenotyping
4.2. Genotyping
4.2.1. DNA Extraction, Library Preparation, and Whole-Genome Resequencing
4.2.2. SNP Calling, Mapping, and Filtering
4.3. Genome-Wide Association Study (GWAS)
4.4. Candidate Gene Search and Synteny Analysis
5. Conclusions
Supplementary Materials
Author Contributions
Funding
Informed Consent Statement
Data Availability Statement
Conflicts of Interest
References
- Fery, R. The Cowpea: Production, Utilization, and Research in the United States. Hortic. Rev. 1990, 12, 197–222. [Google Scholar]
- Flowers, T.J. Improving Crop Salt Tolerance. J. Exp. Bot. 2004, 55, 307–319. [Google Scholar] [CrossRef] [PubMed]
- Allakhverdiev, S.I.; Sakamoto, A.; Nishiyama, Y.; Inaba, M.; Murata, N. Ionic and Osmotic Effects of NaCl-Induced Inactivation of Photosystems I and II in Synechococcus Sp. Plant Physiol. 2000, 123, 1047–1056. [Google Scholar] [CrossRef] [PubMed]
- Foolad, M. Advances in Molecular Breeding toward Drought and Salt Tolerant Crops; Matthew, A., Jenks, P., Hasegawa, M., Mohan, J.S., Eds.; Springer: New York, NY, USA, 2007; pp. 261–283. [Google Scholar]
- Osmond, C.; Austin, M.; Berry, J. Stress Physiology and the Distribution of Plants. Bioscience 1987, 37, 38–48. [Google Scholar] [CrossRef]
- Chaitanya, K.; Rama Krishna, C.; Venkata Ramana, G.; Khasim Beebi, S. Salinity Stress and Sustainable Agriculture—A Review. Agric. Rev. 2014, 35, 34–41. [Google Scholar] [CrossRef]
- Lee, J.-D.; Smothers, S.L.; Dunn, D.; Villagarcia, M.; Shumway, C.R.; Carter, T.E.; Shannon, J.G. Evaluation of a Simple Method to Screen Soybean Genotypes for Salt Tolerance. Crop Sci. 2008, 48, 2194. [Google Scholar] [CrossRef]
- Valencia, R.; Chen, P.; Ishibashi, T.; Conatser, M. A Rapid and Effective Method for Screening Salt Tolerance in Soybean. Crop Sci. 2008, 48, 1773–1779. [Google Scholar] [CrossRef]
- Ashraf, M.; McNeilly, T. Effect of Salinity on Some Cultivars of Maize. Maydica 1989, 34, 179–189. (In Pakistan) [Google Scholar]
- Läuchli, A.; Lüttge, U. Salinity: Environment-Plants-Molecules; Kluwer Academic Publishers: Dordrecht, The Netherlands, 2002; pp. 229–248. [Google Scholar]
- Ledesma, F.; Lopez, C.; Ortiz, D.; Chen, P.; Korth, K.L.; Ishibashi, T.; Zeng, A.; Orazaly, M.; Florez-Palacios, L. A Simple Greenhouse Method for Screening Salt Tolerance in Soybean. Crop Sci. 2016, 56, 585–594. [Google Scholar] [CrossRef]
- Le Roux, P.; Du Preez, C.; Strydom, M.; Van Rensburg, L.; Bennie, A. Effect of Irrigation on Soil Salinity Profiles along the Lower Vaal River, South Africa. Water SA 2010, 33, 473–478. [Google Scholar] [CrossRef]
- Bui, E.N. Soil Salinity: A Neglected Factor in Plant Ecology and Biogeography. J. Arid Environ. 2013, 92, 14–25. [Google Scholar] [CrossRef]
- Bower, C.A.; Spencer, J.R.; Weeks, L.O. Salt and Water Balance. J. Irrig. Drain. Div. ASCE Proc. 1969, 95, 55–64. [Google Scholar] [CrossRef]
- Wilson, C.; Liu, X.; Lesch, S.; Suarez, D. Growth Response of Major US Cowpea Cultivars. I. Biomass Accumulation and Salt Tolerance. HortScience 2006, 41, 225–230. [Google Scholar] [CrossRef]
- Praxedes, S.C.; De Lacerda, C.F.; DaMatta, F.M.; Prisco, J.T.; Gomes-Filho, E. Salt Tolerance Is Associated with Differences in Ion Accumulation, Biomass Allocation and Photosynthesis in Cowpea Cultivars. J. Agron. Crop Sci. 2010, 196, 193–204. [Google Scholar] [CrossRef]
- Win, K.T.; Oo, A.Z. Genotypic Difference in Salinity Tolerance during Early Vegetative Growth of Cowpea (Vigna unguiculata L. Walp.) from Myanmar. Biocatal. Agric. Biotechnol. 2015, 4, 449–455. [Google Scholar] [CrossRef]
- Lo, S.; Muñoz-Amatriaín, M.; Hokin, S.A.; Cisse, N.; Roberts, P.A.; Farmer, A.D.; Xu, S.; Close, T.J. A Genome-Wide Association and Meta-Analysis Reveal Regions Associated with Seed Size in Cowpea [Vigna unguiculata (L.) Walp]. Theor. Appl. Genet. 2019, 132, 3079–3087. [Google Scholar] [CrossRef]
- Dutta, P.; Bera, A. Effect of NaCl Salinity on Seed Germination and Seedling Growth of Mungbean Cultivars. Legum. Res. Int. J. 2014, 37, 161–164. [Google Scholar] [CrossRef]
- Goenaga, R.; Ayala, T.; Quiles, A. Yield Performance of Cowpea Plant Introductions Grown in Calcareous Soils. Horttechnology 2013, 23, 247–251. [Google Scholar] [CrossRef]
- Cook, D.E.; Bayless, A.M.; Wang, K.; Guo, X.; Song, Q.; Jiang, J.; Bent, A.F. Distinct Copy Number, Coding Sequence, and Locus Methylation Patterns Underlie Rhg1-Mediated Soybean Resistance to Soybean Cyst Nematode. Plant Physiol. 2014, 165, 630–647. [Google Scholar] [CrossRef]
- Elshire, R.J.; Glaubitz, J.C.; Sun, Q.; Poland, J.A.; Kawamoto, K.; Buckler, E.S.; Mitchell, S.E. A Robust, Simple Genotyping-by-Sequencing (GBS) Approach for High Diversity Species. PLoS ONE 2011, 6, e19379. [Google Scholar] [CrossRef]
- Han, Y.; Zhao, X.; Cao, G.; Wang, Y.; Li, Y.; Liu, D.; Teng, W.; Zhang, Z.; Li, D.; Qiu, L.; et al. Genetic Characteristics of Soybean Resistance to HG Type 0 and HG Type 1.2.3.5.7 of the Cyst Nematode Analyzed by Genome-Wide Association Mapping. BMC Genomics 2015, 16, 598. [Google Scholar] [CrossRef] [PubMed]
- Ravelombola, W.; Shi, A.; Weng, Y.; Mou, B.; Motes, D.; Clark, J.; Chen, P.; Srivastava, V.; Qin, J.; Dong, L.; et al. Association Analysis of Salt Tolerance in Cowpea (Vigna unguiculata (L.) Walp) at Germination and Seedling Stages. Theor. Appl. Genet. 2017, 131, 79–91. [Google Scholar] [CrossRef]
- Ravelombola, W.; Dong, L.; Barickman, T.C.; Xiong, H.; Olaoye, D.; Bhattarai, G.; Zia, B.; Alshaya, H.; Alatawi, I.; Shi, A. Evaluation of Salt Tolerance in Cowpea at Seedling Stage. Euphytica 2021, 217, 116. [Google Scholar] [CrossRef]
- Kang, Y.; Sakiroglu, M.; Krom, N.; Stanton-Geddes, J.; Wang, M.; Lee, Y.-C.; Young, N.D.; Udvardi, M. Genome-Wide Association of Drought-Related and Biomass Traits with HapMap SNPs in Medicago Truncatula. Plant. Cell Environ. 2015, 38, 1997–2011. [Google Scholar] [CrossRef] [PubMed]
- Thudi, M.; Khan, A.; Kumar, V. Whole Genome Re-Sequencing Reveals Genome-Wide Variations among Parental Lines of 16 Mapping Populations in Chickpea (Cicer arietinum L.). BMCPlant Biol. 2016, 16, 10. [Google Scholar] [CrossRef]
- Mini, M.L.; Sathya, M.; Arulvadivookarasi, K.; Jayachandran, K.S.; Anusuyadevi, M. Selection of Salt Tolerant Cowpea Genotypes Based on Salt Tolerant Indices of Morpho-Biochemical Traits. Curr. Trends Biotechnol. Pharm. 2015, 9, 306–316. [Google Scholar]
- Maia, J.M.; Voigt, E.L.; Ferreira-Silva, S.L.; Fontenele, A.d.V.; Macêdo, C.E.C.; Silveira, J.A.G. Differences in Cowpea Root Growth Triggered by Salinity and Dehydration Are Associated with Oxidative Modulation Involving Types I and III Peroxidases and Apoplastic Ascorbate. J. Plant Growth Regul. 2013, 32, 376–387. [Google Scholar] [CrossRef]
- Assaha, D.V.M.; Ueda, A.; Saneoka, H.; Al-Yahyai, R.; Yaish, M.W. The Role of Na+ and K+ Transporters in Salt Stress Adaptation in Glycophytes. Front. Physiol. 2017, 8, 509. [Google Scholar] [CrossRef]
- Nan, N.; Wang, J.; Shi, Y.; Qian, Y.; Jiang, L.; Huang, S.; Liu, Y.; Wu, Y.; Liu, B.; Xu, Z. Rice Plastidial NAD-dependent Malate Dehydrogenase 1 Negatively Regulates Salt Stress Response by Reducing the Vitamin B6 Content. Plant Biotechnol. J. 2020, 18, 172–184. [Google Scholar] [CrossRef] [PubMed]
- Korver, R.A.; Koevoets, I.T.; Testerink, C. Out of Shape During Stress: A Key Role for Auxin. Trends Plant Sci. 2018, 23, 783–793. [Google Scholar] [CrossRef]
- Harpaz-Saad, S.; Azoulay, T.; Arazi, T.; Ben-Yaakov, E.; Mett, A.; Shiboleth, Y.M.; Hörtensteiner, S.; Gidoni, D.; Gal-On, A.; Goldschmidt, E.E.; et al. Chlorophyllase Is a Rate-Limiting Enzyme in Chlorophyll Catabolism and Is Posttranslationally Regulated. Plant Cell 2007, 19, 1007–1022. [Google Scholar] [CrossRef]
- Kim, S.J.; Bassham, D.C. Tno1 Is Involved in Salt Tolerance and Vacuolar Trafficking in Arabidopsis. Plant Physiol. 2011, 156, 514–526. [Google Scholar] [CrossRef]
- Qi, X.; Li, M.-W.; Xie, M.; Liu, X.; Ni, M.; Shao, G.; Song, C.; Kay-Yuen Yim, A.; Tao, Y.; Wong, F.-L.; et al. Identification of a Novel Salt Tolerance Gene in Wild Soybean by Whole-Genome Sequencing. Nat. Commun. 2014, 5, 4340. [Google Scholar] [CrossRef] [PubMed]
- Lipka, A.E.; Tian, F.; Wang, Q.; Peiffer, J.; Li, M.; Bradbury, P.J.; Gore, M.A.; Buckler, E.S.; Zhang, Z. GAPIT: Genome Association and Prediction Integrated Tool. Bioinformatics 2012, 28, 2397–2399. [Google Scholar] [CrossRef]
- Ravelombola, W.; Qin, J.; Weng, Y.; Mou, B.; HortScience, A.S.-U. A Simple and Cost-Effective Approach for Salt Tolerance Evaluation in Cowpea (Vigna Unguiculata) Seedlings. HortScience 2019, 54, 1280–1287. [Google Scholar] [CrossRef]
- Fehr, W.R.; Caviness, C.E.; Burmood, D.T.; Pennington, J.S. Stage of Development Descriptions for Soybeans, Glycine max (L.) Merr. Crop Sci. 1971, 11, 929–931. [Google Scholar] [CrossRef]
- Kisha, T.J.; Sneller, C.H.; Diers, B.W. Relationship between Genetic Distance among Parents and Genetic Variance in Populations of Soybean. Crop Sci. 1997, 37, 1317–1325. [Google Scholar] [CrossRef]
- van Dijk, E.L.; Auger, H.; Jaszczyszyn, Y.; Thermes, C. Ten Years of Next-Generation Sequencing Technology. Trends Genet. 2014, 30, 418–426. [Google Scholar] [CrossRef]
- Lonardi, S.; Muñoz-Amatriaín, M.; Liang, Q.; Shu, S.; Wanamaker, S.I.; Lo, S.; Tanskanen, J.; Schulman, A.H.; Zhu, T.; Luo, M.; et al. The Genome of Cowpea (Vigna unguiculata [L.] Walp.). Plant J. 2019, 98, 767–782. [Google Scholar] [CrossRef] [PubMed]
- Li, R.; Yu, C.; Li, Y.; Lam, T.-W.; Yiu, S.-M.; Kristiansen, K.; Wang, J. SOAP2: An Improved Ultrafast Tool for Short Read Alignment. Bioinformatics 2009, 25, 1966–1967. [Google Scholar] [CrossRef]
- Huang, B.E.; George, A.W.; Forrest, K.L.; Kilian, A.; Hayden, M.J.; Morell, M.K.; Cavanagh, C.R. A Multiparent Advanced Generation Inter-Cross Population for Genetic Analysis in Wheat. Plant Biotechnol. J. 2012, 10, 826–839. [Google Scholar] [CrossRef] [PubMed]
- Huang, M.; Cabrera, A.; Hoffstetter, A.; Griffey, C.; Van Sanford, D.; Costa, J.; McKendry, A.; Chao, S.; Sneller, C. Genomic Selection for Wheat Traits and Trait Stability. Theor. Appl. Genet. 2016, 129, 1697–1710. [Google Scholar] [CrossRef] [PubMed]


| Traits | SNP | CHR | BP | Pval | LOD | Gene_ID | Functional_Annotation |
|---|---|---|---|---|---|---|---|
| Leaf SPAD chlorophyll under salt treatment | Vu01_24245081 | 1 | 24245081 | 2.70 × 10⁻⁸ | 7.57 | Vigun01g086000.1 | GATA transcription factor |
| Vu02_28035590 | 2 | 28035590 | 4.73 × 10⁻⁹ | 8.33 | Vigun02g128700.1 | Inorganic phosphatase | |
| Vu02_28044965 | 2 | 28044965 | 3.71 × 10⁻¹⁰ | 9.43 | Vigun02g128800.1 | Replication factor C | |
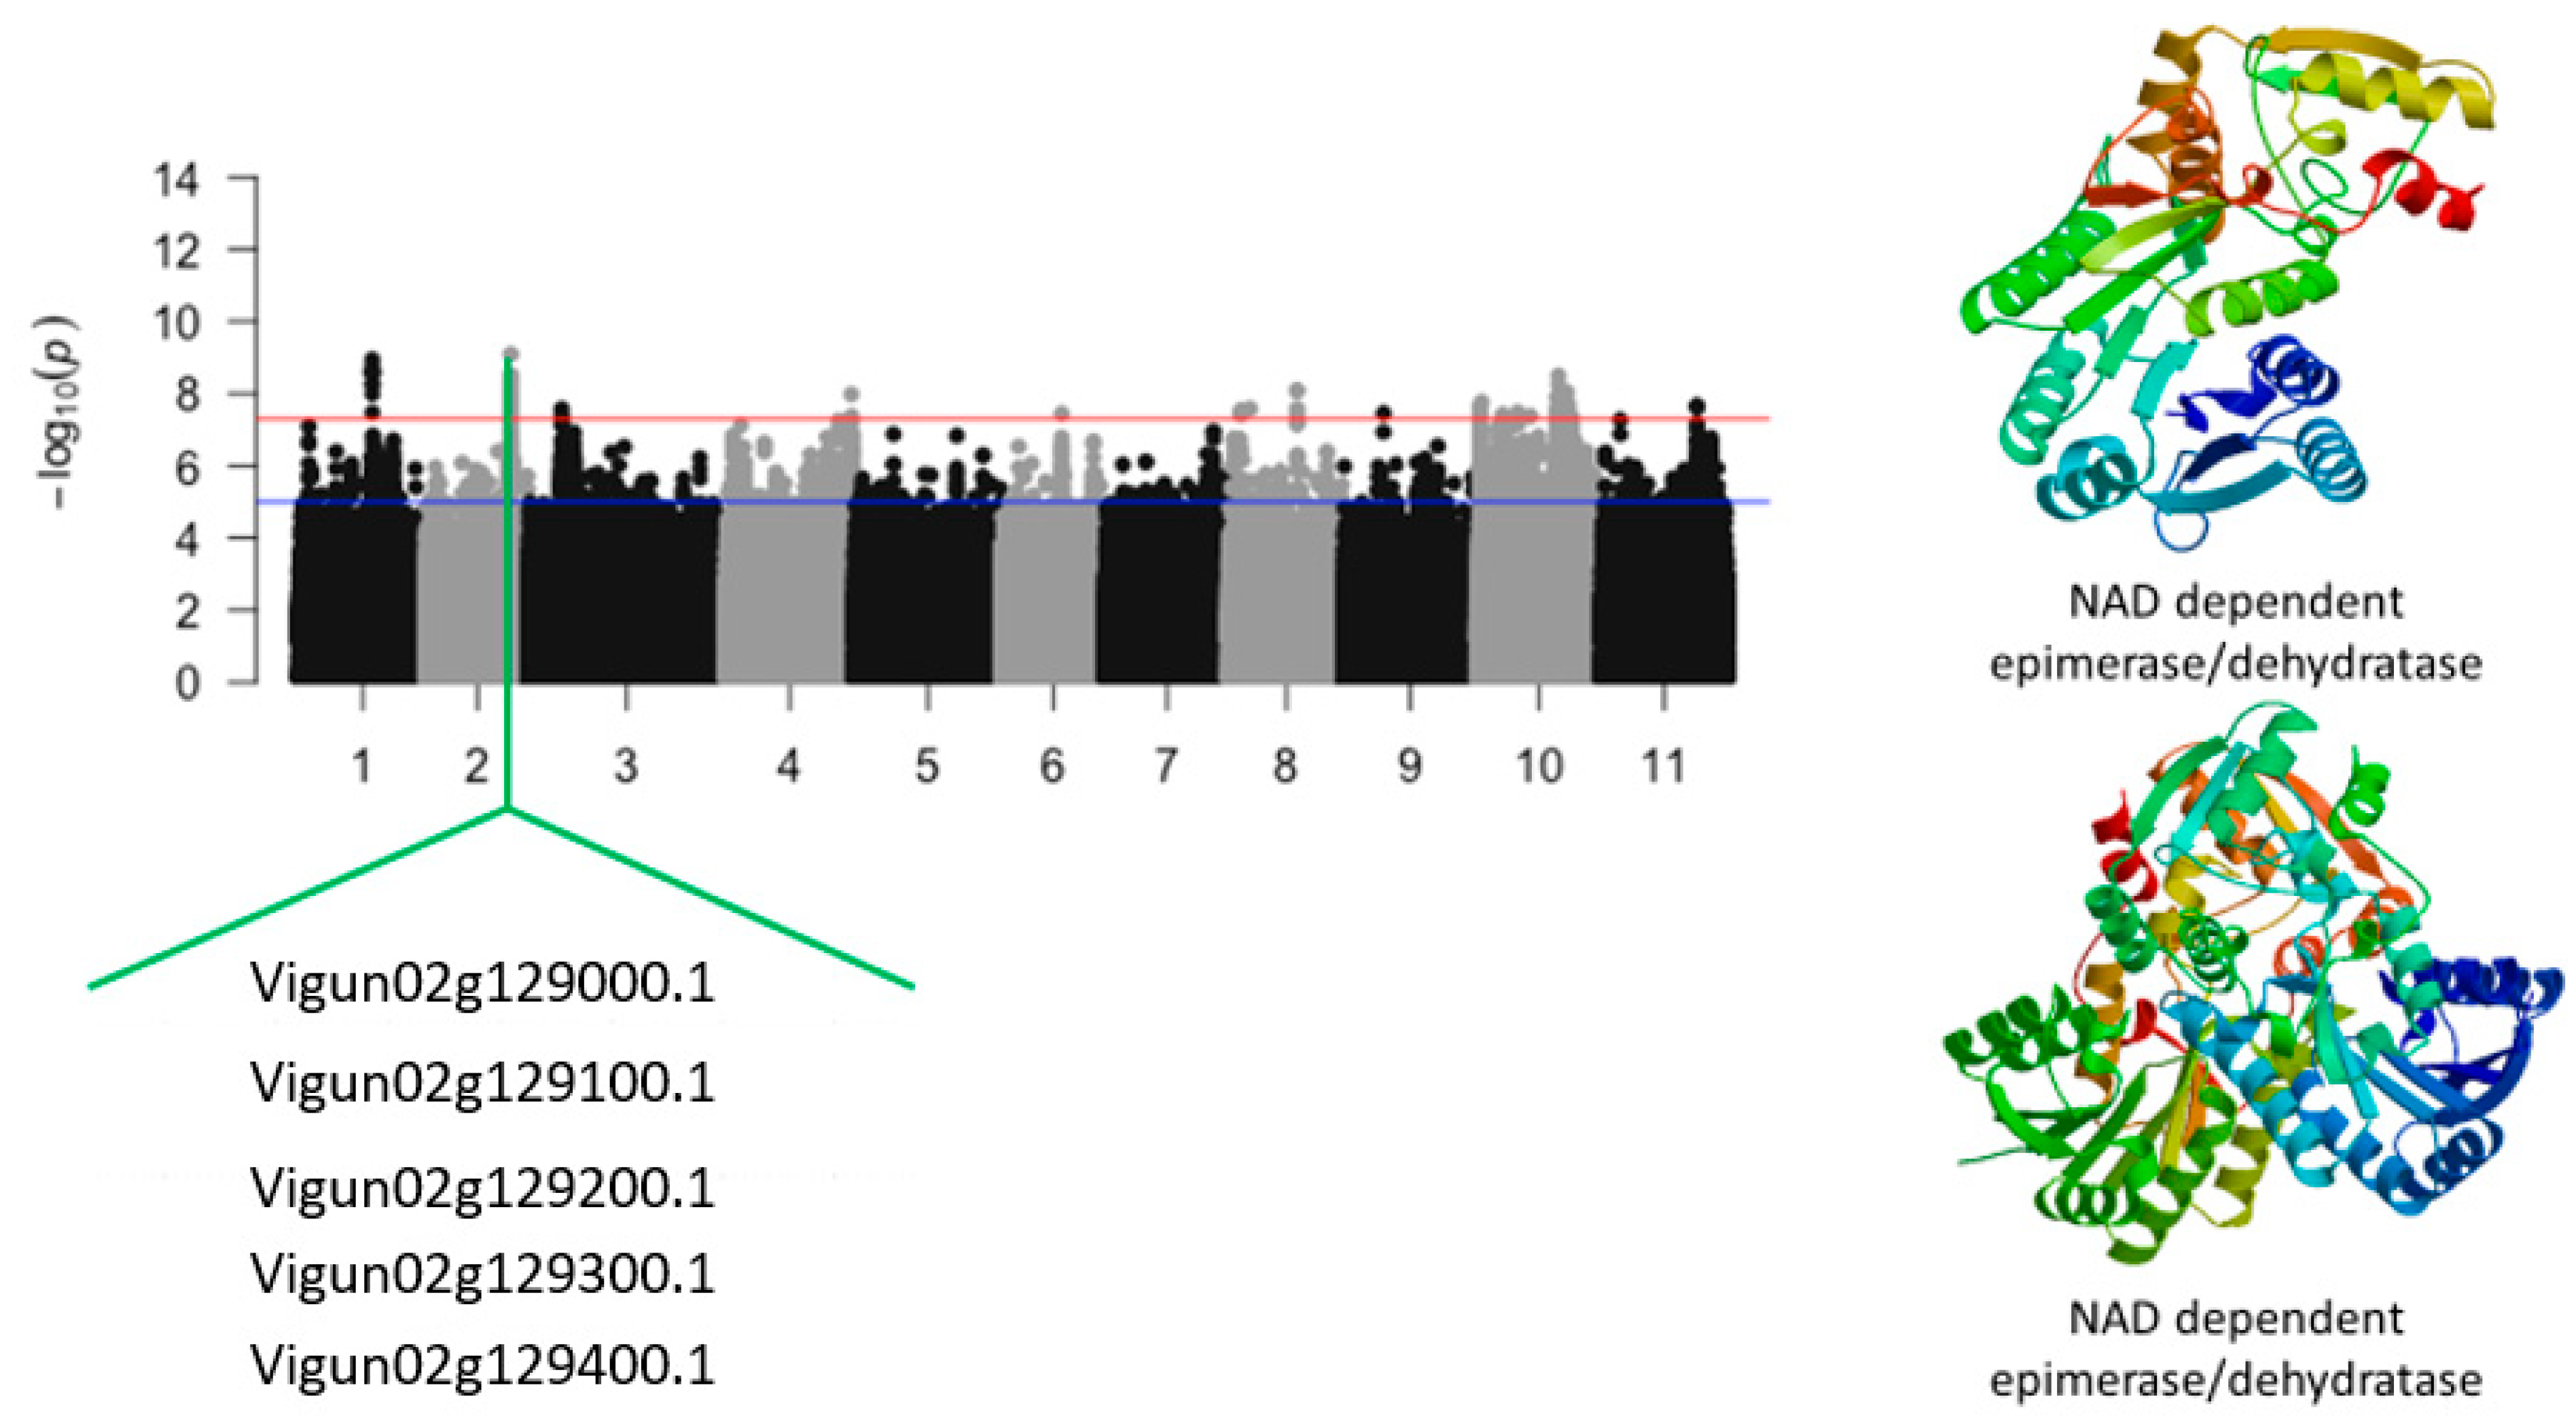
| Vu02_28050297 | 2 | 28050297 | 3.54 × 10⁻¹¹ | 10.45 | Vigun02g128900.1 | NAD dependent epimerase/dehydratase | |
| Vu02_28054154 | 2 | 28054154 | 2.09 × 10⁻¹¹ | 10.68 | Vigun02g129000.1 | NAD dependent epimerase/dehydratase | |
| Vu02_28064103 | 2 | 28064103 | 9.85 × 10⁻¹⁰ | 9.01 | Vigun02g129100.1 | NAD dependent epimerase/dehydratase | |
| Vu02_28068945 | 2 | 28068945 | 2.47 × 10⁻¹⁰ | 9.61 | Vigun02g129200.1 | NAD dependent epimerase/dehydratase | |
| Vu02_28084764 | 2 | 28084764 | 2.34 × 10⁻¹⁰ | 9.63 | Vigun02g129300.1 | NAD dependent epimerase/dehydratase | |
| Vu02_28090457 | 2 | 28090457 | 5.66 × 10⁻¹⁰ | 9.25 | Vigun02g129400.1 | NAD dependent epimerase/dehydratase | |
| Vu02_28105724 | 2 | 28105724 | 8.96 × 10⁻¹¹ | 10.05 | Vigun02g129500.1 | NAD dependent epimerase/dehydratase | |
| Relative tolerance index for chlorophyll | Vu01_24246822 | 1 | 24246822 | 1.14 × 10⁻⁹ | 8.95 | Vigun01g086000.1 | GATA transcription factor |
| Vu02_28061740 | 2 | 28061740 | 2.28 × 10⁻⁸ | 7.64 | Vigun02g129000.1 | NAD dependent epimerase/dehydratase | |
| Vu02_28071778 | 2 | 28071778 | 1.30 × 10⁻⁸ | 7.89 | Vigun02g129100.1 | NAD dependent epimerase/dehydratase | |
| Vu02_28084764 | 2 | 28084764 | 2.96 × 10⁻⁹ | 8.53 | Vigun02g129200.1 | NAD dependent epimerase/dehydratase | |
| Vu02_28105725 | 2 | 28105725 | 4.70 × 10⁻⁹ | 8.33 | Vigun02g129300.1 | NAD dependent epimerase/dehydratase | |
| Vu02_28112832 | 2 | 28112832 | 1.06 × 10⁻⁸ | 7.98 | Vigun02g129400.1 | NAD dependent epimerase/dehydratase | |
| Vu03_10976477 | 3 | 10976477 | 2.64 × 10⁻⁸ | 7.58 | Vigun03g118000.1 | Terpene synthase | |
| Vu04_41756724 | 4 | 41756724 | 1.05 × 10⁻⁸ | 7.98 | Vigun04g193500.1 | Phospholipid-transporting ATPase-related | |
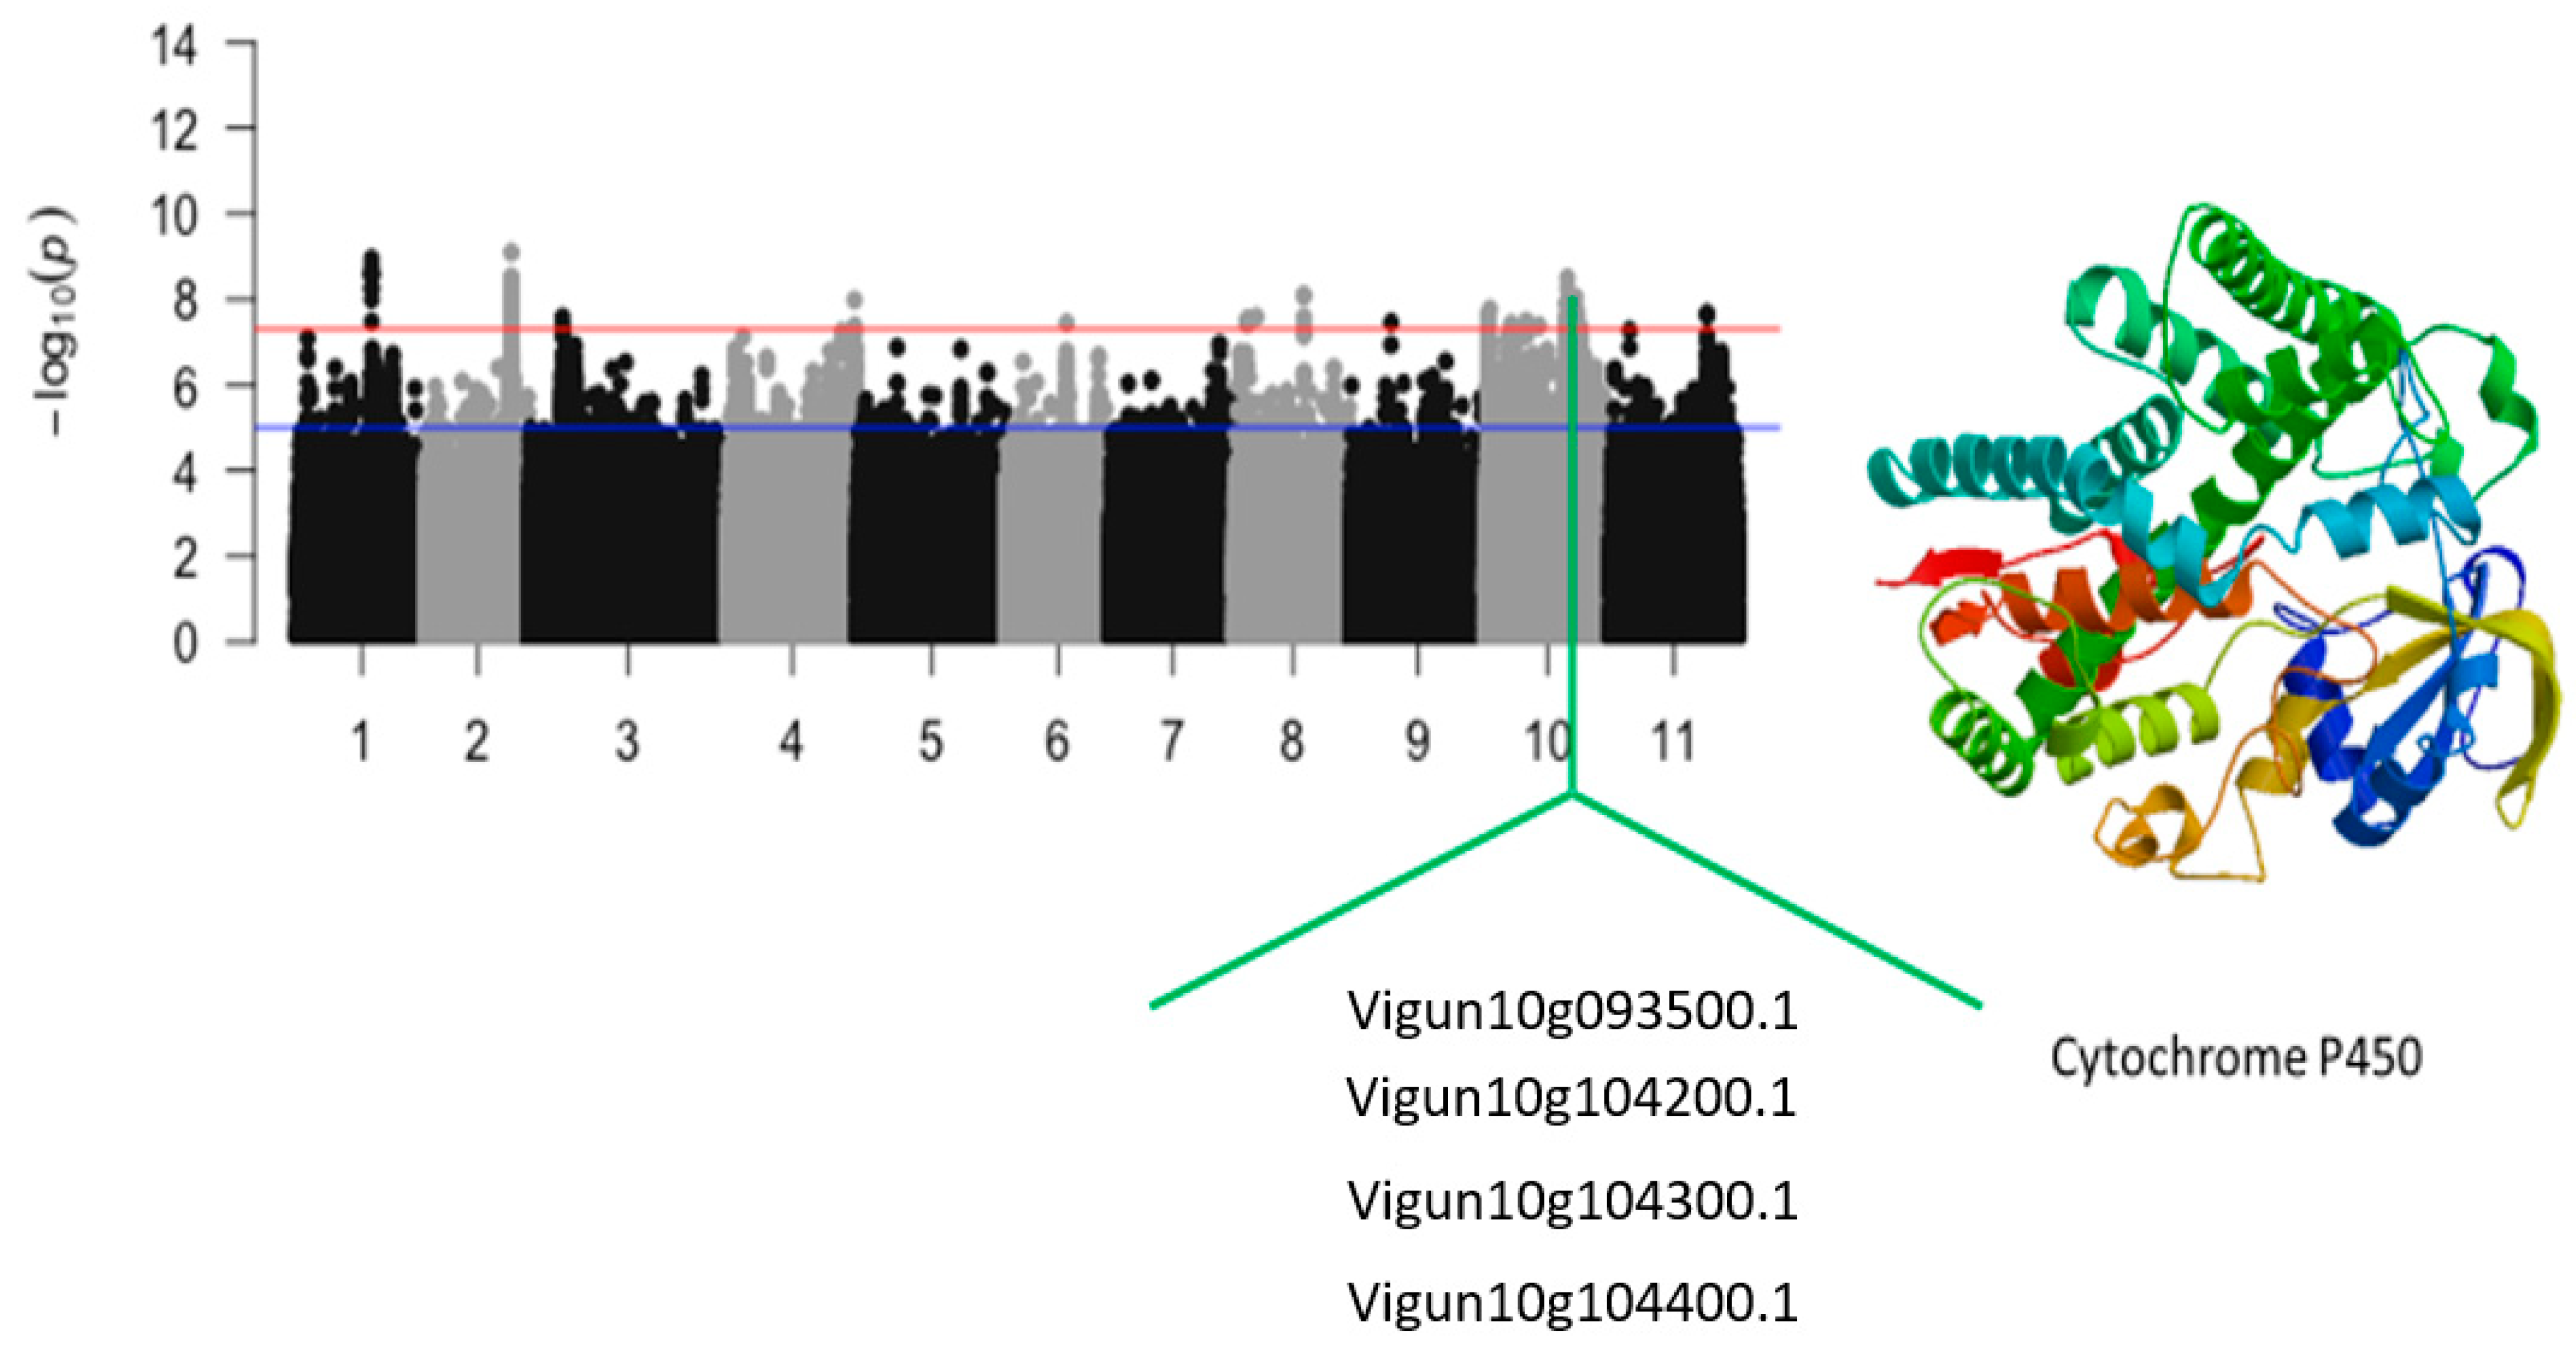
| Vu10_27003173 | 10 | 27003173 | 1.93 × 10⁻⁸ | 7.72 | Vigun10g093500.1 | Xanthoxin dehydrogenase/Abscisic acid biosynthesis | |
| Vu10_29847718 | 10 | 29847718 | 2.79 × 10⁻⁸ | 7.55 | Vigun10g104200.1 | Cytochrome P450 | |
| Vu10_29864524 | 10 | 29864524 | 1.67 × 10⁻⁸ | 7.78 | Vigun10g104300.1 | Cytochrome P450 | |
| Vu10_29933934 | 10 | 29933934 | 2.37 × 10⁻⁸ | 7.63 | Vigun10g104400.1 | Cytochrome P450 | |
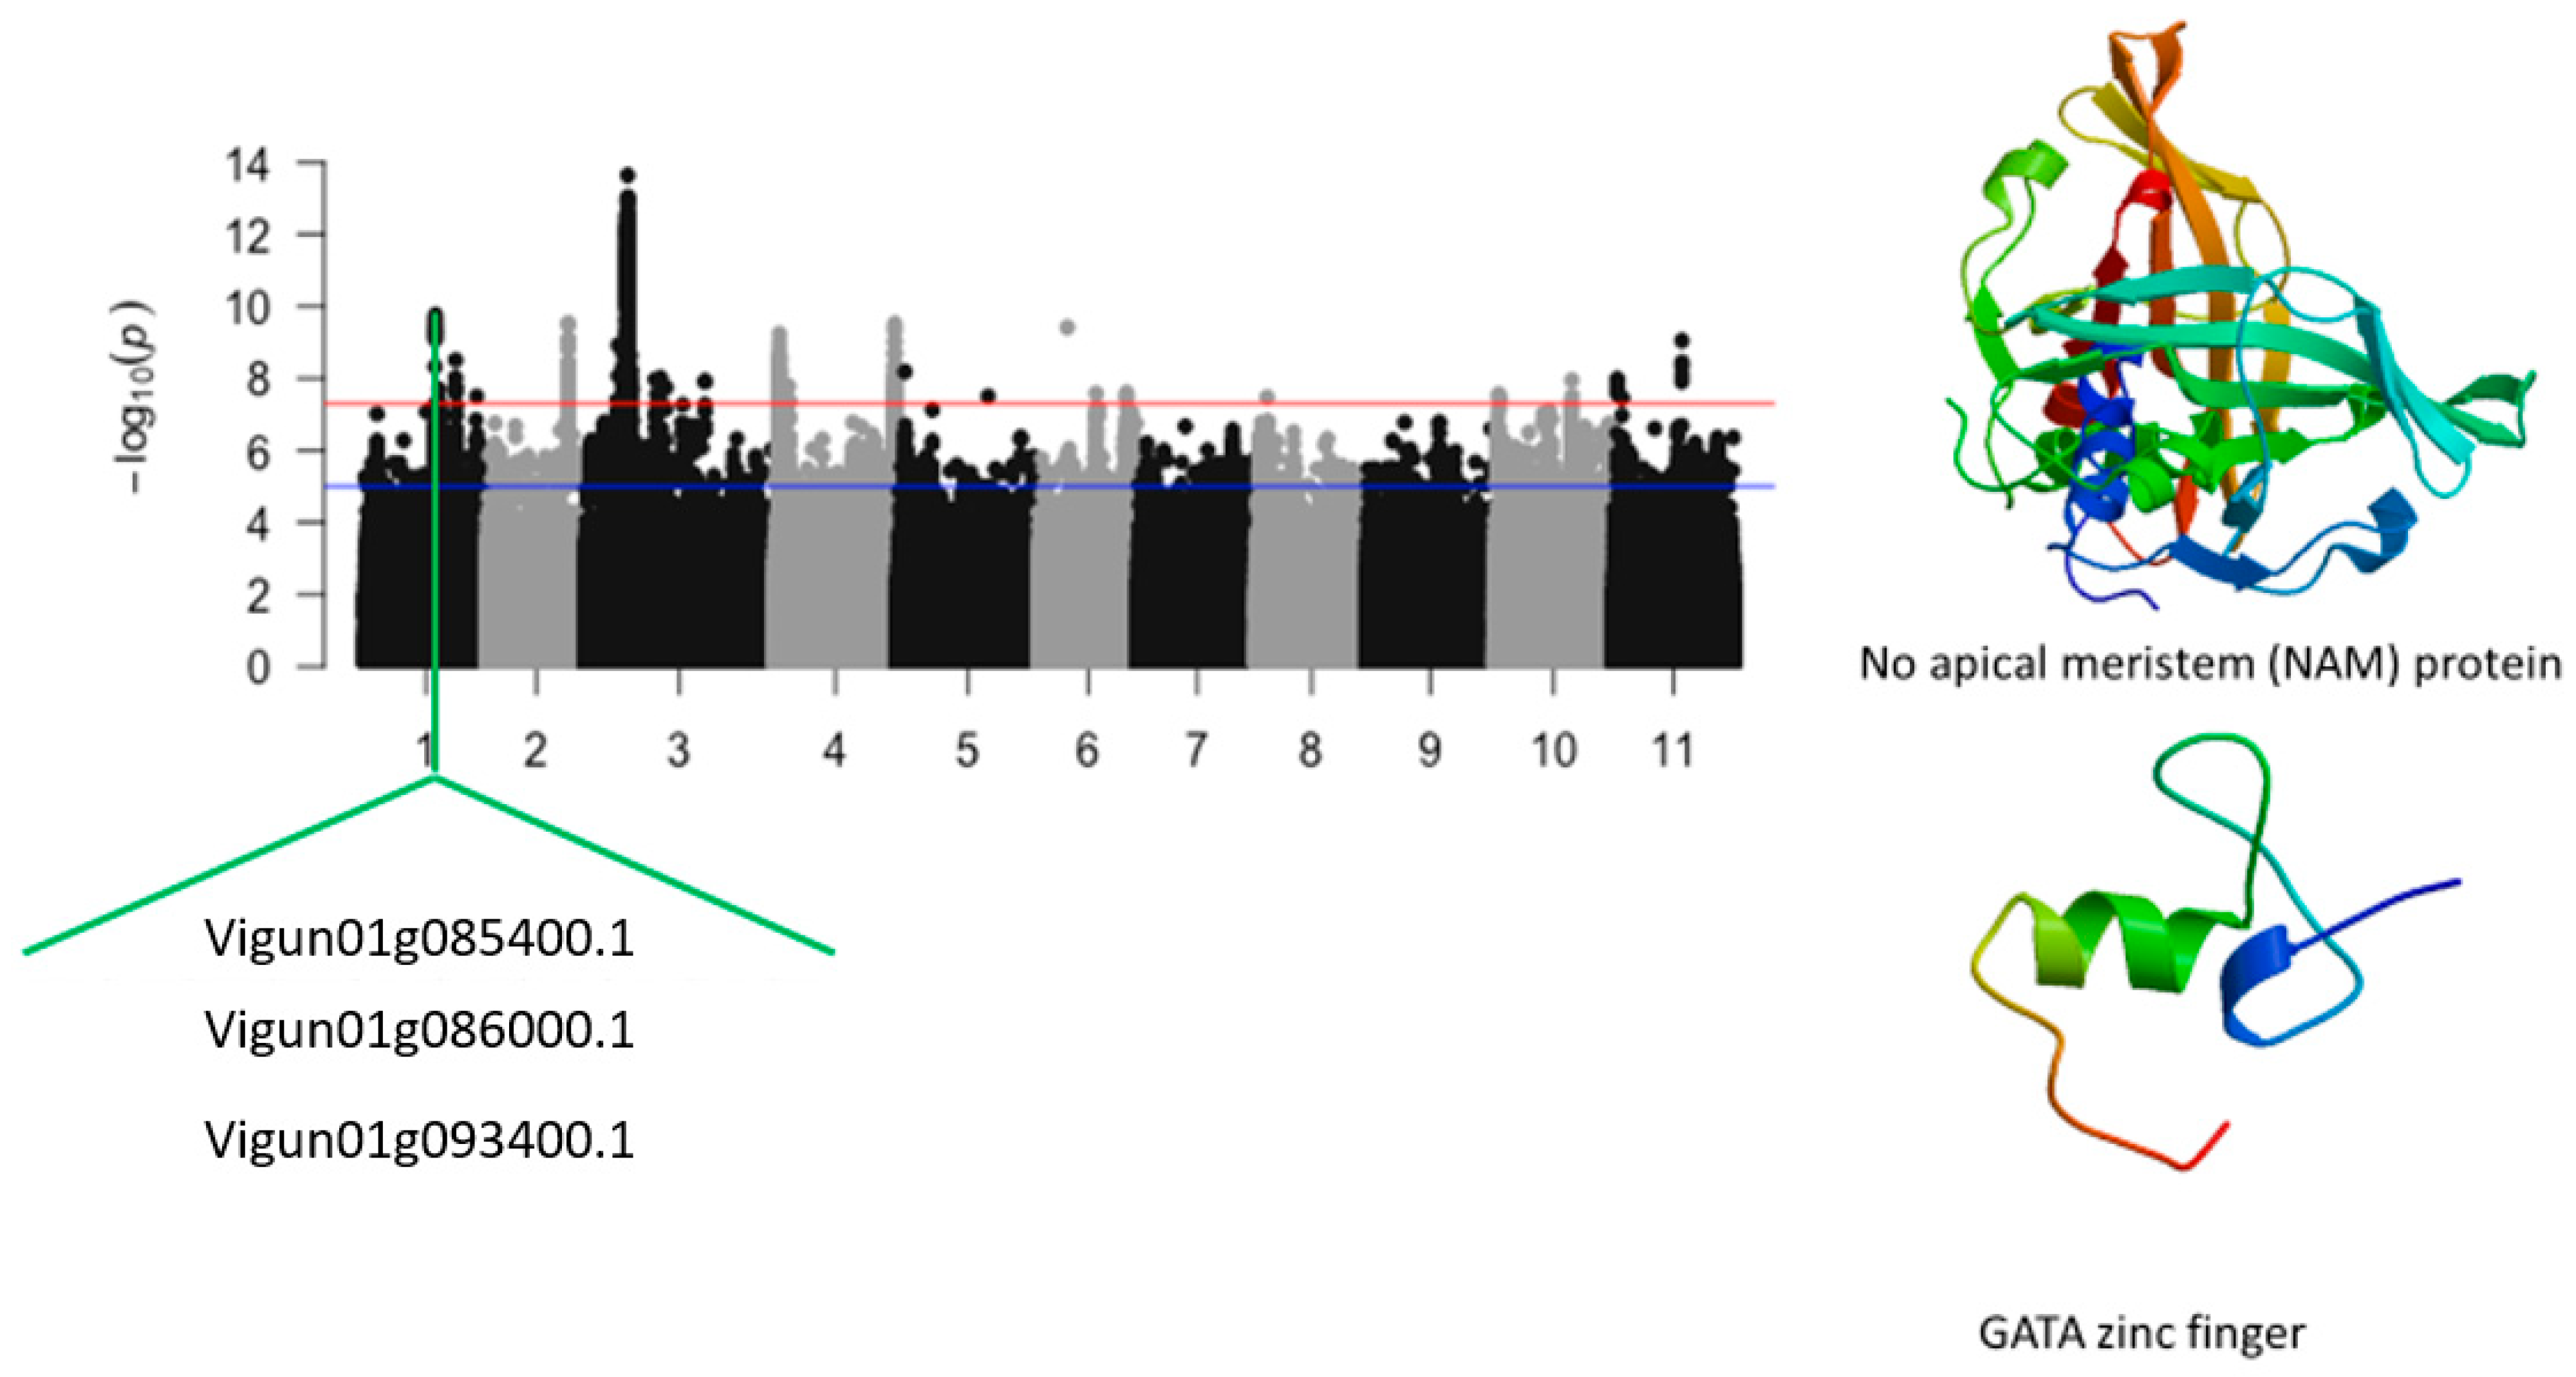
| Leaf injury score under salt stress | Vu01_24112868 | 1 | 24112868 | 4.68 × 10⁻⁹ | 8.33 | Vigun01g085400.1 | No apical meristem (NAM) protein |
| Vu01_24249542 | 1 | 24249542 | 8.23 × 10⁻¹⁰ | 9.08 | Vigun01g086000.1 | GATA zinc finger | |
| Vu01_25586428 | 1 | 25586428 | 2.04 × 10⁻⁸ | 7.69 | Vigun01g093400.1 | Plasma-membrane choline transporter | |
| Vu02_28050011 | 2 | 28050011 | 2.95 × 10⁻¹⁰ | 9.53 | Vigun02g129000.1 | NAD dependent epimerase/dehydratase | |
| Vu02_28064123 | 2 | 28064123 | 3.44 × 10⁻⁹ | 8.46 | Vigun02g129100.1 | NAD dependent epimerase/dehydratase | |
| Vu02_28090457 | 2 | 28090457 | 1.14 × 10⁻⁹ | 8.94 | Vigun02g129200.1 | NAD dependent epimarase/dehydratase | |
| Vu02_28105725 | 2 | 28105725 | 8.07 × 10⁻¹⁰ | 9.09 | Vigun02g129300.1 | NAD dependent epimarase/dehydratase | |
| Vu03_11383713 | 3 | 11383713 | 1.20 × 10⁻⁹ | 8.92 | Vigun03g121600.1 | Malate dehydrogenase | |
| Vu03_13297388 | 3 | 13297388 | 9.20 × 10⁻⁹ | 8.04 | Vigun03g135800.1 | Vacuolar iron transporter | |
| Vu03_13305589 | 3 | 13305589 | 6.45 × 10⁻⁹ | 8.19 | Vigun03g135900.1 | Vacuolar iron transporter | |
| Vu03_13313938 | 3 | 13313938 | 8.57 × 10⁻⁹ | 8.07 | Vigun03g136000.1 | Vacuolar iron transporter | |
| Vu03_13334160 | 3 | 13334160 | 4.32 × 10⁻⁹ | 8.36 | Vigun03g136100.1 | Histidine decarboxylase | |
| Vu03_13357176 | 3 | 13357176 | 2.44 × 10⁻⁹ | 8.61 | Vigun03g136300.1 | EamA-like transporter family/phosphate antiporter | |
| Vu03_13363517 | 3 | 13363517 | 4.54 × 10⁻⁹ | 8.34 | Vigun03g136400.1 | EamA-like transporter family/phosphate antiporter | |
| Vu03_13509429 | 3 | 13509429 | 1.37 × 10⁻⁸ | 7.86 | Vigun03g137600.1 | tRNA-splicing endonuclease positive effector-related | |
| Vu03_14318570 | 3 | 14318570 | 3.03 × 10⁻⁹ | 8.52 | Vigun03g142100.1 | Tetrahydroberberine oxidase | |
| Vu03_14369744 | 3 | 14369744 | 1.20 × 10⁻⁸ | 7.92 | Vigun03g142200.1 | Tetrahydroberberine oxidase | |
| Vu03_14373278 | 3 | 14373278 | 1.75 × 10⁻⁸ | 7.76 | Vigun03g142300.1 | Tetrahydroberberine oxidase | |
| Vu03_14737814 | 3 | 14737814 | 2.33 × 10⁻¹⁴ | 13.63 | Vigun03g144700.1 | Potassium channel | |
| Vu03_14760979 | 3 | 14760979 | 8.65 × 10⁻¹¹ | 10.06 | Vigun03g144800.1 | WRKY transcription factor | |
| Vu03_15238396 | 3 | 15238396 | 1.78 × 10⁻⁸ | 7.75 | Vigun03g148600.1 | Flavine reductase-related | |
| Vu03_15286489 | 3 | 15286489 | 2.79 × 10⁻⁸ | 7.55 | Vigun03g148900.1 | CCR4-NOT transcription complex subunit | |
| Vu03_15308668 | 3 | 15308668 | 5.92 × 10⁻⁹ | 8.23 | Vigun03g149000.1 | Eukaryotic cytochrome b561 | |
| Vu03_15338189 | 3 | 15338189 | 5.92 × 10⁻⁹ | 8.23 | Vigun03g149100.1 | DNA-directed RNA polymerase II subunit RPB7 | |
| Vu03_15380199 | 3 | 15380199 | 2.32 × 10⁻⁹ | 8.64 | Vigun03g149400.1 | Gibberellin 2-oxidase | |
| Vu03_16376823 | 3 | 16376823 | 1.95 × 10⁻⁸ | 7.71 | Vigun03g154300.1 | Leucine-rich repeat protein | |
| Vu03_26130498 | 3 | 26130498 | 9.70 × 10⁻⁹ | 8.01 | Vigun03g190500.1 | Polysaccharide biosynthesis | |
| Vu04_1785520 | 4 | 1785520 | 2.83 × 10⁻⁹ | 8.55 | Vigun04g023800.1 | Zinc finger protein-like protein | |
| Vu04_1801689 | 4 | 1801689 | 4.76 × 10⁻⁹ | 8.32 | Vigun04g023900.1 | Core-2/I-Branching enzyme | |
| Vu04_1857562 | 4 | 1857562 | 7.27 × 10⁻⁹ | 8.14 | Vigun04g024100.1 | Calmodulin binding protein | |
| Vu04_1876606 | 4 | 1876606 | 2.99 × 10⁻⁸ | 7.52 | Vigun04g024200.1 | Protein kinase family | |
| Vu04_1896799 | 4 | 1896799 | 3.20 × 10⁻⁹ | 8.49 | Vigun04g024700.1 | Protein tyrosin kinase | |
| Vu04_1916362 | 4 | 1916362 | 9.83 × 10⁻¹⁰ | 9.01 | Vigun04g024900.1 | Protein tyrosin kinase | |
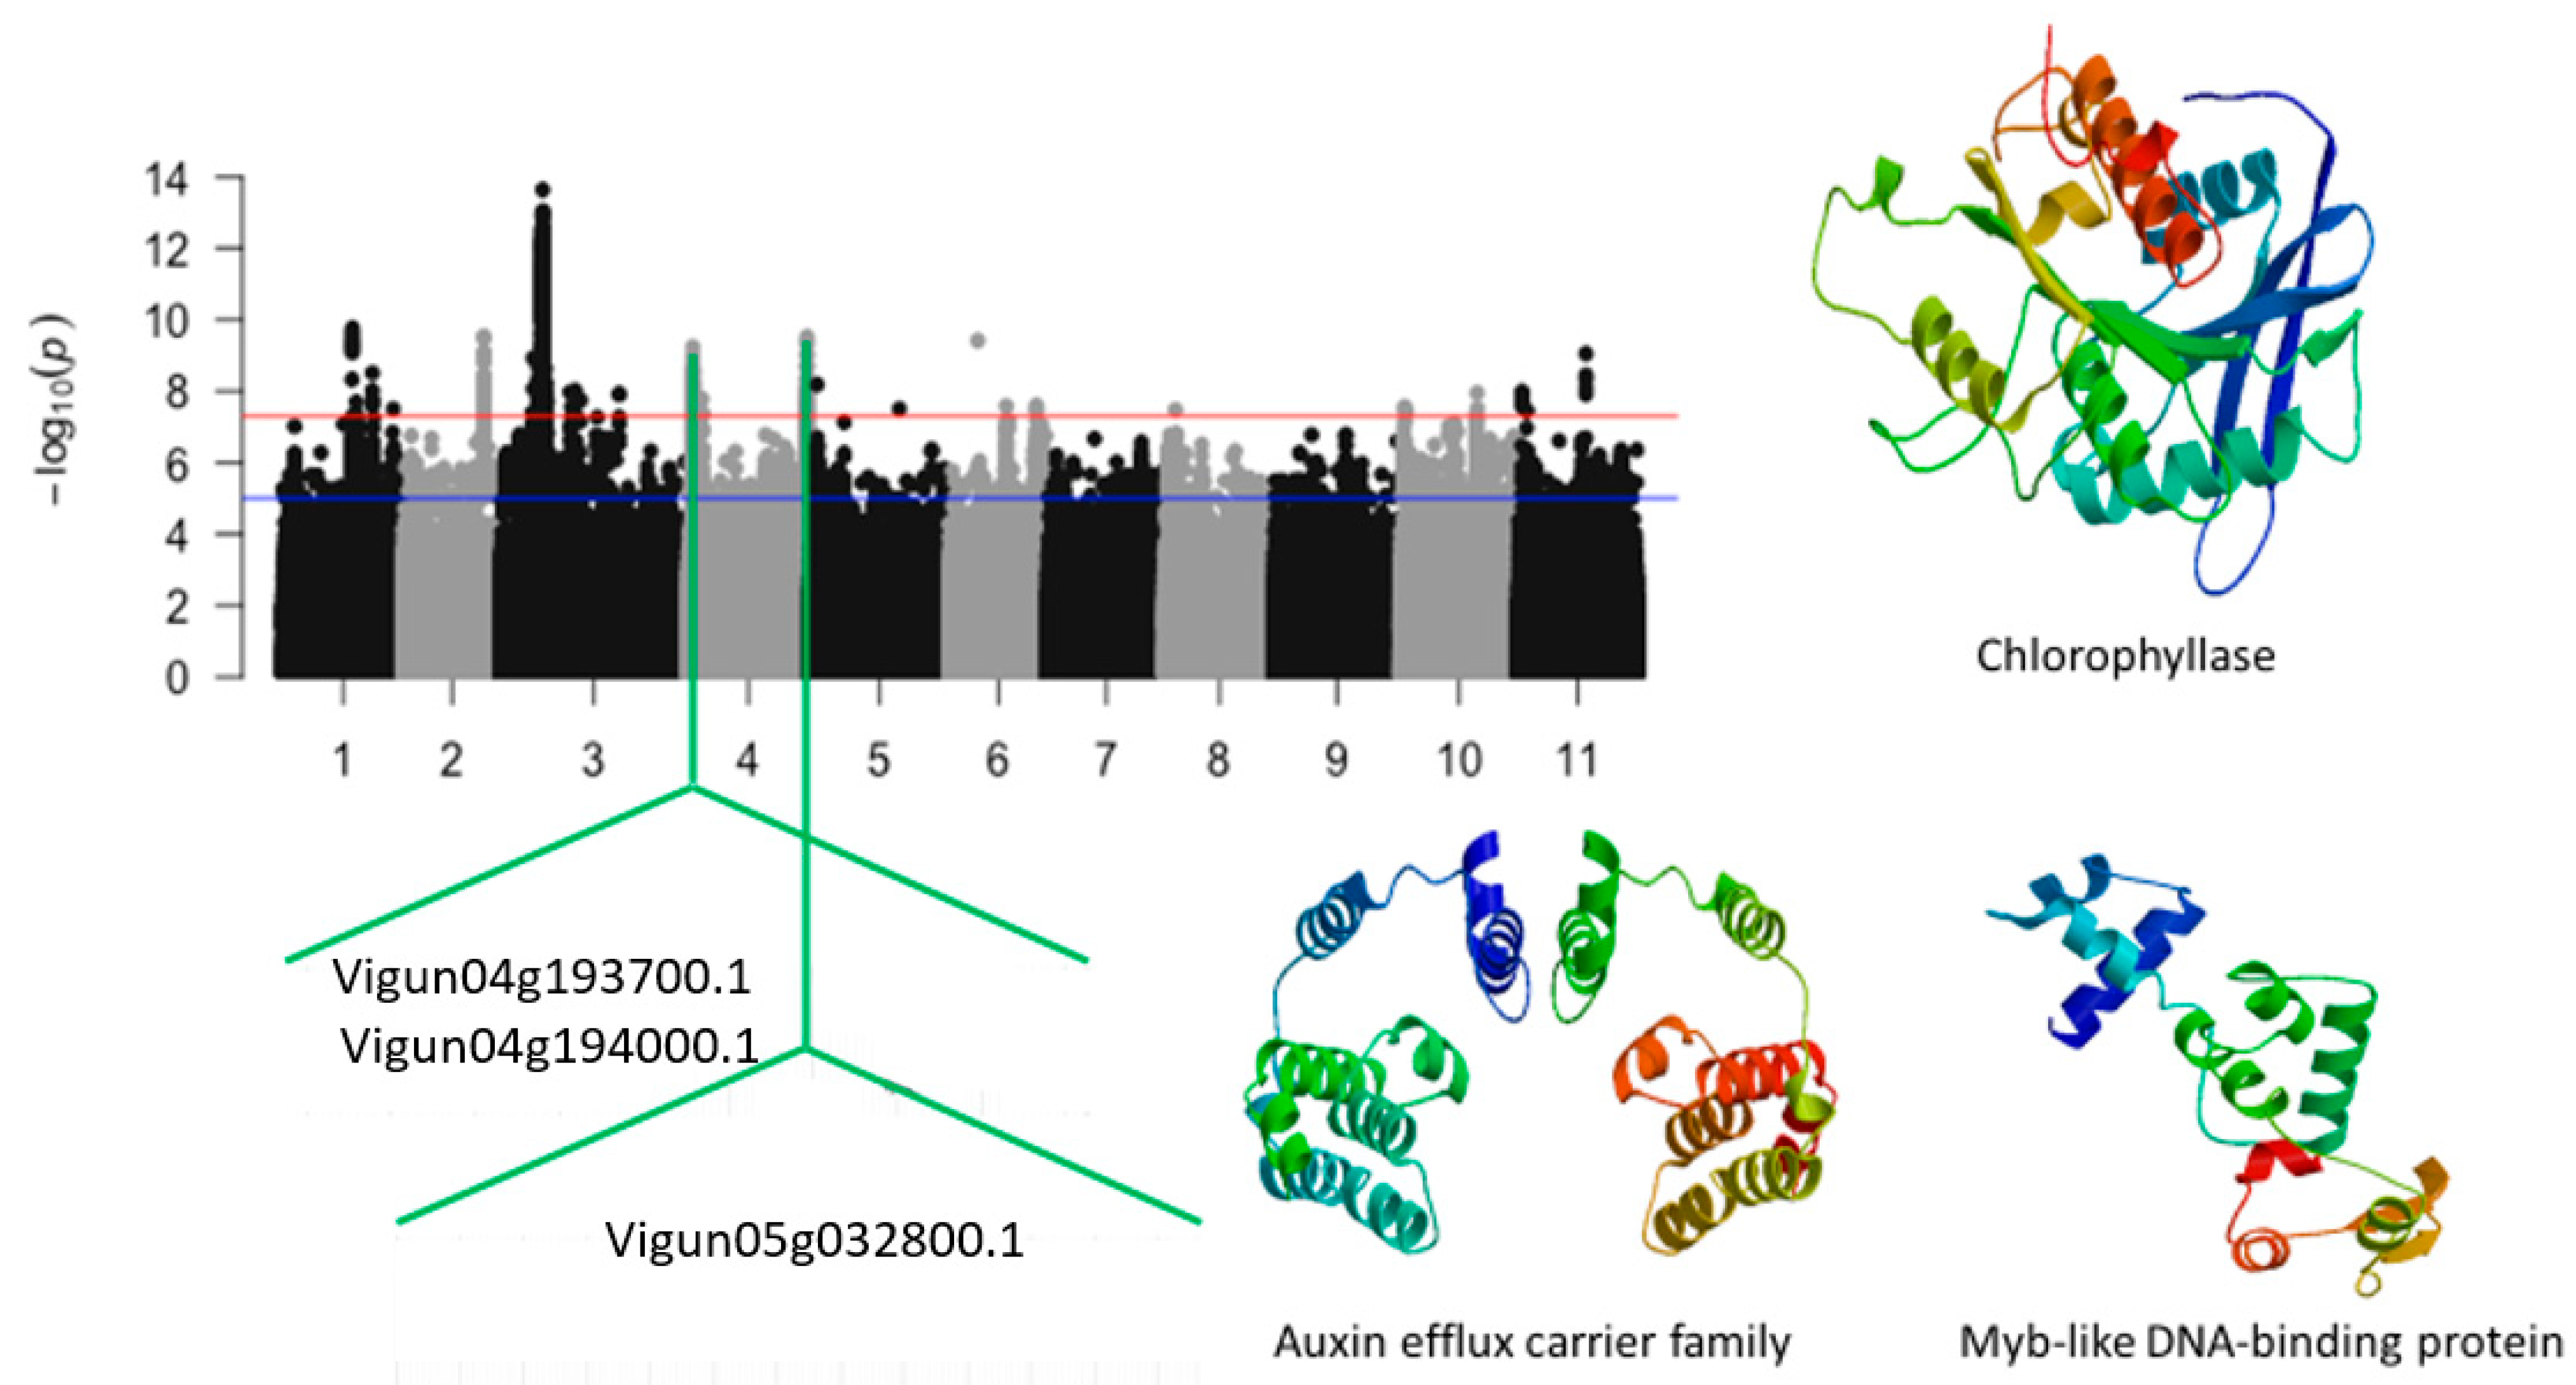
| Vu04_2001620 | 4 | 2001620 | 5.89 × 10⁻⁹ | 8.23 | Vigun04g025900.1 | Chlorophyllase | |
| Vu04_2535911 | 4 | 2535911 | 1.26 × 10⁻⁸ | 7.9 | Vigun04g031500.1 | Auxin efflux carrier family | |
| Vu04_5101729 | 4 | 5101729 | 1.65 × 10⁻⁸ | 7.78 | Vigun04g054000.1 | Myb-like DNA-binding protein | |
| Vu04_41757989 | 4 | 41757989 | 5.05 × 10⁻⁹ | 8.3 | Vigun04g193600.1 | Serine/threonine-protein kinase | |
| Vu04_41787263 | 4 | 41787263 | 1.13 × 10⁻⁸ | 7.95 | Vigun04g193700.1 | NAD dependent epimerase/dehytrase | |
| Vu04_41800162 | 4 | 41800162 | 1.90 × 10⁻⁹ | 8.72 | Vigun04g194000.1 | Universal stress protein family | |
| Vu04_41850683 | 4 | 41850683 | 2.13 × 10⁻⁸ | 7.67 | Vigun04g194100.1 | 3-hydroxyisobutyrate dehydrogenase-related | |
| Vu05_2631192 | 5 | 2631192 | 6.54 × 10⁻⁹ | 8.18 | Vigun05g032800.1 | Transferase family protein | |
| Vu06_10043938 | 6 | 10043938 | 3.87 × 10⁻¹⁰ | 9.41 | Vigun06g021500.1 | Coiled-coil regions of plant-specific actin-binding protein | |
| Vu06_30560091 | 6 | 30560091 | 2.52 × 10⁻⁸ | 7.6 | Vigun06g186400.1 | Transcriptional repressor | |
| Vu11_1322049 | 11 | 1322049 | 1.02 × 10⁻⁸ | 7.99 | Vigun11g010800.1 | Leucine-rich repeat | |
| Vu11_23659412 | 11 | 23659412 | 8.96 × 10⁻¹⁰ | 9.05 | Vigun11g080000.1 | Serine/threonine-protein kinase |
| Traits | Gene_ID | Functional_Annotations | Vun | Gma | Pvu | Mtr |
|---|---|---|---|---|---|---|
| Leaf SPAD chlorophyll under salt stress | Vigun01g086000.1 | GATA transcription factor | 1 | 4 | 2 | 1 |
| Vigun02g128700.1 | Inorganic phosphatase | 1 | 2 | 1 | 1 | |
| Vigun02g128900.1 | NAD dependent epimerase/dehydratase | 5 | 12 | 5 | 3 | |
| Vigun02g129000.1 | NAD dependent epimerase/dehydratase | 6 | 8 | 5 | 2 | |
| Vigun02g129100.1 | NAD dependent epimerase/dehydratase | 2 | 9 | 4 | 3 | |
| Vigun02g129200.1 | NAD dependent epimerase/dehydratase | 2 | 5 | 2 | 1 | |
| Vigun02g129300.1 | NAD dependent epimerase/dehydratase | 4 | 5 | 2 | 1 | |
| Vigun02g129400.1 | NAD dependent epimerase/dehydratase | 3 | 5 | 2 | 1 | |
| Vigun02g129500.1 | NAD dependent epimerase/dehydratase | 3 | 5 | 2 | 0 | |
| Relative tolerance index for chlorophyll | Vigun01g086000.1 | GATA transcription factor | 1 | 2 | 2 | 1 |
| Vigun02g129000.1 | NAD dependent epimerase/dehydratase | 3 | 12 | 5 | 3 | |
| Vigun02g129100.1 | NAD dependent epimerase/dehydratase | 2 | 9 | 4 | 3 | |
| Vigun02g129200.1 | NAD dependent epimerase/dehydratase | 3 | 5 | 3 | 1 | |
| Vigun02g129300.1 | NAD dependent epimerase/dehydratase | 3 | 5 | 2 | 1 | |
| Vigun02g129400.1 | NAD dependent epimerase/dehydratase | 4 | 5 | 2 | 1 | |
| Vigun03g118000.1 | Terpene synthase | 1 | 1 | 1 | 1 | |
| Vigun04g193500.1 | Phospholipid-transporting ATPase-related | 0 | 2 | 1 | 0 | |
| Vigun10g093500.1 | Xanthoxin dehydrogenase/Abscisic acid biosynthesis | 1 | 3 | 2 | 1 | |
| Vigun10g104200.1 | Cytochrome P450 | 9 | 8 | 3 | 4 | |
| Vigun10g104300.1 | Cytochrome P450 | 9 | 9 | 2 | 4 | |
| Vigun10g104400.1 | Cytochrome P450 | 9 | 7 | 3 | 3 | |
| Leaf injury score | Vigun01g085400.1 | No apical meristem (NAM) protein | 1 | 4 | 2 | 1 |
| Vigun01g086000.1 | GATA zinc finger | 0 | 0 | 1 | 0 | |
| Vigun02g129000.1 | NAD dependent epimerase/dehydratase | 1 | 4 | 4 | 2 | |
| Vigun02g129200.1 | NAD dependent epimarase/dehydratase | 3 | 5 | 3 | 1 | |
| Vigun03g135800.1 | Vacuolar iron transporter | 3 | 7 | 3 | 4 | |
| Vigun03g136300.1 | EamA-like transporter family/phosphate antiporter | 4 | 5 | 4 | 3 | |
| Vigun03g144700.1 | Potassium channel/Ion Channel | 0 | 2 | 1 | 0 | |
| Vigun03g149400.1 | gibberellin 2-oxidase | 1 | 5 | 2 | 2 | |
| Vigun04g025900.1 | chlorophyllase | 0 | 3 | 1 | 0 | |
| Vigun04g054000.1 | Myb-like DNA-binding protein | 1 | 2 | 1 | 0 | |
| Vigun04g193700.1 | NAD dependent epimerase/dehytrase | 0 | 1 | 1 | 1 |
Disclaimer/Publisher’s Note: The statements, opinions and data contained in all publications are solely those of the individual author(s) and contributor(s) and not of MDPI and/or the editor(s). MDPI and/or the editor(s) disclaim responsibility for any injury to people or property resulting from any ideas, methods, instructions or products referred to in the content. |
© 2023 by the authors. Licensee MDPI, Basel, Switzerland. This article is an open access article distributed under the terms and conditions of the Creative Commons Attribution (CC BY) license (https://creativecommons.org/licenses/by/4.0/).
Share and Cite
Ravelombola, W.; Dong, L.; Barickman, T.C.; Xiong, H.; Manley, A.; Cason, J.; Pham, H.; Zia, B.; Mou, B.; Shi, A. Genetic Architecture of Salt Tolerance in Cowpea (Vigna unguiculata (L.) Walp.) at Seedling Stage Using a Whole Genome Resequencing Approach. Int. J. Mol. Sci. 2023, 24, 15281. https://doi.org/10.3390/ijms242015281
Ravelombola W, Dong L, Barickman TC, Xiong H, Manley A, Cason J, Pham H, Zia B, Mou B, Shi A. Genetic Architecture of Salt Tolerance in Cowpea (Vigna unguiculata (L.) Walp.) at Seedling Stage Using a Whole Genome Resequencing Approach. International Journal of Molecular Sciences. 2023; 24(20):15281. https://doi.org/10.3390/ijms242015281
Chicago/Turabian StyleRavelombola, Waltram, Lindgi Dong, Thomas Casey Barickman, Haizheng Xiong, Aurora Manley, John Cason, Hanh Pham, Bazgha Zia, Beiquan Mou, and Ainong Shi. 2023. "Genetic Architecture of Salt Tolerance in Cowpea (Vigna unguiculata (L.) Walp.) at Seedling Stage Using a Whole Genome Resequencing Approach" International Journal of Molecular Sciences 24, no. 20: 15281. https://doi.org/10.3390/ijms242015281