
The Influence of Lactoferrin in Plasma and Peritoneal Fluid on Iron Metabolism in Women with Endometriosis
 , , , , , , ,
Abstract
:1. Introduction
2. Results
3. Discussion
4. Materials and Methods
4.1. Subjects
4.2. Material
4.3. Laboratory Methods
4.4. Statistical Analysis
5. Conclusions
Author Contributions
Funding
Institutional Review Board Statement
Informed Consent Statement
Data Availability Statement
Conflicts of Interest
References
- Zondervan, K.T.; Becker, C.; Missmer, S. Endometriosis. N. Engl. J. Med. 2020, 382, 1244–1256. [Google Scholar] [CrossRef] [PubMed]
- National Guideline Alliance (UK). National Institute for Health and Care Excellence: Guidelines, in Endometriosis: Diagnosis and Management; National Institute for Health and Care Excellence (NICE): London, UK, 2017. [Google Scholar]
- Sampson, J.A. Metastatic or Embolic Endometriosis, due to the Menstrual Dissemination of Endometrial Tissue into the Venous Circulation. Am. J. Pathol. 1927, 3, 93–110.43. [Google Scholar] [PubMed]
- Singh, S.; Soliman, A.M.; Rahal, Y.; Robert, C.; Defoy, I.; Nisbet, P.; Leyland, N. Prevalence, Symptomatic Burden, and Diagnosis of Endometriosis in Canada: Cross-Sectional Survey of 30,000 Women. J. Obstet. Gynaecol. Can. 2020, 42, 829–838. [Google Scholar] [PubMed] [Green Version]
- Staal, A.H.; van der Zanden, M.; Nap, A. Diagnostic Delay of Endometriosis in the Netherlands. Gynecol. Obstet. Investig. 2016, 81, 321–324. [Google Scholar] [CrossRef] [PubMed]
- Wrobel, M.; Wielgos, M.; Laudanski, P. Diagnostic delay of endometriosis in adults and adolescence-current stage of knowledge. Adv. Med. Sci. 2022, 67, 148–153. [Google Scholar] [CrossRef]
- Lee, S.Y.; Koo, Y.; Lee, D. Classification of endometriosis. Yeungnam Univ. J. Med. 2021, 38, 10–18. [Google Scholar]
- Virgilio, E.; Giarnieri, E.; Giovagnoli, M.R.; Montagnini, M.; Proietti, A.; D'Urso, R.; Mercantini, P.; Valabrega, S.; Balducci, G.; Cavallini, M. Gastric Cancer Cells in Peritoneal Lavage Fluid: A Systematic Review Comparing Cytological with Molecular Detection for Diagnosis of Peritoneal Metastases and Prediction of Peritoneal Recurrences. Anticancer Res. 2018, 38, 1255–1262. [Google Scholar]
- Atta, S.; Kamel, M.; Mansour, W.; Hussein, T.; Maher, K.; Elrefaiy, M.A. Ascitic Fluid Cytokines in Chronic Liver Disease: A Possible Prognostic Tool. Dig. Dis. 2021, 39, 534–539. [Google Scholar] [CrossRef]
- Laudanski, P.; Charkiewicz, R.; Tolwinska, A.; Szamatowicz, J.; Charkiewicz, A.; Niklinski, J. Profiling of Selected MicroRNAs in Proliferative Eutopic Endometrium of Women with Ovarian Endometriosis. Biomed. Res. Int. 2015, 2015, 760698. [Google Scholar] [CrossRef] [Green Version]
- Laudanski, P.; Gorodkiewicz, E.; Ramotowska, B.; Charkiewicz, R.; Kuzmicki, M.; Szamatowicz, J. Determination of cathepsins B, D and G concentration in eutopic proliferative endometrium of women with endometriosis by the surface plasmon resonance imaging (SPRI) technique. Eur. J. Obstet. Gynecol. Reprod. Biol. 2013, 169, 80–83. [Google Scholar] [CrossRef]
- Laudański, P.; Szamatowicz, J.; Oniszczuk, M. Profiling of peritoneal fluid of women with endometriosis by chemokine protein array. Adv. Med. Sci. 2006, 51, 148–152. [Google Scholar]
- Laudanski, P.; Szamatowicz, J.; Ramel, P. Matrix metalloproteinase-13 and membrane type-1 matrix metalloproteinase in peritoneal fluid of women with endometriosis. Gynecol. Endocrinol. 2005, 21, 106–110. [Google Scholar] [CrossRef]
- Szamatowicz, J.; Laudanski, P.; Tomaszewska, I.; Szamatowicz, M. Chemokine growth-regulated-α: A possible role in the pathogenesis of endometriosis. Gynecol. Endocrinol. 2002, 16, 137–141. [Google Scholar] [CrossRef]
- Balla, G.; Jacob, H.S.; Balla, J.; Rosenberg, M.; Nath, K.; Apple, F.; Eaton, J.W.; Vercellotti, G.M. Ferritin: A cytoprotective antioxidant strategem of endothelium. J. Biol. Chem. 1992, 267, 18148–18153. [Google Scholar] [CrossRef]
- Liu, H.; Wu, H.; Zhu, N.; Xu, Z.; Wang, Y.; Qu, Y.; Wang, J. Lactoferrin protects against iron dysregulation, oxidative stress, and apoptosis in 1-methyl-4-phenyl-1,2,3,6-tetrahydropyridine (MPTP)-induced Parkinson's disease in mice. J. Neurochem. 2020, 152, 397–415. [Google Scholar]
- Liu, Y.-Y.; Hu, W.-T.; Tang, L.-L.; Sheng, Y.-R.; Wei, C.-Y.; Li, M.-Q.; Zhu, X.-Y. Elevated heme impairs macrophage phagocytosis in endometriosis. Reproduction 2019, 158, 257–266. [Google Scholar] [CrossRef]
- Ren, Z.; Huang, J.; Zhou, C.; Jia, L.; Li, M.; Liang, X.; Zeng, H. Transferrin and antioxidants partly prevented mouse oocyte oxidative damage induced by exposure of cumulus-oocyte complexes to endometrioma fluid. J. Ovarian Res. 2020, 13, 139. [Google Scholar] [CrossRef]
- Van Langendonckt, A.; Casanas-Roux, F.; Dolmans, M.-M.; Donnez, J. Potential involvement of hemoglobin and heme in the pathogenesis of peritoneal endometriosis. Fertil. Steril. 2002, 77, 561–570. [Google Scholar] [CrossRef]
- Wally, J.; Buchanan, S. A structural comparison of human serum transferrin and human lactoferrin. Biometals 2007, 20, 249–262. [Google Scholar] [CrossRef] [Green Version]
- Watt, R.K. The many faces of the octahedral ferritin protein. Biometals 2011, 24, 489–500. [Google Scholar] [CrossRef]
- Defrere, S.; Lousse, J.C.; Gonzalez-Ramos, R.; Colette, S.; Donnez, J.; Van Langendonckt, A. Potential involvement of iron in the pathogenesis of peritoneal endometriosis. Mol. Hum. Reprod. 2008, 14, 377–385. [Google Scholar] [CrossRef] [PubMed] [Green Version]
- Ni, Z.; Li, Y.; Di Song, D.; Ding, J.; Mei, S.; Sun, S.; Cheng, W.; Yu, J.; Zhou, L.; Kuang, Y.; et al. Iron-overloaded follicular fluid increases the risk of endometriosis-related infertility by triggering granulosa cell ferroptosis and oocyte dysmaturity. Cell Death Dis. 2022, 13, 579. [Google Scholar] [CrossRef] [PubMed]
- Polak, G.; Barczyński, B.; Wertel, I.; Kwaśniewski, W.; Bednarek, W.; Derewianka-Polak, M.; Frąszczak, K.; Olajossy, M.; Kotarski, J. Disrupted iron metabolism in peritoneal fluid may induce oxidative stress in the peritoneal cavity of women with endometriosis. Ann. Agric. Environ. Med. 2018, 25, 587–592. [Google Scholar] [CrossRef] [PubMed]
- Van Langendonckt, A.; Casanas-Roux, F.; Donnez, J. Iron overload in the peritoneal cavity of women with pelvic endometriosis. Fertil. Steril. 2002, 78, 712–718. [Google Scholar] [CrossRef] [PubMed]
- Kruzel, M.L.; Zimecki, M.; Actor, J. Lactoferrin in a Context of Inflammation-Induced Pathology. Front. Immunol. 2017, 8, 1438. [Google Scholar] [CrossRef]
- Kell, D.B.; Heyden, E.; Pretorius, E. The Biology of Lactoferrin, an Iron-Binding Protein That Can Help Defend Against Viruses and Bacteria. Front. Immunol. 2020, 11, 1221. [Google Scholar] [CrossRef]
- Kowalczyk, P.; Kaczyńska, K.; Kleczkowska, P.; Bukowska-Ośko, I.; Kramkowski, K.; Sulejczak, D. The Lactoferrin Phenomenon—A Miracle Molecule. Molecules 2022, 27, 2941. [Google Scholar] [CrossRef]
- Rosa, L.; Cutone, A.; Lepanto, M.S.; Paesano, R.; Valenti, P. Lactoferrin: A Natural Glycoprotein Involved in Iron and Inflammatory Homeostasis. Int. J. Mol. Sci. 2017, 18, 1985. [Google Scholar] [CrossRef]
- Zhao, X.; Ting, S.-M.; Sun, G.; Roy-O'Reilly, M.; Mobley, A.; Garrido, J.B.; Zheng, X.; Obertas, L.; Jung, J.E.; Kruzel, M.; et al. Beneficial Role of Neutrophils Through Function of Lactoferrin After Intracerebral Hemorrhage. Stroke 2018, 49, 1241–1247. [Google Scholar] [CrossRef]
- Actor, J.K.; Hwang, S.; Kruzel, M. Lactoferrin as a natural immune modulator. Curr. Pharm. Des. 2009, 15, 1956–1973. [Google Scholar] [CrossRef] [Green Version]
- Siqueiros-Cendón, T.; Arévalo-Gallegos, S.; Iglesias-Figueroa, B.F.; García-Montoya, I.A.; Salazar-Martínez, J.; Rascón-Cruz, Q. Immunomodulatory effects of lactoferrin. Acta Pharmacol. Sin. 2014, 35, 557–566. [Google Scholar] [CrossRef]
- Northrop-Clewes, C.A. Interpreting indicators of iron status during an acute phase response--lessons from malaria and human immunodeficiency virus. Ann. Clin. Biochem. 2008, 45 Pt 1, 18–32. [Google Scholar] [CrossRef]
- Polak, G.; Wertel, I.; Tarkowski, R.; Morawska, D.; Kotarski, J. Decreased lactoferrin levels in peritoneal fluid of women with minimal endometriosis. Eur. J. Obstet. Gynecol. Reprod. Biol. 2007, 131, 93–96. [Google Scholar] [CrossRef]
- Riley, C.F.; Moen, M.; Videm, V. Inflammatory markers in endometriosis: Reduced peritoneal neutrophil response in minimal endometriosis. Acta Obstet. Gynecol. Scand. 2007, 86, 877–881. [Google Scholar] [CrossRef]
- Van Langendonckt, A.; Casanas-Roux, F.; Donnez, J. Oxidative stress and peritoneal endometriosis. Fertil. Steril. 2002, 77, 861–870. [Google Scholar] [CrossRef]
- Shigetomi, H.; Imanaka, S.; Kobayashi, H. Effects of iron-related compounds and bilirubin on redox homeostasis in endometriosis and its malignant transformations. Horm. Mol. Biol. Clin. Investig. 2021, 43, 187–192. [Google Scholar] [CrossRef]
- Bournazou, I.; Pound, J.D.; Duffin, R.; Bournazos, S.; Melville, L.A.; Brown, S.B.; Rossi, A.G.; Gregory, C.D. Apoptotic human cells inhibit migration of granulocytes via release of lactoferrin. J. Clin. Investig. 2009, 119, 20–32. [Google Scholar] [CrossRef] [Green Version]
- Francis, N.; Wong, S.H.; Hampson, P.; Wang, K.; Young, S.P.; Deigner, H.P.; Salmon, M.; Scheel-Toellner, D.; Lord, J.M. Lactoferrin inhibits neutrophil apoptosis via blockade of proximal apoptotic signaling events. Biochim. Biophys. Acta 2011, 1813, 1822–1826. [Google Scholar] [CrossRef] [Green Version]
- Wong, S.H.; Francis, N.; Chahal, H.; Raza, K.; Salmon, M.; Scheel-Toellner, D.; Lord, J.M. Lactoferrin is a survival factor for neutrophils in rheumatoid synovial fluid. Rheumatology 2008, 48, 39–44. [Google Scholar] [CrossRef] [Green Version]
- Dunselman, G.A.; Bouckaert, P.; Evers, J. The acute-phase response in endometriosis of women. J. Reprod. Fertil. 1988, 83, 803–808. [Google Scholar] [CrossRef] [Green Version]
- Silva, A.M.N.; Moniz, T.; de Castro, B.; Rangel, M. Human transferrin: An inorganic biochemistry perspective. Coord. Chem. Rev. 2021, 449, 214186. [Google Scholar] [CrossRef]
- Goławski, K.; Soczewica, R.; Kacperczyk-Bartnik, J.; Mańka, G.; Kiecka, M.; Lipa, M.; Warzecha, D.; Spaczyński, R.; Piekarski, P.; Banaszewska, B.; et al. The Role of Cadherin 12 (CDH12) in the Peritoneal Fluid among Patients with Endometriosis and Endometriosis-Related Infertility. Int. J. Environ. Res. Public Health 2022, 19, 11586. [Google Scholar] [CrossRef] [PubMed]
- Anonymous. Revised American Society for Reproductive Medicine classification of endometriosis: 1996. Fertil. Steril. 1997, 67, 817–821. [Google Scholar] [CrossRef] [PubMed]


| Variable | No Endometriosis (n = 33) | Endometriosis (n = 57) | p |
|---|---|---|---|
| Age, (mean ± SD) | 30.52 ± 5.95 | 31.35 ± 4.63 | 0.906 |
| Pelvic pain, n (%) | 8 (24.24) | 1 (1.75) | 0.002 |
| Primary infertility, n (%) | 6 (18.18) | 16 (28.07) | 0.293 |
| Secondary infertility, n (%) | 6 (18.18) | 2 (3.51) | 0.049 |
| Endometrial cysts, n (%) | - | 18 (31.58) | - |
| Stage of endometriosis, n (%): | - | ||
| I | - | 18 (31.58) | |
| II | - | 7 (12.28) | |
| III | - | 23 (40.35) | |
| IV | - | 9 (15.79) | |
| Phase of cycle, n (%): | 0.164 | ||
| Follicular | 25 (75.76) | 35 (61.40) | |
| Luteal | 8 (24.24) | 22 (38.60) |
| Variables | All (n = 90) | p1 | No Endometriosis (n = 33) | p2 | Endometriosis (n = 57) | p3 | |||
|---|---|---|---|---|---|---|---|---|---|
| Plasma | Peritoneal Fluid | Plasma | Peritoneal Fluid | Plasma | Peritoneal Fluid | ||||
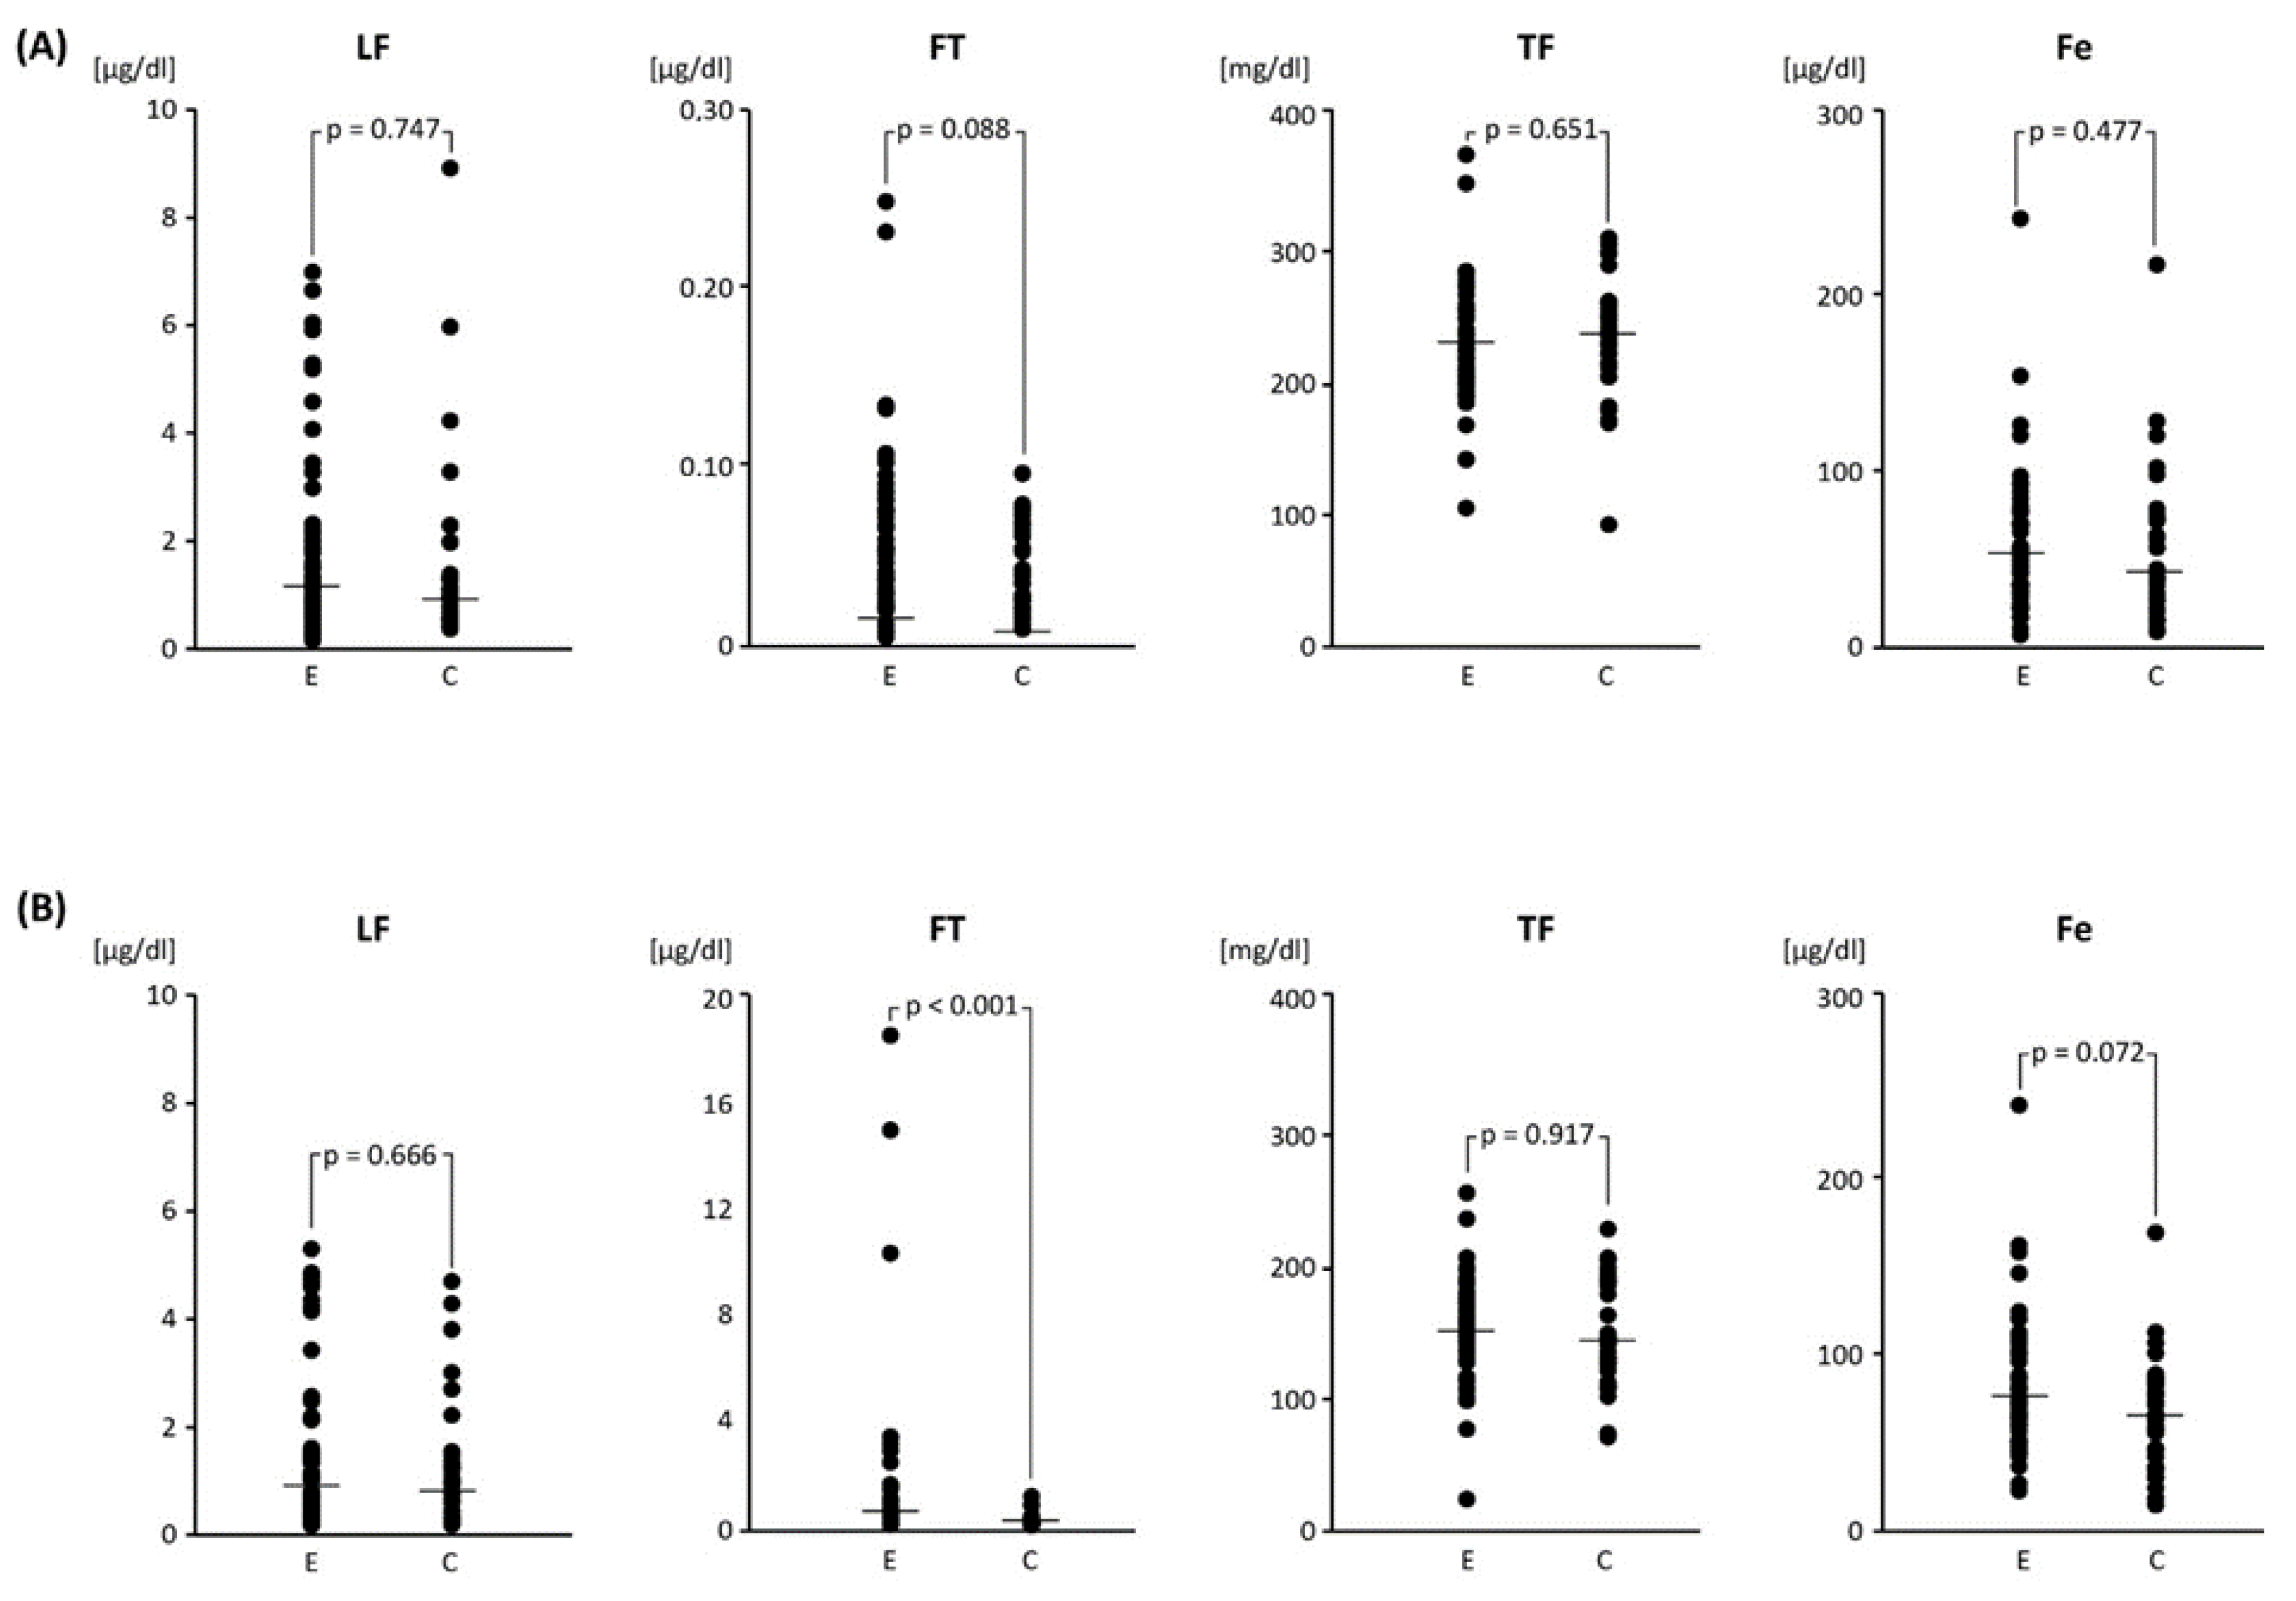
| Lactoferrin (µg/mL) | 1.71 ± 1.75 (0.16–8.92) 1.07 | 1.35 ± 1.33 (0.11–5.19) 0.92 | 0.220 | 1.59 ± 1.76 (0.37–8.92) 0.97 | 1.21 ± 1.15 (0.12–4.57) 0.91 | 0.326 | 1.77 ± 1.75 (0.16–6.99) 1.15 | 1.43 ± 1.43 (0.11–5.19) 0.98 | 0.397 |
| Ferritin (µg/mL) | 0.05 ± 0.04 (0.01–0.25) 0.04 | 0.92 ± 2.73 (0.01–18.62) 0.16 | <0.001 | 0.04 ± 0.02 (0.01–0.10) 0.03 | 0.16 ± 0.21 (0.02–0.94) 0.08 | <0.001 | 0.06 ± 0.05 (0.01–0.25) 0.05 | 1.36 ± 3.36 (0.01–18.62) 0.22 | <0.001 |
| Transferrin (mg/dL) | 229.10 ± 44.89 (84.00–375.00) 227.00 | 150.80 ± 37.9 (18.00–254.00) 150.00 | <0.001 | 229.1 ± 45.60 (84.00–307.00) 231.00 | 152.80 ± 38.90 (75.00–234.00) 148.00 | <0.001 | 229.00 ± 44.80 (106.00–375.00) 227.00 | 149.60 ± 37.60 (18.00–254.00) 152.00 | <0.001 |
| Iron (µg/dL) | 55.60 ± 40.30 (7.00–245.00) 46.50 | 73.70 ± 36.10 (12.00–242.00) 70.00 | <0.001 | 53.70 ± 42.70 (9.00–215.00) 40.00 | 64.10 ± 32.40 (12.00–170.00) 62.00 | 0.089 | 56.70 ± 39.20 (7.00–245.00) 50.00 | 79.30 ± 37.30 (22.00–242.00) 72.00 | <0.001 |
| Variables | Endometriosis Stage | |||||||||
|---|---|---|---|---|---|---|---|---|---|---|
| Plasma | Peritoneal Fluid | |||||||||
| Stage I (n = 18) | Stage II (n = 7) | Stage III (n = 23) | Stage IV (n = 9) | p1 | Stage I (n = 18) | Stage II (n = 7) | Stage III (n = 23) | Stage IV (n = 9) | p2 | |
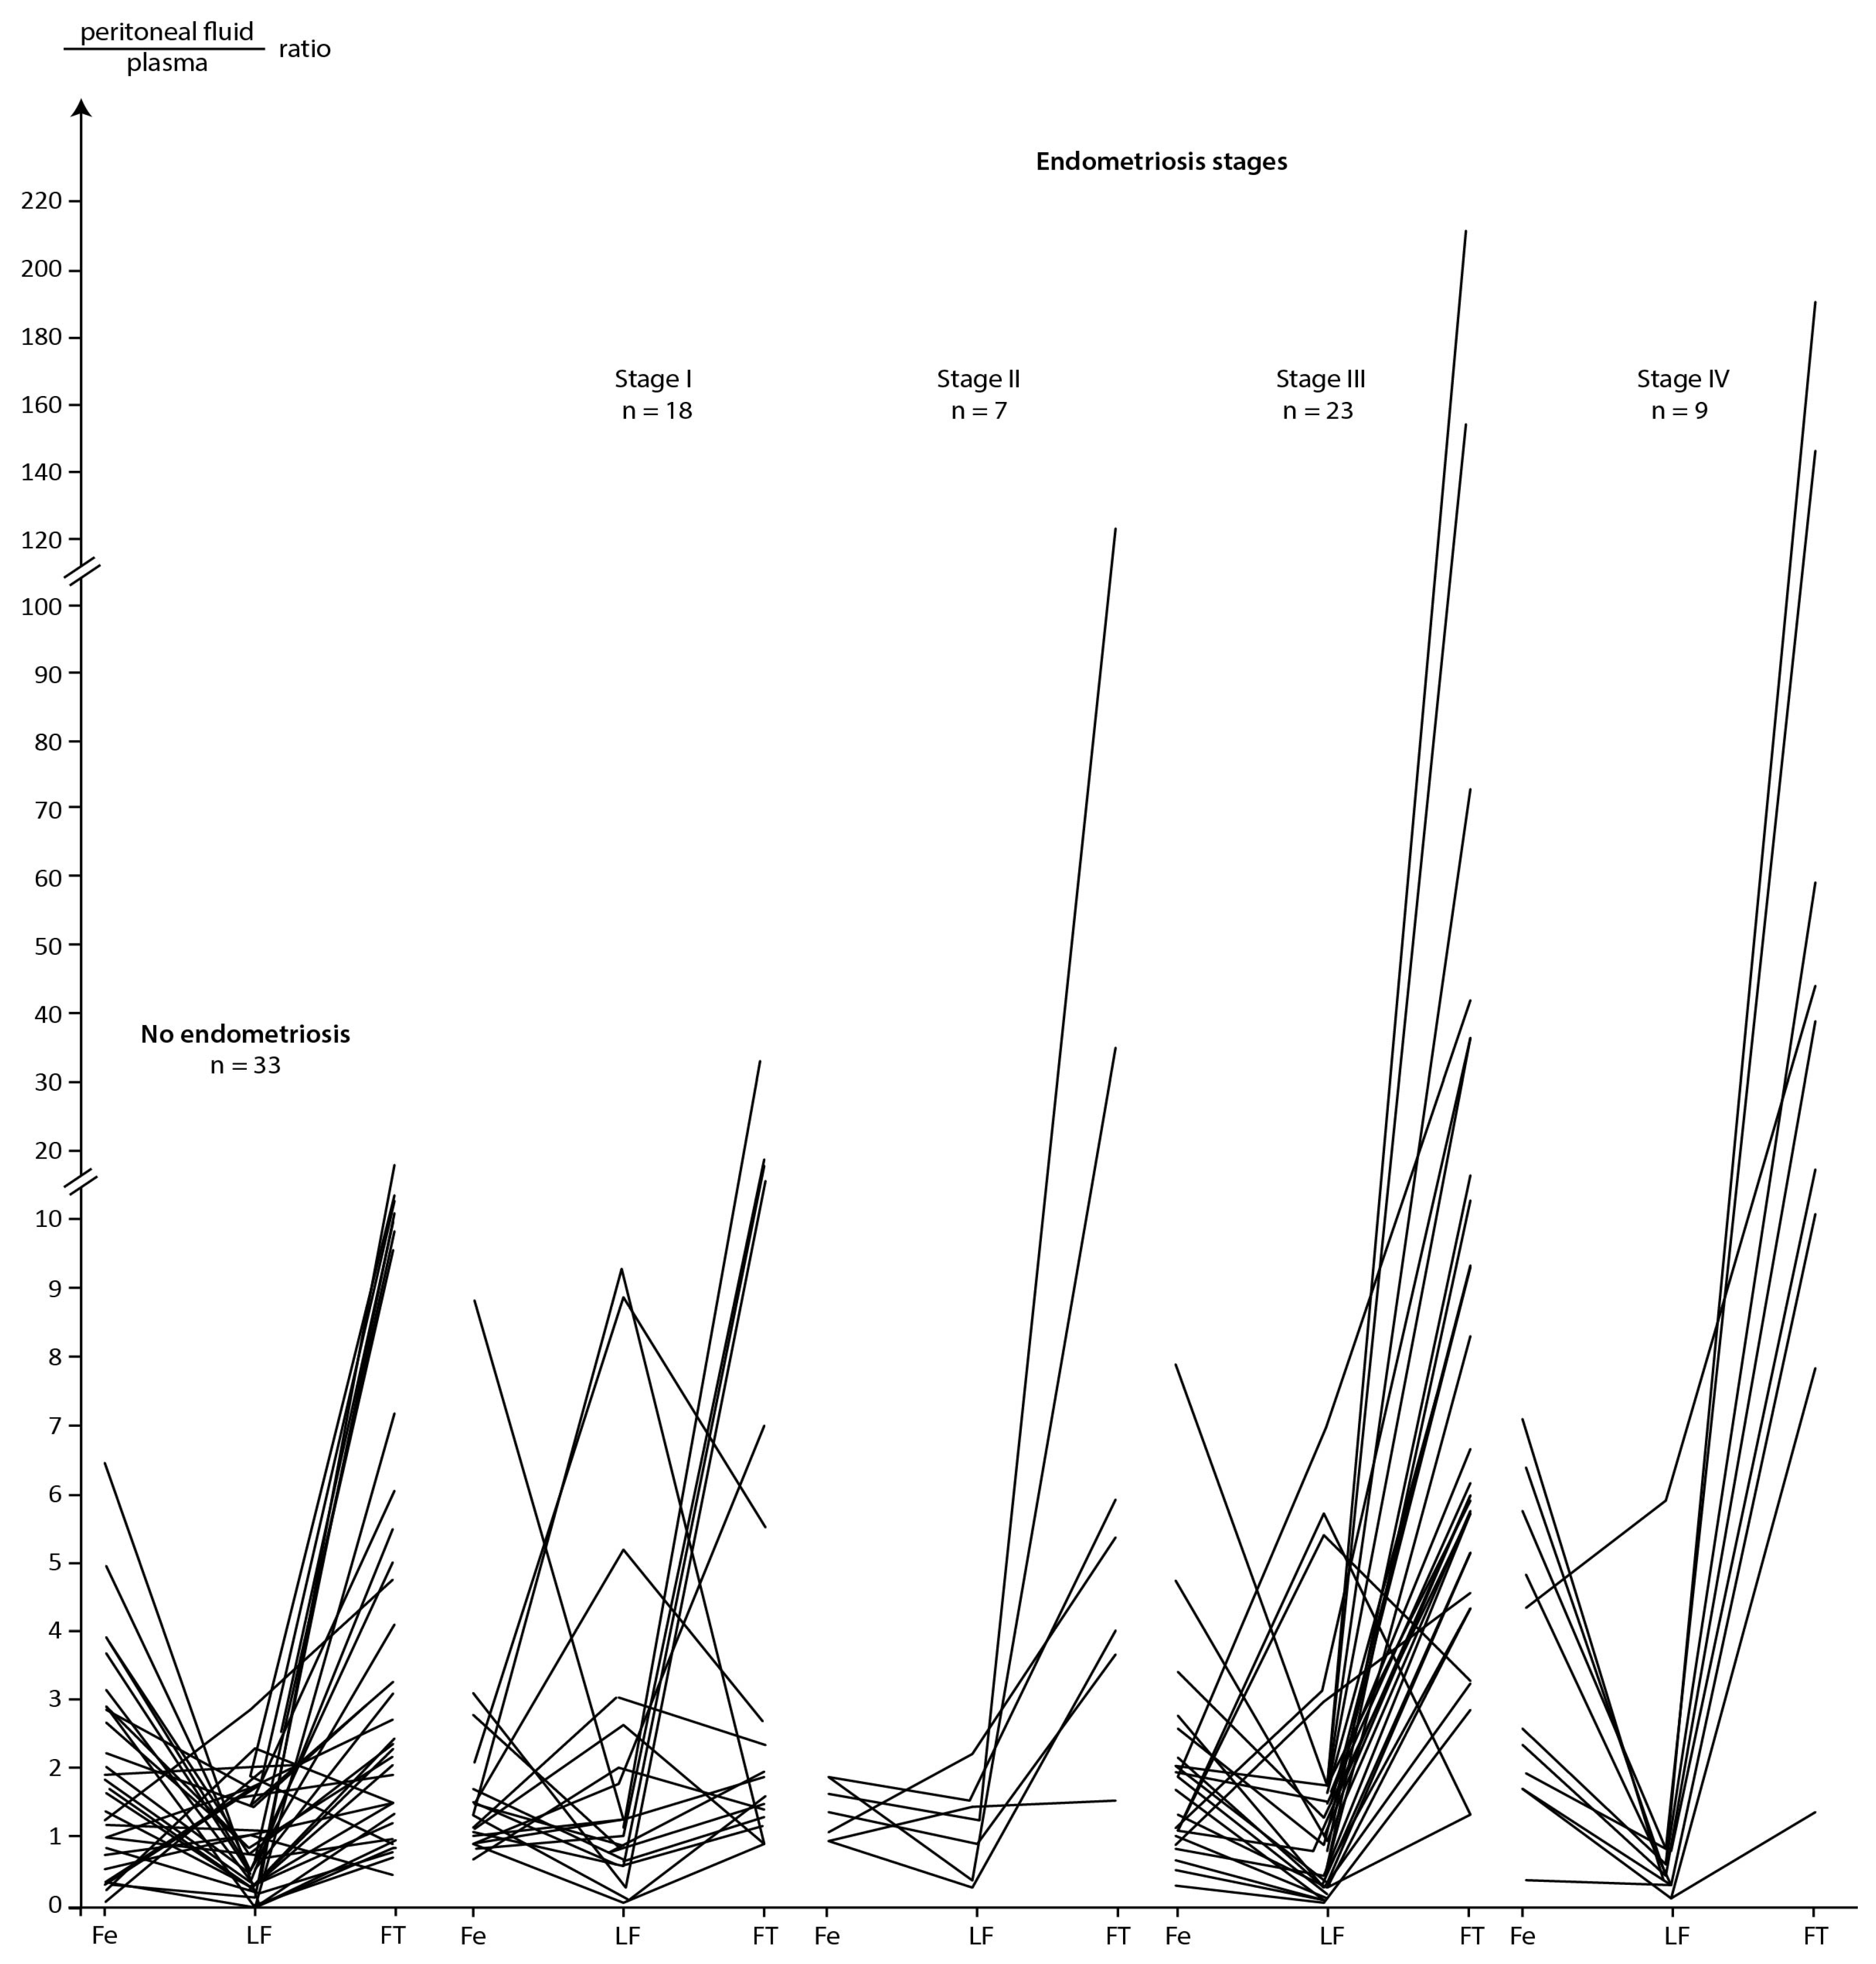
| Lactoferrin (µg/mL) | 1.48 ± 1.60 (0.27–6.05) 0.85 | 1.99 ± 1.94 (0.20–5.91) 1.33 | 1.79 ± 1.94 (0.16–6.99) 1.09 | 2.17 ± 1.58 (0.26–5.28) 1.78 | 0.388 | 1.94 ± 1.82 (0.15–5.19) 0.95 | 1.73 ± 1.69 (0.28–4.25) 1.26 | 1.09 ± 1.13 (0.11–4.75) 0.64 | 1.03 ± 0.59 (0.12–1.54) 1.38 | 0.461 |
| Ferritin (µg/mL) | 0.06 ± 0.04 (0.01–0.13) 0.05 * | 0.06 ± 0.04 (0.01–0.11) 0.06 * | 0.06 ± 0.05 (0.01–0.25) 0.04 * | 0.08 ± 0.06 (0.04–0.23) 0.06 * | 0.601 | 0.15 ± 0.11 (0.04–0.48) 0.13 *a,b | 0.59 ± 0.52 (0.01–1.55) 0.47 * | 1.50 ± 3.83 (0.07–18.62) 0.41 *a | 4.03 ± 5.17 (0.33–15.02) 2.39 *b | <0.001 |
| Transferrin (mg/dL) | 214.30 ± 39.60 (106.00–286.00) 217.00 * | 251.50 ± 62.50 (200.00–375.00) 219.00 * | 230.50 ± 46.90 (143.00–353.00) 227.00 | 237.00 ± 27.40 (191.00–276.00) 237.00 | 0.381 | 134.5 ± 23.0 (94.00–174.00) 138.00 * | 160.0 ± 24.6 (124.00–196.00) 162.00 * | 152.2 ± 44.6 (18.00–254.00) 155.00 * | 165.00 ± 44.00 (72.00–234.00) 164.00 * | 0.026 |
| Iron (µg/dL) | 45.50 ± 22.34 (7.00–81.0) 43.00 * | 51.00 ± 19.94 (35.00–93.00) 46.00 | 64.30 ± 36.83 (11.00–155.00) 57.00 | 64.22 ± 71.90 (17.00–245.00) 42.00 | 0.473 | 58.11 ± 18.88 (26.00–108.00) 58.00 *a,b | 68.43 ± 20.94 (47.00–110.00) 68.00 c | 82.52 ± 28.75 (22.00–146.00) 86.00 a | 122.00 ± 56.54 (72.00–242.00) 100.00 b,c | <0.001 |
| Variables | Group | Plasma | Peritoneal Fluid | |||||||
|---|---|---|---|---|---|---|---|---|---|---|
| LF | FT | Fe | TF | LF | FT | Fe | TF | |||
| Plasma | LF | C | 0.37 | 0.36 | 0.55 | 0.38 | ||||
| E | 0.52 | 0.28 | ||||||||
| FT | C | 0.37 | ||||||||
| E | −0.45 | |||||||||
| Fe | C | |||||||||
| E | 0.52 | 0.39 | ||||||||
| TF | C | |||||||||
| E | 0.28 | −0.45 | 0.39 | 0.52 | ||||||
| Peritoneal fluid | LF | C | 0.36 | 0.55 | 0.38 | |||||
| E | ||||||||||
| FT | C | |||||||||
| E | 0.60 | 0.30 | ||||||||
| Fe | C | |||||||||
| E | 0.60 | 0.36 | ||||||||
| TF | C | |||||||||
| E | 0.52 | 0.30 | 0.36 | |||||||
| Variables | Stage | Plasma | Peritoneal Fluid | |||||||
|---|---|---|---|---|---|---|---|---|---|---|
| LF | FT | Fe | TF | LF | FT | Fe | TF | |||
| Plasma | LF | I and II | 0.62 | |||||||
| III and IV | 0.49 | |||||||||
| FT | I and II | |||||||||
| III and IV | −0.57 | |||||||||
| Fe | I and II | 0.62 | 0.60 | |||||||
| III and IV | 0.49 | 0.50 | ||||||||
| TF | I and II | 0.42 | ||||||||
| III and IV | −0.57 | 0.50 | 0.50 | |||||||
| Peritoneal fluid | LF | I and II | ||||||||
| III and IV | 0.37 | 0.39 | ||||||||
| FT | I and II | 0.44 | ||||||||
| III and IV | 0.37 | 0.63 | ||||||||
| Fe | I and II | 0.60 | 0.44 | |||||||
| III and IV | 0.39 | 0.63 | ||||||||
| TF | I and II | 0.42 | ||||||||
| III and IV | 0.50 | |||||||||
| Variables (Peritoneal Fluid/Plasma) | Peritoneal Fluid to Plasma Ratio | p | ||
|---|---|---|---|---|
| All (n = 90) | No Endometriosis (n = 33) | Endometriosis (n = 57) | ||
| Lactoferrin ratio | 1.41 ± 1.79 (0.04–9.24) 0.78 | 1.02 ± 0.73 (0.04–2.85) 0.76 | 1.64 ± 2.15 (0.04–9.24) 0.79 | 0.998 |
| Ferritin ratio | 17.82 ± 39.03 (0.45–214.02) 4.41 | 4.11 ± 4.14 (0.45–15.34) 2.40 | 25.77 ± 47.29 (0.86–214.02) 5.76 | 0.001 |
| Transferrin ratio | 0.68 ± 0.19 (0.09–1.55) 0.68 | 0.69 ± 0.24 (0.29–1.55) 0.67 | 0.67 ± 0.17 (0.09–1.38) 0.68 | 0.847 |
| Iron ratio | 1.98 ± 1.66 (0.17–8.86) 1.48 | 1.87 ± 1.42 (0.19–6.44) 1.43 | 2.05 ± 1.79 (0.17–8.86) 1.54 | 0.867 |
Disclaimer/Publisher’s Note: The statements, opinions and data contained in all publications are solely those of the individual author(s) and contributor(s) and not of MDPI and/or the editor(s). MDPI and/or the editor(s) disclaim responsibility for any injury to people or property resulting from any ideas, methods, instructions or products referred to in the content. |
© 2023 by the authors. Licensee MDPI, Basel, Switzerland. This article is an open access article distributed under the terms and conditions of the Creative Commons Attribution (CC BY) license (https://creativecommons.org/licenses/by/4.0/).
Share and Cite
Skarżyńska, E.; Wróbel, M.; Zborowska, H.; Kołek, M.F.; Mańka, G.; Kiecka, M.; Lipa, M.; Warzecha, D.; Spaczyński, R.; Piekarski, P.; et al. The Influence of Lactoferrin in Plasma and Peritoneal Fluid on Iron Metabolism in Women with Endometriosis. Int. J. Mol. Sci. 2023, 24, 1619. https://doi.org/10.3390/ijms24021619
Skarżyńska E, Wróbel M, Zborowska H, Kołek MF, Mańka G, Kiecka M, Lipa M, Warzecha D, Spaczyński R, Piekarski P, et al. The Influence of Lactoferrin in Plasma and Peritoneal Fluid on Iron Metabolism in Women with Endometriosis. International Journal of Molecular Sciences. 2023; 24(2):1619. https://doi.org/10.3390/ijms24021619
Chicago/Turabian StyleSkarżyńska, Ewa, Monika Wróbel, Hanna Zborowska, Mateusz Franciszek Kołek, Grzegorz Mańka, Mariusz Kiecka, Michał Lipa, Damian Warzecha, Robert Spaczyński, Piotr Piekarski, and et al. 2023. "The Influence of Lactoferrin in Plasma and Peritoneal Fluid on Iron Metabolism in Women with Endometriosis" International Journal of Molecular Sciences 24, no. 2: 1619. https://doi.org/10.3390/ijms24021619