
Pure Platelet and Leukocyte–Platelet-Rich Plasma for Regenerative Medicine in Orthopedics—Time- and Preparation-Dependent Release of Growth Factors and Effects on Synovial Fibroblasts: A Comparative Analysis
 , and
, and
Abstract
:1. Introduction
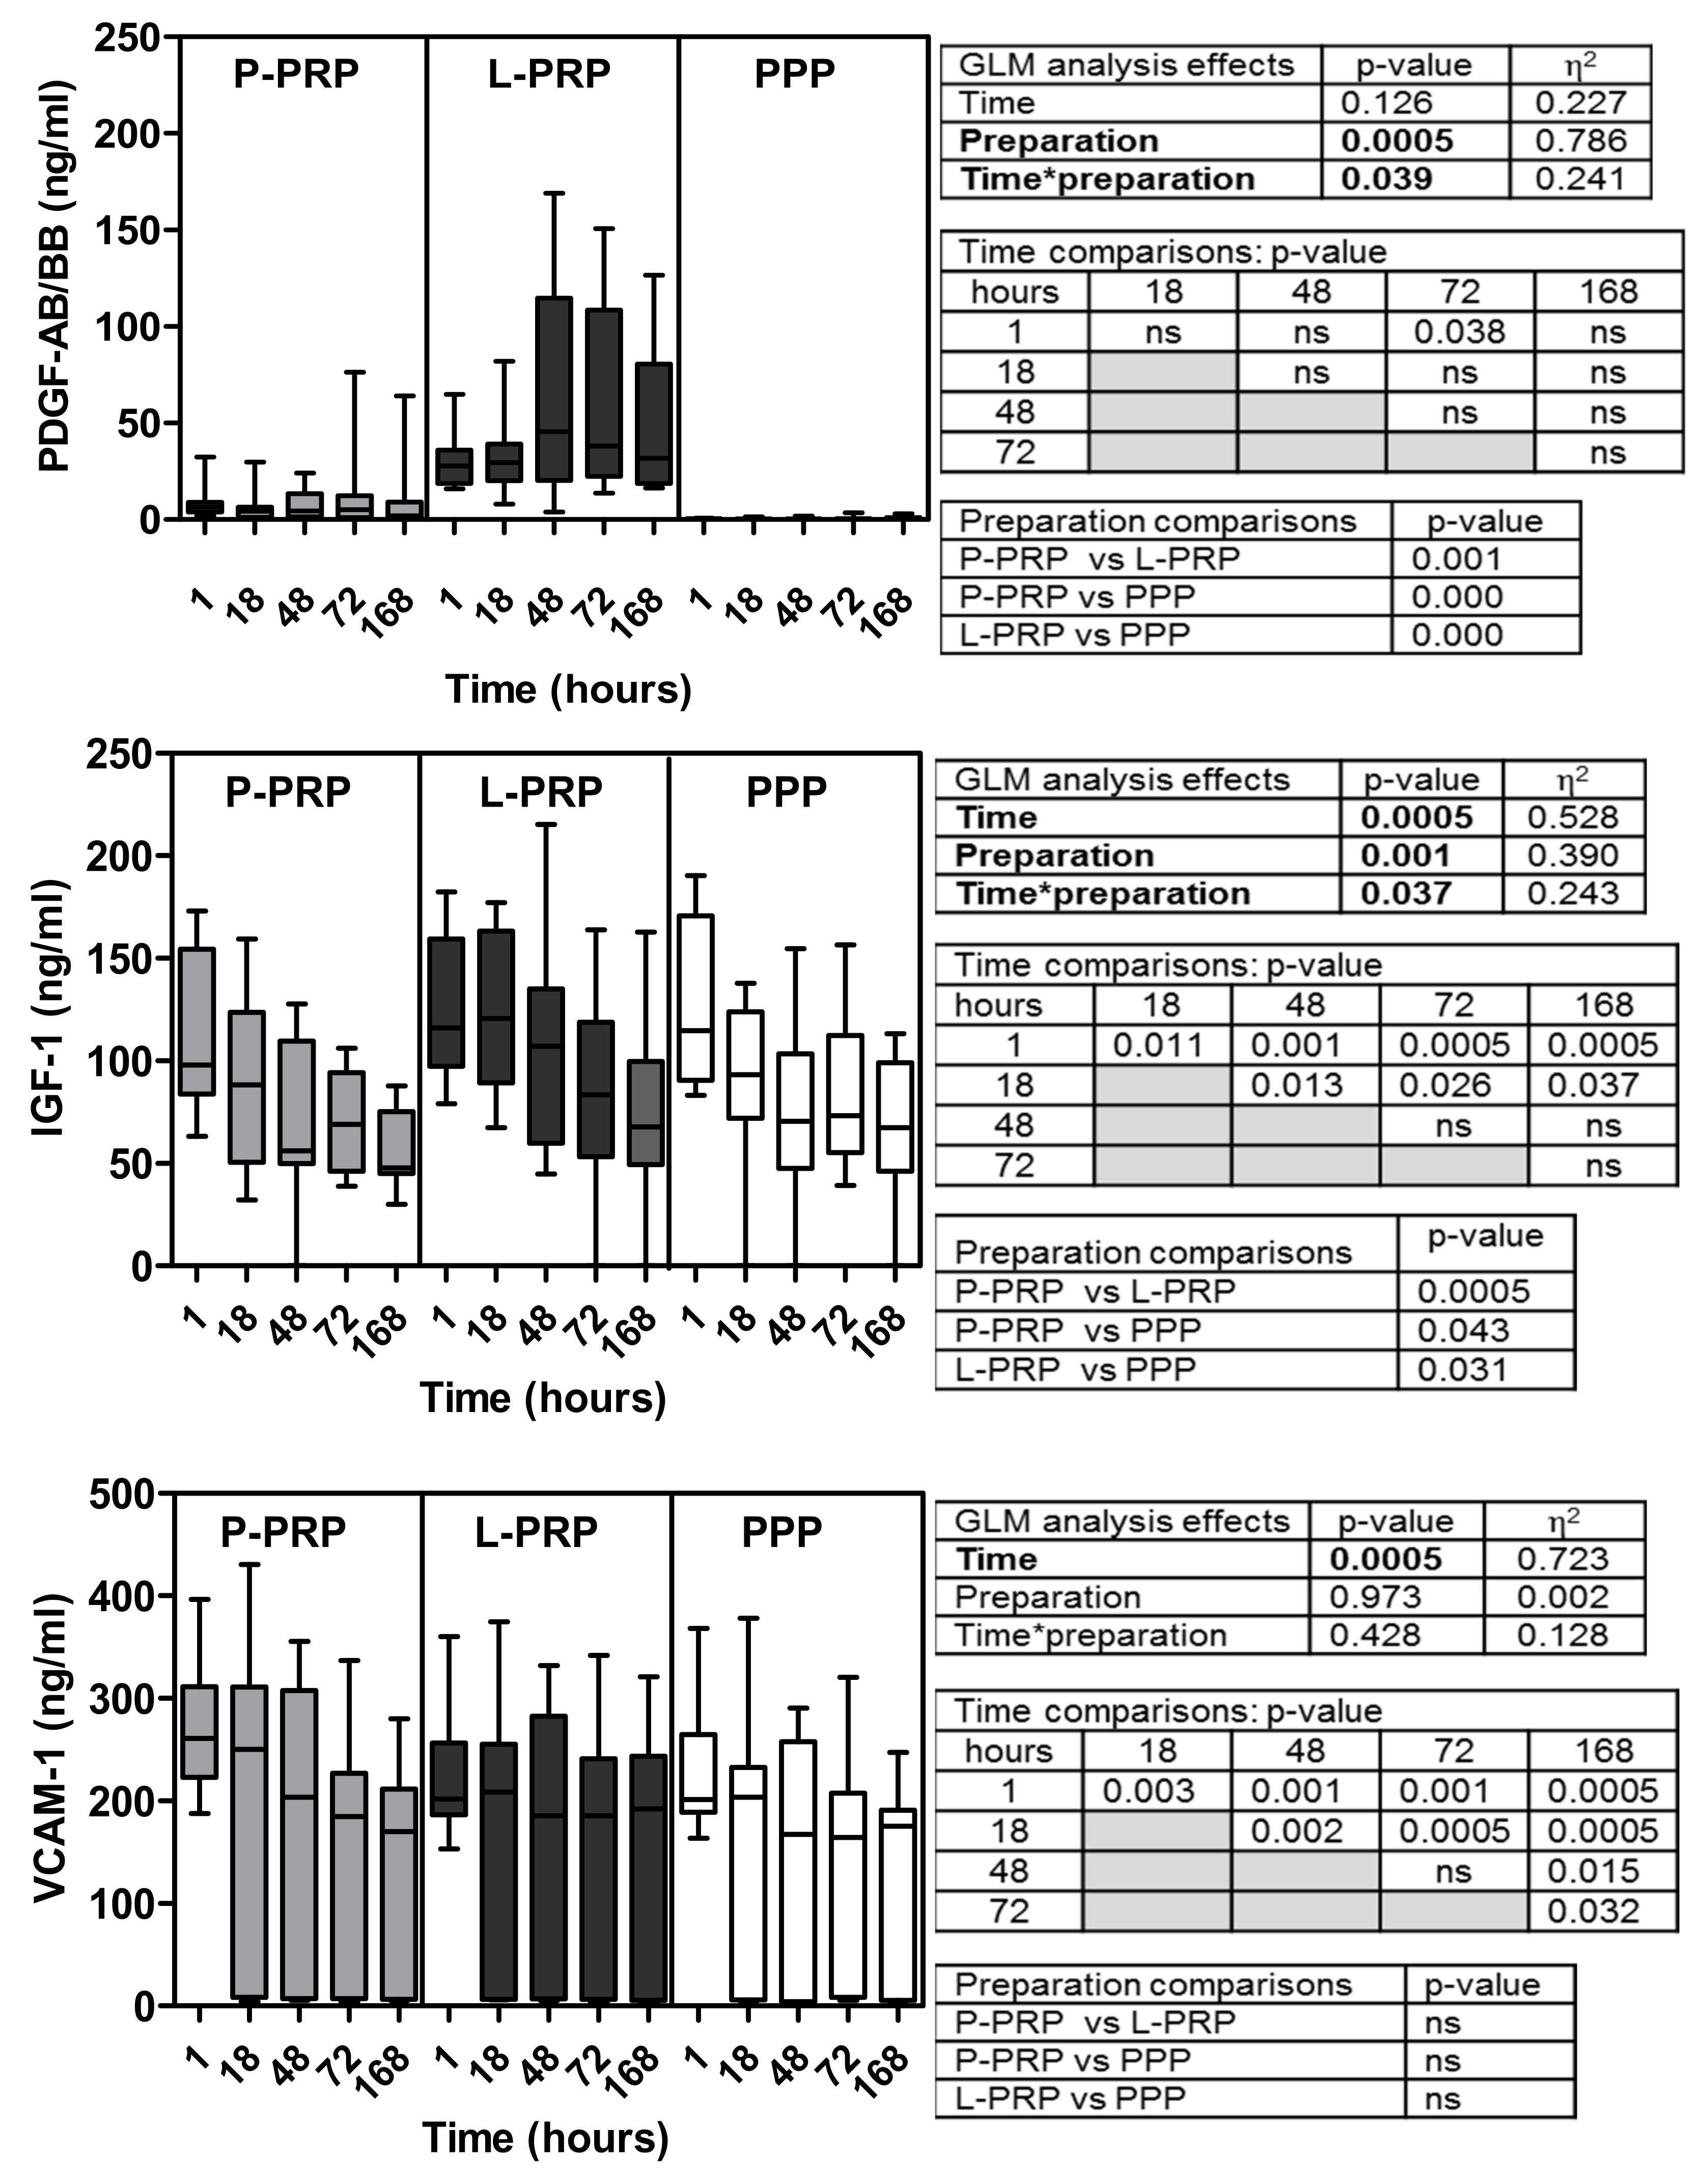
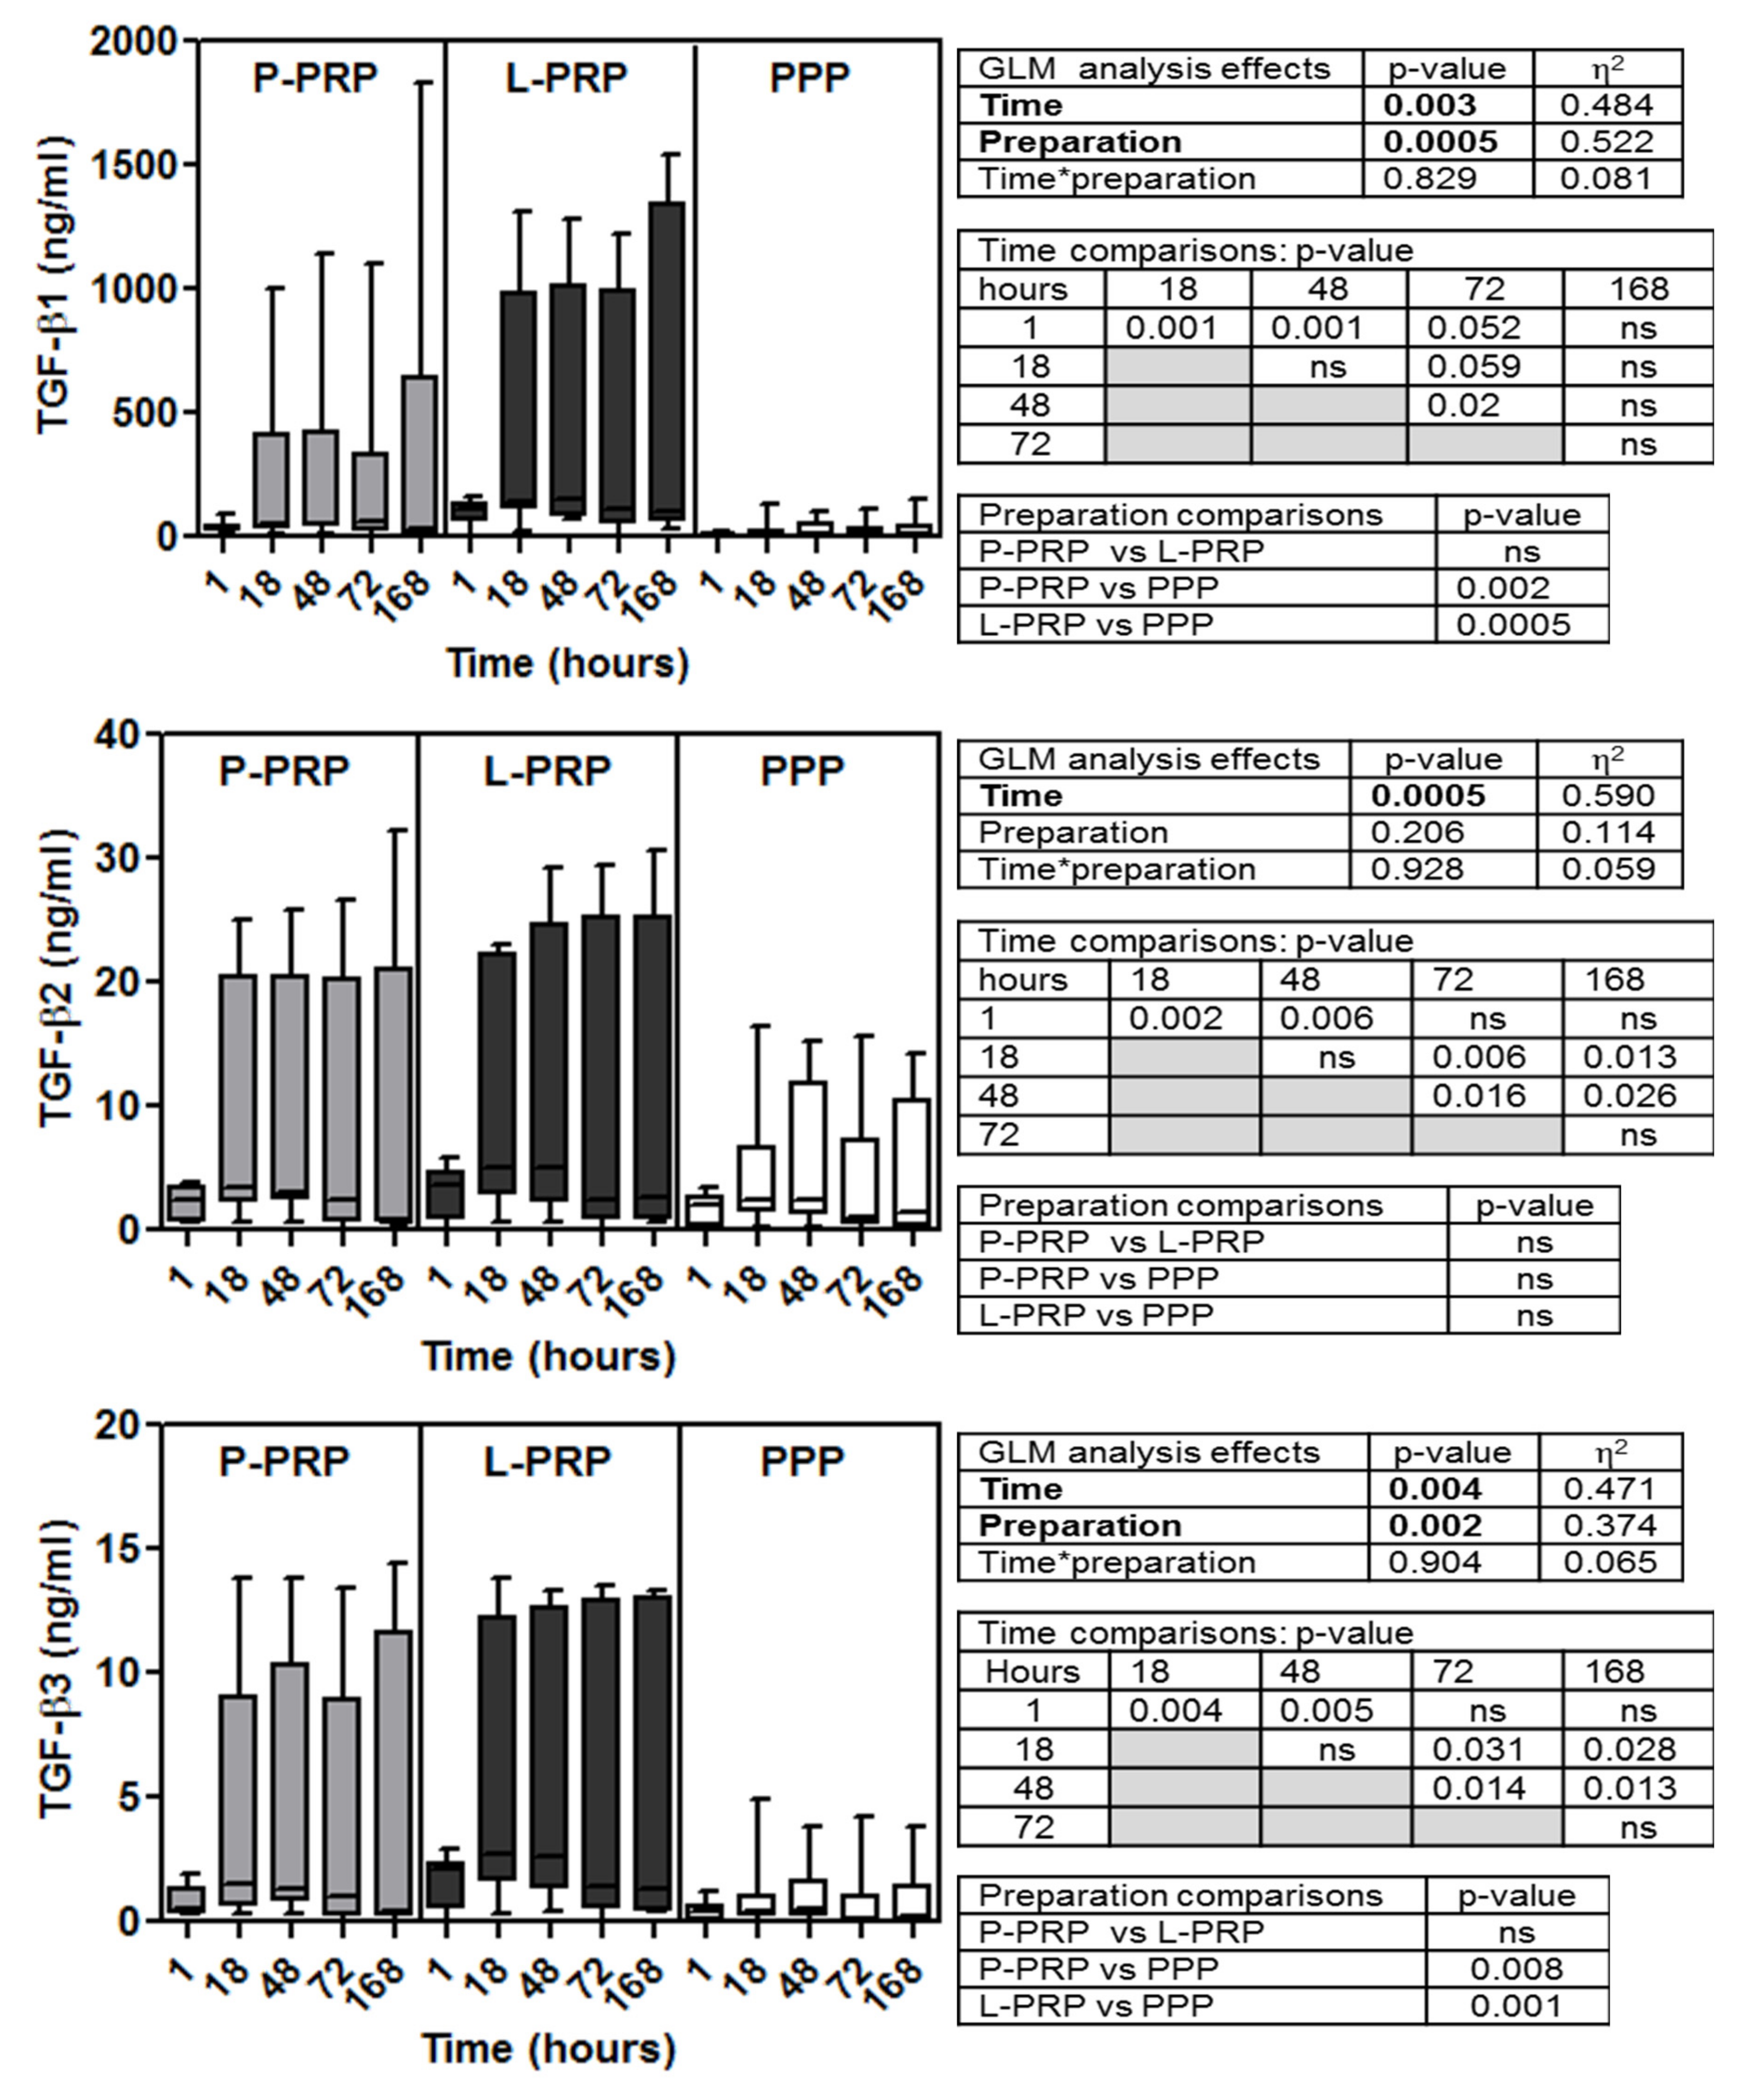
2. Results
2.1. Platelet and White Blood Cell Concentrations
2.2. Growth Factor Concentrations: Time- and Preparation-Dependent Modifications
2.3. Functional Analyses: Growth of Synovial Fibroblasts and HA Production
3. Discussion
4. Materials and Methods
4.1. Subjects
4.2. Preparation of Platelet Rich Products
4.2.1. One-Step Pure PRP (P-PRP) Method
4.2.2. Two-Step Leukocyte PRP (L-PRP) Method
4.3. Analysis of Platelet and White Blood Cell Concentrations
4.4. Activation of Platelet Concentrates
4.5. Isolation, Culture, Growth of Synovial Fibroblasts and Hyaluronic Acid Production
4.6. Supernatant Protein Evaluation
4.7. Data Analysis and Statistics
Supplementary Materials
Author Contributions
Funding
Institutional Review Board Statement
Informed Consent Statement
Data Availability Statement
Acknowledgments
Conflicts of Interest
References
- Chen, H.; Tan, X.N.; Hu, S.; Liu, R.Q.; Peng, L.H.; Li, Y.M.; Wu, P. Molecular Mechanisms of Chondrocyte Proliferation and Differentiation. Front. Cell. Dev. Biol. 2021, 9, 664168. [Google Scholar] [CrossRef] [PubMed]
- Tonomura, H.; Nagae, M.; Takatori, R.; Ishibashi, H.; Itsuji, T.; Takahashi, K. The Potential Role of Hepatocyte Growth Factor in Degenerative Disorders of the Synovial Joint and Spine. Int. J. Mol. Sci. 2020, 21, 8717. [Google Scholar] [CrossRef] [PubMed]
- Anitua, E.; Nurden, P.; Prado, R.; Nurden, A.T.; Padilla, S. Autologous fibrin scaffolds: When platelet- and plasma-derived biomolecules meet fibrin. Biomaterials 2019, 192, 440–460. [Google Scholar] [CrossRef] [PubMed]
- Boswell, S.G.; Cole, B.J.; Sundman, E.A.; Karas, V.; Fortier, L.A. Platelet-rich plasma: A milieu of bioactive factors. Arthroscopy 2012, 28, 429–439. [Google Scholar] [CrossRef] [PubMed]
- Deppermann, C.; Kubes, P. Start a fire, kill the bug: The role of platelets in inflammation and infection. Innate Immun. 2018, 24, 335–348. [Google Scholar] [CrossRef] [Green Version]
- Le, A.D.K.; Enweze, L.; DeBaun, M.R.; Dragoo, J.L. Current Clinical Recommendations for Use of Platelet-Rich Plasma. Curr. Rev. Musculoskelet Med. 2018, 11, 624–634. [Google Scholar] [CrossRef]
- Dhillon, M.S.; Behera, P.; Patel, S.; Shetty, V. Orthobiologics and platelet rich plasma. Indian J. Orthop. 2014, 48, 1–9. [Google Scholar] [CrossRef]
- O’Connell, B.; Wragg, N.M.; Wilson, S.L. The use of PRP injections in the management of knee osteoarthritis. Cell Tissue Res. 2019, 376, 143–152. [Google Scholar] [CrossRef] [Green Version]
- Mariani, E.; Pulsatelli, L. Platelet Concentrates in Musculoskeletal Medicine. Int. J. Mol. Sci. 2020, 21, 1328. [Google Scholar] [CrossRef] [Green Version]
- Mariani, E.; Canella, V.; Berlingeri, A.; Bielli, A.; Cattini, L.; Landini, M.P.; Kon, E.; Marcacci, M.; Di Matteo, B.; Filardo, G. Leukocyte presence does not increase microbicidal activity of Platelet-rich Plasma in vitro. BMC Microbiol. 2015, 15, 149. [Google Scholar] [CrossRef]
- Gilbertie, J.M.; Schaer, T.P.; Engiles, J.B.; Seiler, G.S.; Deddens, B.L.; Schubert, A.G.; Jacob, M.E.; Stefanovski, D.; Ruthel, G.; Hickok, N.J.; et al. A Platelet-Rich Plasma-Derived Biologic Clears Staphylococcus aureus Biofilms While Mitigating Cartilage Degeneration and Joint Inflammation in a Clinically Relevant Large Animal Infectious Arthritis Model. Front. Cell. Infect. Microbiol. 2022, 12, 895022. [Google Scholar] [CrossRef]
- Andia, I.; Maffulli, N. Platelet-rich plasma for managing pain and inflammation in osteoarthritis. Nat. Rev. Rheumatol. 2013, 9, 721–730. [Google Scholar] [CrossRef]
- Lansdown, D.A.; Fortier, L.A. Platelet-Rich Plasma: Formulations, Preparations, Constituents, and Their Effects. Oper. Tech. Sports Med. 2017, 25, 7–12. [Google Scholar] [CrossRef] [Green Version]
- Weibrich, G.; Kleis, W.K.; Hafner, G.; Hitzler, W.E. Growth factor levels in platelet-rich plasma and correlations with donor age, sex, and platelet count. J. Craniomaxillofac. Surg. 2002, 30, 97–102. [Google Scholar] [CrossRef]
- Montagnana, M.; Salvagno, G.L.; Lippi, G. Circadian variation within hemostasis: An underrecognized link between biology and disease? Semin. Thromb. Hemost. 2009, 35, 23–33. [Google Scholar] [CrossRef]
- Amin, I.; Gellhorn, A.C. Platelet-Rich Plasma Use in Musculoskeletal Disorders: Are the Factors Important in Standardization Well Understood? Phys. Med. Rehabil. Clin. N. Am. 2019, 30, 439–449. [Google Scholar] [CrossRef]
- Zhang, N.; Wang, K.; Li, Z.; Luo, T. Comparative study of different anticoagulants and coagulants in the evaluation of clinical application of platelet-rich plasma (PRP) standardization. Cell Tissue Bank. 2019, 20, 61–75. [Google Scholar] [CrossRef]
- Pinto, N.R.; Ubilla, M.; Zamora, Y.; Del Rio, V.; Dohan Ehrenfest, D.M.; Quirynen, M. Leucocyte- and platelet-rich fibrin (L-PRF) as a regenerative medicine strategy for the treatment of refractory leg ulcers: A prospective cohort study. Platelets 2018, 29, 468–475. [Google Scholar] [CrossRef] [Green Version]
- Sanchez-Avila, R.M.; Merayo-Lloves, J.; Riestra, A.C.; Berisa, S.; Lisa, C.; Sánchez, J.A.; Muruzabal, F.; Orive, G.; Anitua, E. Plasma rich in growth factors membrane as coadjuvant treatment in the surgery of ocular surface disorders. Medicine 2018, 97, e0242. [Google Scholar] [CrossRef]
- Migliorini, F.; Driessen, A.; Quack, V.; Sippel, N.; Cooper, B.; Mansy, Y.E.; Tingart, M.; Eschweiler, J. Comparison between intra-articular infiltrations of placebo, steroids, hyaluronic and PRP for knee osteoarthritis: A Bayesian network meta-analysis. Arch. Orthop. Trauma Surg. 2021, 141, 1473–1490. [Google Scholar] [CrossRef]
- Bannuru, R.; Osani, M.; Vaysbrot, E.E.; Arden, N.; Bennell, K.; Bierma-Zeinstra, S.; Kraus, V.B.; Lohmander, L.S.; Abbott, J.H.; Bhandari, M.; et al. OARSI guidelines for the non-surgical management of knee, hip, and polyarticular osteoarthritis. Osteoarthr. Cartil. 2019, 27, 1578–1589. [Google Scholar] [CrossRef] [PubMed] [Green Version]
- Castillo, T.N.; Pouliot, M.A.; Kim, H.J.; Dragoo, J.L. Comparison of growth factor and platelet concentration from commercial platelet-rich plasma separation systems. Am. J. Sports Med. 2011, 39, 266–271. [Google Scholar] [CrossRef] [PubMed]
- Dohan Ehrenfest, D.M.; de Peppo, G.M.; Doglioli, P.; Sammartino, G. Slow release of growth factors and thrombospondin-1 in Choukroun’s platelet-rich fibrin (PRF): A gold standard to achieve for all surgical platelet concentrates technologies. Growth Factors 2009, 27, 63–69. [Google Scholar] [CrossRef] [PubMed]
- He, L.; Lin, Y.; Hu, X.; Zhang, Y.; Wu, H. A comparative study of platelet-rich fibrin (PRF) and platelet-rich plasma (PRP) on the effect of proliferation and differentiation of rat osteoblasts in vitro. Oral Surg. Oral Med. Oral Pathol. Oral Radiol. Endod. 2009, 108, 707–713. [Google Scholar] [CrossRef]
- Mazzucco, L.; Balbo, V.; Cattana, E.; Guaschino, R.; Borzini, P. Not every PRP-gel is born equal. Evaluation of growth factor availability for tissues through four PRP-gel preparations: Fibrinet, RegenPRP-Kit, Plateltex and one manual procedure. Vox Sang. 2009, 97, 110–118. [Google Scholar] [CrossRef]
- McCarrel, T.; Fortier, L. Temporal growth factor release from platelet-rich plasma, trehalose lyophilized platelets, and bone marrow aspirate and their effect on tendon and ligament gene expression. J. Orthop. Res. 2009, 27, 1033–1042. [Google Scholar] [CrossRef]
- Tsay, R.C.; Vo, J.; Burke, A.; Eisig, S.B.; Lu, H.H.; Landesberg, R. Differential growth factor retention by platelet-rich plasma composites. J. Oral Maxillofac. Surg. 2005, 63, 521–528. [Google Scholar] [CrossRef]
- Visser, L.C.; Arnoczky, S.P.; Caballero, O.; Egerbacher, M. Platelet-rich fibrin constructs elute higher concentrations of transforming growth factor-beta1 and increase tendon cell proliferation over time when compared to blood clots: A comparative in vitro analysis. Vet. Surg. 2010, 39, 811–817. [Google Scholar] [CrossRef]
- Zumstein, M.A.; Berger, S.; Schober, M.; Boileau, P.; Nyffeler, R.W.; Horn, M.; Dahinden, C.A. Leukocyte- and platelet-rich fibrin (L-PRF) for long-term delivery of growth factor in rotator cuff repair: Review, preliminary results and future directions. Curr. Pharm. Biotechnol. 2012, 13, 1196–1206. [Google Scholar] [CrossRef]
- Anitua, E.; Muruzabal, F.; Pino, A.; Prado, R.; Azkargorta, M.; Elortza, F.; Merayo-Lloves, J. Proteomic Characterization of Plasma Rich in Growth Factors and Undiluted Autologous Serum. Int. J. Mol. Sci. 2021, 22, 12176. [Google Scholar] [CrossRef]
- Cavallo, C.; Roffi, A.; Grigolo, B.; Mariani, E.; Pratelli, L.; Merli, G.; Kon, E.; Marcacci, M.; Filardo, G. Platelet-Rich Plasma: The Choice of Activation Method Affects the Release of Bioactive Molecules. Biomed. Res. Int. 2016, 2016, 1–7. [Google Scholar] [CrossRef] [Green Version]
- Messora, M.R.; Nagata, M.J.; Dornelles, R.C.; Bomfim, S.R.; Furlaneto, F.A.; de Melo, L.G.; Deliberador, T.M.; Bosco, A.F.; Garcia, V.G.; Fucini, S.E. Bone healing in critical-size defects treated with platelet-rich plasma activated by two different methods. A histologic and histometric study in rat calvaria. J. Periodontal. Res. 2008, 43, 723–729. [Google Scholar] [CrossRef]
- Landesberg, R.; Burke, A.; Pinsky, D.; Katz, R.; Vo, J.; Eisig, S.B.; Lu, H.H. Activation of platelet-rich plasma using thrombin receptor agonist peptide. J. Oral Maxillofac. Surg. 2005, 63, 529–535. [Google Scholar] [CrossRef]
- Betoni-Junior, W.; Dechichi, P.; Esteves, J.C.; Zanetta-Barbosa, D.; Magalhaes, A.E. Evaluation of the bone healing process utilizing platelet-rich plasma activated by thrombin and calcium chloride: A histologic study in rabbit calvaria. J. Oral Implantol. 2013, 39, 14–21. [Google Scholar] [CrossRef]
- Hermida-Nogueira, L.; Barrachina, M.N.; Moran, L.A.; Bravo, S.; Diz, P.; Garcia, A.; Blanco, J. Deciphering the secretome of leukocyte-platelet rich fibrin: Towards a better understanding of its wound healing properties. Sci. Rep. 2020, 10, 14571. [Google Scholar] [CrossRef]
- Ha, C.W.; Park, Y.B.; Jang, J.W.; Kim, M.; Kim, J.A.; Park, Y.G. Variability of the Composition of Growth Factors and Cytokines in Platelet-Rich Plasma from the Knee with Osteoarthritis. Arthroscopy 2019, 35, 2878–2884. [Google Scholar] [CrossRef]
- Perut, F.; Filardo, G.; Mariani, E.; Cenacchi, A.; Pratelli, L.; Devescovi, V.; Kon, E.; Marcacci, M.; Facchini, A.; Baldini, N.; et al. Preparation method and growth factor content of platelet concentrate influence the osteogenic differentiation of bone marrow stromal cells. Cytotherapy 2013, 15, 830–839. [Google Scholar] [CrossRef] [Green Version]
- Anitua, E.; Orive, G.; Aguirre, J.J.; Andia, I. Five-year clinical evaluation of short dental implants placed in posterior areas: A retrospective study. J. Periodontol. 2008, 79, 42–48. [Google Scholar] [CrossRef]
- Assirelli, E.; Filardo, G.; Mariani, E.; Kon, E.; Roffi, A.; Vaccaro, F.; Marcacci, M.; Facchini, A.; Pulsatelli, L. Effect of two different preparations of platelet-rich plasma on synoviocytes. Knee Surg. Sports Traumatol. Arthrosc. 2015, 23, 2690–2703. [Google Scholar] [CrossRef] [Green Version]
- Mariani, E.; Cattini, L.; Neri, S.; Malavolta, M.; Mocchegiani, E.; Ravaglia, G.; Facchini, A. Simultaneous evaluation of circulating chemokine and cytokine profiles in elderly subjects by multiplex technology: Relationship with zinc status. Biogerontology 2006, 7, 449–459. [Google Scholar] [CrossRef]


| Cells | P-PRP | L-PRP | Wilcoxon Matched Pair Test |
|---|---|---|---|
| Platelets × 103/μl | 178 [100–343] | 912 [713–995] | p < 0.005 |
| White Blood Cells × 103/μL | 0.1 [0.1–0.2] | 5.5 [4.3–7.5] | p < 0.005 |
| Factors | vs. Platelet Number | vs. White Blood Cell Number | ||||||||
|---|---|---|---|---|---|---|---|---|---|---|
| 1 h | 18 h | 48 h | 72 h | 168 h | 1 h | 18 h | 48 h | 72 h | 168 h | |
| FGF-b | ||||||||||
| SDF-1 | ||||||||||
| VEGF | ||||||||||
| HGF | ||||||||||
| EGF | ||||||||||
| PDGF-AB/BB | ||||||||||
| IGF-1 | ||||||||||
| V-CAM-1 | ||||||||||
| TGF-b1 | ||||||||||
| TGF-b2 | ||||||||||
| TGF-b3 | ||||||||||
 .
. .
.Disclaimer/Publisher’s Note: The statements, opinions and data contained in all publications are solely those of the individual author(s) and contributor(s) and not of MDPI and/or the editor(s). MDPI and/or the editor(s) disclaim responsibility for any injury to people or property resulting from any ideas, methods, instructions or products referred to in the content. |
© 2023 by the authors. Licensee MDPI, Basel, Switzerland. This article is an open access article distributed under the terms and conditions of the Creative Commons Attribution (CC BY) license (https://creativecommons.org/licenses/by/4.0/).
Share and Cite
Mariani, E.; Pulsatelli, L.; Cattini, L.; Dolzani, P.; Assirelli, E.; Cenacchi, A.; Di Martino, A.; Arciola, C.R.; Filardo, G. Pure Platelet and Leukocyte–Platelet-Rich Plasma for Regenerative Medicine in Orthopedics—Time- and Preparation-Dependent Release of Growth Factors and Effects on Synovial Fibroblasts: A Comparative Analysis. Int. J. Mol. Sci. 2023, 24, 1512. https://doi.org/10.3390/ijms24021512
Mariani E, Pulsatelli L, Cattini L, Dolzani P, Assirelli E, Cenacchi A, Di Martino A, Arciola CR, Filardo G. Pure Platelet and Leukocyte–Platelet-Rich Plasma for Regenerative Medicine in Orthopedics—Time- and Preparation-Dependent Release of Growth Factors and Effects on Synovial Fibroblasts: A Comparative Analysis. International Journal of Molecular Sciences. 2023; 24(2):1512. https://doi.org/10.3390/ijms24021512
Chicago/Turabian StyleMariani, Erminia, Lia Pulsatelli, Luca Cattini, Paolo Dolzani, Elisa Assirelli, Annarita Cenacchi, Alessandro Di Martino, Carla Renata Arciola, and Giuseppe Filardo. 2023. "Pure Platelet and Leukocyte–Platelet-Rich Plasma for Regenerative Medicine in Orthopedics—Time- and Preparation-Dependent Release of Growth Factors and Effects on Synovial Fibroblasts: A Comparative Analysis" International Journal of Molecular Sciences 24, no. 2: 1512. https://doi.org/10.3390/ijms24021512