1. Introduction
Vicinal dihaloethanes are dissociated using ultraviolet (UV) energy to form haloethyl radicals that undergo various secondary reactions [
1,
2,
3,
4,
5,
6,
7,
8,
9,
10,
11,
12]. Significant efforts have been made to understand the dynamics of the photodissociation of vicinal dihaloethanes, including the reaction dynamics of haloethyl radicals, in solution and in the gas phase [
1,
2,
3,
4,
5,
6,
7,
8,
9,
10,
11,
12]. The initial reaction of vicinal dihaloalkanes, in which one halogen atom is immediately dissociated upon UV excitation to form haloethyl radicals, shows similar characteristics in the gas and condensed phases [
5,
8,
10]. However, the secondary reactions of haloethyl radicals in solution show different kinetics from the gas-phase reaction depending on the type of substituted halogen atom and the spatial isomers of haloethyl radicals [
8,
10].
Vicinal diiodoethanes, such as CH
2ICH
2I, CF
2ICH
2I, and CF
2ICF
2I, were mainly investigated because the iodoethyl radicals produced upon UV excitation contain weak C−I bonds that readily proceed with secondary dissociation [
1,
2,
3,
5,
7,
8,
10,
12]. In the case of the photodissociation of CF
2ICF
2I in the gas phase, a fraction of the iodoethyl radicals dissociate the secondary C−I bond with a time constant of 26 ± 7 ps to form CF
2CF
2 and I [
2]. Secondary dissociation of haloethyl radicals often occurs because of the weakness of the halogen–carbon bonds; however, these bonds strengthen upon fluorination. The C−I bond is weaker in CH
2ICH
2 than in CF
2ICF
2 because the π-bond formed concertedly upon the fission of the C−I bond is stronger in the case of CH
2ICH
2 [
7]. The primary C−I bond breaking of dihaloalkanes has two dissociation channels, leading to I(
2P
1/2) and I(
2P
3/2) [
3,
4,
6,
7,
9]. The internal energy of haloethyl radicals is larger with the reaction channel of I(
2P
3/2); thus, the haloethyl radicals formed with I(
2P
3/2) undergo faster and more efficient secondary dissociation in the gas phase [
3,
4,
6,
7,
9].
In the condensed phase, CF
2ICF
2 radicals are also formed by the UV excitation of CF
2ICF
2I [
5,
8,
10]. However, the secondary reaction of CF
2ICF
2 radicals in solution exhibits very different kinetics from those of gas-phase reactions, depending on their stereochemical characteristics and the surrounding solvents. CF
2ICF
2I in solution has two stereoisomers,
anti and
gauche, and the corresponding CF
2ICF
2 radicals formed from these isomers are
a-CF
2ICF
2 and
g-CF
2ICF
2, respectively [
13]. According to the time-resolved infrared (TRIR) spectroscopy experiments [
8], all the nascent
g-CF
2ICF
2 produced upon 267 or 310 nm excitation reacted with the dissociated I atom within 1 ps to form I
2∙∙C
2F
4—a weakly associated iodine tetrafluoroethylene complex. Furthermore, some of the nascent
a-CF
2ICF
2 also reacted with an I atom with a time constant of 1.5 ps to form I
2∙∙C
2F
4. The formed I
2∙∙C
2F
4 dissociated with a time constant of 180 ± 5 ps in CCl
4 and 46 ± 3 ps in CH
3CN and CD
3OH to produce CF
2CF
2 + I
2. The remaining
a-CF
2ICF
2 in solution underwent secondary dissociation with a time constant of 3–6 ns to produce CF
2CF
2. As all of the excess internal energy in the haloethyl radicals dissipates into the solvent on the picosecond time scale [
8], the haloethyl radicals in solution are in thermal equilibrium when they dissociate the second I atom, unlike the reaction in the gas phase. Consequently, the kinetics related to the two dissociation channels, I(
2P
1/2) and I(
2P
3/2), were not exhibited in the photodissociation of CF
2ICF
2I in solution [
8].
The CF2ICF2 radical in solution has rich reaction dynamics; however, it exhibits only a simple dissociative reaction of the weak C−I bond on the nanosecond time scale. The C–I bond has a lifetime of a few nanoseconds; thus, any reaction longer than that, such as a bimolecular reaction (BR) involving the radical, cannot be observed unless the concentration of the radical is sufficiently high to expedite the BR. Haloethyl radicals with more stable C−X bonds, such as C−Br or C−Cl, can survive sufficiently long to participate in a BR involving the radical and to exhibit reactions other than the simple dissociation of the C−X bond.
By dissociating I or Br atoms, UV-excited CF
2BrCF
2I can generate CF
2BrCF
2 or CF
2ICF
2 radicals, respectively [
1,
2,
3,
7,
9,
12]. In the gas phase, the photodissociation of CF
2BrCF
2I at 248 or 266 nm produces CF
2BrCF
2, while photodissociation at 193 nm produces 63% CF
2BrCF
2 and 37% CF
2ICF
2 [
4]. The Br-dissociated radical CF
2CH
2I was produced by the 266 nm excitation of CF
2BrCH
2I in the gas phase [
6], suggesting that the primary C−Br dissociation is feasible through 266 nm excitation. The secondary reaction of CF
2ICF
2 is well established in solution, as well as in the gas phase; however, the available spectroscopic and dynamical information on CF
2BrCF
2 is scarce [
7,
14]. Akesson and coworkers investigated the photodissociation dynamics of CF
2BrCF
2I in solution after excitation at 266 nm by probing the formation of IBr using time-resolved electronic spectroscopy [
10]. The haloethyl radical was not monitored, but its formation and dynamics were conjectured by the kinetics of the electronic absorption signal of IBr. This is the only reported time-resolved study on CF
2BrCF
2I.
Recently, we measured the photodissociation dynamics of CF
2BrCF
2I in CCl
4 at 280 K from 0.3 to 320 ps after excitation with a 267 nm pulse to study the rotational isomerization of the haloethyl radical about the C−C bond [
15]. The 267 nm excitation immediately dissociates Br or I atoms from CF
2ICF
2Br in CCl
4 at 280 K, producing nascent radicals consisting of 33 ± 3%
a-CF
2BrCF
2, 49 ± 3%
g-CF
2BrCF
2, and 18 ± 3%
a-CF
2ICF
2 [
15]. While no geminate rebinding of the dissociated halogen atom with nascent radicals or secondary reactions of
a-CF
2ICF
2 occur within 320 ps, almost all
g-CF
2BrCF
2 rotationally isomerizes into the more stable
a-CF
2BrCF
2 with a time constant of 47 ± 5 ps [
15]. The excess energy in the nascent radical is thermalized with a time constant of 15 ± 3 ps [
15], implying that any secondary reaction proceeding slower than 15 ps becomes a reaction in thermal equilibrium. The radicals
a-CF
2BrCF
2 and
a-CF
2ICF
2 survive long after rotational isomerization, and the former is expected to survive sufficiently long to participate in a BR involving the radical. Therefore, comparative reaction dynamics between the two radicals can be probed by observing the entire reaction dynamics of CF
2BrCF
2I excited at 267 nm in a CCl
4 solution. Owing to the sensitivity of IR spectroscopy to molecular structure, the conformer-specific reactions of the radicals obtained from the photodissociation of CF
2BrCF
2I in solution can be observed in detail, similar to the case of the photodissociation of CF
2ICF
2I in solution [
8].
In this study, we investigated all the subsequent reactions after the photodissociation of CF
2BrCF
2I in a CCl
4 solution at 267 nm through TRIR spectroscopy for up to 10 μs. With the support of quantum-chemical calculations and available spectra, all the transient absorptions in the TRIR spectra of CF
2BrCF
2I in CCl
4 were assigned, and their kinetics were determined. Upon excitation, CF
2BrCF
2I immediately produces
a-CF
2BrCF
2,
g-CF
2BrCF
2, and
a-CF
2ICF
2 [
15]. Although
a-CF
2ICF
2 undergoes a simple dissociation of the C−I bond, most of the
g-CF
2BrCF
2 isomerize into
a-CF
2BrCF
2 which undergoes a bimolecular reaction with itself or the dissociated Br atom in the solution. Structure-sensitive TRIR spectroscopy enabled us to determine the real-time reaction dynamics of UV-excited CF
2BrCF
2I in CCl
4 at 280 K.
2. Results and Discussion
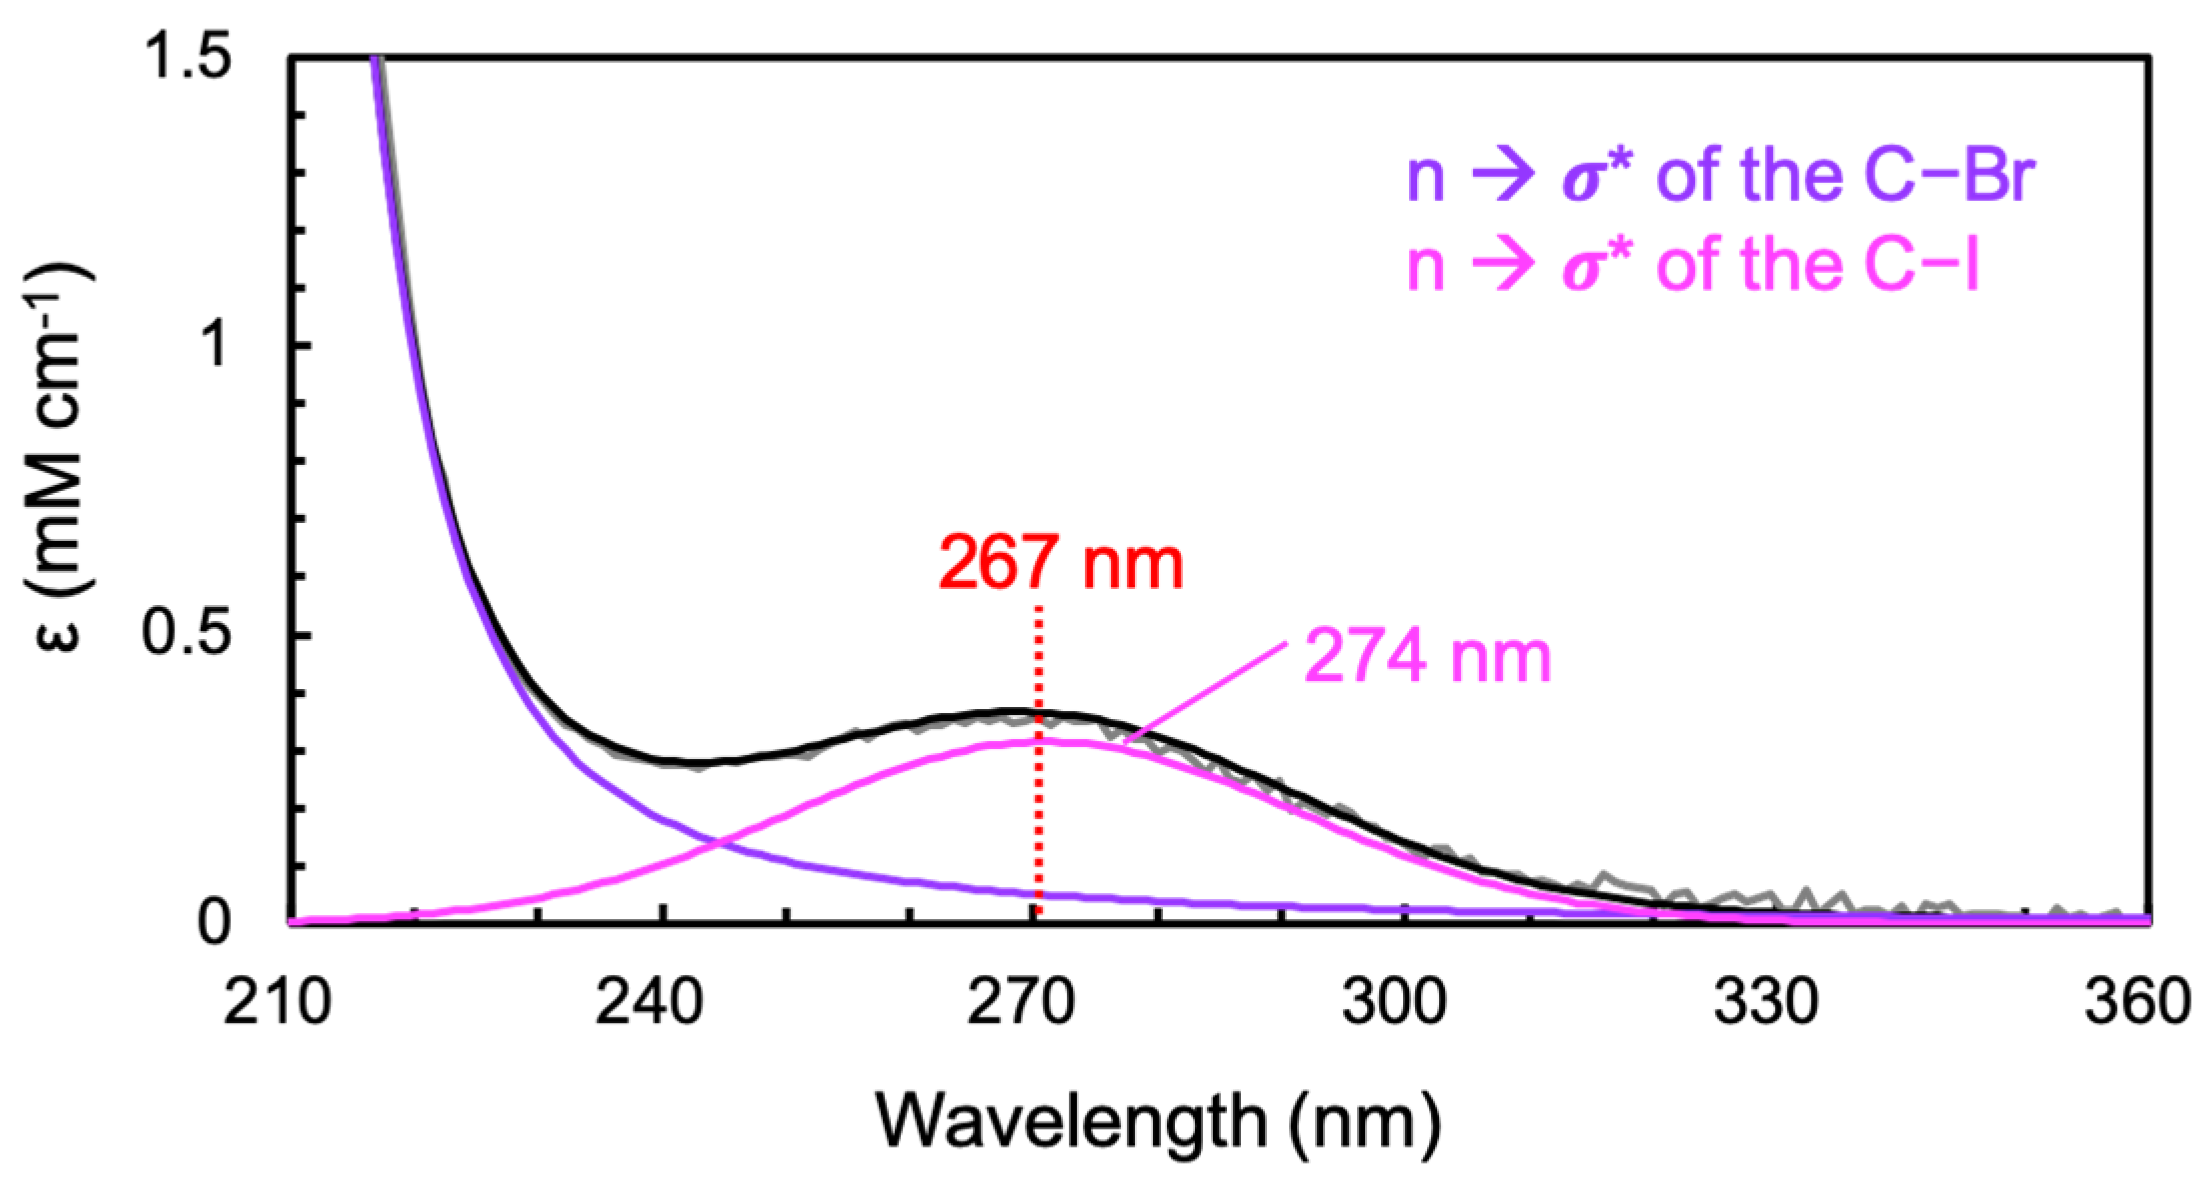
The equilibrium electronic spectrum of CF
2BrCF
2I dissolved in CCl
4 showed a weak absorption band at 274 nm and a strong band above 200 nm (
Figure 1), which was slightly red-shifted from the peaks at 268 and 193 nm in the gas phase [
9]. The weak absorption at 274 nm, assigned to the n → σ* transition of the C−I bond, leads to the immediate dissociation of the I atom [
1,
2,
3,
12], while the strong absorption above 200 nm, assigned to the n → σ* transition of the C−Br bond, leads to the immediate dissociation of the Br atom [
9]. As the wing of this strong absorption band extends up to 300 nm and accounts for 18 ± 3% of the absorption at 267 nm, the photoexcitation of CF
2BrCF
2I at 267 nm can lead to the dissociation of not only the I atom but also the Br atom. Specifically, 82 ± 3% of the absorption intensity at 267 nm arises from the weak absorption band at 274 nm; thus, excitation at 267 nm would promote 82 ± 3% (18 ± 3%) of CF
2BrCF
2I to the antibonding state of the C−I (C−Br) bond. Consequently, 82 ± 3% (18 ± 3%) of the excited CF
2BrCF
2I at 267 nm is expected to dissociate into CF
2BrCF
2 + I (CF
2ICF
2 + Br). The contribution from the strong band to the absorption at 267 nm in the gas phase was estimated to be 9 ± 4% [
9], which would result in 9 ± 4% CF
2ICF
2 production upon excitation at 267 nm in the gas phase, which is smaller than that in CCl
4.
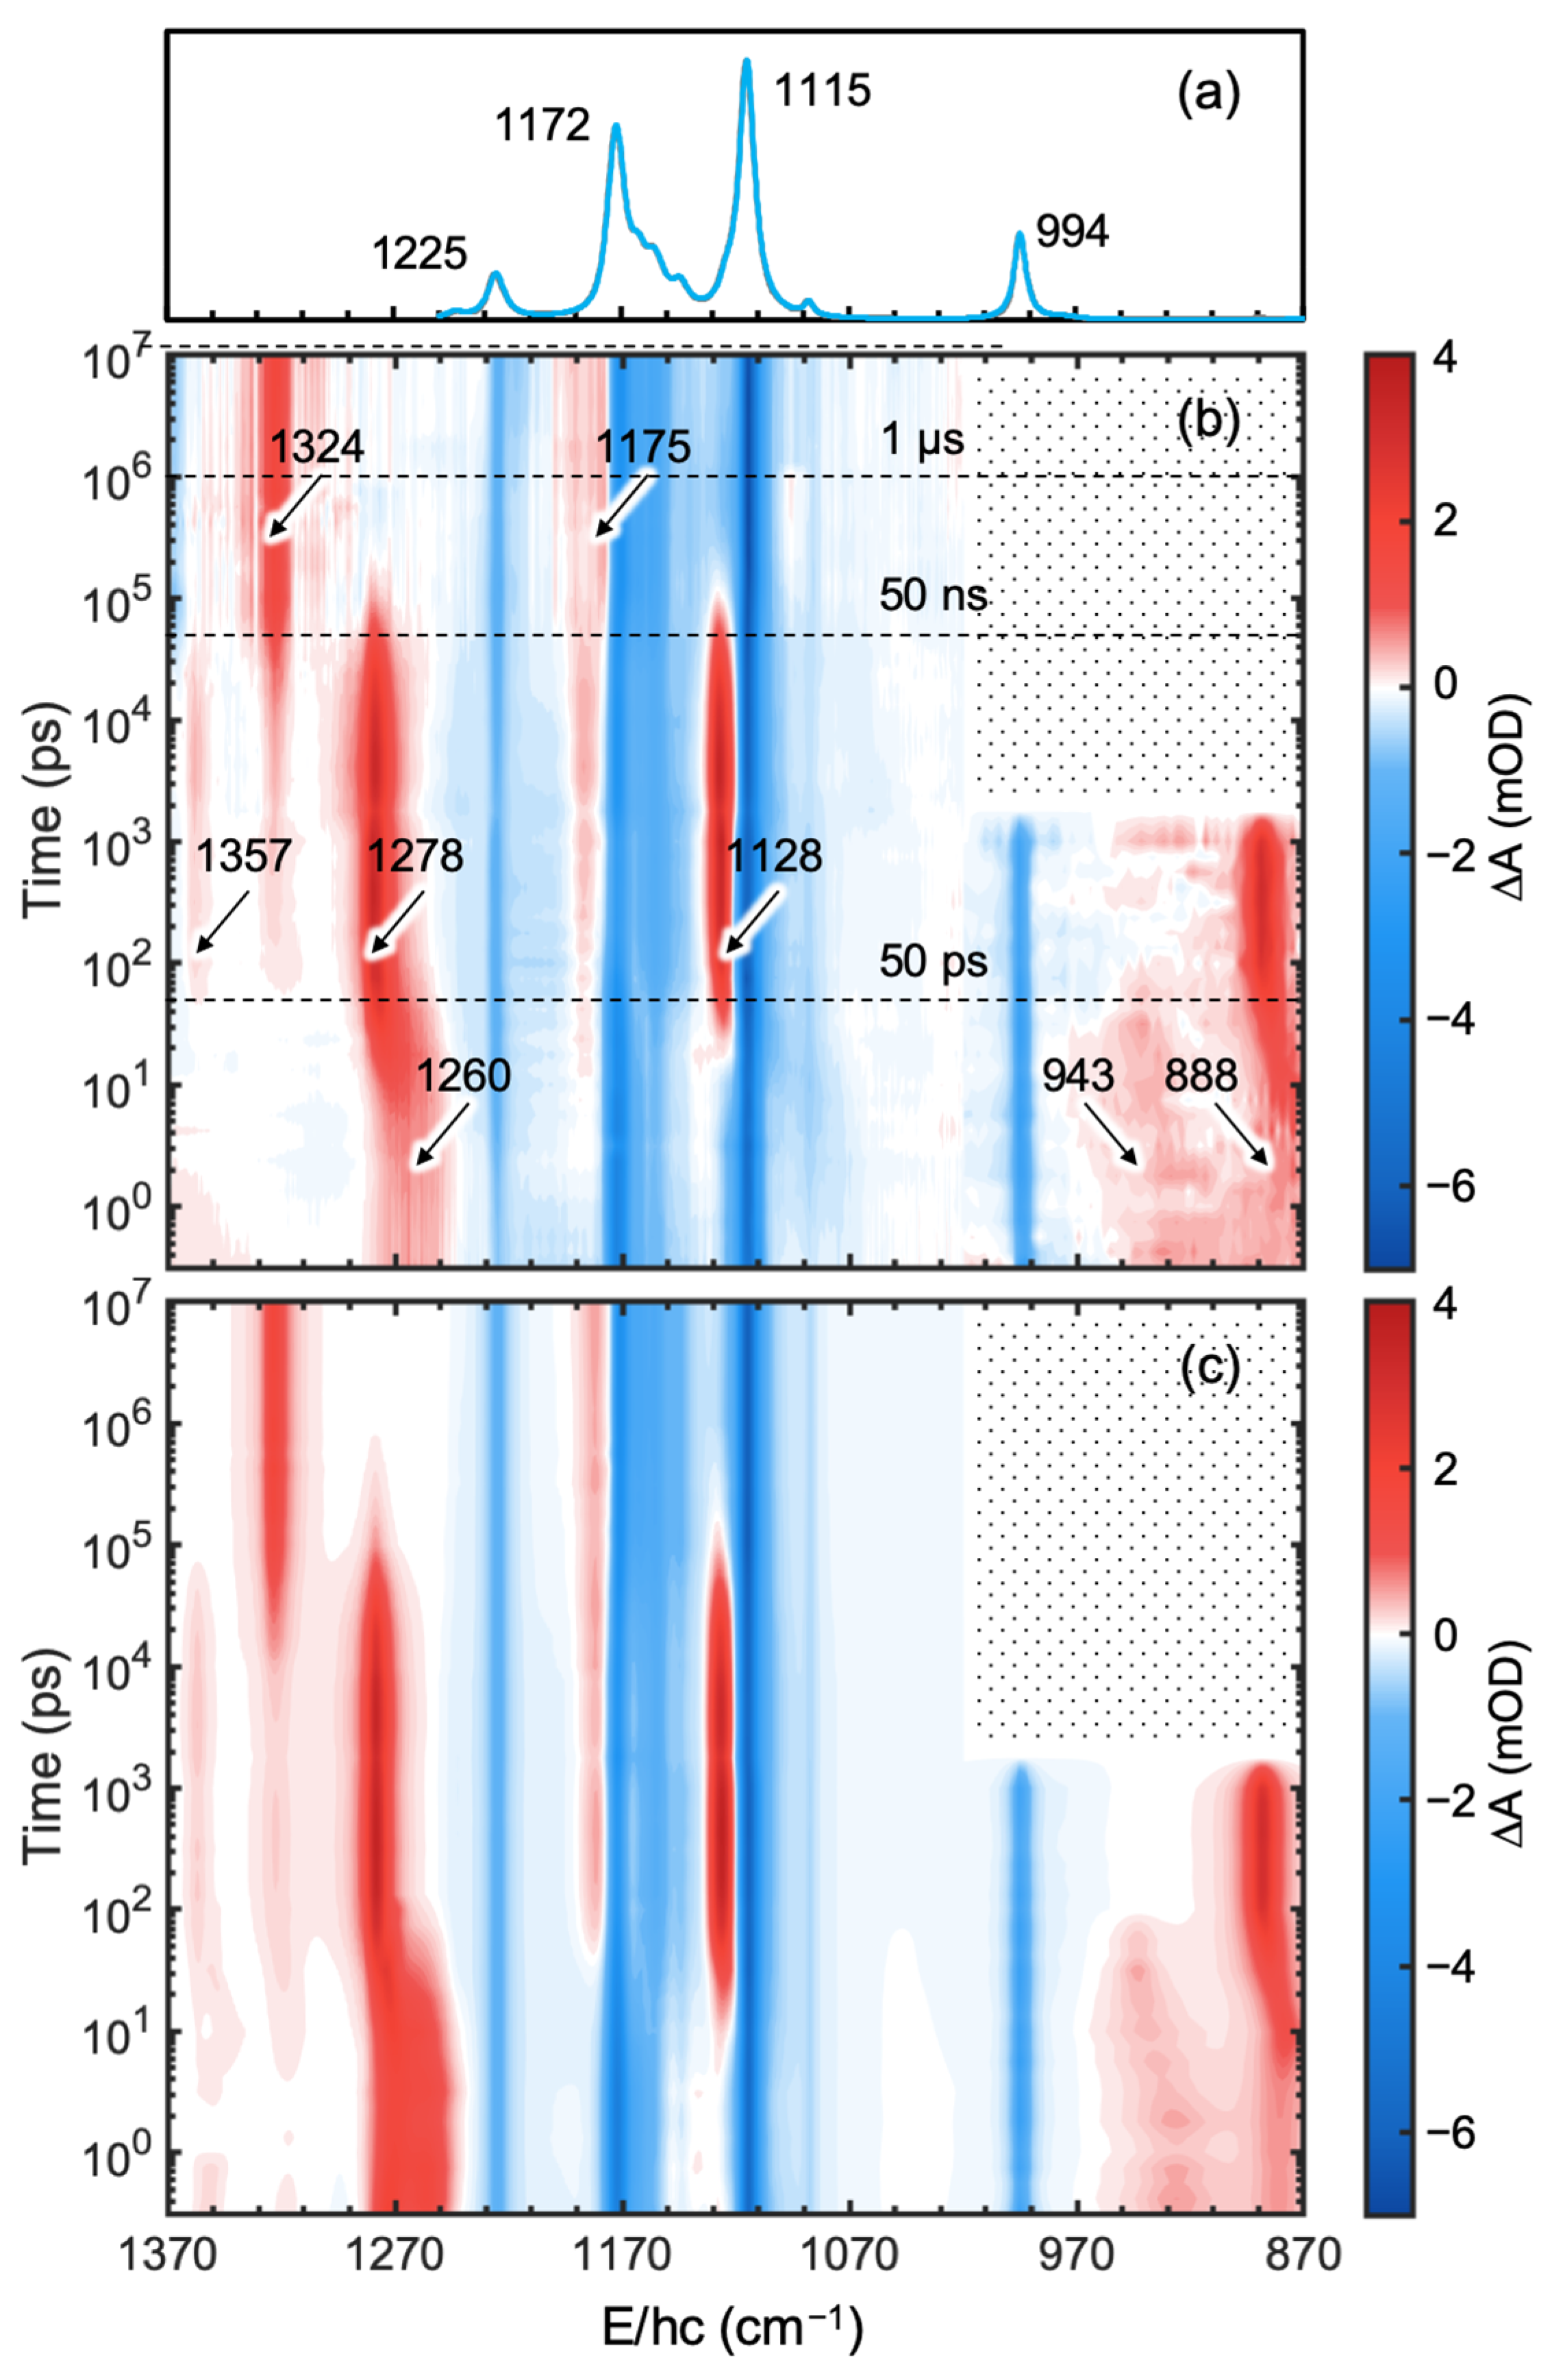
The TRIR spectra of CF
2BrCF
2I in CCl
4 at 280 ± 2 K were measured in the spectral region of 1370−1020 (1020−870) cm
−1 that covers all of the C−F stretching modes of the molecule over a broad time span from 0.3 ps to 10 μs (1 ns) after excitation at 267 nm, encompassing the entire excitation-induced reaction. As the photodissociation reaction was found to be complete at 1 µs in previous experiments on similar dihaloalkanes in solution [
8,
10], the time range of 0.3 ps to 10 μs was expected to be sufficient to observe the fates of all of the intermediates and products induced by the photoexcitation of CF
2BrCF
2I in CCl
4. The absorption bands in the 1300−1100 cm
−1 region were congested, while those in the 1020−870 cm
−1 region (vide infra) were well resolved. Thus, the TRIR spectra in the 1020−870 cm
−1 region were collected up to 1 ns to confirm the band assignment [
15] and dynamics of the CF
2BrCF
2 radical (vide infra), even though this was time-consuming because of the inferior sensitivity of our TRIR spectrometer in such a long-wavelength spectral region.
As shown in
Figure 2b, negative absorption bands (bleach) appeared immediately after excitation at the positions of the absorption bands of the equilibrium spectrum of CF
2BrCF
2I. The bleach signal arises from the depletion of the population of CF
2BrCF
2I in the ground state upon excitation. The four main absorption bands (negative absorption) of CF
2BrCF
2I near 1225, 1172, 1115, and 994 cm
−1 appeared at 0.3 ps and maintained their magnitude up to 10 μs. This suggests that the photoreaction proceeds within 0.3 ps and none of the nascent photofragments return to the reactant for up to 10 μs. New absorption bands can be categorized into three groups according to their kinetics: (1) bands appearing immediately after excitation, (2) bands growing around 50 ps and decaying near 50 ns, and (3) bands growing at ~50 ns and maintaining their amplitudes up to 10 μs, which is the last pump-probe delay time in our experiment. This suggests that the nascent products may undergo secondary reactions to produce intermediates that can further react to generate the final photoproducts. The absorption bands immediately appearing after excitation (group (1)) were assigned to the nascent photoproducts [
15] and those maintained up to 10 μs after growing near 50 ns to the final products produced by secondary reactions of the reaction intermediates. Absorption bands near 1278 and 1128 cm
−1 grew near 50 ps and decayed around 50 ns; thus, they were assigned to the reaction intermediates that produced the final products through the secondary reactions. The immediately appearing absorption bands near 1260, 943, and 888 cm
−1 were initially broad and shifted toward blue with time, suggesting that the nascent photofragments were produced with excess energy that relaxed via the anharmonically-coupled lower-frequency modes (thermal relaxation) [
15,
16,
17,
18]. The absorption bands at 1324 and 1175 cm
−1, assigned to CF
2CF
2 in CCl
4 [
8,
13,
14,
19], grew near 50 ns and maintained their intensity up to 10 μs, indicating that CF
2CF
2 is the final product formed in tens of nanoseconds.
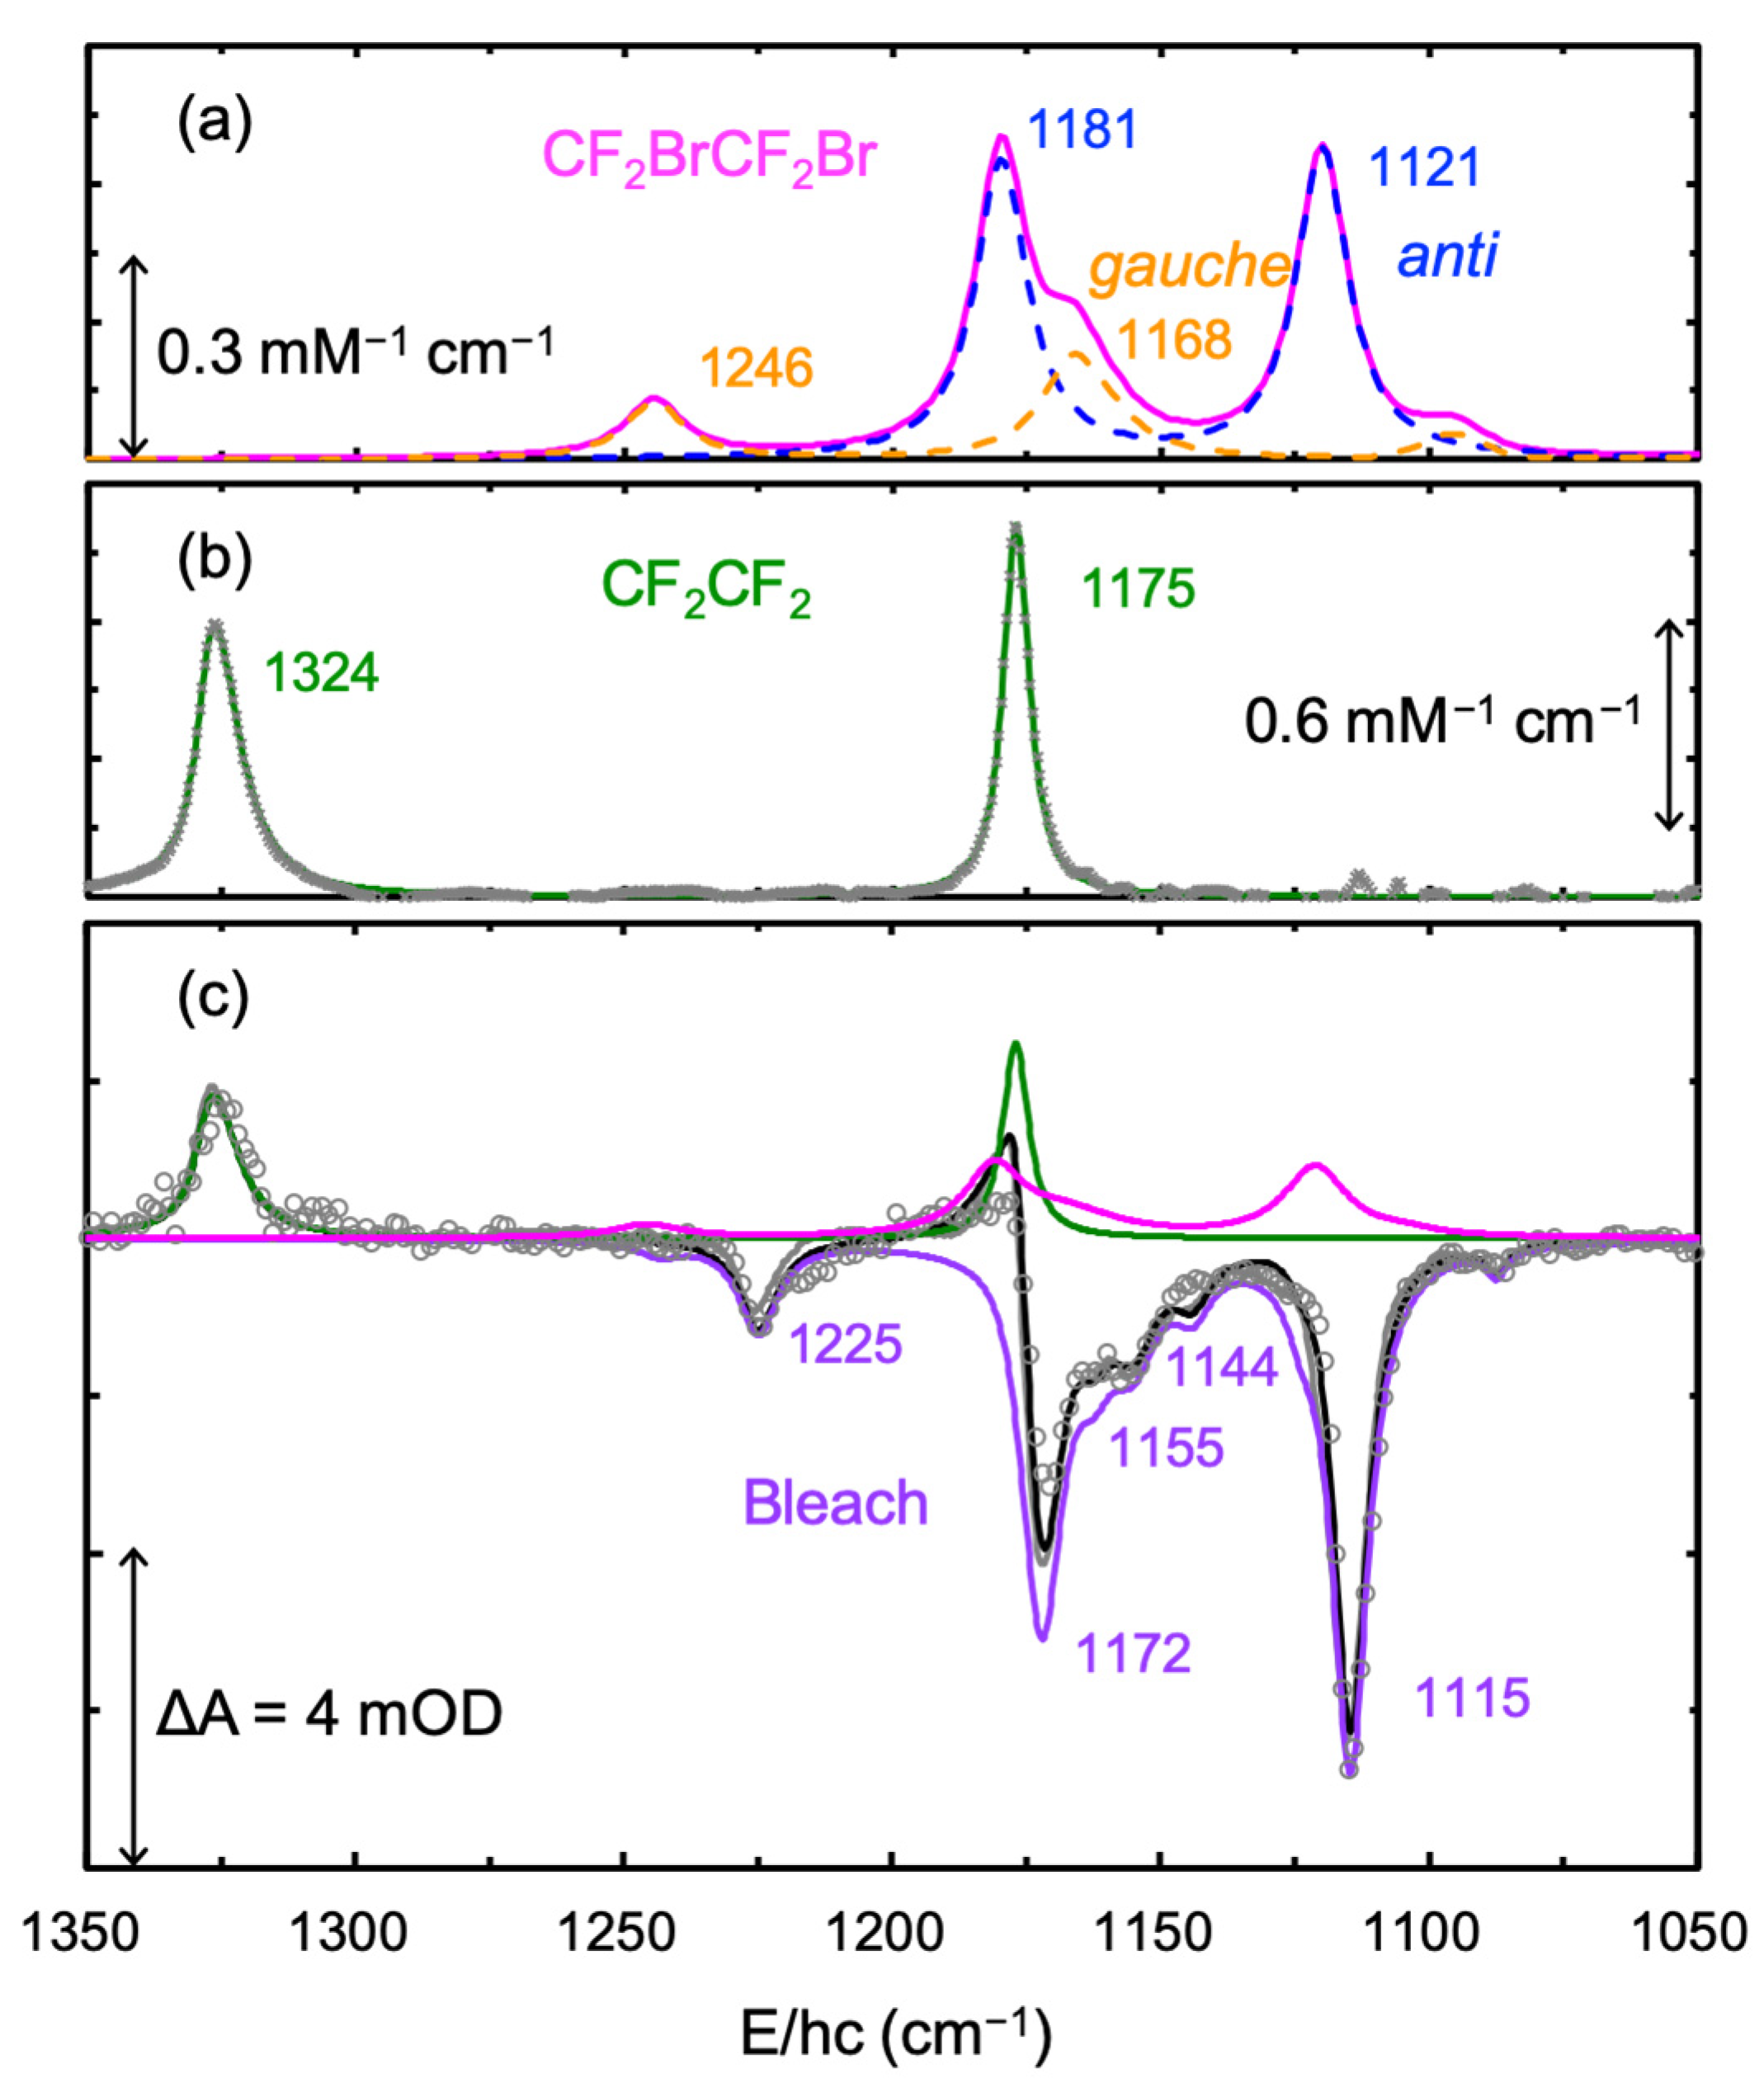
Notably, TRIR spectra beyond 1 μs did not evolve with time, indicating the completion of the photoreaction. Thus, new absorption bands in the TRIR spectra beyond 1 μs should arise from the final products and bleach the signal from the depleted reactant. The TRIR spectra from 1 to 10 μs were averaged to obtain more reliable spectra for the final products. As shown in
Figure 3c, the averaged TRIR spectrum overlapped well with the difference spectrum obtained by subtracting the absorption spectrum measured before the pump-probe experiment from that measured after the experiment, confirming that the photoreaction was complete by ~1 μs. Apart from the absorption spectrum of CF
2CF
2 and the inverted absorption spectrum of CF
2BrCF
2, the averaged TRIR spectrum contained an additional absorption spectrum, which was assigned to CF
2BrCF
2Br based on the reported spectrum of CF
2BrCF
2Br in CS
2 (
Figure 3a) [
20]. Clearly, the photodecomposition of CF
2BrCF
2I leads to two products: CF
2CF
2 and CF
2BrCF
2Br. The decomposition of the averaged TRIR spectrum suggests that the photoexcitation of CF
2BrCF
2I in CCl
4 at 267 nm produces CF
2CF
2 (50 ± 3%) and CF
2BrCF
2Br (50 ± 3%).
When CF
2BrCF
2I is excited by UV light, it dissociates I or Br atoms, producing CF
2BrCF
2 or CF
2ICF
2 radicals, respectively [
4,
9,
10,
15]. As mentioned, because 82 ± 3% (18 ± 3%) of the excited CF
2BrCF
2I in CCl
4 at 267 nm is promoted to the antibonding of the C−I (C−Br) bond, the majority of the produced radicals are expected to be CF
2BrCF
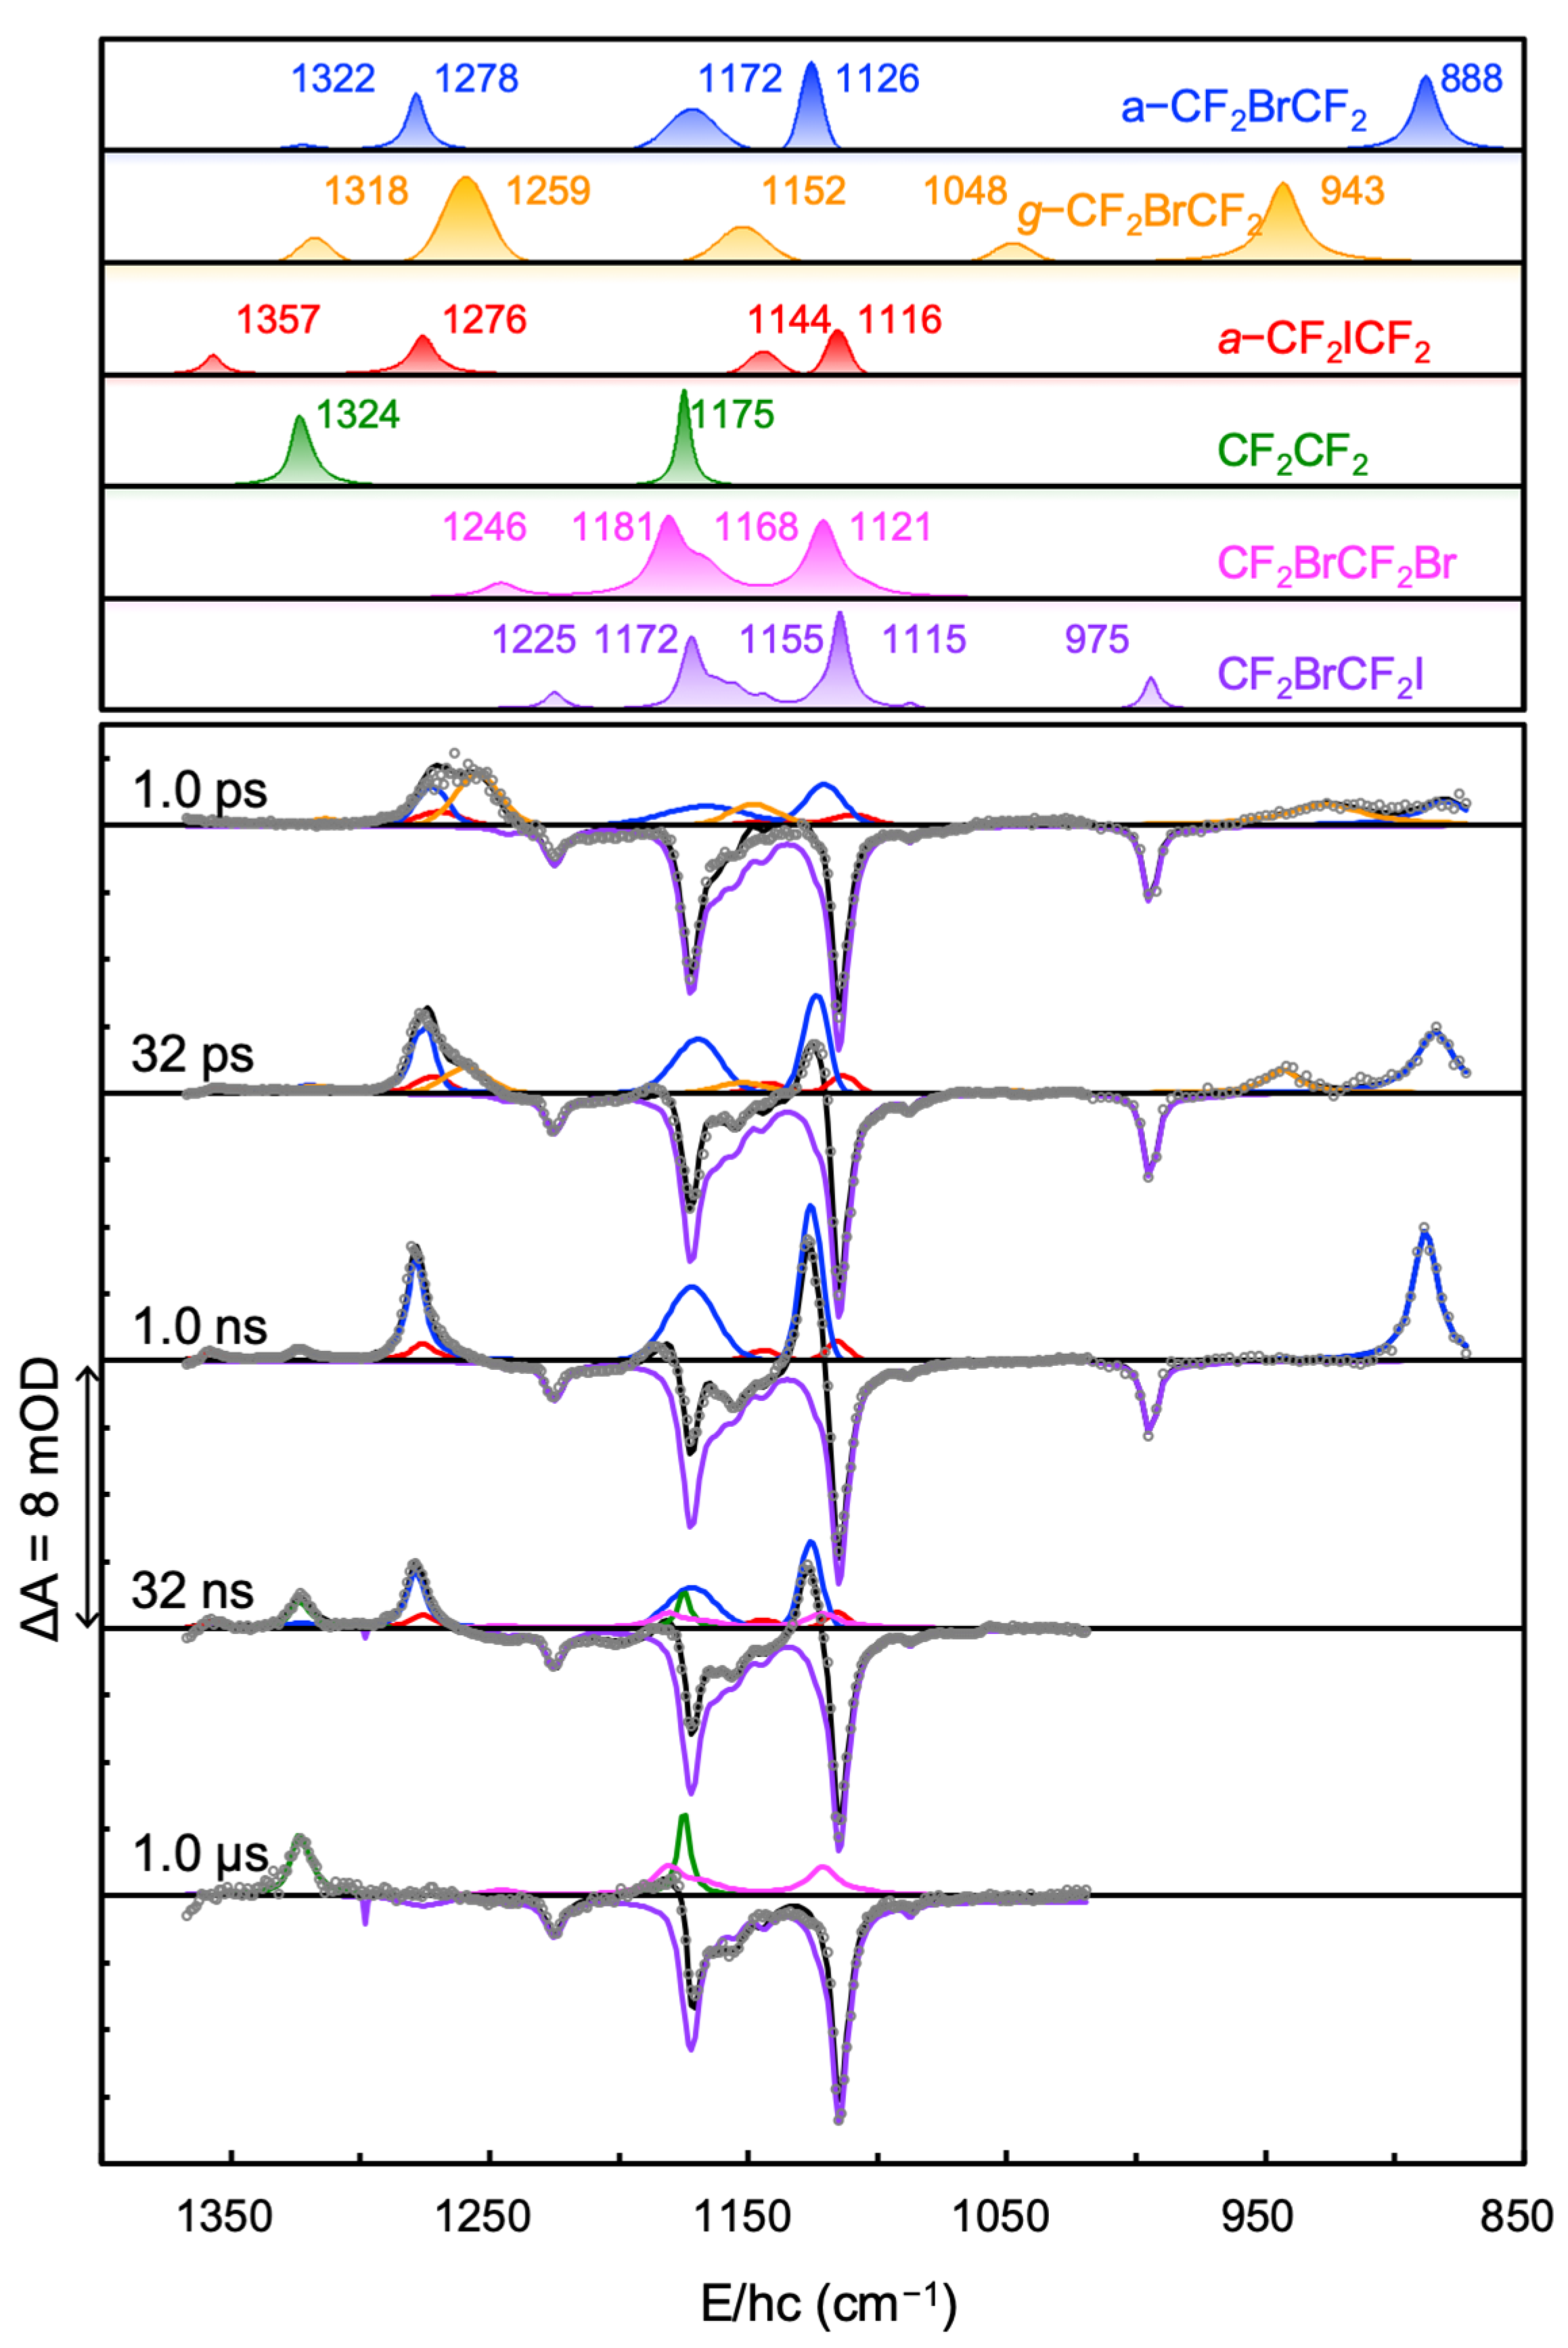
2. As shown in our previous TRIR spectroscopic experiment on CF
2BrCF
2I in the time range of 0.3−320 ps, the TRIR spectra consisted of the spectra of three nascent radicals (
a-CF
2BrCF
2,
g-CF
2BrCF
2, and
a-CF
2ICF
2) and the inverted spectrum of CF
2BrCF
2I for the bleach signal [
15]. The final photoproducts were 50 ± 3% CF
2CF
2 and 50 ± 3% CF
2BrCF
2Br, which were produced via secondary reactions of the reaction intermediates. Therefore, the TRIR spectra should include the spectra of the reactant (CF
2BrCF
2I), final products (CF
2CF
2 and CF
2BrCF
2Br), and reaction intermediates (
a-CF
2BrCF
2,
g-CF
2BrCF
2, and
a-CF
2ICF
2). The TRIR spectra were globally fitted using the basis spectra of CF
2BrCF
2I, CF
2CF
2, CF
2BrCF
2Br,
a-CF
2BrCF
2,
g-CF
2BrCF
2, and
a-CF
2ICF
2, as shown in the upper panel of
Figure 4. The basis spectra of CF
2BrCF
2I, CF
2CF
2, and CF
2BrCF
2Br were obtained from equilibrium FTIR measurements, and those of
a-CF
2ICF
2,
a-CF
2BrCF
2, and
g-CF
2BrCF
2 were obtained from our previous experiments [
8,
15]. The decomposition of CF
2BrCF
2I and CF
2BrCF
2Br into their conformer-specific spectra was not necessary for the fitting because their basis spectra have contributions from both conformers, and these contributions were maintained throughout the experiment. As shown in
Figure 2c and the lower panel of
Figure 4, the TRIR spectra were well reproduced by the sum of the basis spectra for CF
2BrCF
2I, CF
2CF
2, CF
2BrCF
2Br,
a-CF
2BrCF
2,
g-CF
2BrCF
2, and
a-CF
2ICF
2 shown in the upper panel of
Figure 4. The time-dependent amplitude changes in the basis spectra were obtained by global fitting of the TRIR spectra. As mentioned, the magnitude of the bleach spectrum did not change throughout the experimental time span, implying that there was no rebinding of the dissociated halogen atom with its counter radical for up to 10 μs. The amplitudes of the remaining five basis spectra revealed rich kinetic information related to the reaction dynamics of the 267-nm-excited CF
2BrCF
2I in CCl
4 at 280 K.
The amplitude of a basis spectrum (
amp) is related to the population of the corresponding compound by
[
15,
19], where
ε and
n represent the integrated extinction coefficient and population of the compound, respectively. The integrated extinction coefficient (
ε) of
a-CF
2BrCF
2,
g-CF
2BrCF
2, and
a-CF
2ICF
2 were obtained from our previous measurements [
8,
15], and those of CF
2BrCF
2I, CF
2CF
2, and CF
2BrCF
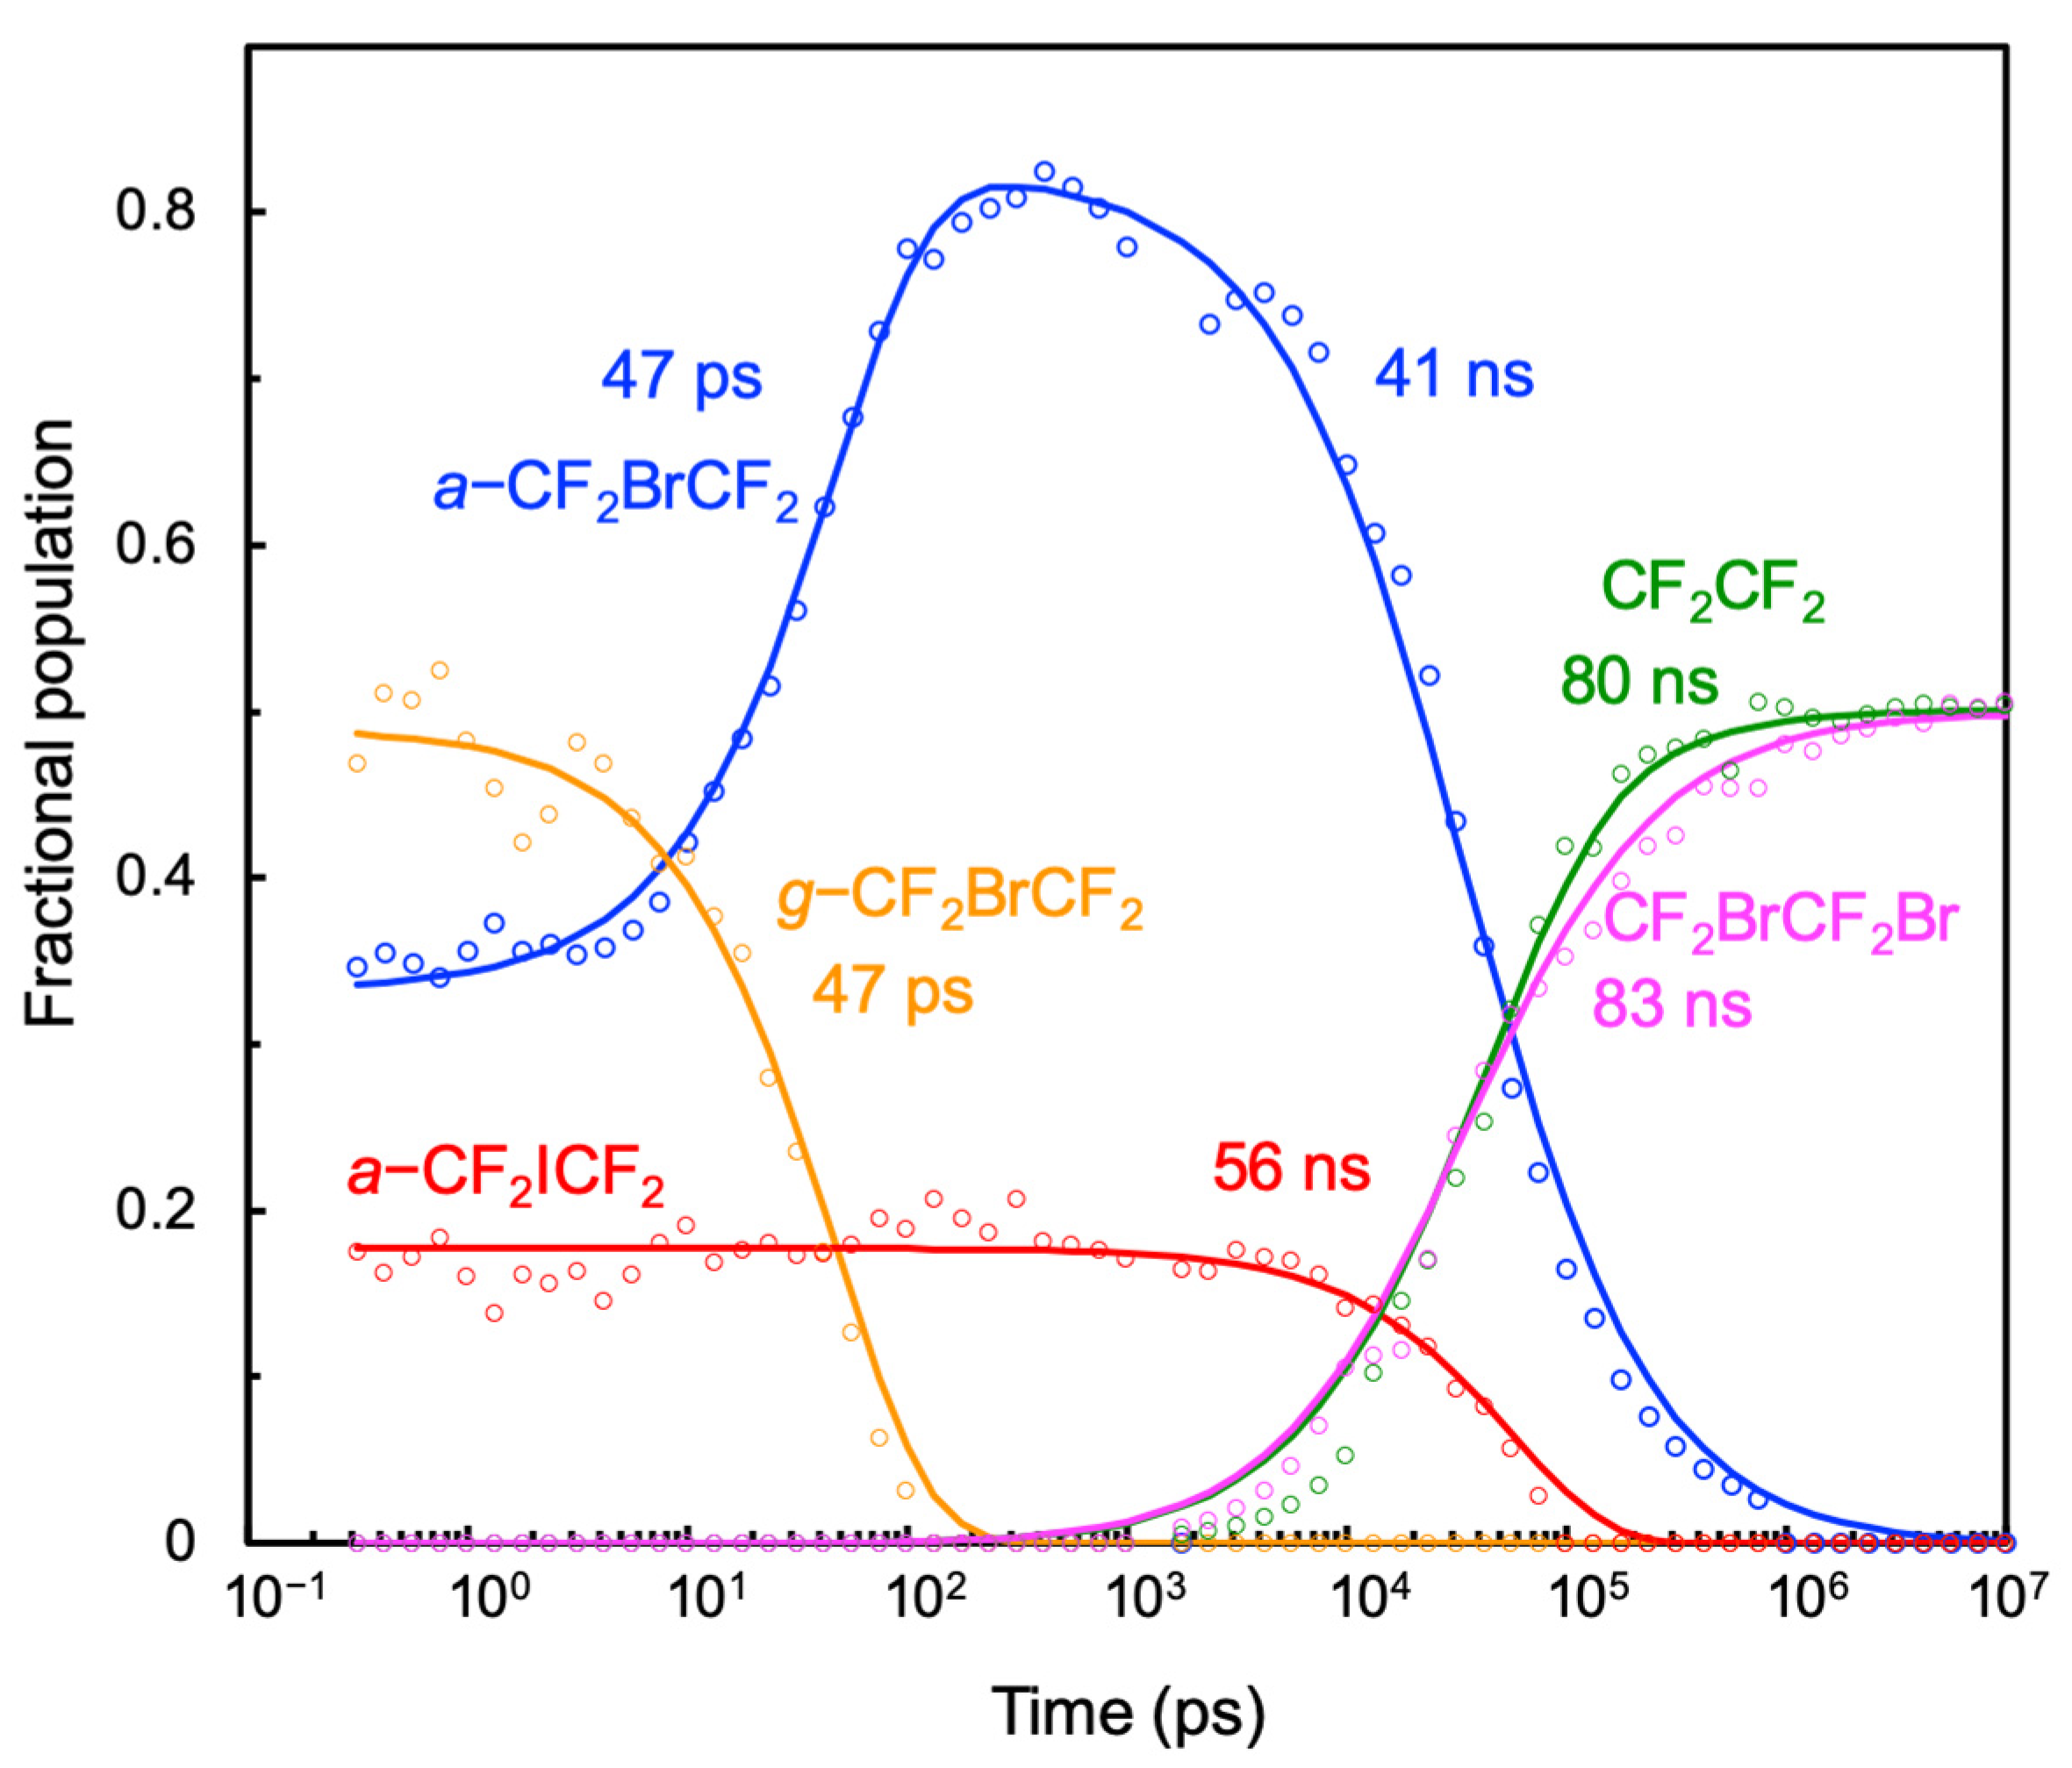
2Br were determined from equilibrium FTIR measurements. Time-dependent fractional population changes of CF
2BrCF
2I, CF
2CF
2, CF
2BrCF
2Br,
a-CF
2BrCF
2,
g-CF
2BrCF
2, and
a-CF
2ICF
2 were derived from time-dependent amplitude changes for the basis spectra of the corresponding compounds using the relation,
. As shown in
Figure 5, three nascent radicals (
a-CF
2BrCF
2,
g-CF
2BrCF
2, and
a-CF
2ICF
2) appeared immediately, implying that the photodissociation of CF
2BrCF
2I occurred within 0.3 ps [
15]. The decay of
g-CF
2BrCF
2 correlated with the growth of
a-CF
2BrCF
2 because
g-CF
2BrCF
2 isomerizes into
a-CF
2BrCF
2 at a time constant of 47 ± 5 ps [
15]. Moreover, the decays of
a-CF
2ICF
2 and
g-CF
2BrCF
2 correlated with the growth of CF
2CF
2 and CF
2BrCF
2Br, implying that these products were formed by the secondary reactions of
a-CF
2ICF
2 and
a-CF
2BrCF
2.
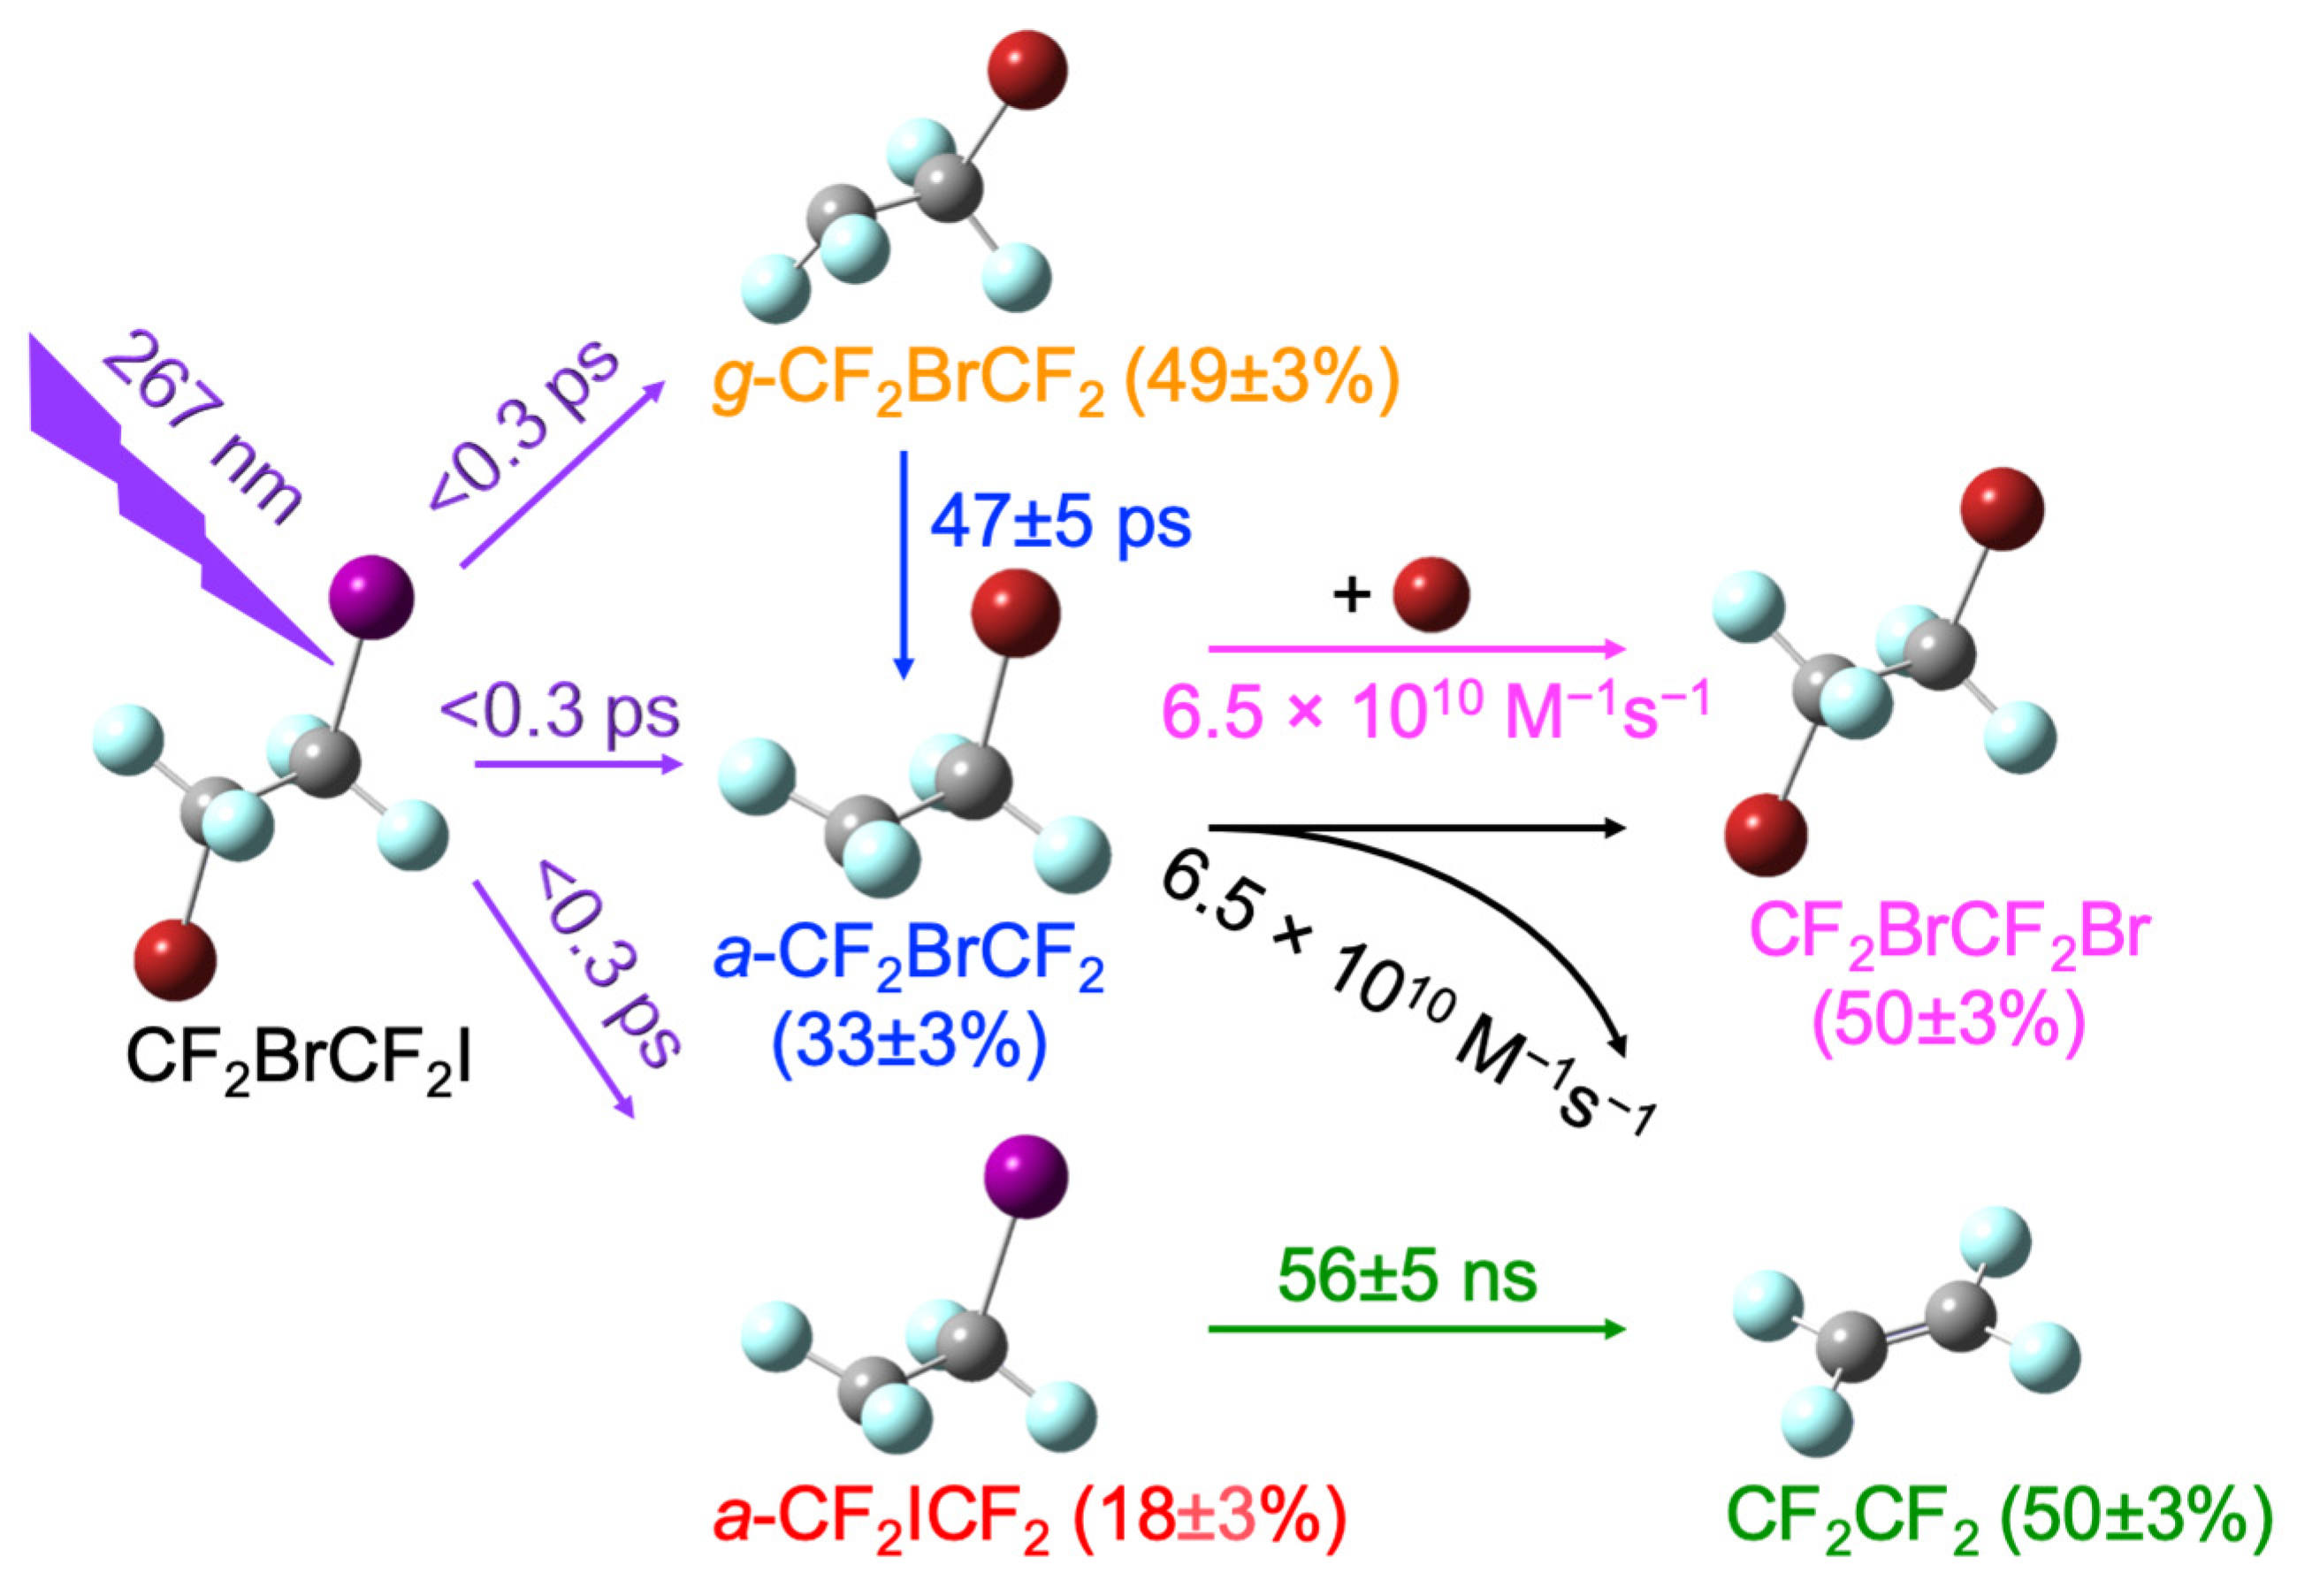
A kinetic scheme (
Scheme 1) was introduced to reproduce the time-dependent fractional population changes, as shown in
Figure 5, by optimizing the rate constants of all transitions. As shown in
Figure 5,
Scheme 1 reproduced the time-dependent fractional population changes.
Scheme 1 indicates that all the excited CF
2BrCF
2I at 267 nm dissociated one halogen atom to produce CF
2ICF
2 or CF
2BrCF
2 (18 ± 3%
a-CF
2ICF
2, 33 ± 3%
a-CF
2BrCF
2, and 49 ± 3%
g-CF
2BrCF
2) [
15]. Almost all nascent
g-CF
2BrCF
2 isomerizes into
a-CF
2BrCF
2 with a time constant of 47 ± 5 ps [
15]. All of the nascent
a-CF
2ICF
2 undergoes secondary dissociation to produce CF
2CF
2 + I with a time constant of 56 ± 5 ns. The nascent
a-CF
2ICF
2 obtained from CF
2ICF
2I in CCl
4 undergoes secondary dissociation with a time constant of 5.5 ns [
8]. Although a secondary dissociation time of 56 ns for
a-CF
2ICF
2 is less than that observed previously, it clearly demonstrates that the secondary dissociation of the C−I bond is feasible and can occur on the nanosecond time scale in solution.
The decay of
a-CF
2BrCF
2 was correlated with the growth of the final products, CF
2CF
2 and CF
2BrCF
2Br. The possible reactions of
a-CF
2BrCF
2 to produce the final products are as follows.
- (a)
If reaction (1) does not occur, reactions (2) and (3) should proceed, resulting in the formation of the two products, CF2BrCF2Br and CF2CF2. Reaction (2), which produces CF2BrCF2Br, should proceed with a rate constant of (1.6 ± 0.3) × 1011 M−1s−1, and reaction (3), which produces CF2CF2, with a time constant of 130 ± 5 ns.
- (b)
As the time constant of 130 ns for the secondary dissociation of a-CF2BrCF2 (reaction (3)) is too high to be realistic (vide infra), reaction (1) should occur to produce CF2CF2.
- (c)
Reaction (1) produces equal amounts of CF2CF2 and CF2BrCF2Br, and the secondary dissociation of a-CF2ICF2 produces CF2CF2 (18% of the reactant), resulting in the final products CF2BrCF2Br (41%) and CF2CF2 (59%) if reaction (1) is the only one to proceed. Reaction (2) should proceed in addition to reaction (1) to give the observed final products (50 ± 3% CF2CF2 and 50 ± 3% CF2BrCF2Br).
- (d)
Furthermore, if a-CF2BrCF2 reacts bimolecularly with itself (reaction (1)), it can also react with Br atoms in solution (reaction (2)).
Therefore, reactions (1) and (2) were allowed to fit the fractional population changes of a-CF2BrCF2, CF2CF2, and CF2BrCF2Br, resulting in rate constants for the BR of a-CF2BrCF2 with itself (reaction (1)) and the Br atoms (reaction (2)), which were approximately the same, (6.5 ± 0.3) × 1010 M−1s−1. The recovered BR rate constant is closer to the calculated diffusion-limited rate constant of 7 × 10⁹ M−1s−1 than the obtained value of (1.6 ± 0.3) × 1011 M−1s−1, assuming that only reaction (2) produces CF2BrCF2Br.
The excess energy in the nascent radicals (
a-CF
2ICF
2,
a-CF
2BrCF
2, and
g-CF
2BrCF
2) produced during the photodecomposition of CF
2BrCF
2I was thermalized with a time constant of 15 ± 3 ps [
15], which is consistent with the thermalization time constant observed in other reactions in solution [
8,
19]. The solvent acts as an energy sink for the excess energy of a molecule in solution. All nascent radicals were thermalized with a time constant of 15 ± 3 ps after the photodecomposition of CF
2BrCF
2I in CCl
4, indicating that the observed reactions became thermal within tens of picoseconds after the photodecomposition. Therefore, the radicals should gain the energy required for the secondary bond dissociation that occurs within nanoseconds or longer. The bond dissociation energy is supplied by the solvent, indicating that the solvent becomes an energy source as well as an energy sink. As the solvent can act as an energy sink and an energy source, secondary dissociation at a longer duration than thermalization is a characteristic of the reaction in solution. For the secondary dissociation of the C−X bond, the activation energy should be as high as the C−X bond energy. As the C−Br bond energy of 22.3 ± 2.5 kcal/mol is 15.2 kcal/mol higher than the C−I bond energy of 7.1 ± 2.5 kcal/mol [
7], the secondary dissociation of the C−Br bond is expected to take approximately 10
12 times longer than that of the C−I bond, based on the Arrhenius equation for the rate constant at room temperature. Considering that the secondary dissociation time of thermalized
a-CF
2ICF
2 is 56 ns, it is unlikely that the secondary dissociation of Br from thermalized a-CF
2BrCF
2 will take 130 ns.
The Gibbs free energy of
a-CF
2BrCF
2Br was calculated to be 0.91 kcal/mol more stable than that of
g-CF
2BrCF
2Br. Therefore, when thermalized, 72% of CF
2BrCF
2Br is in the
anti-conformer at 280 ± 2 K, while almost all (97%) the CF
2BrCF
2 radicals are
a-CF
2BrCF
2. Although most CF
2BrCF
2Br is produced by the BR of
a-CF
2BrCF
2, the produced CF
2BrCF
2Br is in both
anti and
gauche conformers in the equilibrium distribution. Based on the rotational isomerization time of 47 ps for CF
2BrCF
2 and the calculated rotational barriers [
15], that of CF
2BrCF
2Br in CCl
4 at 280 K was estimated [
15] to be 12 ns using the calculated Gibbs free energy for the rotational activation. The Gibbs free energy was found to be 6.21 (7.12) kcal/mol for
gauche-to-
anti (
anti-to-g
auche) transition by the DFT method using ωB97X-D/aug-cc-pVTZ. As shown in
Figure 5, CF
2BrCF
2Br was produced with a time constant of 83 ns, which is longer than the estimated rotational isomerization time. Thus, CF
2BrCF
2Br was produced in the equilibrium distribution, even though the reactant was mainly the
a-CF
2BrCF
2 radical.


