1. Introduction
Poultry play a vital role in providing food for humans, and the reproductive performance of poultry directly impacts the development and benefits of the poultry industry. The utilization cycle of commercial chickens has been extended from 72 to 80 weeks as a result of enhancements in egg production capabilities [
1], and Hy-Line chickens still maintain an egg production rate of about 80% at 53 weeks of age [
2]. However, the egg production performance of laying hens declines significantly in the later laying period, which has a considerable impact on economic profitability. For the purpose of reducing breeding costs and increasing the utilization effectiveness, extending the egg-laying cycle with better reproductive performance of hens during the later laying period is a crucial task.
Previous research on animals’ reproductive performance has primarily concentrated on studying the ovary and liver. In the later laying period, the ovary and liver of chickens undergo changes in their structure and declines in their function, which subsequently impact their reproductive capacity [
3]. The proper development of follicles in the ovary is crucial for egg production, and this process is regulated by the hypothalamic–pituitary–gonad (HPG) axis [
4,
5]. As chickens reach the later laying period, the release of sex hormones decreases, the number of pre-grade follicles decreases, and yolk synthesis and accumulation reduces, ultimately resulting in a decline in ovarian function [
6]. The liver has multiple functions in poultry. It plays a major part in fatty acid metabolism and is responsible for producing the building blocks needed for yolk formation [
7]. Estrogen (E2) controls this process and ensures that the follicles receive the necessary nutrients [
8]. However, laying hens often accumulate excessive amounts of fat due to continuous egg production and high-energy diets during the later stages of laying [
3]. This often leads to liver failure [
9] and lipid metabolism disorders [
10,
11] in laying hens. Consequently, the overall health and egg production performance of the poultry during the later stages of laying can be adversely affected.
Previously, researchers have focused on improving the reproductive performance of later laying hens through feed additives to improve the synthesis of hormones [
12,
13], eggshell quality [
14], and antioxidant capacity [
15,
16,
17]. With the development of technologies such as the transcriptomics, many genes and transcription factors have been identified that affect the reproductive performance of poultry during the later laying period. For example,
ACSF2, a gene involved in lipid metabolism, was highly expressed in the liver of high-producing chickens [
18]. However, transcriptomic information does not fully explain the complexity and dynamics of the regulation of reproduction in poultry. Proteomics and metabolomics, as new technologies in the post-genomic era, provide new insights into and means to understanding the molecular changes in reproduction in poultry. Proteomics and metabolomics are now widely used in avian breeding, such as in screening for key growth factors by evaluating differently expressed proteins (DEPs) and differential metabolites (DMs) in the pectoral muscle and intramuscular fat of chickens with contrasting growth rates [
19], investigating the mechanisms of the functional regulation of granulosa cells in poultry by identifying DEPs and DMs in the ovary of laying chickens before and after sexual maturity [
20], and screening for disease biomarkers of laying hens with fatty liver hemorrhagic syndrome (FLHS) by proteomics [
21].
Until now, few studies have been reported on key regulatory proteins and metabolites in the liver and ovary of later laying chickens. The Guangyuan gray chicken is a high-quality meat and egg chicken in China. However, as it is a local breed, its egg production rate is only 80% during the peak laying period, and it mostly stops laying eggs at 55 weeks of age. In this study, to investigate the DEPs and DMs in the liver and ovary of local breeds of chicken and commercial laying hens during the later laying period, liver and ovary tissues from Guangyuan gray chickens (Group G) and Hy-Line gray chickens (Group H) were collected for proteomic and metabolomic analyses to distinguish the different proteins and metabolites in the liver and ovary of different chicken breeds during the later laying period. This research will lay the foundation for improving the performance of Guangyuan gray chickens in the later laying period.
3. Discussion
The laying performance of local breeds of chickens differs considerably from that of commercial laying hens and remains so during the late laying period [
22]. The liver is the major organ of energy metabolism and fatty acid metabolism [
21], and yolk deposition in the follicle depends on the transport of lipids and proteins from the liver to the ovary [
23]. In this study, the proteomic and metabolomic profiles were compared between the liver and ovary of 55-week-old Guangyuan gray chickens and Hy-Line gray chickens. Morphological and histological studies showed that the livers of Group H were yellowish in color, with more loosely arranged liver cells, and were richer in lipid droplets than those of Group G under the same feeding conditions. The altered morphology of liver cells in Group H may be attributed to the long-term absorption of large amounts of nutrients, such as TC and TG, by the liver in order to maintain a high egg production [
23]. Eventually, the fat absorbed by the liver exceeds the transport capacity of the apolipoproteins, leading to fatty liver syndrome (FLS) [
24]. The ovaries of Group G were basically atrophied, whereas grade follicles filled with yolk still existed in the ovaries of Group H. In addition, the serum levels of FSH and LH, which are related to follicular development [
25]; the yolk precursors LEC, VTG, and VLDLy [
26]; and TC and TG, which are related to steroid hormone synthesis and lipid deposition [
27], were significantly higher in Group H. All the results indicated that the liver and ovarian functions of commercial laying hens are still active in the later laying period, which is the reason for their superior laying performance.
In general, carbohydrate metabolism is more vigorous in the liver of broiler chickens, whereas lipid metabolism is more vigorous in laying hens [
28] because broiler chickens need more energy to maintain rapid growth but laying hens need lipids to maintain egg production. Proteomics studies have shown that upregulated DEPs in the liver and ovary of Group G were mainly enriched in pathways related to carbohydrate metabolism, which may be because Guangyuan gray chickens, as a local breed, tend to be used for both meat and eggs. DEPs such as acetyl-coenzyme A synthetase (ACSS1B), s-(hydroxymethyl) glutathione dehydrogenase (ADH4), and hexokinase (HK2), which are involved in carbohydrate metabolism, were identified in the liver of Group G, among which acylphosphatase-1 (
ACYP1) and
ACSS1B were also shown to be involved in the regulation of heat stress in chickens [
29,
30], which may be because Guangyuan gray chickens have a more energetic metabolism and produce more heat, and therefore rely on ACYP1 and ACSS1B to reduce the apoptosis of liver cells in hot environments [
29]. In the ovary, glucose-6-phosphatase (G6PC3) [
31] and ADH4 have been identified as being involved in carbohydrate metabolism. Notably, ADH4, a unique protein of Group G involved in the catabolism of a variety of substrates such as ethanol, retinol, steroids, and lipids [
32,
33], has been demonstrated to be a key gene for energy metabolism in cancer cells [
34] and can be critical in energy metabolism in the liver and ovary in Group G. Among the DEPs identified in the liver of Group H, only one DEP was enriched in a unique pathway related to carbohydrate metabolism. However, propionate-CoA ligase (ACSS3), ribokinase (RBKS), ATP-citrate synthase (RCJMB04_6f14), and hydroxymethylglutaryl-CoA synthase (HMGCS1) were identified to be involved in carbohydrate metabolism and were found in the ovary of Group H, of which
ACSS3 was also found to be involved in the regulation of heat stress [
35] and
HMGCS1 is also involved in the degradation of amino acids and cholesterol [
36], which may, to some extent, alleviate fatty liver syndrome in Hy-Line gray chickens.
Notably, in addition to carbohydrate and lipid metabolism, DEPs were enriched in pathways related to amino acid metabolism in Groups G and H. Among them, DEPs such as pyrroline-5-carboxylate reductase (PYCR1), ALDH18A1, aspartate aminotransferase, and cytoplasmic (GOT1) were identified to be significantly enriched in the arginine biosynthesis pathway in the liver of Group G, which is able to inhibit fatty acid synthesis and promote fatty acid β-oxidation [
37], which may interfere with the synthesis of substances such as TG and TC in the liver of Guangyuan gray chicken.
On the other hand, most of the upregulated DEPs in the liver and ovary of Group H were enriched in pathways associated with lipid metabolism. No DEPs were identified in the ovary of Group G that were enriched in unique pathways related to lipid metabolism, but ADH4, beta-2-microglobulin (B2M), delta-1-pyrroline-5-carboxylate synthase (ALDH18A1), and 15-oxoprostaglandin 13-reductase (PTGR2), which are involved in lipid metabolism, were identified in the liver. Among them, ADH4 is involved in fatty acid degradation, whereas the overexpression of
PTGR2 suppressed
PPARG’s transcriptional activity and inhibited lipid synthesis. ALDH18A1 was also a unique protein found in Group G. The loss of function of ALDH18A1 was found to be associated with larger lipid droplets and was positively correlated with leanness in chickens [
38], which was consistent with our findings. On the other hand, DEPs such as fatty acid desaturase 1 (FADS1), cytochrome P450 1A4 (CYP1A4), and tryptophan 2,3-dioxygenase (TDO2) were identified in the liver of Group H. These are involved in lipid metabolism, of which CYP1A4 is a protein unique to Group H involved in the metabolism of a variety of compounds, including substances such as steroids and fatty acids [
39]. It was identified that steroid sulfatase (STS), glucosylceramidase (LOC107050229), and phospholipase A2 Group XV (PLA2G15) were all involved in the metabolism of functional lipids in the ovary of group H. Among them,
STS was identified as a key gene for the secretion of reproductive hormones [
40]. These three DEPs were unique proteins of group H and may be associated with the high egg production of Hy-Line gray hens at the end of the laying period.
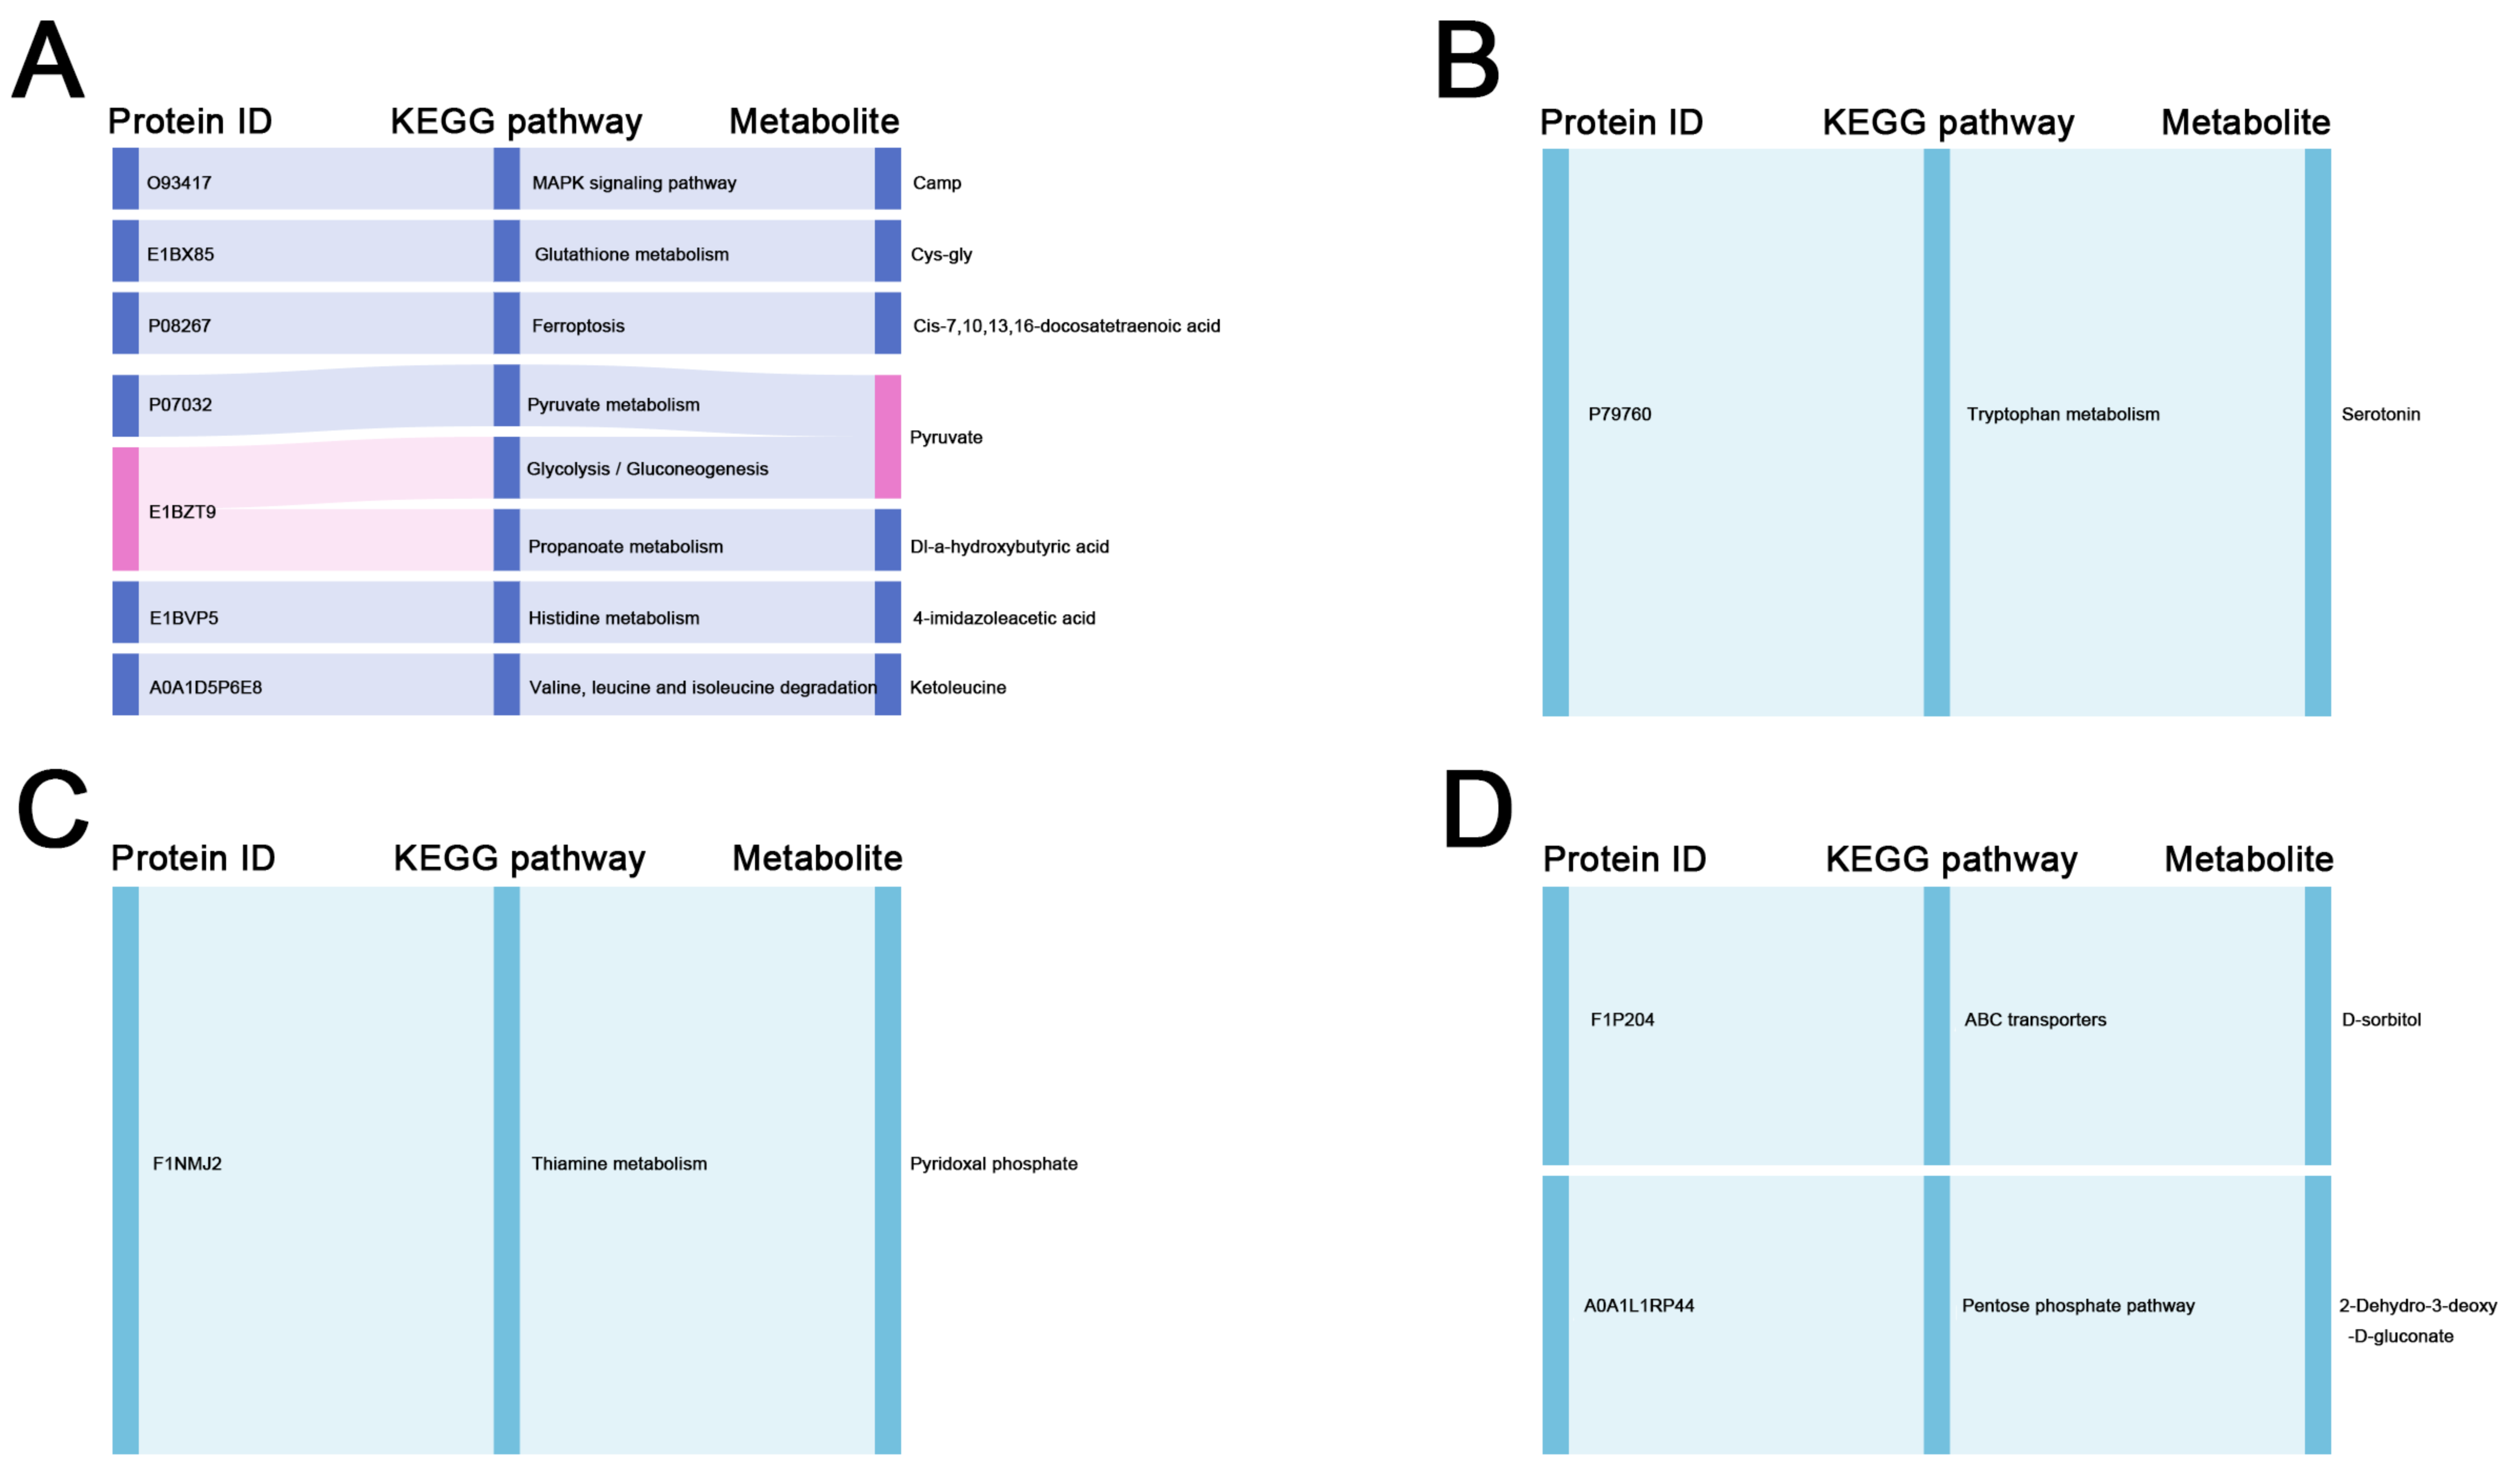
In metabolomic studies, the functional enrichment of DMs was consistent with that of the DEPs. The most abundant metabolites identified in the liver and ovary were organic acids and their derivatives, and lipids and lipid-like molecules, respectively. The involvement of pyruvate, Dl-a-hydroxybutyric acid, L-arabinono-1, 4-lactone, and glycolate in carbohydrate metabolism was identified in the liver and ovary of Group G. Among them, 4-lactone and glycolate have been have been discovered to be critical in fighting oxidative stress [
41]. 2-Dehydro-3-deoxy-D-gluconate and D-sorbitol were identified in the ovary of Group H and are involved in carbohydrate metabolism. Sorbitol catalyzes the conversion of fructose in the liver. Excess fructose increases liver stress and contributes to the accumulation of fat [
42]. Additionally, the more abundant lipids and lipid-like molecules in the liver of Group G were o-phosphoethanolamine and taurocholate; taurocholate is involved in the biosynthesis of primary bile acid, and bile acid can promote the digestion and absorption of fat [
43].
The more abundant lipid and lipid-like molecules in the liver of Group H were glyceric acid, palmitic acid, cis-9-palmitoleic acid, and linolenic acid; the most abundant in the ovary was chenodeoxycholate. A former study found that the liver of laying hens with fatty liver hemorrhage syndrome (FLHS) contained high levels of beta-hydroxybutyric acid, oleic acid, palmitoleic acid, glutamic acid, and other metabolites, which could be used as biomarkers for diagnosing disease [
44]. These results were consistent with our findings. Therefore, although Hy-Line gray hens performed better in terms of egg production than Guangyuan gray chickens, prolonged overlaying also caused liver lesions in Hy-Line gray hens. It is also noteworthy that DMs identified in the liver and ovary of Group H were also significantly enriched in the ABC transporter pathway, suggesting the higher transmembrane transport capacity for amino acids, sugars, and other nutrients in Hy-Line gray hens [
45]. Moreover, 1-aminocyclopropanecarboxylic acid was identified in the ovary of Group H, which is involved in the synthesis of methionine, a major component of apolipoproteins that significantly increases serum TG levels in laying hens and is important for yolk deposition [
46]. In summary, the results of this study suggest that DEPs and DMs involved in the metabolism of carbohydrates, lipids, and amino acids in the liver and ovary of local breeds of chicken and commercial chickens may be responsible for the differences in egg production performance between them in the later laying period.
4. Materials and Methods
4.1. Birds and Sample Collection
All animal experiments were carried out in accordance with the relevant regulations formulated by the Experimental Animal Operation Standards and Welfare Management Committee of Sichuan Agricultural University (approval no. DKY2021202030).
The chickens used in this experiment were reared by Sichuan Tianguan Agricultural and Animal Husbandry Co., Ltd. (Guangyuan, China). One hundred 1-day-old female chicks were reared, with fifty each of Guangyuan gray chicks and Hy-Line gray chicks. At six weeks of age, each breed was divided into 10 groups, with replicates in each group, and reared in a single cage. At 55 weeks of age, 10 healthy chickens with a similar bodyweight were randomly selected from each of the two breeds (Group G and Group H). Blood was obtained from the pterygoid vein, followed by weighing and euthanizing the chickens by neck dislocation. Liver and ovarian tissues were collected, the livers were weighed, and the pre-grade follicles and grade follicles were counted. The liver and ovary tissues were separated into two sections. One section was immersed in a 4% paraformaldehyde fixative (Sigma-Aldrich, St. Louis, MO, USA) for histological observations, and the other was rapidly refrigerated in liquid nitrogen and kept at −80 °C for later analysis.
4.2. Protein Extraction, Digestion and Quality Control
Six liver and ovary samples were collected from each breed for protein profiling. Three replicate groups were established for each of the different tissues of each breed, and each group consisted of a mixed sample of tissues from two chickens of the same breed. An SDT buffer (4% SDS, 1 mM DTT) was used for extracting protein under a high pH. The protein quantification was conducted with the BCA Kit (Bio-Rad, Hercules, CA, USA). Protein digestion followed the Filter-Aided Sample Preparation (FASP) procedure [
47]. Each sample initially contained 200 µg of protein, which was mixed with 30 µL of the SDT buffer comprising 4% SDS, 100 mM DTT, and 150 mM Tris-HCl at pH 8.0. We then removed small molecules by treating the samples with a UA buffer containing 8 M urea. Then, 100 μL of iodoacetamide was added, and the samples were incubated in the dark for 30 min. The filters were washed sequentially with the UA buffer and a 25 mM NH
4HCO
3 buffer. Next, 4 μg of trypsin (Promega, Madison, WI, USA) was added to a protein/enzyme ratio of 50:1, and the protein suspension was digested at 37 °C overnight, then, the peptides in the filtrate were collected. The digested peptides from each sample were desalted on C18 cartridges (Empore™ SPE Cartridges C18 (standard density) on a bed with an inner diameter of 7 mm and a volume of 3 mL, Sigma-Aldrich, St. Louis, MO, USA), then, they were concentrated by vacuum centrifugation and reconstituted in 40 µL of 0.1% formic acid. Finally, the peptide content was calculated at 280 nm.
A quality control of the protein extraction process was performed using SDS-PAGE. Briefly, 20 µg of protein from each sample was mixed with the loading buffer diluted fivefold and heated for 5 min. The proteins were then separated on a 12.5% SDS-PAGE gel. Finally, we visualized the protein bands by staining with Coomassie Blue R-250.
4.3. LC-MS/MS Analysis of Proteins
In this study, a 4D label-free approach and shotgun approach were used for the proteomics experiments, i.e., ion mobility separation was added to the original three dimensions of proteomic separation (retention time,
m/
z, and intensity) [
48]. The samples were separated using the HPLC liquid phase system Easy nLC, loaded with 400 ng of peptides per run. The peptides were loaded onto a reverse-phase trap column (Acclaim PepMap100, 100 μm × 2 cm, nanoViper C18, Thermo Fisher Scientific, Waltham, MA, USA) connected to the C18 reverse-phase analytical column (Easy Column; 10 cm long, 75 μm inner diameter, 3 μm resin, Thermo Fisher Scientific, Waltham, MA, USA) in Buffer A (0.1% formic acid). The separation of peptides was achieved using a linear gradient of Buffer B (84% acetonitrile and 0.1% formic acid) at a flow rate of 300 nL/min. Then, we conducted the LC-MS/MS analysis using a timsTOF Pro mass spectrometer (Bruker Daltonics, Billerica, MA, USA) coupled with Nanoelute equipment (Bruker Daltonics, Billerica, MA, USA). The mass spectrometer in this study was operated in positive ion mode and the data acquisition mode was the DDA-PASEF mode. The mass range of ion mobility for mass spectrometry acquisition was 100–1700 (
m/
z) and 0.6–1.6 (1/k0). Additionally, 10 cycles of PASEF MS/MS with a target intensity of 1.5 k and a threshold of 2500 were performed. To prevent repeated analysis, active exclusion with a release time of 15 s was enabled.
4.4. Bioinformatic Analysis
The NR databases (GenBank, Refseq, SwissProt, etc.) and the UniProt databases (SwissProt, TrEmbl) were used for identifying proteins in this study. MaxQuant software 1.6.14 was used for quantitative analysis and the QC of the protein mass spectrometry data [
49]. In the analysis, the raw data from the mass spectrometry analysis were entered and the relevant parameters were set to check the database for identification and quantitative analysis. The following configurations were used: a maximum tolerance of 2 missed sites was allowed, with primary and secondary ion mass tolerances set at ±6 ppm and 20 ppm. Moreover, carbamidomethyl (C) and oxidation (M) were designated as fixed and variable modifications, respectively. The database pattern used to calculate the false discovery rate (FDR) was reversed, with a peptide FDR of ≤0.01 and a protein FDR of ≤0.01 as the screening criteria. A quantitative comparison of the proteins between groups was performed using LFQ, and the main algorithm was applied after pairwise correction of the peptide and protein multiples. FC > 2 or FC < 0.50, with
p < 0.05, was used to screen DEPs that were significantly up- and downregulated between the groups, and volcano plots were generated using the volcano 3D R package (R 4.2.2). We utilized the Complexheatmap R 4.2.2 (R Foundation for Statistical Computing, Vienna, Austria), Cluster 3.0 (Michelson Laboratories, Tokyo, Japan), and Java Treeview software 3.0 (Eisen Lab at Stanford University, Stanford, CA, USA) for sample classification and protein expression level analysis. The classification was performed using the Euclidean distance algorithm and average linkage for clustering. Hierarchical clustering heatmaps were generated based on significant changes in protein expression levels (FC > 2,
p < 0.05). The DEPs were then functionally annotated with Gene Ontology (GO) terms using Blast2Go software (
https://www.blast2go.com, accessed on 20 April 2023, BioBam Bioinformatics, Valencia, Spain), and Kyoto Encyclopedia of Genes and Genomes (KEGG) annotation was performed on the DEPs using KAAS software (
https://www.genome.jp/tools/kaas, accessed on 20 April 2023, Kanehisa Laboratories at Kyoto University, Kyoto, Japan). In addition, unique proteins were obtained by using the screening criterion that half or more than half of the samples in one group were not null and all data in the other group were null.
4.5. Metabolite Extraction
Six liver and six ovarian samples from each of the two breeds were selected for metabolic profile analysis between the two breeds. After slowly thawing the samples, 5 mg of each sample was added to a pre-cooled solution of methanol, acetonitrile, and water in a ratio of 2:2:1. Then, we vortexed the mixture and treated it ultrasonically at a low temperature for 30 min, followed by ultrasonic treatment at −20 °C for 10 min, and we finally centrifuged the sample at 14,000× g at 4 °C for 20 min. The supernatant was then dried and 100 μL of an aqueous solution of acetonitrile was added. We centrifuged the mixture at 14,000× g for 15 min and collected the supernatant for ultra-high pressure liquid chromatograph (UHPLC)-MS/MS analysis. The temperature was maintained at 4 °C throughout the experiment.
4.6. UHPLC-MS/MS Analysis and Data Analysis
The samples were separated on a Vanquish LC UHPLC (Thermo Fisher Scientific, Waltham, MA, USA) with a HILIC column (ACQUITY UPLC BEH Amide, 1.7 μm, 2.1 mm × 100 mm, Waters, Milford, MA, USA). The detection conditions were as follows: column temperature, 25 °C; flow rate, 300 μL/min. The composition of Mobile Phase A was composed of water, 25 mM acetic acid, and 25 mM ammonia; Phase B was acetonitrile. By gradient elution, within 17 min, B was linearly changed from 98% to 2%, then to 98%, and finally returned to and maintained at 98%. QC samples were inserted in the sample queue to ensure the system stability and data reliability. Metabolite spectra were obtained using a Q Exactive Orbitrap mass spectrometer (Thermo Fisher Scientific, Waltham, MA, USA). The positive and negative ion modes of electric spray ionization (ESI) were used for primary and secondary mass spectra acquisition, with the following ESI settings: Gas1 and Gas2: 60, CUR: 30 psi, ion source temperature: 600 °C, ISVF: ±5500 V. Mass spectra were acquired in DDA mode with secondary spectra obtained by segmented acquisition. Primary and secondary spectra were acquired with the following settings: mass-to-charge ratio detection ranges of 80–1200 Da and 70–1200 Da, resolutions of 60,000 and 30,000, cumulative scan times of 100 ms and 50 ms, asnd a dynamic exclusion time of 4 s.
The raw data format was converted to mzXML using ProteoWizard. Metabolite data were extracted using XCMS software 3.5.1 (Scripps Research Institute, La Jolla, CA, USA), and a substance match value of 0.7 was obtained by considering retention time, molecular mass (molecular mass error: <25 ppm), and mass spectral match (
m/
z < 10 ppm, peak width = c (10, 60), prefilter = c (10, 100)). The obtained data were then identified using an in-house database (Shanghai Applied Protein Technology, Shanghai, China) and verified twice. Based on the standards for metabolite identification, the metabolites in this study were classified as Level 2 or higher [
50]. PLS-DA was performed on the metabolites that differed between the groups, and the PLS-DA was corrected by OPLS-DA. FC analysis was performed on all metabolites, including those without identification information, to screen for up- or downregulated DMs on the basis of FC > 1.5 or FC < 0.67, and
p < 0.05. Significant DMs were screened among DMs with identifying information using OPLS-DA, with variable importance in projection (VIP) > 1 as a criterion, and subsequent analysis was performed. Pearson’s correlation analysis was used to identify the relationship between two breeds. In addition, we used Blast2GO and KAAS to perform GO and KEGG pathway annotation of the target metabolite collection. R package (ropls) was used to visualize analyses such as volcano maps and correlation heat maps.
4.7. Detection of Serum Biochemical Parameters
The separated serum was centrifuged at 4000 r/min to remove impurities. Then, the hormone levels were tested with an ELISA kit (MyBioSource, Wuhan, China) for chicken VTG, LH, FSH, LEC, and VLDLy according to the manufacturer’s instructions. In addition, TC and TG test kits (Solarbio, Beijing, China) were used to detect the TC and TG levels. The assay was repeated 14 times for three QC samples (1.23 ng/mL, 4.25 ng/mL, and 19.45 ng/mL, respectively) to test the reproducibility of the kit between wells in the assay plate, and the results showed that the CV value of each sample was less than 10% (4.23%, 7.52%, and 7.67%, respectively), indicating that the kit had high precision. The results on the serum hormone levels were visualized using GraphPad Prism 9.0.0 (GraphPad Software, La Jolla, CA, USA).
4.8. Oil Red O Staining
Frozen samples were sectioned to 8 μm, fixed in 10% formalin (Solarbio, Beijing, China) for 10 min, and washed. The sections were immersed in 60% isopropanol (Sinopharm, Beijing, China) for 2 min. The sections were stained with an Oil Red O solution (Sangon Biotech, Shanghai, China) for 15 min while protected from the light. The sections were again immersed in 60% isopropanol for 5 s to remove the staining solution and washed again in ice-cold distilled water. The nuclei were stained with Mayer’s hematoxylin (Sangon Biotech, Shanghai, China) for 5 min, washed, dried, and embedded in glycerol gelatin (Xilong Scientific, Shantou, China). The sections were observed under a BX53F inverted microscope (Olympus, Tokyo, Japan) and photographed.
4.9. Hematoxylin–Eosin (HE) Staining
The samples were first immobilized in 4% paraformaldehyde (Solarbio, Beijing, China) for 24 h, then immersed in 70%, 80%, 90%, 95%, and 100% ethanol solutions for 30 min to dehydrate the samples. They were then placed in xylene for 2 h to make the samples transparent and embedded in paraffin wax for 3 h. The embedded samples were sectioned into 5 μm pieces and immersed in xylene for 20 min to dewax the samples. The sections were then immersed in a series of ethanol solutions from high to low concentrations and finally in distilled water. The sections were stained with a hematoxylin solution (Beyotime, Haimen, China) for 4 min, fractionated in hydrochloric acid and ethanol for 3 s each, rinsed in running water for 1 h, immersed in distilled water for 10 min, and dehydrated in 70% and 90% ethanol solutions for 10 min each, followed by staining with the eosin staining solution for 3 min. The stained sections were dehydrated by immersion in an ethanol solution and then immersed in xylene to make the sections transparent, and they were finally sealed and stained with gum. The sections were sealed with resin, observed under a BX53F inverted microscope (Olympus, Tokyo, Japan), and photographed.
4.10. Western Blot Validation of DMs Expression
After tissue collection, proteins were extracted using the Total Tissue Protein Extraction Kit (Servicebio, Wuhan, China) according to the provided instructions. Protein concentrations were determined using the BCA kit (Servicebio, Wuhan, China) and the samples were made consistent. Protein samples (5 μL) were loaded onto SDS-PAGE gels (separation gel: 10%, concentration gel: 5%) along with a 4:1 ratio of protein to sample loading buffer for electrophoresis. The proteins were then moved to the PVDF membranes with the wet transfer device and blocked for 1 h with blocking solution (Beyotime, Haimen, China). The primary antibodies (
Table S7) were co-incubated with target proteins overnight at 4 °C, followed by removal of unbound antibodies using TBST (Servicebio, Wuhan, China). The membranes were then treated with appropriate secondary antibodies, excess secondary antibody was washed off, and the protein bands were visualized using the Ultra Hypersensitive ECL Chemiluminescence Kit (Servicebio, Wuhan, China). Quantification was performed using ChemiScope Analysis software 6200 (CLINX, Shanghai, China).
4.11. Statistical Analysis
This study presented all the findings in the form of the mean ± standard deviation (SD). To determine the significance, we conducted a statistical analysis using either one-way ANOVA or an unpaired Student’s t-test with the help of SPSS 26.0 software (IBM Corporation, Armonk, NY, USA). The significance levels were defined as * p < 0.05, ** p < 0.01, and ns p ≥ 0.05.


 ,
, 


