Article

Metabolomic Approach Based on Analytical Techniques for the Detection of Secondary Metabolites from Humulus lupulus L. Dried Leaves

1
Department of Agriculture, Food, Environmental and Forest, Università di Firenze, 50019 Firenze, Italy
2
Department of Chemistry and Technology of Drug, Sapienza University, 00185 Rome, Italy
3
Department for Innovation in Biological Systems, Food and Forestry, University of Tuscia, 01100 Viterbo, Italy
*
Author to whom correspondence should be addressed.
Int. J. Mol. Sci. 2023, 24(18), 13732; https://doi.org/10.3390/ijms241813732
Submission received: 21 July 2023 / Revised: 29 August 2023 / Accepted: 4 September 2023 / Published: 6 September 2023
(This article belongs to the Special Issue Metabolomic Approaches to Bioactive Molecules Discovery)

Abstract

:
Currently, the leaves of the hop plant (Humulus lupulus L.) are an unexploited and still little-investigated agricultural by-product. In our study, with the aim of exploring the metabolome of dried hop leaves (Chinook cultivar), a metabolomic approach was applied using multiple analytical tools such as SPME/GC–MS, GC–MS, PTR-ToF-MS, and NMR to identify the secondary metabolites. The obtained results showed the presence of a high number of components belonging to different chemical classes. In fact, thanks to the multi-methodological approach, volatile organic compounds (VOCs) with low molecular weight, terpenic compounds, fatty acids, sugars, amino acids, organic acids, and alcohols have been detected and identified. Among the revealed terpenes in the untreated matrix, the sesquiterpenes α-humulene, β-caryophyllene, and α-copaene were the most abundant. Among the saturated and unsaturated fatty acids, palmitic and linolenic acids, respectively, were those with the highest relative percentages. Particularly relevant was the sugar content, where sucrose was the main exponent while glutamate and asparagine were the principal detected amino acids. Conversely, alcohols and organic acids were the least abundant compound classes, and xanthohumol was also identified in the methanolic extract.

1. Introduction

The hop plant (Humulus lupulus L.) belonging to the Cannabaceae family is a fast-climbing perennial that grows well in temperate regions and produces large quantities of yellow–green leaves from spring to autumn.
The plant tends to climb clockwise around any support to a height of 10–18 m. The leaves are opposite or alternate and have three to five lobes with serrated margins; further, they are rough to the touch and have toothed edges.
H. lupulus contains several phytochemicals [1], and some of its secondary metabolites have potential value whose accumulation depends on various factors such as the genetic make-up, climatic conditions [2], and cultivation area [3]. The inflorescences represent the share of biomass exploited mainly because it is widely used to produce beer. In fact, the leaves and stems, as mass accumulated in the post-harvest period, have been little studied as they are basically considered waste material. However, with a view to a circular economy, also considering the high quantity of biomass, the recovery of this material can be useful in the industrial field as an alternative source of functional molecules [4]. In fact, previous studies have proposed the use of hop leaves as fodder for animals [5] or to produce ecological pesticides not harmful to bees [6].
Thanks to its numerous constituents, such as bitter acids, polyphenols, flavonoids, and terpenic compounds, hop cones have been extensively investigated, highlighting a wide range of biological activities including antibacterial, antioxidant, estrogenic [7,8] and, lately, also anticancer mainly linked to the presence of xanthohumol [9,10]. However, some molecules belonging to these classes of compounds have also been found in hop leaves [11,12]; among these, phenolic compounds are present in sufficient concentrations to be responsible for the antiradical capacity attributed to the leaves [13]. On the contrary, little or nothing has been reported on the volatile composition of dried hop leaves.
The Chinook hop is a cultivar well known in the American craft beer world, and to this day, the majority of the Chinook’s annual supply comes from Washington hop growers. This variety is a cross between a Petham Golding and a USDA-selected male, and it is characterized by a high content of alpha acids and good-keeping properties. It has a strong pine and resin character with spicy notes, and it can also be slightly spicy [14].
In this study, the complexity of chemical compounds was explored through an exhaustive analysis of the metabolome performed by combining multiple analytical tools (SPME/GC–MS, PTR-ToF-MS, and NMR). For example, the correlation between SPME/GC–MS and PTR-ToF-MS data allows a complete fingerprint of the volatolomic profile of the analyzed matrix, bypassing the limitations of each instrument. On the other hand, NMR is a powerful technique that, when applied to food, allows for the identification and quantification of secondary metabolites in a single experiment. Therefore, a metabolomic approach was applied in order to describe the volatile and non-volatile chemical profile of the dried leaves of Chinook hop grown in southern Italy.

2. Results

2.1. SPME/GC–MS Chemical Composition

Using the SPME/GC–MS technique, a total of eighteen volatile compounds, listed in Table 1, were detected and identified and the identifiers were also reported (Table S1). The volatile fraction of the dried leaves was dominated by the presence of sesquiterpenes (85.8%). Among them, α-humulene (27.8%), β-caryophyllene (19.2%), and α-copaene (12.9%) were the most abundant. These principal components were followed by γ-muurolene, δ-cadinene, and β-eudesmene, whose average percentage values ranged from 4.3 to 7.6%. The relative chromatogram is reported in Figures S1–S3.

2.2. PTR-ToF-MS: Determination of Volatile Compounds from Hop Dried Leaves

Hop-dried leaf samples analyzed by a Proton-Transfer-Reaction Time-of-Flight Mass Spectrometer (PTR-ToF-MS) were prepared in the same way as the ones used for Solid Phase Microextraction/Gas Chromatography–Mass Spectrometry (SPME/GC–MS) analysis with the aim to compare the results of these two methodologies. The PTR-ToF-MS data were filtered following the procedure previously described by Masi et al. [15]. Thus, all peaks imputable to water chemistry and all the interfering ions (e.g., oxygen, nitrogen monoxide) were eliminated, and subsequently, the peaks whose average concentrations were lower than 0.5 ppbv (parts per billion by volume) were also eliminated. After filtering the whole volatile organic compounds (VOCs), the spectra of the hop-dried leaf (analyzed in triplicate) were composed of 25 VOCs with different emission intensities, as reported in Table 2. All these detected compounds were identified up to m/z 205.195, and no other compounds with higher molecular weight were identified with an emission intensity greater than 0.5 ppbv. The revealed compounds could be tentatively attributed to compounds such as aldehydes, ketones, alcohols, terpenes, and sulfur compounds (Table 2 and the identifiers were also reported (Table S2)). The highest hop leaves volatile emissions were detected for the compounds detected at m/z 59.059 and 45.033, which showed, as a sum, over 60% of the total emission.
Some signals linked to terpene compounds were identified in the leaf samples and in accordance with what was previously reported by Stanius et al. [16]. In particular, five different signals linked to terpene emission were detected, such as m/z 93.069, 107.086, 109.101, 133.101, and 205.195 (Table 2). Leaves also emitted a small fraction of volatile sulfur compounds (see m/z 49.010—TI as methanethiol) probably linked to thiol compound as reported by Macchioni et al., [13]. Methanethiol is a volatile organic sulfur compound that represents one of the most frequent products of plant metabolism, as suggested by Vivaldo et al. [17].

2.3. Fatty Acids Content

GC–MS analyses of the dried leaves extract highlighted the presence of five fatty acids, including two saturated and three unsaturated (Table 3 and the identifiers were also reported (Table S3)). Linolenic acid (48.3%) and palmitic acid (38.7%) were the major components, followed by linoleic (5.9%), stearic (4.3%), and palmitoleic acid (2.9%). The relative chromatogram is reported in Figure S2.

2.4. Chemical Composition of Methanolic Extract after Derivatization

The GC analyses carried out on the silylated methanolic extract allowed the detection of twenty-five components belonging to different chemical classes (Table 4 and the identifiers were also reported (Table S4)). The sugar fraction was the most abundant since sucrose reached the highest percentage value (62.3%). Among detected alcohols, D-pinitol (2.8%) was the major component, followed by glycerol (1.1%). Detected organic acids represented a minor share, where only pyruvic acid reached 0.1%. The relative chromatogram is reported in Figure S3.

2.5. NMR Analysis of Dried-Hop Leaves

The complete NMR assignment of the hydroalcoholic extract of hop leaves is reported in Table 5 (the identifiers were also reported in Table S5) and Figures S4–S7, and the bar charts of the quantitative results in Figure 1. Eleven amino acids (isoleucine, leucine, valine, threonine, alanine, proline, glutamate, GABA, aspartate, asparagine, and glutamine), six organic acids (acetate, succinate, citrate, malate, fumarate, and formate), three sugars (fructose, sucrose, and glucose), and choline and trigonelline were identified.
Among amino acids, glutamate and asparagine were the most abundant, representing 30.3% w/w and 24.8 % w/w, respectively, of the total detected amino acids. The branched-chain amino acids were the least representative (under 5% w/w each). GABA, aspartate, and proline completed the identified compounds of this family, of which glutamine is not quantifiable.
Sugars represented the largest fraction of water-soluble compounds in hydroalcoholic extracts from hop leaves, and sucrose was the major one (87.2 % w/w of the total sugars). Many organic acids were also found, with malic, citric, and succinic acid as the main ones (47.5, 32.4, and 17.6% w/w of the total organic acids, respectively).
Regarding the methanolic extract, the HSQC NMR experiment was chosen to see correlations between hydrogen atoms and the carbon atom to which they are attached. In fact, by means of HSQC, it is easy to assign cross peaks common to all humulones and lupulones molecules (due to methyl and methylene proton resonances of the C-4 prenyl side chain) and cross peaks typical of each series of bitter acid (due to proton resonances methyl and methylene of the prenyl side chains in C-6) [18]. Furthermore, by HSQC, it is also easy to assign unique cross peaks for adhumulone and adlupulone [19]. No bitter acids were detected since no signals of the aliphatic portion of the humulone and lupulone bitter acids series were detected in the characteristic region between 0.89 and 1.3 ppm. However, the NMR assignment of the most abundant prenylated flavonoid xanthohumol, was reported in Table 6 and Figure S8.
The obtained quantitative amount of xanthohumol was 5.28 g/100 g, which represents 0.00528% of the dry weight in the analyzed hop leaves. This was in agreement with what was previously reported [16], where the xanthohumol content in leaves varied with the type of cultivar and, in any case, was lower than its content in hop cones.
The obtained quantitative amount of xanthohumol was 5.28 g/100 g, representing 0.00528% of dry weight in the analyzed hop leaves. This was in agreement with what was previously reported [16], where the xanthohumol content of the leaves varied with the type of cultivar, and, in any case, it was lower than its content in the hop cones.

3. Discussion

In the present work, for the first time, a multi-methodological approach was applied to study the metabolome of dried Chinook hop leaves. The obtained results highlighted the presence of a high number of volatile and semi-volatile metabolites.
Overall, up to now, a small number of previous studies have focused on the chemical characterization of hop leaves, with a very small fraction of these involving the volatile content of untreated plant material. In fact, most of the previous articles mainly concerned the determination of α- and β-acids of hop inflorescences [20,21,22,23,24]. Furthermore, to the best of our knowledge, this is the first work reporting the fatty acid content of hop leaves beyond the investigated cultivar.
Our data showed that α-humulene followed by β-caryophyllene and α-copaene were the most representative terpene compounds. In our previous study [25], carried out on fresh leaves, we found that β-caryophyllene, α-humulene, and δ-cadinene, in descending order, were the most abundant. This suggests that drying, in general, may influence the volatile profile of this matrix. In addition, as reported by Macchioni et al. [13], the drying method can induce variations in the content of flavones, thiols, phenols, and pigments in hop leaves. Likewise, genetic and environmental factors greatly affect the content of phytochemical compounds [26].
The detected emission of several terpene compounds from the leaves was in line with what was previously reported by Stanius et al. [16], where borneol, γ-cadinene, estragole, α-copaene, β-farnesene, β-caryophyllene, γ-muurolene, and α-humulene were emitted by leaf samples of five Lithuanian hop varieties. These compounds were characteristic of the volatile composition of both leaf and cone hops, albeit with different trends [16].
Thanks to PTR-ToF-MS analyses, in addition to some terpenes, which represent about 2% of the total VOC emission, a range of low-molecular-weight compounds such as aldehydes, ketones, alcohols, and sulfur compounds was also found. Among them, aldehydes such as acetaldehyde (C2H5O+) and propanal (C3H7O+) were the most abundant identified compounds, whereas alcohols, ketones, and sulfur showed the lowest emission. For example, the emission amount of CH5S+ (methanethiol) accounted for 0.2% of the total VOC emission (Table 2).
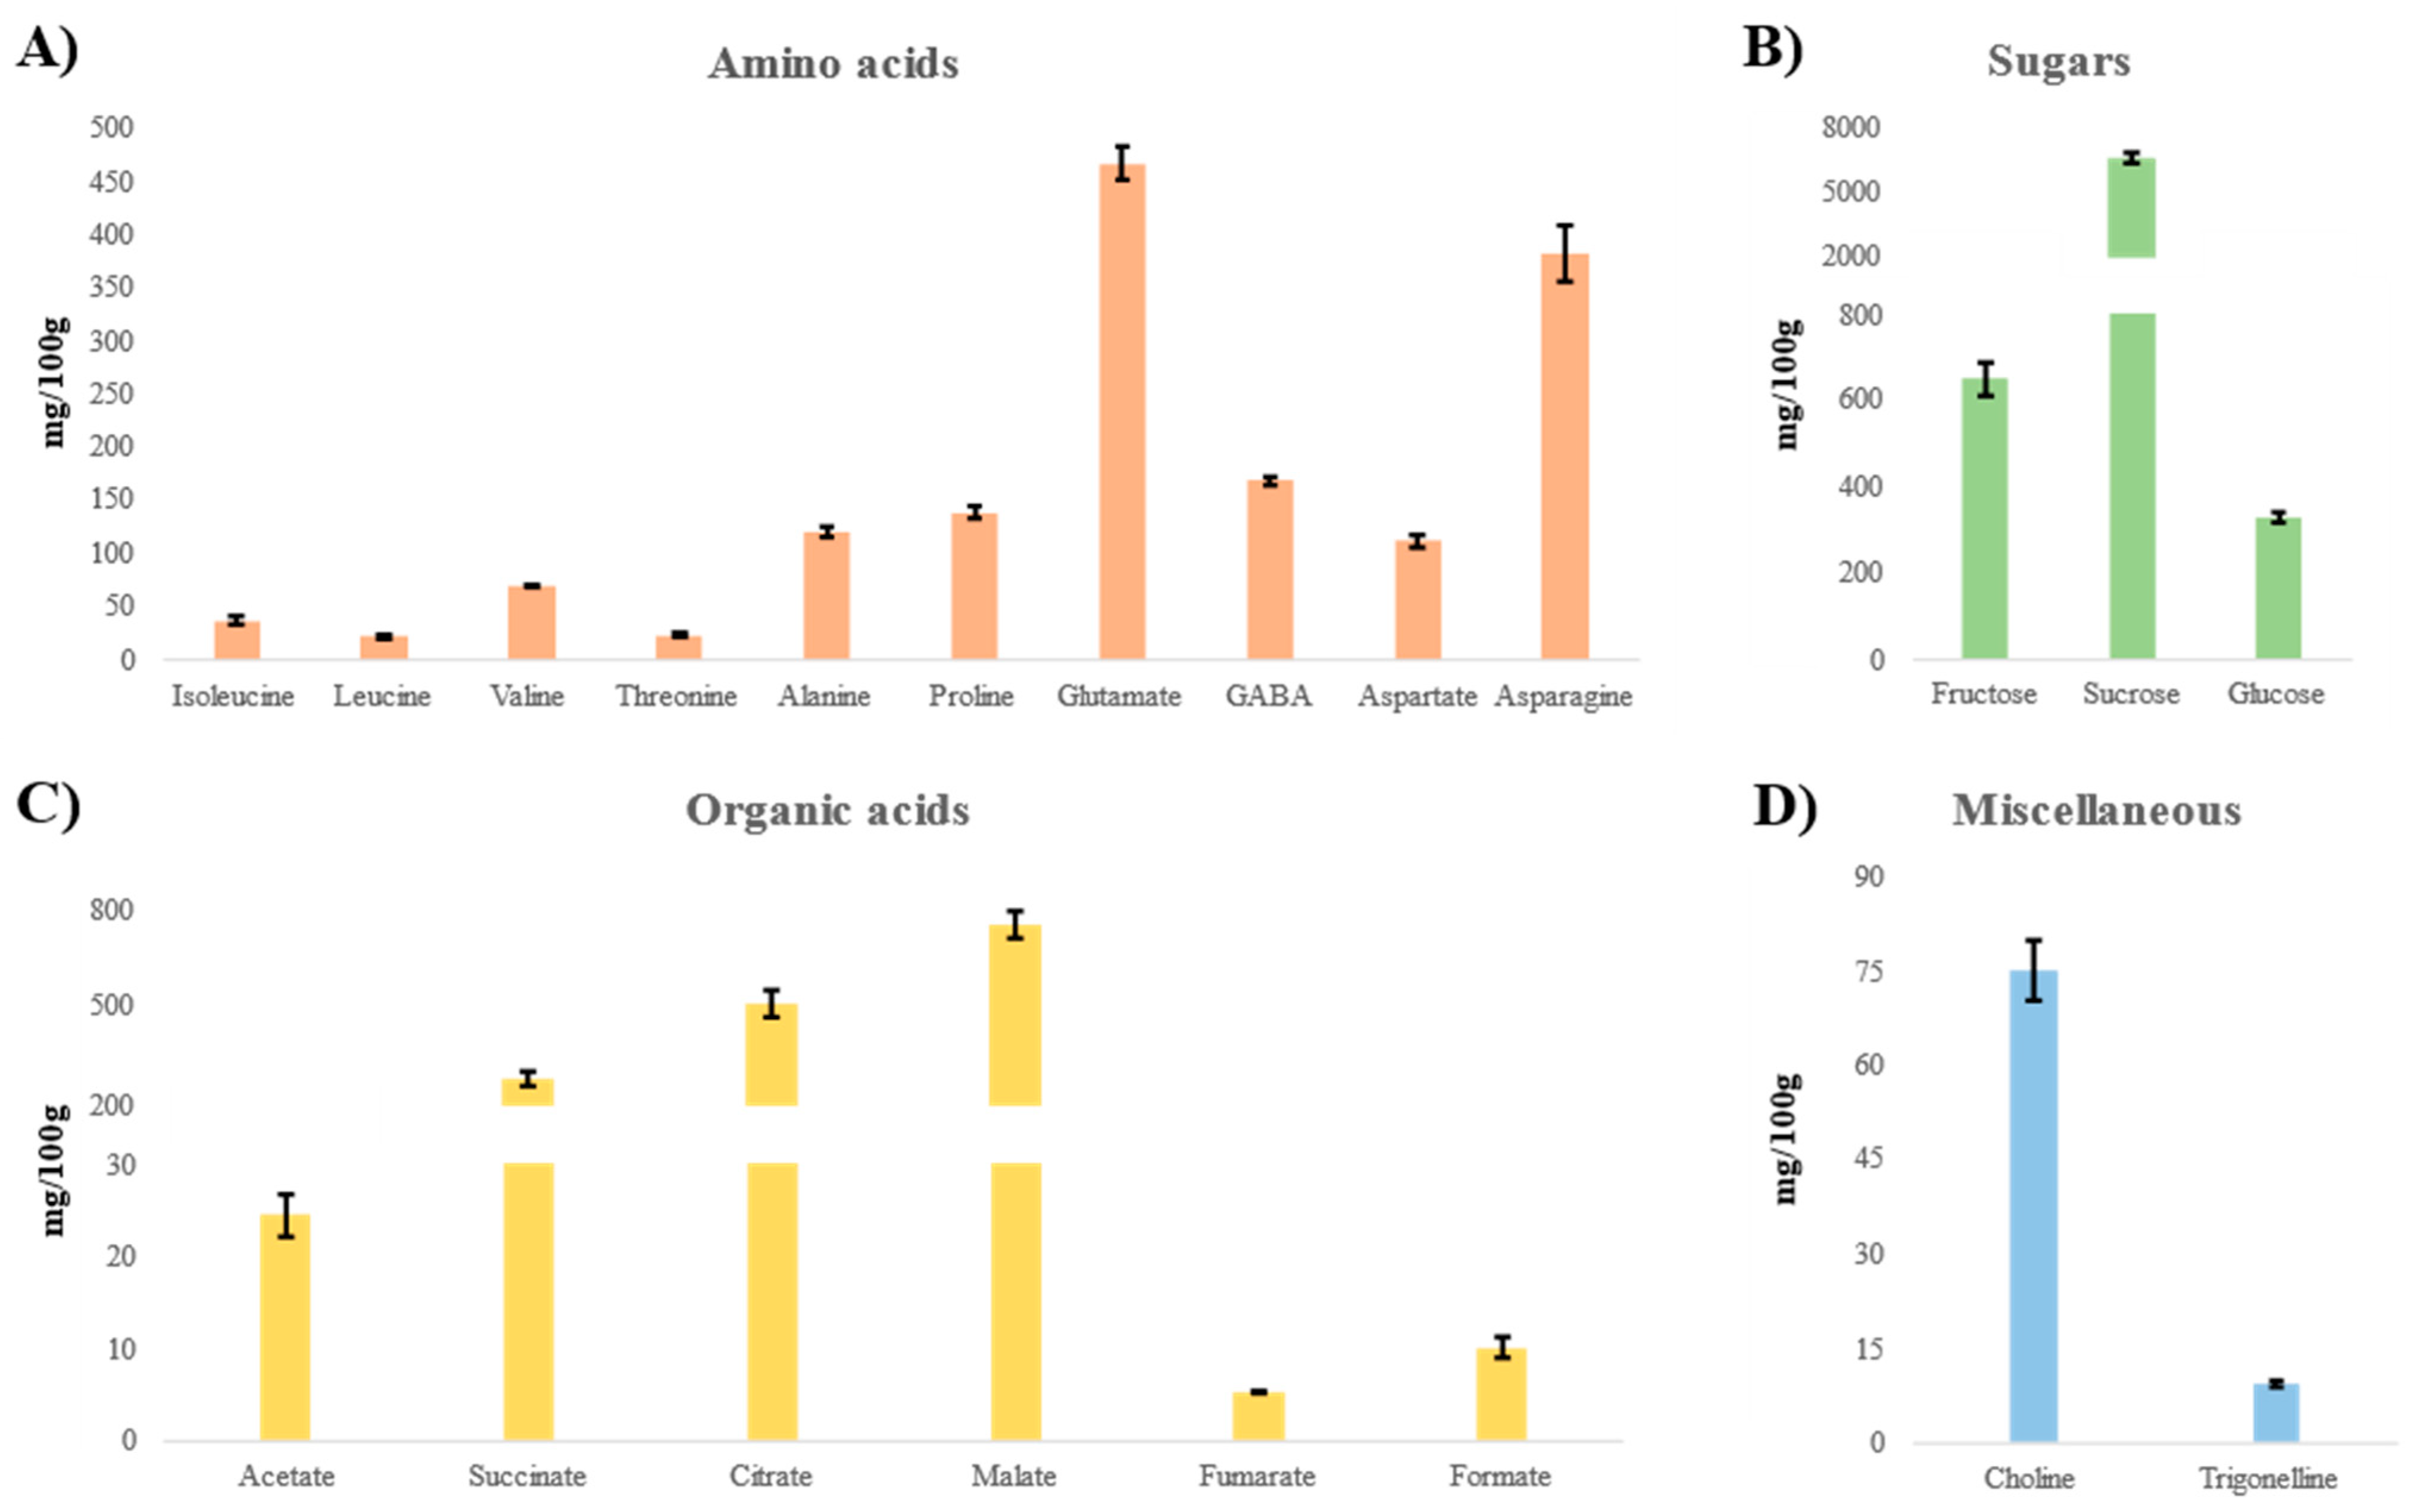
The data obtained by the GC–MS and NMR analyses on the derivatized methanolic extract and the hydroalcoholic extract, respectively, were aligned as both techniques highlighted the presence of compounds belonging to other chemical classes, such as sugars which made up the main fraction and the organic acids. Moreover, taken individually, the GC–MS technique has allowed the identification of a series of alcohols, albeit with a low relative percentage; on the other hand, the NMR technique has made it possible to identify a large number of amino acids.
In general, lH-NMR was widely used to characterize bitter acids and xanthohumol in hop cones [18,27,28], but no NMR study is available on hop leaves. On the other hand, only one study reports the polar metabolite content in hop cones by NMR. [29]. Asparagine, glucose, and fructose have been reported to be the major amino acids and sugars in hop cones [18]. Instead, in our study, glutamate, asparagine, and sucrose were the main ones in hop leaves. Regarding bitter acids, they were not detected in hop leaves due to their low concentration [30,31].
The obtained results from our investigation highlighted that hop leaves can be a natural alternative source of a large number of bioactive metabolites whose biological effects are well known. In fact, the identified different phytochemical classes play a key role in the prevention of various diseases. Among the most representative compounds, the major detected sesquiterpenes β-caryophyllene and α-humulene can exert antibacterial, anti-inflammatory, antioxidant, and anticancer actions [32,33]. The fatty acids revealed in hop leaves are also known for their significant effects on human health [34]. For example, linolenic acid, as the major detected fatty acid, has important physiological actions for plants; moreover, following metabolic conversions into bioactive derivatives, it is expected that it can also treat many diseases [35]. Conversely, palmitic acid has been reported to exhibit significant antibacterial activity against oral microorganisms [36], in addition to having metabolic implications [37]. Furthermore, the structures of many well-known antibacterial and antifungal agents exhibit an amino acid backbone that is crucial for carrying out antimicrobial activity [38]. In plants, sugars are essential as, in addition to providing carbon skeletons as substrates for tissue growth, they also act as signal molecules, thus influencing metabolic processes [39]. Among the detected alcohols, D-pinitol, a glucose metabolite widely identified in plants of the Leguminosae family, has been reported to possess several pharmacological activities, including antidiabetic, antioxidant, anti-inflammatory, and chemo-preventive effects [40]. Finally, xanthohumol, the identified polyphenol in hop leaves, exerts various pharmacological effects such as anti-inflammatory, antioxidant, hypoglycemic, and even anticancer activity [41].

4. Materials and Methods

4.1. Plant Material

Dried hop leaves from the Chinook cultivar were grown in San Nicandro Garganico (Foggia, Italy) at the Vocino family farm in 2021.
The drying of hop leaves took place in a natural way, inside a dark and ventilated room with a constant humidity level (about 50% RH). After about 3 days, the leaves were vacuum-packed and stored in a cool and dry place. Before the analysis, the dried hop leaves were finely chopped with a grinder (MulinexAR 11, Groupe SEB, France) with a particle size of approximately 1.0 mm.

4.2. SPME Sampling

Using the SPME sampling technique, the volatile profile of the untreated matrix was described. About 2 g of the dried leaves were placed inside a 15 mL glass vial with a PTFE-coated silicone septum. A SPME device from Supelco (Bellefonte, PA, USA) with 1 cm fiber coated with 50/30 μm DVB/CAR/PDMS (divinylbenzene/carboxen/polydimethylsiloxane) was chosen to extract the components. The operative conditions followed Nezi et al. [42] with minor modifications. Component desorption was ensured by inserting the fiber directly into the GC injector maintained at 250 °C in splitless mode.

4.3. GC–MS Analysis of the Dried Hop Leaves

To carry out the analyses of the headspace hop leaves, a Clarus 500 model Perkin Elmer (Waltham, MA, USA) gas chromatograph coupled with a mass spectrometer equipped with a FID (flame detector ionization) was used [25,43]. A Varian (VF-1 ms) apolar column was used, and the detected and identified components are listed in Table 1.
The oven programmed temperature was set initially at 55 °C and then increased to 220 °C at 6°/min and finally held for 15 min. Helium was used as carrier gas at a constant rate of 1 mL/min. MS detection was performed with electron ionization (EI) at 70 eV, operating in the full-scan acquisition mode in the m/z range of 35–550 amu. To identify the volatile compounds, the MS-fragmentation pattern obtained was compared with those of pure components stored in the Nist 02 mass spectra library database. The Linear Retention Indices (LRIs) were also calculated using a series of alkane standards (C8–C30 n-alkanes, Supelco, Bellefonte, CA, USA) and then compared with those available in the literature. Semi-quantitative values (peak area percentages) were obtained by peak normalization without using correction factors. The area of each peak in the chromatographic profile was divided by the total sum of all peaks within the chromatogram. The normalized data was then multiplied by 100 and expressed as a percentage. Analyses were carried out in triplicate.

4.4. Extraction and Transesterification Processes

A 3.0 g sample of the dried and chopped hop leaves was weighed in a flask and extracted with 10.0 mL × 2 of methanol (Carlo Erba, Milan, Italy) at room temperature. After separation from solid residue by filtration, the methanolic solutions were combined and dried under reduced pressure at 30 °C to obtain 0.301 g of solid extract.
A 20 mg extract was dissolved in toluene (4 mL) and transferred into a tube to carry out the transesterification [44]. In detail, a solution (10 mL) of 1% (v/v) concentrated sulfuric acid in methanol was added, and the stoppered tube was left overnight at 50 °C. The solution was cooled and transferred in a separatory funnel, and 20.0 mL of water with 5% NaCl was added. A 20.0 mL × 2 of n-hexane (Carlo Erba, Milan) was used to extract the esters, the upper solutions were combined, washed with aqueous potassium bicarbonate (2%) (Merck, Darmstadt), filtered over anhydrous sodium sulfate (Merck, Darmstadt, Germany) and dried under reduced pressure at 30 °C.

4.5. GC–MS Determination of Fatty Acids (FAs) Content

To describe the FAs content, the same apparatus reported above (Section 4.3) was used. The GC operative conditions to analyze the transesterified extract were as follows: the injector was set to 280 °C, and the oven temperature was programmed from 170 °C at a rate of 3 °C/min to 260 °C for 15 min. 2 µL of the extract was injected into the column in splitless mode. The identification and quantification of the components were performed as previously described. Analyses were carried out in triplicate.

4.6. GC–MS Analysis of Methanolic Extract (after Derivatization)

To describe the chemical content of methanolic extract, approximately 1 mg was added of 300 µL of pyridine and 100 µL of bis-(trimethylsilyl) trifluoroacetamide (BSTFA) with heating at 80 °C for 50 min. 1 μL of the silylated sample was manually injected at 280 °C into the GC injector in splitless mode [45]. The analysis was performed using the same apparatus, GC-FID/GC–MS. The oven temperature program was as follows: 70 °C then a gradient of 6 °C/min to 170 °C, a gradient of 7 °C/min to 250 °C, and a gradient of 8 °C/min to 300 for 15 min. The compound identification was based on the percentage of similarity plus comparison of mass spectra (MS) using the software NIST02 (Gaithersburg, MD, USA) data library. Relative percentages for quantification of the components were calculated by electronic integration of the GC-FID peak areas with respect to the percent total of ion chromatograms (TIC%). Analyses were carried out in duplicate.

4.7. PTR-ToF-MS Analysis of Dried Leaves

The volatile profile of the dried hop leaves was performed using, for the first time, a PTR TOF 8000 model (Ionicon Analytik GmbH Innsbruck, Innsbruck, Austria). The ion H3O+ was used as a reagent ion for the proton transfer reaction. The use of a PTR-TOF-MS allows the simultaneous detection of a wide range of VOC with a high mass power [46]. The sample preparation and experimental set-up procedure was followed as previously conducted by Masi et al. [15] on Mentha spicata dried leaves.
Subsequently, the weighed samples (five grams of chopped dried leaves) were transferred into a glass jar (1/3 L) and incubated for 60 s. The headspace was sampled at a fixed flow rate of 50 sccm for 3 min. Five replicates of dried leaf hops were analyzed, and between the measurements, the PTR inlet line was flushed with clean air to avoid the memory effect. The experiment was led using the following drift tube parameters: voltage 594 V, temperature 110 °C, extraction voltage at the end of the drift tube (Udx) 35 V, and the acquisition was set to 1 mass spectrum per second. Mass spectral data were collected each second over a mass range between 20 and 220 m/z using a ratio E/N = 140. In order to have high mass accuracy and easily determine the chemical formula of each peak detected, the internal calibration was performed off-line, using together with known low mass ions (NO+ peak m/z = 29.997 and C3H7O+ peak m/z = 59.049) a known compound with high mass ions as the carvone (C10H15O+ peak m/z= 151.075). Then, once the chemical formula was identified, each signal detected was tentatively assigned to a specific compound based on the results previously obtained by the same tool or by GC–MS analysis and of the available literature on the volatile compounds emitted from hop leaf products. Lastly, raw data acquisition and processing were conducted using TofDaq software (20th Tofwerk AG, Thun, Switzerland) and the methodology used is reported by Taiti et al. [47].

4.8. NMR Analysis

For the untargeted NMR analysis, two types of extraction protocols were performed on the dried hop leaves: the Bligh–Dyer extraction and a methanol extraction.
The first one is a useful extraction method for the isolation of most polar metabolites, obtaining a clean extract free from traces of organic compounds. This extraction was performed according to previous literature articles [48,49,50]. In brief, 0.100 g of the dried hop leaves were sequentially added with 0.8 mL of Millipore grade water and 3 mL of methanol/chloroform (2:1% v/v). The extraction was performed through a sonication step at room temperature for 10 min. Then, the extract was sequentially added with 1 mL of chloroform and 1 mL of Millipore grade water to obtain the biphasic system methanol/chloroform/water (2:2:1.8% v/v/v). Finally, the upper hydroalcoholic phase was collected, and the residue pellet was extracted again. The obtained extract was dried under N2 flow and prepared for the NMR analysis. The dried hydroalcoholic phases were solubilized in a solution of 20 mM phosphate buffer/D2O containing 0.4 mM 3-(trimethylsilyl)-propionic-2,2,3,3-d4 acid sodium salt (TSPA) and EDTA-d16, and 0.7 mL was transferred in a 5 mm NMR tube.
Regarding the methanolic extraction, the used protocol is an already established method for hops bitter acids and xanthohumol extraction [30]. In detail, 0.100 g of dried leaves were extracted with 1 mL of MeOD with 10 min of sonication at room temperature. The TSPA internal standard was added to achieve a 1 mM concentration in each extract and directly analyzed by NMR.
Both the extraction methods were performed in triplicate and analyzed with a JNM-ECZ 600R (JEOL Ltd., Tokyo, Japan) spectrometer operating at the proton frequency of 600.17 MHz equipped with an autosampler.
The parameters used for the hydroalcoholic fraction analysis were the following: 90° pulse angle of 9.26 μs, 128 transients, 4 pre-scans, 65 K data points, and a presaturation pulse sequence to suppress the water signal. Regarding the methanol extract, a double suppression at 4.83 ppm and 3.28 ppm was performed. The other experimental parameters were a 90° pulse angle of 9.0 μs, 128 transients, 4 pre-scans, and 65 K data points.
2D NMR experiments, namely 1H-1H TOCSY and 1H-13C HMBC for the hydroalcoholic extract and 1H-13C HSQC for the methanolic one were performed using previously reported experimental parameters [51]. All the NMR spectra were processed using the JEOL Delta v5.3.1. software (JEOL Ltd., Tokyo, Japan). The 1H NMR spectra were Fourier transformed, manually phased, and automatically base corrected. Both types of spectra were referenced to the internal standard TSPA set at 0.00 ppm.
The metabolites identification was based on literature NMR data on other plant matrices and hop parts [18,52,53], 2D experiments, and standard additions. Signals of the identified metabolites and the internal standard in the hydroalcoholic and methanolic extracts were manually integrated for all the samples. In order to realize an absolute quantification, the area of each signal was referred to as the area of the TSP methyl group, the internal standard with a known concentration of 0.4 mM, taking into account the number of protons (Supplementary Material). The final quantitative results were expressed as mg/100 g of DW ± SD.

4.9. Statistical Analysis

Statistical analyses were performed with GraphPad Prism 6.1 software. The experiments were replicated three times unless otherwise indicated, and the data were expressed as the average ± standard deviation (SD).

5. Conclusions

Until recently, hop leaves, considered waste material, were less scientifically considered than the cones or the female inflorescences. In our study, with the aim of obtaining compositional information on the dried leaves of the Chinook cultivar, a metabolomic approach was carried out. The findings showed a considerable and diversified content of secondary metabolites, many of which are already known for their bioactive potential.
A deeper knowledge of the metabolome, in the context of a circular economy, is useful for understanding how to better exploit this matrix that has so far been underused in various sectors such as industrial, agricultural, or food. Therefore, this information is fundamental to hypothesize the use of the hop leaves as raw material and for contributing to the enhancement of the cultivation of the hop plants thanks to the multiplicity of uses of its products. In conclusion, this study highlights the usefulness of combining different analytical techniques to fully investigate the metabolomic profile of any useful part of the plant.

Supplementary Materials

The following supporting information can be downloaded at: https://www.mdpi.com/article/10.3390/ijms241813732/s1.

Author Contributions

Conceptualization, S.G.; methodology, C.T., G.D.M., M.S., V.V. and S.G.; validation, C.T., G.D.M., M.S., V.V. and S.G.; formal analysis, C.T., G.D.M., M.S. and S.G.; investigation, C.T., G.D.M., M.S., V.V. and S.G.; resources, S.G.; data curation, C.T. and S.G.; writing—original draft preparation, C.T., G.D.M. and S.G.; writing—review and editing, C.T. and S.G.; supervision, E.M., L.M. and S.G.; project administration, S.G.; funding acquisition, E.M., L.M. and S.G. All authors have read and agreed to the published version of the manuscript.

Funding

This research received no external funding.

Institutional Review Board Statement

Not applicable.

Informed Consent Statement

Not applicable.

Data Availability Statement

All generated data are included in this article.

Acknowledgments

The authors are grateful to the Vocino family farm, Italy for providing hop material (Chinook leaves).

Conflicts of Interest

The authors declare no conflict of interest.

References

  1. Astray, G.; Gullón, P.; Gullón, B.; Munekata, P.E.; Lorenzo, J.M. Humulus lupulus L. as a natural source of functional biomolecules. Appl. Sci. 2020, 10, 5074. [Google Scholar] [CrossRef]
  2. De Keukeleire, J.; Janssens, I.; Heyerick, A.; Ghekiere, G.; Cambie, J.; Roldàn-Ruiz, I.; Van Bockstaele, A.; De Keukeleire, D. Revelance of organic farming effect of climatological conditions on the formation of α-acids, β-acids, desmethylxanthohumol, and xanthohumol in hop (Humulus lupulus L.). J. Agric. Food Chem. 2007, 55, 61–66. [Google Scholar] [CrossRef] [PubMed]
  3. Kishimoto, T.; Kobayashi, M.; Yako, N.; Iida, A.; Wanikawa, A. Comparison of 4-mercapto-4-methylpentan-2-one contents in hop cultivars from different growing regions. J. Agric. Food Chem. 2008, 56, 1051–1057. [Google Scholar] [CrossRef]
  4. Kowalska, G.; Bouchentouf, S.; Kowalski, R.; Wyrostek, J.; Pankiewicz, U.; Mazurek, A.; Sujka, M.; Włodarczyk-Stasiak, M. The hop cones (Humulus lupulus L.): Chemical composition, antioxidant properties and molecular docking simulations. J. Herb Med. 2022, 33, 100566. [Google Scholar] [CrossRef]
  5. Rutto, L.K.; Temu, V.W.; Ferreira, G.; Kering, M.K. Nutritive value and in vitro digestibility of non-cone hop (Humulus lupulus L.) biomass. J. Anim. Plant Sci. 2020, 30, 794–802. [Google Scholar]
  6. Iglesias, A.; Martinez, P.G.; Ramirez, C.; Mitton, G.; Arcerito, F.M.; Fangio, M.F.; Churio, M.S.; Fuselli, S.; Fanovich, A.; Eguaras, M.; et al. Valorization of hop leaves for development of eco-friendly bee pesticides. Apidologie 2021, 52, 186–198. [Google Scholar] [CrossRef]
  7. Karabín, M.; Hudcová, T.; Jelínek, L.; Dostálek, P. Biologically active compounds from hops and prospects for their use. Compr. Rev. Food Sci. Food Saf. 2016, 15, 542–567. [Google Scholar] [CrossRef]
  8. Dostálek, P.; Karabín, M.; Jelínek, L. Hop phytochemicals and their potential role in metabolic syndrome prevention and therapy. Molecules 2017, 22, 1761. [Google Scholar] [CrossRef]
  9. Jiang, W.; Zhao, S.; Xu, L.; Lu, Y.; Lu, Z.; Chen, C.; Ni, J.; Wan, R.; Yang, L. The inhibitory effects of xanthohumol, a prenylated chalcone derived from hops, on cell growth and tumorigenesis in human pancreatic cancer. Biomed. Pharmacother. 2015, 73, 40–47. [Google Scholar] [CrossRef]
  10. Jiang, C.H.; Sun, T.L.; Xiang, D.X.; Wei, S.S.; Li, W.Q. Anti-cancer activity and mechanism of xanthohumol: A prenylated flavonoid from hops (Humulus lupulus L.). Front. Pharmacol. 2018, 9, 530. [Google Scholar] [CrossRef]
  11. Dziedzinski, M.; Szczepaniak, O.; Telichowska, A.; Kobus-Cisowska, J. Antioxidant capacity and cholinesterase inhibiting properties of dietary infusions with Humulus lupulus. J. Elem. 2020, 25, 1913. [Google Scholar] [CrossRef]
  12. Morcol, T.B.; Matthews, P.D.; Kennelly, E.J. Differences in Leaf Chemistry and Glandular Trichome Density between Wild Southwestern American Hop (Humulus neomexicanus) and Commercial Hop Cultivars. J. Agric. Food Chem. 2021, 69, 7798–7814. [Google Scholar] [CrossRef] [PubMed]
  13. Macchioni, V.; Picchi, V.; Carbone, K. Hop Leaves as an Alternative Source of Health-Active Compounds: Effect of Genotype and Drying Conditions. Plants 2022, 11, 99. [Google Scholar] [CrossRef] [PubMed]
  14. Takoi, K. “Flavor hops” varieties and various flavor compounds contributing to their “varietal aromas”: A review. Tech. Quart. Master Brew. Assoc. Am. 2019, 56, 113–123. [Google Scholar]
  15. Masi, E.; Caparrotta, S.; Taiti, C.; Ieri, F.; Fiume, P.; Moselhy, N.; Mancuso, S.; Romani, A. Characterization of volatile compounds in Mentha spicata L. dried leaves. Adv. Hortic. Sci. 2017, 31, 89–96. [Google Scholar]
  16. Stanius, Ž.; Dudenas, M.; Kaškoniene, V.; Stankevicius, M.; Skrzydlewska, E.; Drevinskas, T.; Ragažinskiene, O.; Obelevicius, K.; Maruška, A. Analysis of the Leaves and Cones of Lithuanian Hop (Humulus lupulus L.) Varieties by Chromatographic and Spectrophotometric Methods. Molecules 2022, 27, 2705. [Google Scholar] [CrossRef]
  17. Vivaldo, G.; Masi, E.; Taiti, C.; Caldarelli, G.; Mancuso, S. The network of plants volatile organic compounds. Sci Rep. 2017, 7, 11050. [Google Scholar] [CrossRef] [PubMed]
  18. Nesvadba, V.; Olšovská, J.; Straková, L.; Charvátová, J.; Fritschová, G. Evaluation of yield and alpha acid content in selected hop varieties. Kvasny Prumysl 2022, 68, 637–641. [Google Scholar] [CrossRef]
  19. Farang, M.A.; Porzel, A.; Schmidt, J.; Wessjohann, L.A. Metabolite profiling and fingerprinting of commercial cultivars of Humulus lupulus L. (hop): A comparison of MS and NMR methods in metabolomics. Metabolomics 2012, 8, 492–507. [Google Scholar]
  20. Protsenko, L.; Ryzhuk, S.; Liashenko, M.; Shevchenko, O.; Litvynchuk, S.; Yanse, L.; Milosta, H. Influence of alpha acids hop homologues of bitter and aromatic varieties on beer quality. Food Technology. Ukr. Food J. 2020, 9, 425–436. [Google Scholar] [CrossRef]
  21. Leker, J.; Maye, J.P. Discovery of Acetohumulone and Acetolupulone a New Hop Alpha Acid and Beta Acid. J Am Soc Brew Chem 2023, 81, 276–281. [Google Scholar] [CrossRef]
  22. Rutnik, K.; Ocvirk, M.; Košir, I.J. The Stability of Hop (Humulus lupulus L.) Resins during Long-Period Storage. Plants 2023, 12, 936. [Google Scholar] [CrossRef] [PubMed]
  23. Lela, L.; Ponticelli, M.; Caddeo, C.; Vassallo, A.; Ostuni, A.; Sinisgalli, C.; Faraone, I.; Santoro, V.; De Tommasi, N.; Milella, L. Nanotechnological exploitation of the antioxidant potential of Humulus lupulus L. extract. Food Chem. 2022, 393, 133401. [Google Scholar] [CrossRef] [PubMed]
  24. Vitalini, S.; Di Martile, M.; Cicaloni, V.; Iannone, M.; Salvini, L.; Del Bufalo, D.; Iriti, M.; Garzoli, S. Volatile and Non-Volatile Content Determination and Biological Activity Evaluation of Fresh Humulus lupulus L. (cv. Chinook) Leaves and Inflorescences. Separations 2023, 10, 91. [Google Scholar] [CrossRef]
  25. Morcol, T.B.; Negrin, A.; Matthews, P.D.; Kennelly, E.J. Hop (Humulus lupulus L.) terroir has large effect on a glycosylated green leaf volatile but not on other aroma glycosides. Food Chem. 2020, 321, 126644. [Google Scholar] [CrossRef]
  26. Li, J.; Li, N.; Li, X.; Chen, G.; Wang, C.; Lin, B.; Hou, Y. Characteristic α-Acid Derivatives from Humulus lupulus with Antineuroinflammatory Activities. J. Nat. Prod. 2017, 80, 3081–3092. [Google Scholar] [CrossRef]
  27. Killeen, D.P.; Watkins, O.C.; Sansom, C.E.; Andersen, D.H.; Gordon, K.C.; Perry, N.B. Fast Sampling, Analyses and Chemometrics for Plant Breeding: Bitter Acids, Xanthohumol and Terpenes in Lupulin Glands of Hops (Humulus lupulus). Phytochem. Anal. 2017, 28, 50–57. [Google Scholar] [CrossRef]
  28. Höltzel, G.A.; Schlotterbeck, K.; Bayer, A.E. Separation and characterisation of hop bitter acids by HPLC-1H NMR coupling. Chromatographia 1996, 42, 499–505. [Google Scholar] [CrossRef]
  29. Carbone, K.; Macchioni, V.; Petrella, G.; Daniel Oscar Cicero, D.O. Exploring the potential of microwaves and ultrasounds in the green extraction of bioactive compounds from Humulus lupulus for the food and pharmaceutical industry. Ind. Crops Prod. 2020, 156, 112888. [Google Scholar] [CrossRef]
  30. Jacquin, J.; Moureu, S.; Deweer, C.; Hakem, A.; Paguet, A.-S.; Bonneau, N.; Bordage, S.; Dermont, C.; Sahpaz, S.; Muchembled, J.; et al. Hop (Humulus lupulus L.) Specialized Metabolites: Extraction, Purification, Characterization in Different Plant Parts and In Vitro Evaluation of Anti-Oomycete Activities against Phytophthora infestans. Agronomy 2022, 12, 2826. [Google Scholar] [CrossRef]
  31. De Keukeleire, J.; Ooms, G.; Heyerick, A.; Roldan-Ruiz, I.; Van Bockstaele, E.; De Keukeleire, D. Formation and Accumulation of α-Acids, β-Acids, Desmethylxanthohumol, and Xanthohumol during Flowering of Hops (Humulus lupulus L.). J. Agric. Food Chem. 2003, 51, 4436–4441. [Google Scholar]
  32. Francomano, F.; Caruso, A.; Barbarossa, A.; Fazio, A.; La Torre, C.; Ceramella, J.; Mallamaci, R.; Saturnino, C.; Iacopetta, D.; Sinicropi, M.S. β-Caryophyllene: A Sesquiterpene with Countless Biological Properties. Appl. Sci. 2019, 9, 5420. [Google Scholar] [CrossRef]
  33. de Lacerda Leite, G.M.; de Oliveira Barbosa, M.; Pereira Lopes, M.J.; de Araújo Delmondes, G.; Bezerra, D.S.; Moura Araújo, I.; de Alencar, C.D.C.; Douglas Melo Coutinho, H. Pharmacological and toxicological activities of α-humulene and its isomers: A systematic review. Trends Food Sci. Technol. 2021, 115, 255–274. [Google Scholar]
  34. Calder, P.C. Functional Roles of Fatty Acids and Their Effects on Human Health. JPEN J. Parenter. Enter. Nutr. 2015, 39, 18S–32S. [Google Scholar] [CrossRef] [PubMed]
  35. Yuan, Q.; Xie, F.; Huang, W.; Hu, M.; Yan, O.; Chen, Z.; Zheng, Y.; Liu, L. The review of alpha-linolenic acid: Sources, metabolism, and pharmacology. Phytother Res. 2022, 36, 164–188. [Google Scholar] [CrossRef] [PubMed]
  36. Huang, C.B.; Altimova, Y.; Myers, T.M.; Ebersole, J.L. Short- and medium-chain fatty acids exhibit antimicrobial activity for oral microorganisms. Arch. Oral Biol. 2011, 56, 650–654. [Google Scholar]
  37. Carta, G.; Murru, E.; Banni, S.; Manca, C. Palmitic Acid: Physiological Role, Metabolism and Nutritional Implications. Front. Physiol. 2017, 8, 902. [Google Scholar] [CrossRef]
  38. Nowak, M.G.; Skwarecki, A.S.; Milewska, M.J. Amino Acid Based Antimicrobial Agents–Synthesis and Properties. ChemMedChem 2021, 16, 3513–3544. [Google Scholar]
  39. Smeekens, S.; Hellmann, H.A. Sugar sensing and signaling in plants. Front. Plant Sci. 2014, 5, 113. [Google Scholar] [CrossRef] [PubMed]
  40. Sánchez-Hidalgo, M.; León-González, A.J.; Gálvez-Peralta, M.; González-Mauraza, N.H.; Martin-Cordero, C. D-Pinitol: A cyclitol with versatile biological and pharmacological activities. Phytochem. Rev. 2021, 20, 211–224. [Google Scholar]
  41. Liu, M.; Hansen, P.E.; Wang, G.; Qiu, L.; Dong, J.; Yin, H.; Qian, Z.; Yang, M.; Miao, J. Pharmacological profile of xanthohumol, a prenylated flavonoid from hops (Humulus lupulus). Molecules 2015, 20, 754–779. [Google Scholar] [CrossRef] [PubMed]
  42. Nezi, P.; Cicaloni, V.; Tinti, L.; Salvini, L.; Iannone, M.; Vitalini, S.; Garzoli, S. Metabolomic and Proteomic Profile of Dried Hop Inflorescences (Humulus lupulus L. cv. Chinook and cv. Cascade) by SPME-GC-MS and UPLC-MS-MS. Separations 2022, 9, 204. [Google Scholar] [CrossRef]
  43. Iannone, M.; Ovidi, E.; Vitalini, S.; Laghezza Masci, V.; Marianelli, A.; Iriti, M.; Tiezzi, A.; Garzoli, S. From Hops to Craft Beers: Production Process, VOCs Profile Characterization, Total Polyphenol and Flavonoid Content Determination and Antioxidant Activity Evaluation. Processes 2022, 10, 517. [Google Scholar] [CrossRef]
  44. Christie, W.; Han, X. Lipid Analysis-Isolation, Separation, Identification and Lipidomic Analysis; Woodhead Publishing: Bridgwater, UK, 2010; pp. 146–147. [Google Scholar]
  45. Garzoli, S.; Maggio, F.; Vinciguerra, V.; Rossi, C.; Donadu, M.G.; Serio, A. Chemical Characterization and Antimicrobial Properties of the Hydroalcoholic Solution of Echinacea purpurea (L.) Moench. and Propolis from Northern Italy. Molecules 2023, 28, 1380. [Google Scholar] [CrossRef] [PubMed]
  46. Blake, R.S.; Monks, P.S.; Ellis, A.M. Proton-transfer reaction mass spectrometry. Chem. Rev. 2009, 109, 861–896. [Google Scholar] [PubMed]
  47. Taiti, C.; Masi, E.; Cicaloni, V.; Vinciguerra, V.; Salvini, L.; Garzoli, S. SPME-GC-MS and PTR-ToF-MS Techniques for the Profiling of the Metabolomic Pattern of VOCs and GC-MS for the Determination of the Cannabinoid Content of Three Cultivars of Cannabis sativa L. Pollen. Molecules 2022, 27, 8739. [Google Scholar] [CrossRef]
  48. Bligh, E.G.; Dyer, W.J. A Rapid Method of Total Lipid Extraction And Purification. Can. J. Biochem. Physiol. 1959, 911–917. [Google Scholar] [CrossRef]
  49. Di Matteo, G.; Di Matteo, P.; Sambucci, M.; Tirillò, J.; Giusti, A.M.; Vinci, G.; Gobbi, L.; Prencipe, S.A.; Salvo, A.; Ingallina, C.; et al. Commercial Bio-Packaging to Preserve the Quality and Extend the Shelf-Life of Vegetables: The Case-Study of Pumpkin Samples Studied by a Multimethodological Approach. Foods 2021, 10, 2440. [Google Scholar] [CrossRef]
  50. Fanelli, R.M. Changes in the Food-Related Behaviour of Italian Consumers during the COVID-19 Pandemic. Foods 2021, 10, 169. [Google Scholar] [CrossRef]
  51. Spano, M.; Di Matteo, G.; Fernandez Retamozo, C.A.; Lasalvia, A.; Ruggeri, M.; Sandri, G.; Cordeiro, C.; Sousa Silva, M.; Totaro Fila, C.; Garzoli, S.; et al. A Multimethodological Approach for the Chemical Characterization of Edible Insects: The Case Study of Acheta domesticus. Foods 2023, 12, 2331. [Google Scholar] [CrossRef]
  52. Spano, M.; Di Matteo, G.; Ingallina, C.; Botta, B.; Quaglio, D.; Ghirga, F.; Balducci, S.; Cammarone, S.; Campiglia, E.; Giusti, A.M.; et al. A Multimethodological Characterization of Cannabis sativa L. Inflorescences from Seven Dioecious Cultivars Grown in Italy: The Effect of Different Harvesting Stages. Molecules 2021, 26, 2912. [Google Scholar] [CrossRef] [PubMed]
  53. Sobolev, A.P.; Brosio, E.; Gianferri, R.; Segre, A.L. Metabolic profile of lettuce leaves by high-field NMR Spectra. Magn. Reson. Chem. 2005, 43, 625–638. [Google Scholar] [CrossRef] [PubMed]
Figure 1. Bar charts of the metabolites identified and quantified (mg/100 g of DW ± SD) in the 1H NMR spectra of hydroalcoholic extracts of hop leaves. (A) amino acids, (B) sugars, (C) organic acids, (D) miscellaneous metabolites.
Ijms 24 13732 g001
Table 1. Chemical volatile composition (percentage mean value ± standard deviation) of the dried hop leaves as determined by SPME/GC–MS.
COMPONENT 1LRI 2 LRI 3Chinook (%)
1isobutyric acid7627651.4 ± 0.04
2propionic acid9689720.7 ± 0.02
35-hepten-2-one, 6-methyl-9819861.9 ± 0.03
42-methylbutyl isobutyrate9869898.6 ± 0.03
5β-myrcene9889910.4 ± 0.02
6amyl isovalerate109010930.8 ± 0.02
7β-cyclocitral119211970.4 ± 0.01
8ylangene136813763.4 ± 0.02
9α-copaene1385139212.9 ± 0.05
10β-bourbonene139213900.5 ± 0.01
11β-caryophyllene1438144019.2 ± 0.09
12α-humulene1475147327.8 ± 0.11
14γ-muurolene148014867.6 ± 0.02
13β-eudesmene149014884.3 ± 0.03
15α-selinene149514931.8 ± 0.02
16γ-cadinene151015092.2 ± 0.02
17δ-cadinene15131505 §5.7 ± 0.03
18selina-3,7(11)-diene153515300.4 ± 0.01
SUM 100.0
Monoterpenes 0.4
Diterpenes 0.4
Sesquiterpenes 85.8
Others 13.4
1 The components are reported according to their elution order on apolar column (VF-1ms); 2 Linear Retention Indices measured on apolar column; 3 Linear Retention Indices from literature; § Normal alkane RI.
Table 2. Chemical composition (mass charge, chemical formula, tentative identification, average emission, standard deviation, percentage emission for each m/z detected) of H. lupulus dried leaves identified via PTR-ToF-MS. Data were expressed as average of three replicates (±SD) and as % of the total.
N° of Compoundsm/zChemical Formula Tentative IdentificationAverage Samples EmissionStandard Deviation (SD)Emission (%)
127.022C2H3+Acetylene21.822.603.03
231.018CH3O+Formaldehyde50.214.646.96
333.033CH5O+Methanol22.793.953.16
441.038C3H5+Alkylic fragment11.692.161.62
543.018C2H3O+Aldehyde fragment31.5310.184.37
643.054C3H7+General alkane/VOC fragment26.834.173.72
745.033C2H5O+Acetaldehyde229.1761.9831.79
847.013CH3O2+Formic acid/formates9.191.341.27
949.011CH5S+S Compound (methanethiol)1.450.210.20
1055.054C4H7+Fragment7.121.440.99
1157.069C4H9+Alcohol fragment3.580.780.50
1259.049C3H7O+Propanal, Acetone236.9752.3232.87
1361.028C2H5O2+Acetates21.723.613.01
1469.069C5H9+Isoprene/Cycloalkane fragment5.871.390.81
1571.049C4H7O+Butenal1.70.410.24
1673.065C4H9O+Isobutanal/butanone/methylpropanal13.764.231.91
1783.086C6H11+C6 compounds (hexenal, hexenols)1.160.570.16
1885.065C5H9O+Methyl butenal2.270.530.31
1987.044C4H7O2+2,3-Butanedione; Butyrolactone1.060.310.15
2087.080C5H11O+Pentanal/3-methylbutanal11.873.281.65
2193.069C7H9+Terpene fragment2.280.370.32
22107.086C8H11+Terpene fragment1.691.060.23
23109.101C8H13+Terpene fragment2.100.550.29
24133.101C10H13+Terpene fragment1.50.340.21
25205.195C15H25+Sesquiterpenes like compounds 1.580.400.22
Total Terpene Emission (ppbv)9.142.191.26
Total VOCs Emission (ppbv)720.90152.55100.00
Table 3. FAs content (percentage mean value ± standard deviation) of the transesterified extract, as determined by GC–MS.
COMPONENT 1LRI 2LRI 3(%)
1palmitoleic acid, C16:1n7 19302.9 ± 0.02
2palmitic acid, C16:0 197338.7 ± 0.03
3linoleic acid, C18:2n6 21305.9 ± 0.03
4linolenic acid, C18:3n3 214348.2 ± 0.12
5stearic acid, C18:0 21784.3 ± 0.03
SUM 100.0
Saturated FAs 43.0
Unsaturated FAs 57.0
1 The components are reported according to their elution order on apolar column (VF-1ms); 2 Linear Retention Indices measured on apolar column; 3 Linear Retention indices from literature.
Table 4. Chemical composition (percentage values) of dried leaves methanolic extract after derivatization, as determined by GC–MS.
COMPONENTS(%)
Sugars
1lyxosetr
2galactofuranosetr
3xylose0.3 ± 0.02
4sorbofuranose0.6 ± 0.02
5tagatofuranose2.6 ± 0.04
6glucose1.0 ± 0.03
7fructose0.2 ± 0.01
8glucopyranose1.9 ± 0.02
9allofuranose1.7 ± 0.02
10talofuranose1.8 ± 0.02
11turanose9.3 ± 0.08
12trehalose12.8 ± 0.15
13sucrose62.3 ± 1.25
Organic acids
14lactic acidtr
15oxalic acidtr
16succinic acidtr
17pyruvic acid0.1 ± 0.00
18malonic acidtr
Alcohols
19D-pinitol2.8 ± 0.04
20gycerol1.1 ± 0.03
21ribitoltr
22phytol0.1 ± 0.00
23myo-inositol0.3 ± 0.02
Fatty acids
24palmitic acid0.5 ± 0.02
25linolenic acid0.5 ± 0.02
tr: percentage mean values <0.1%.
Table 5. Metabolites identified in the 600.13 MHz 1H NMR, 1H-1H TOCSY, and 1H-13C HMBC spectra of Bligh–Dyer hydroalcoholic extracts of hop leaves in phosphate buffer/D2O acquired at 25 °C. Asterisks (*) indicate signals selected for integration.
CompoundAssignment1H (ppm)Multiplicity [J(Hz)]13C (ppm)
Sugars
β-D-FructofuranoseCH-34.12 *
CH-44.12 *
CH-53.82
β-D-FructopyranoseCH-33.81
CH-54.00
CH2-6,6′3.70
α-GlucoseCH-15.24 *
CH-23.52
CH-33.73
CH-43.40
CH-53.84
β-GlucoseCH-14.65 *
CH-23.26
CH-33.49
CH-43.40
SucroseCH-1 (glucose)5.42 *
CH-23.55
CH-33.76 73.5
CH-43.48
CH-53.84
CH-1 (fructose) 62.3
C-2 104.6
CH-34.22d (8.8)
CH-44.05 75.0
CH-53.90 82.4
CH2-6,6′3.81
Organic acids
Citric acidα,γ-CH2.57 *d (16.7)45.1
α′,γ′-CH2.72d (16.8)45.1
β-C 76.7
COOH-1 179.4
COOH-6 182.1
Formic acidHCOOH8.46 *s
Fumaric acidα,β-CH=CH6.53 *s
Malic acidα-CH4.32 *dd (9.5; 3.1)71.4
β-CH2.69dd (15.5; 3.1)43.7
β′-CH2.41dd (15.7; 9.6)43.7
COOH-1 181.2
COOH-4 180.6
Succinic acidα, β-CH22.41 *s35.2
COOH-1,4 183.3
Acetic acidα-CH31.92 *s
COOH 182.5
Amino acids
Alanineα-CH3.78 51.5
β-CH31.49 *,fd (7.2)
COOH 176.7
GABAα-CH22.30 *t (7.4)35.4
β-CH21.91q24.6
γ-CH23.02t (7.6)40.3
COOH 182.5
Glutamineα-CH3.75
β,β′-CH22.15m
γ-CH22.46m
Isoleucineα-CH 60.7
β-CH1.99 36.9
γ,γ′-CH21.26, 1.47 25.5
γ-CH31.02d (7.1)
δ-CH30.95 *t (7.4)
Leucineβ-CH2 40.8
γ-CH1.71 25.2
δ-CH30.97 *d (6.4)22.9
δ′-CH30.96 * d (6.0)22.5
Valineα-CH3.61 61.3
β-CH2.28 30.1
γ-CH31.00 *d (7.1)17.7
γ′-CH31.05d (6.9)19.0
Threonineα-CH3.59 61.4
β-CH4.25 66.9
γ-CH31.34 *d (6.5)
Asparagineα-CH4.02 52.3
β,β′-CH22.87 *; 2.96dd (7.8; 17.0); dd (4.3; 17.0)
COOH 175.2
Aspartateβ,β′-CH22.68; 2.82 *dd (8.8; 17.6); dd (3.8; 17.6)
Glutamateα-CH3.75
β,β′-CH22.06; 2.14 *m
γ-CH22.36m
Prolineα-CH4.17
β,β′-CH22.08; 2.35m, m
γ-CH22.02 *m
δ,δ′-CH23.43; 3.34
Miscellaneous
Choline+N(CH3)33.21 *s54.9
α-CH2 68.4
TrigonellineCH-19.13 *s
CH34.44s
Table 6. Metabolites identified in the 600.13 MHz 1H NMR and 1H-13C HSQC spectra of methanolic extracts of hop leaves in methanol-d4 acquired at 25 °C. Asterisks (*) indicate signals selected for integration.
CompoundAssignment1H (ppm)Multiplicity [J(Hz)]13C (ppm)
Polyphenols
XanthohumolCH2-1″3.21
OCH33.90s56.0
CH-5′6.02s
CH-3,56.84 (d, 8.6 Hz)
CH-2,67.49 *(d, 8.6 Hz)130.6
CH-α7.79(d, 15.5 Hz)
Disclaimer/Publisher’s Note: The statements, opinions and data contained in all publications are solely those of the individual author(s) and contributor(s) and not of MDPI and/or the editor(s). MDPI and/or the editor(s) disclaim responsibility for any injury to people or property resulting from any ideas, methods, instructions or products referred to in the content.

