
Optimization of Anthocyanin Production in Tobacco Cells

 , , , ,
Abstract
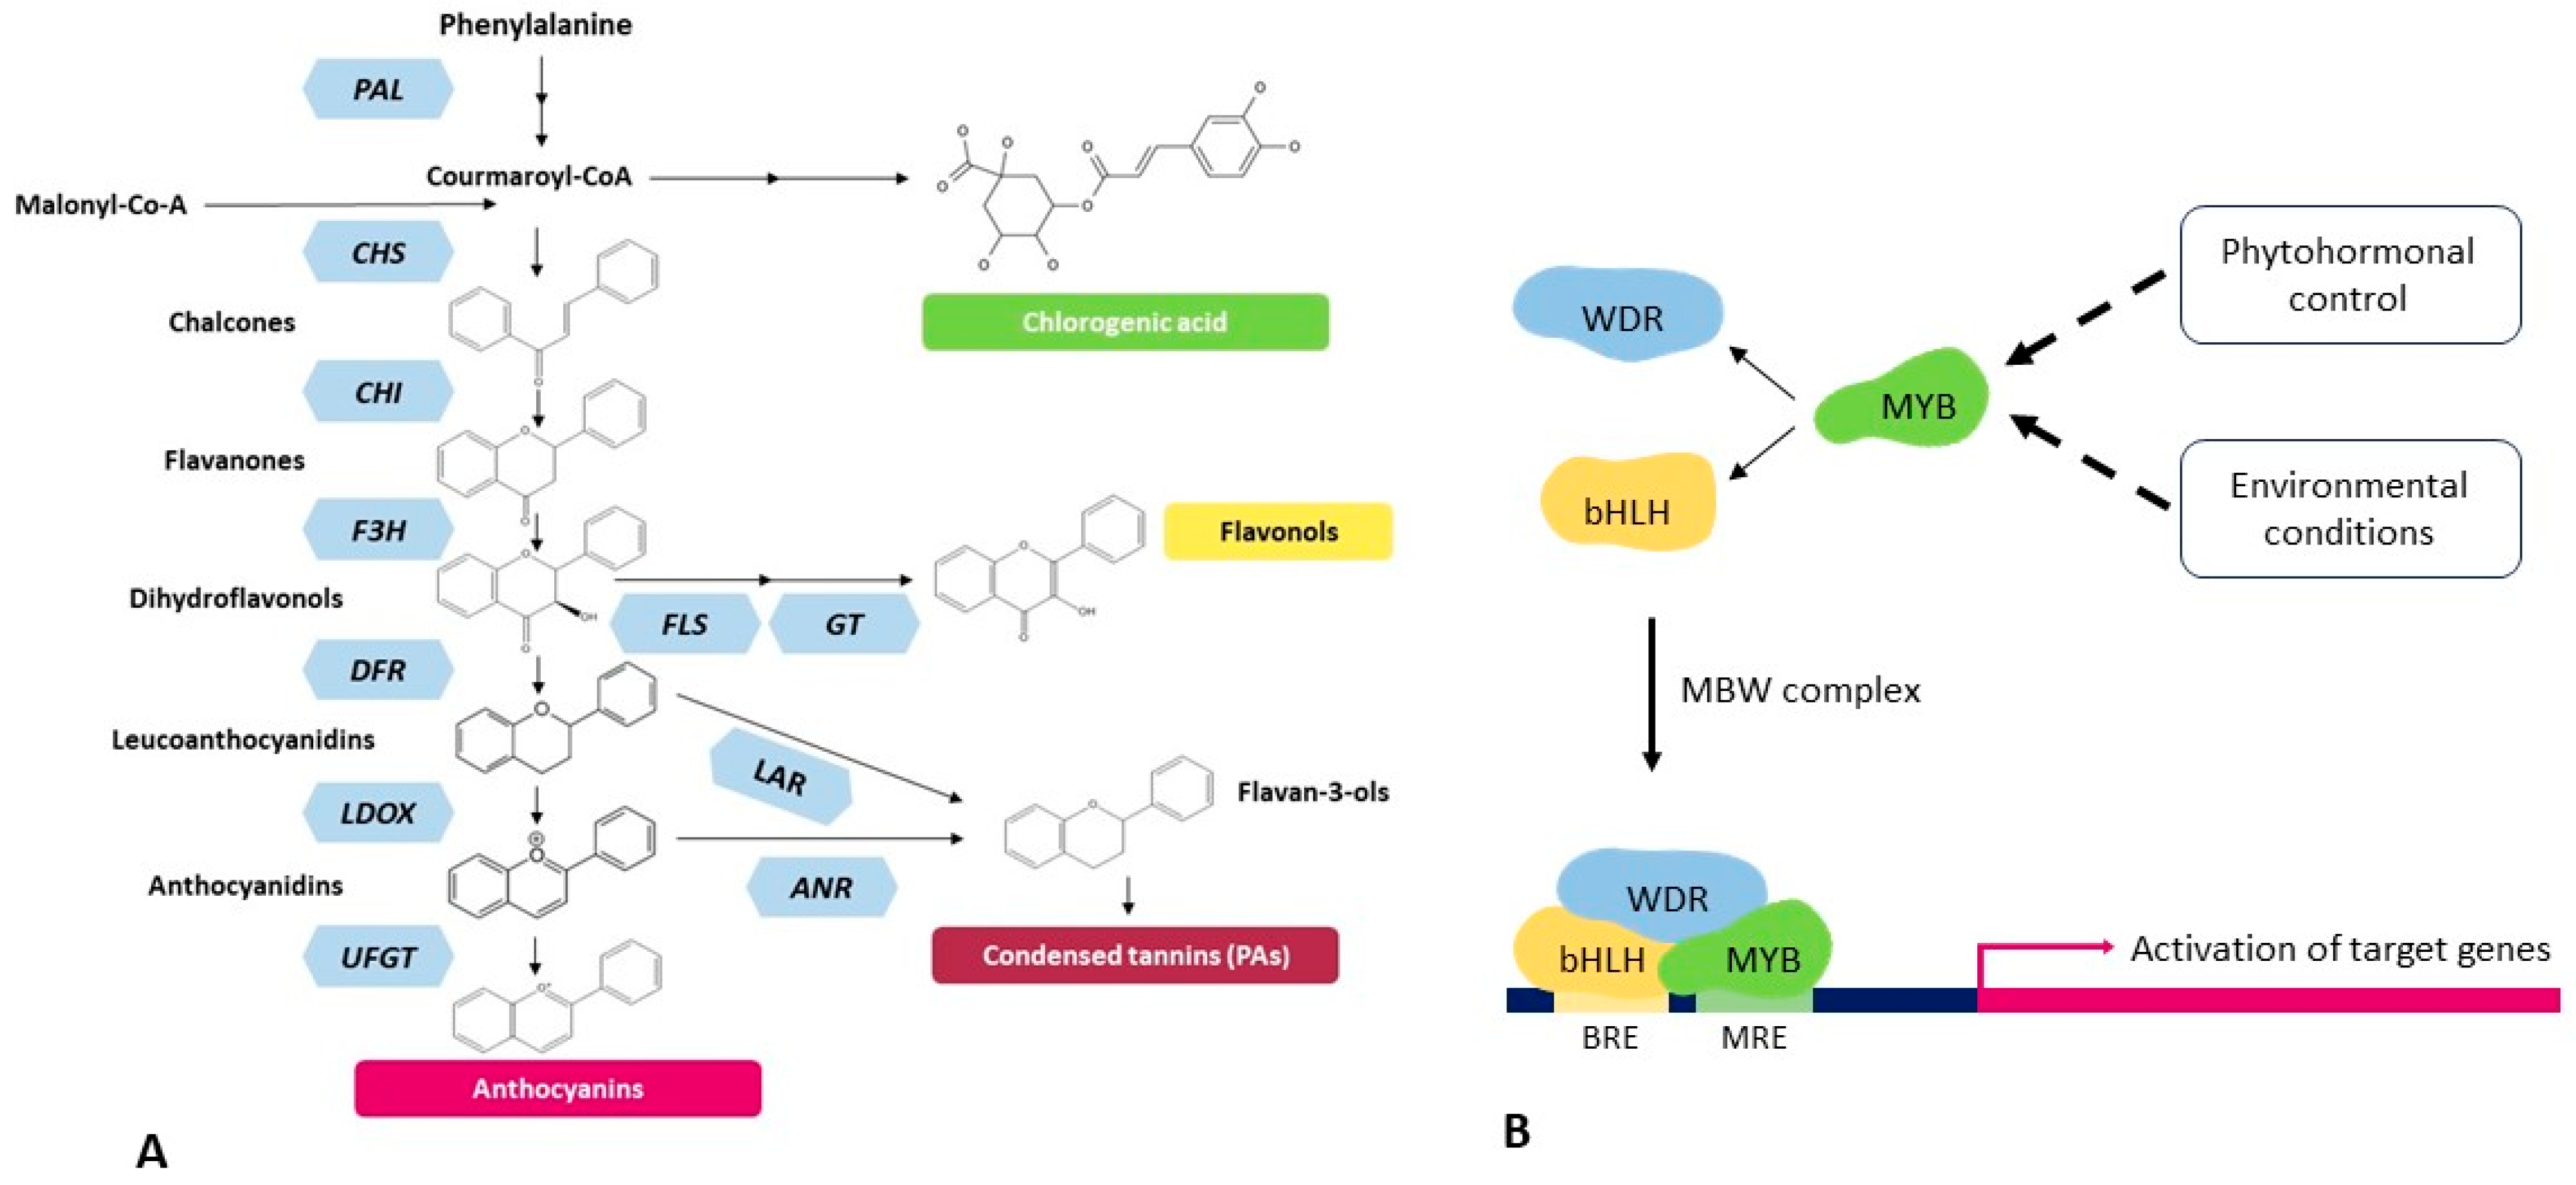
:1. Introduction
2. Results
2.1. Development of Tobacco M1-B3 Over-Expressing Cell Lines
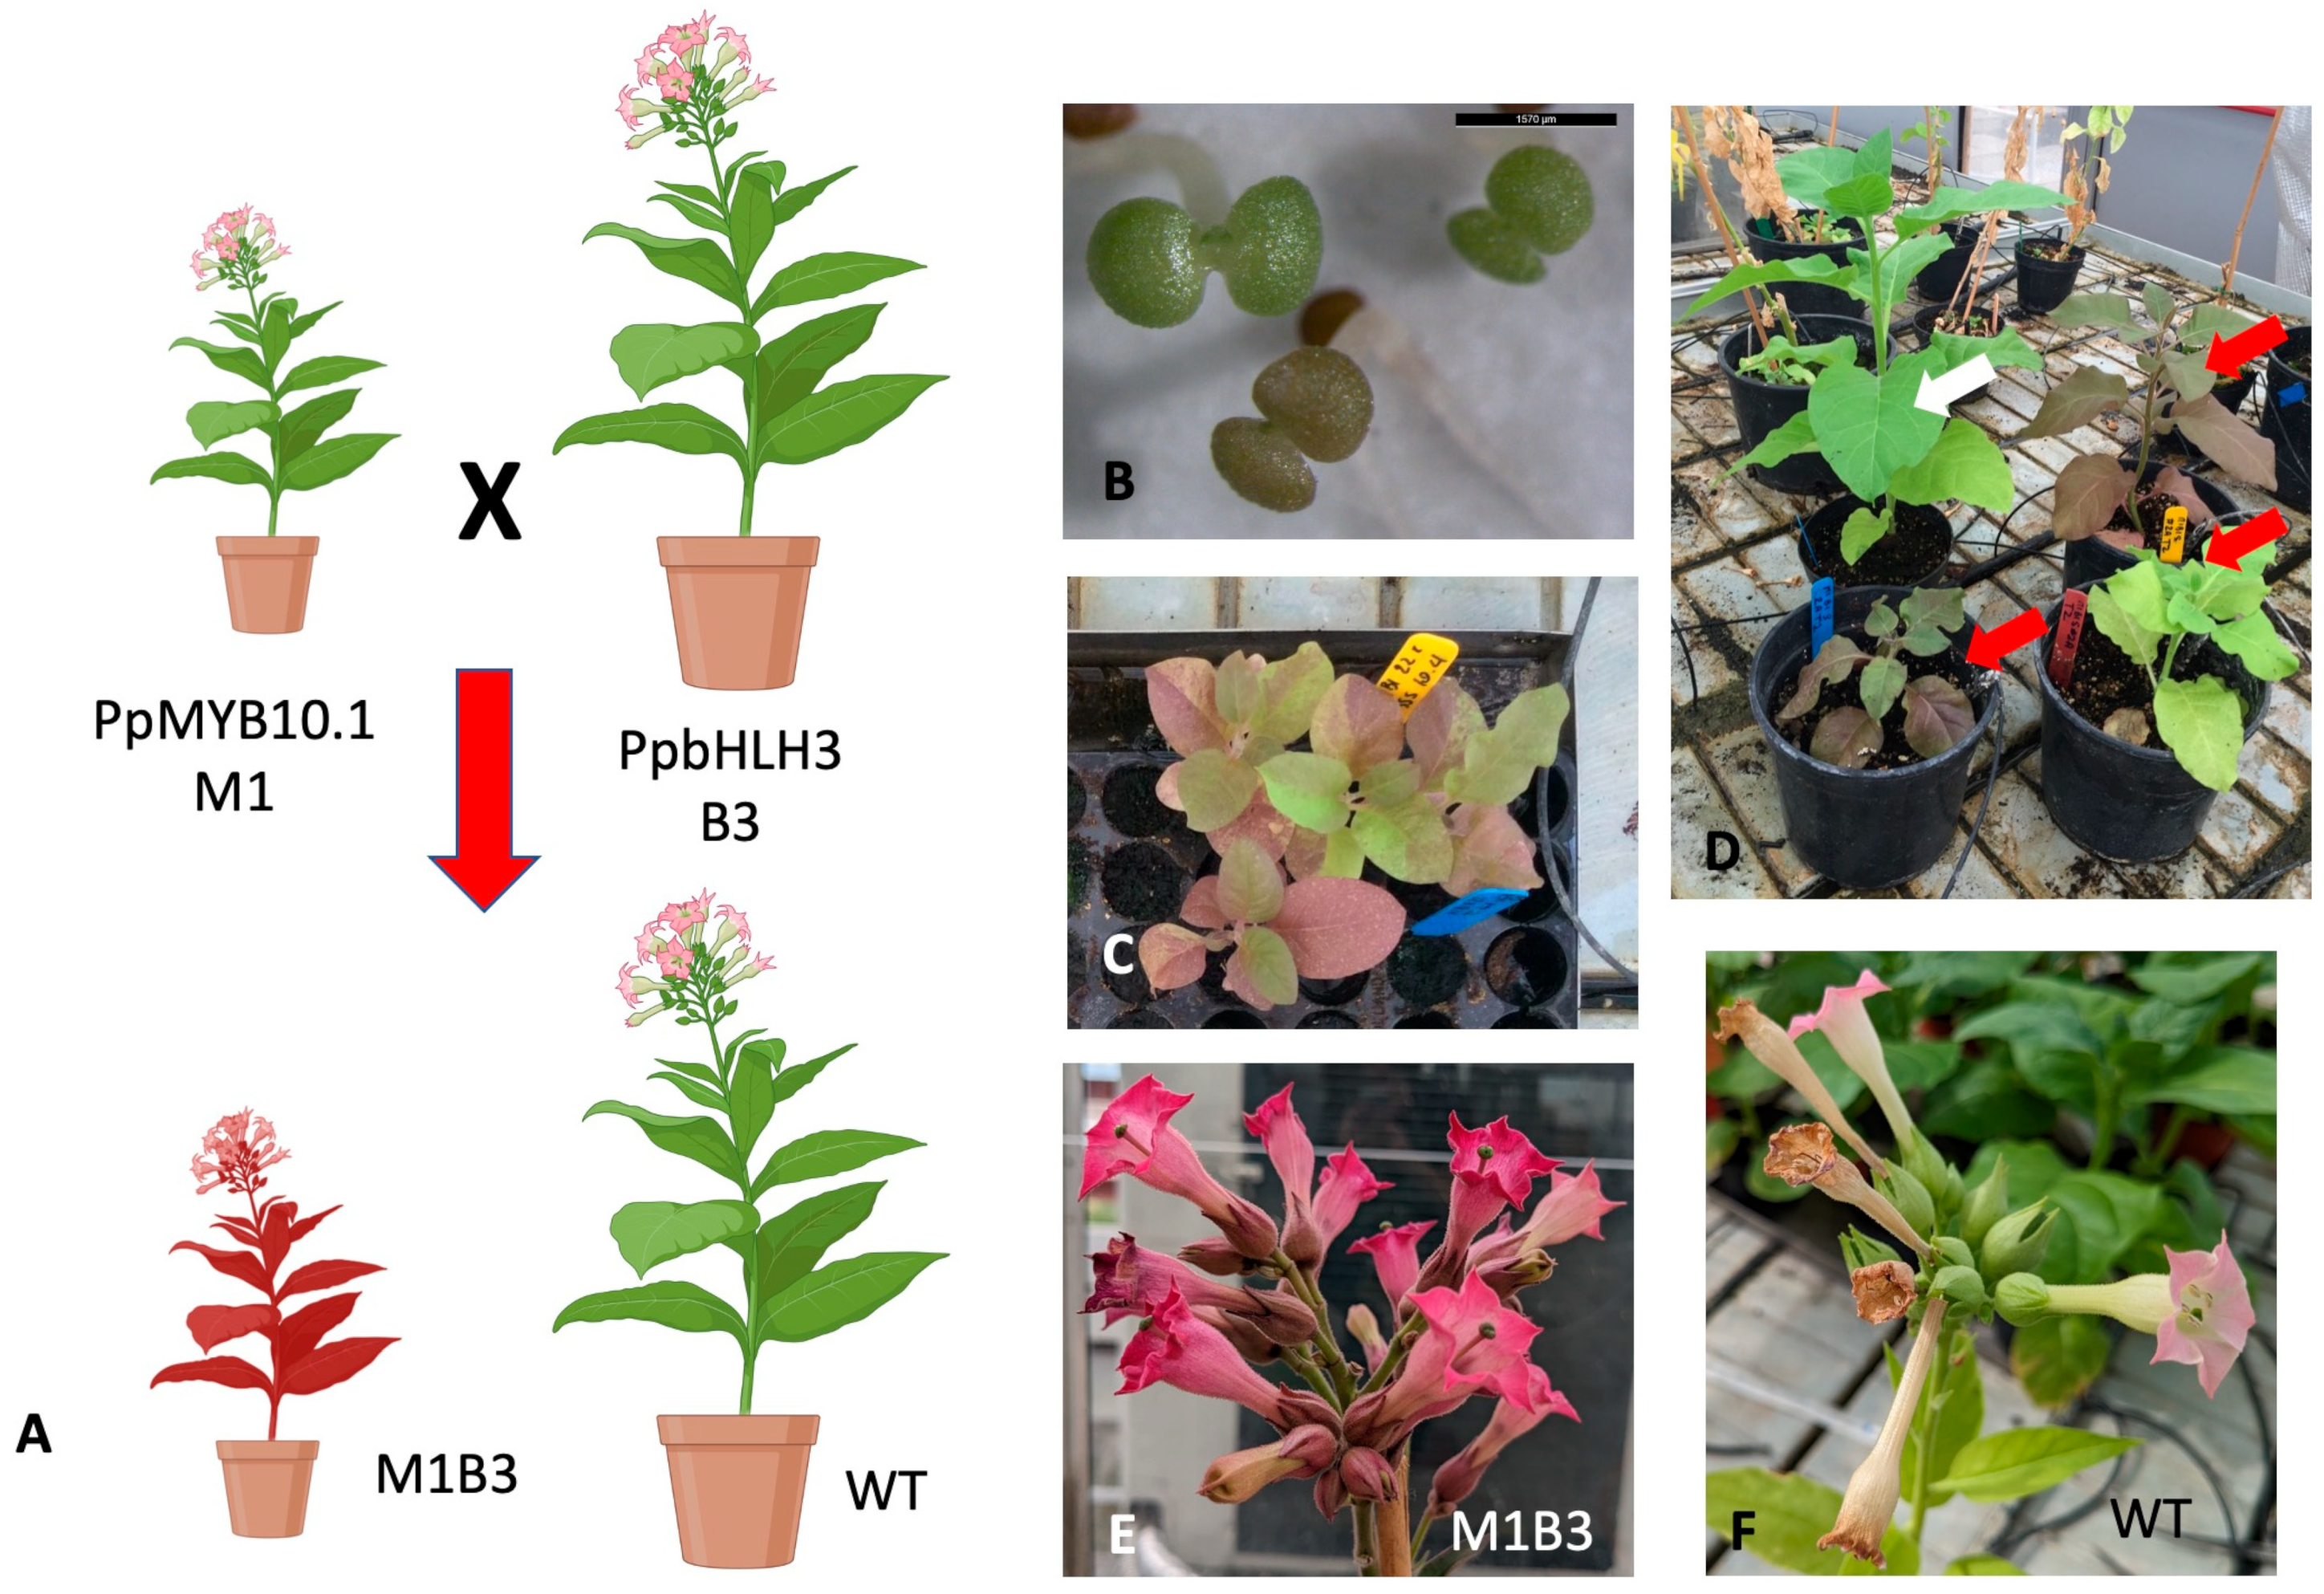
2.1.1. Development of Tobacco M1-B3 Plant Clones
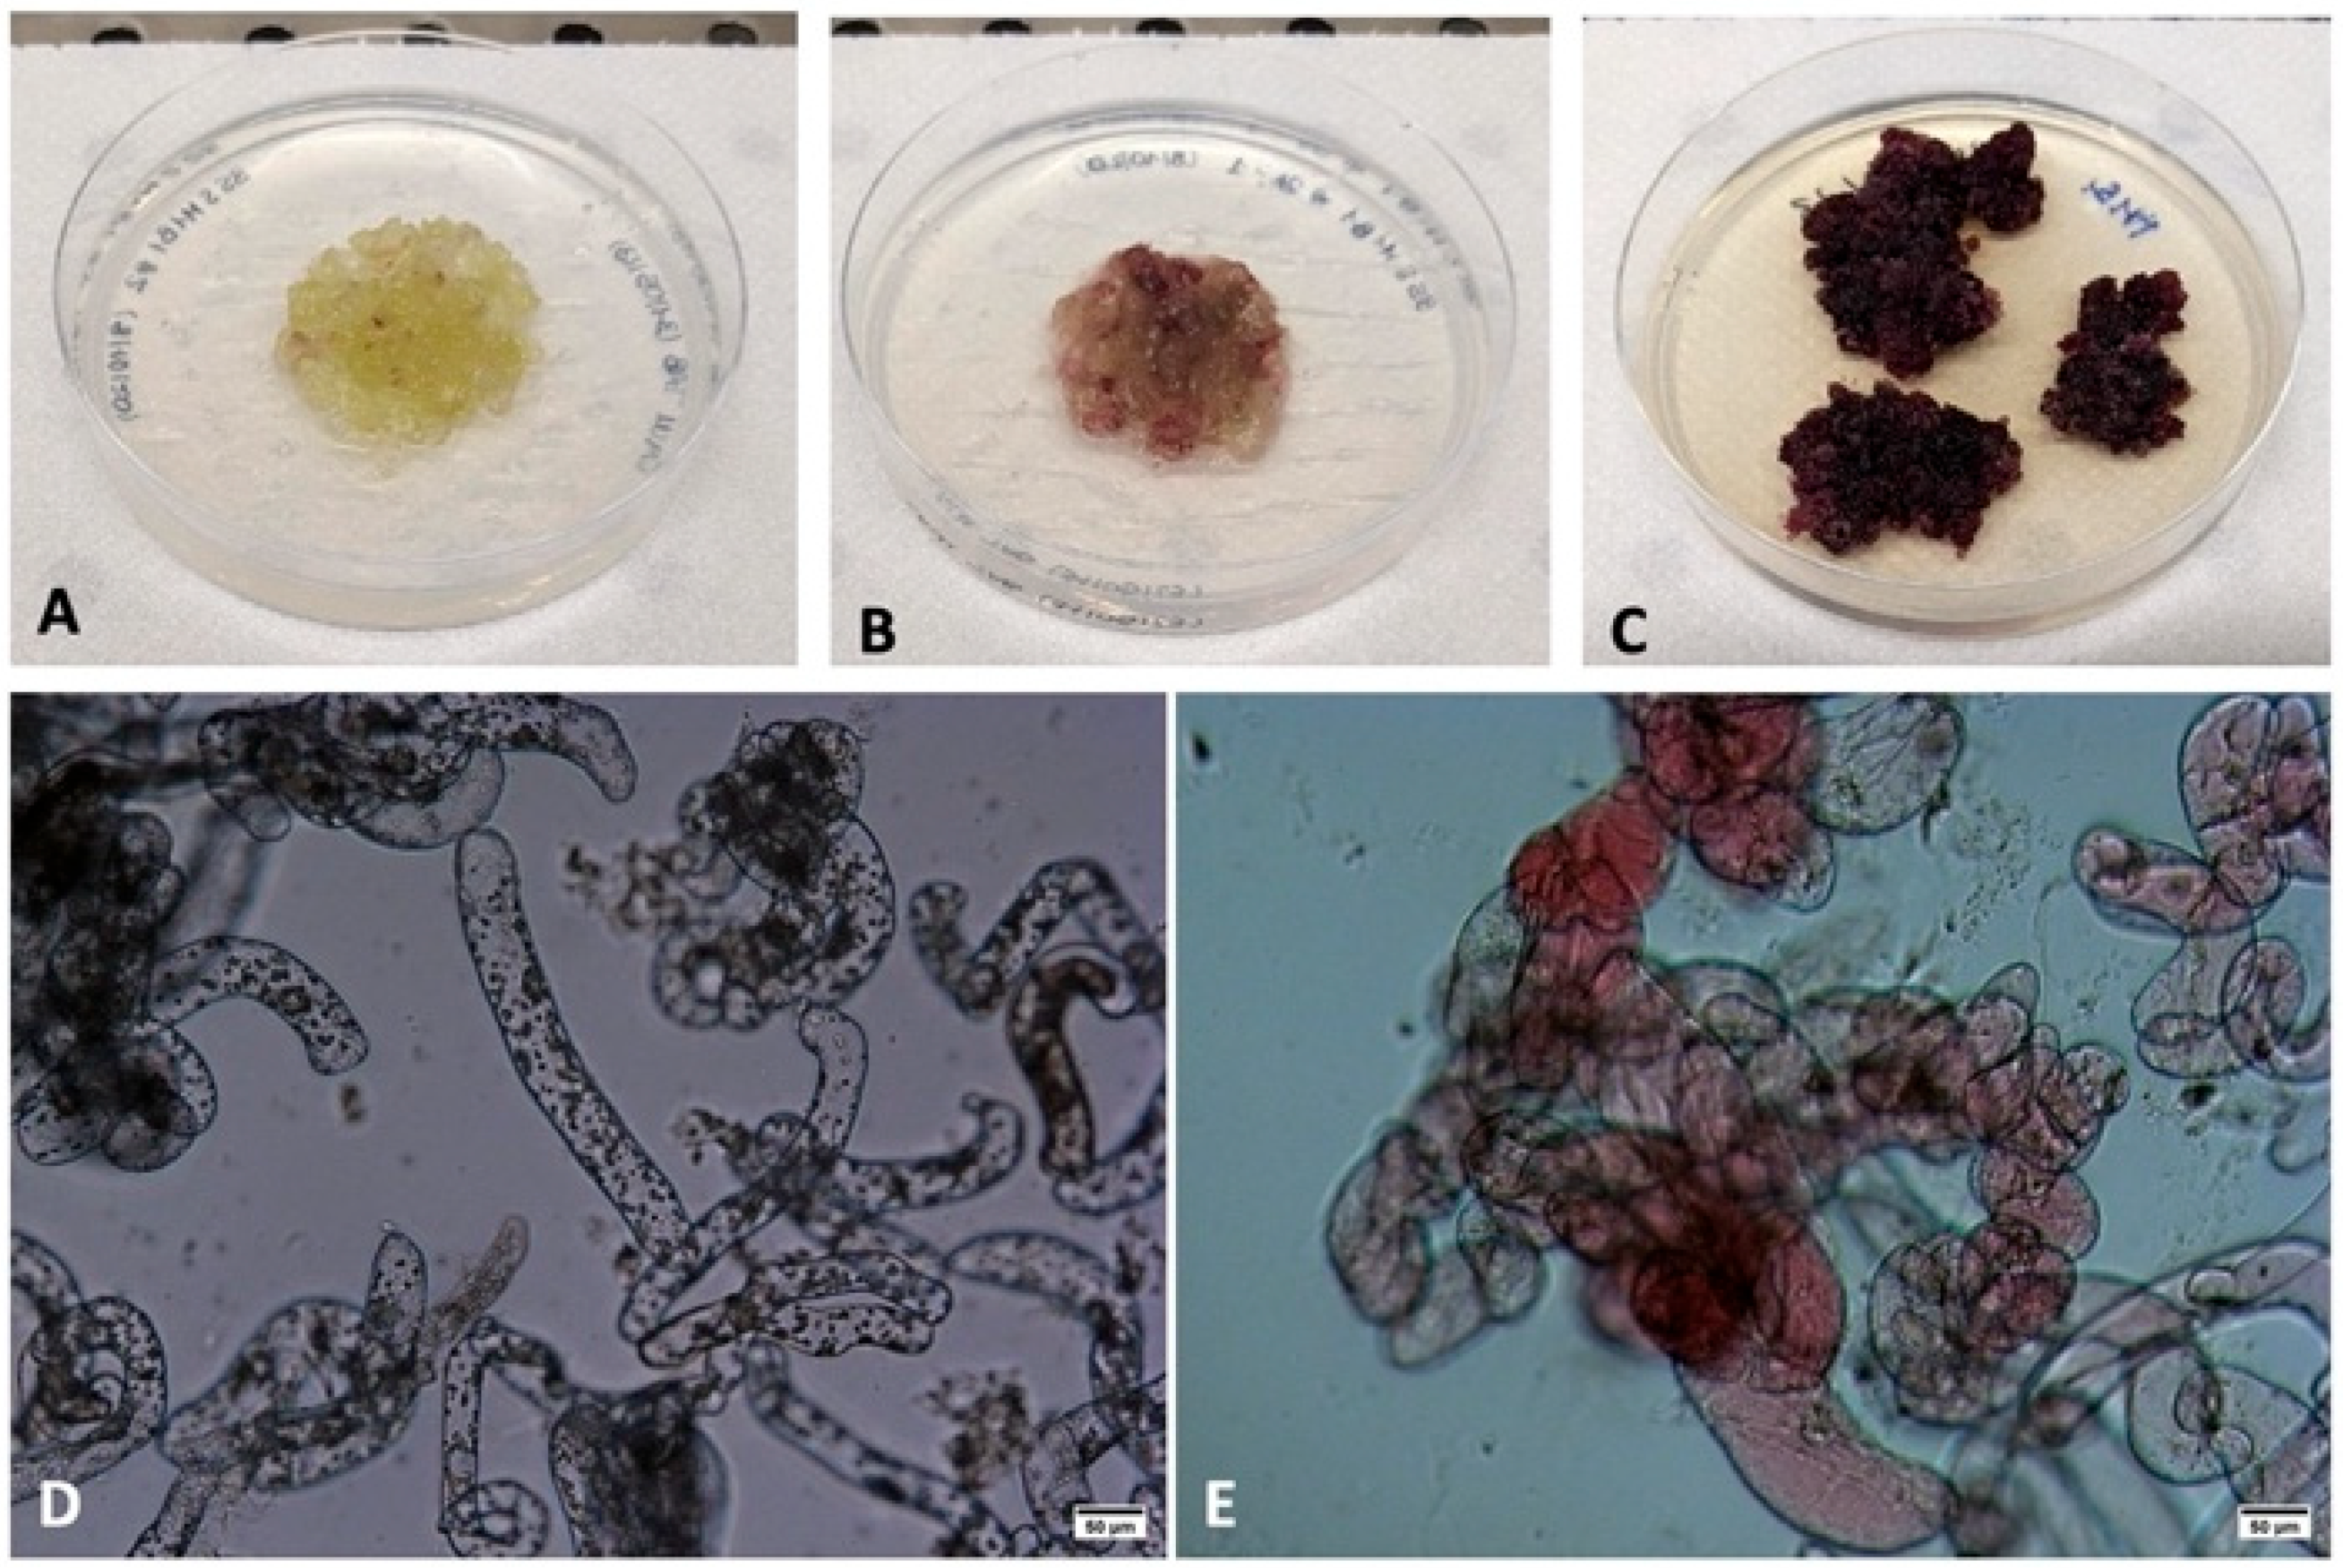
2.1.2. Development of Tobacco M1-B3 Plant Cell Lines
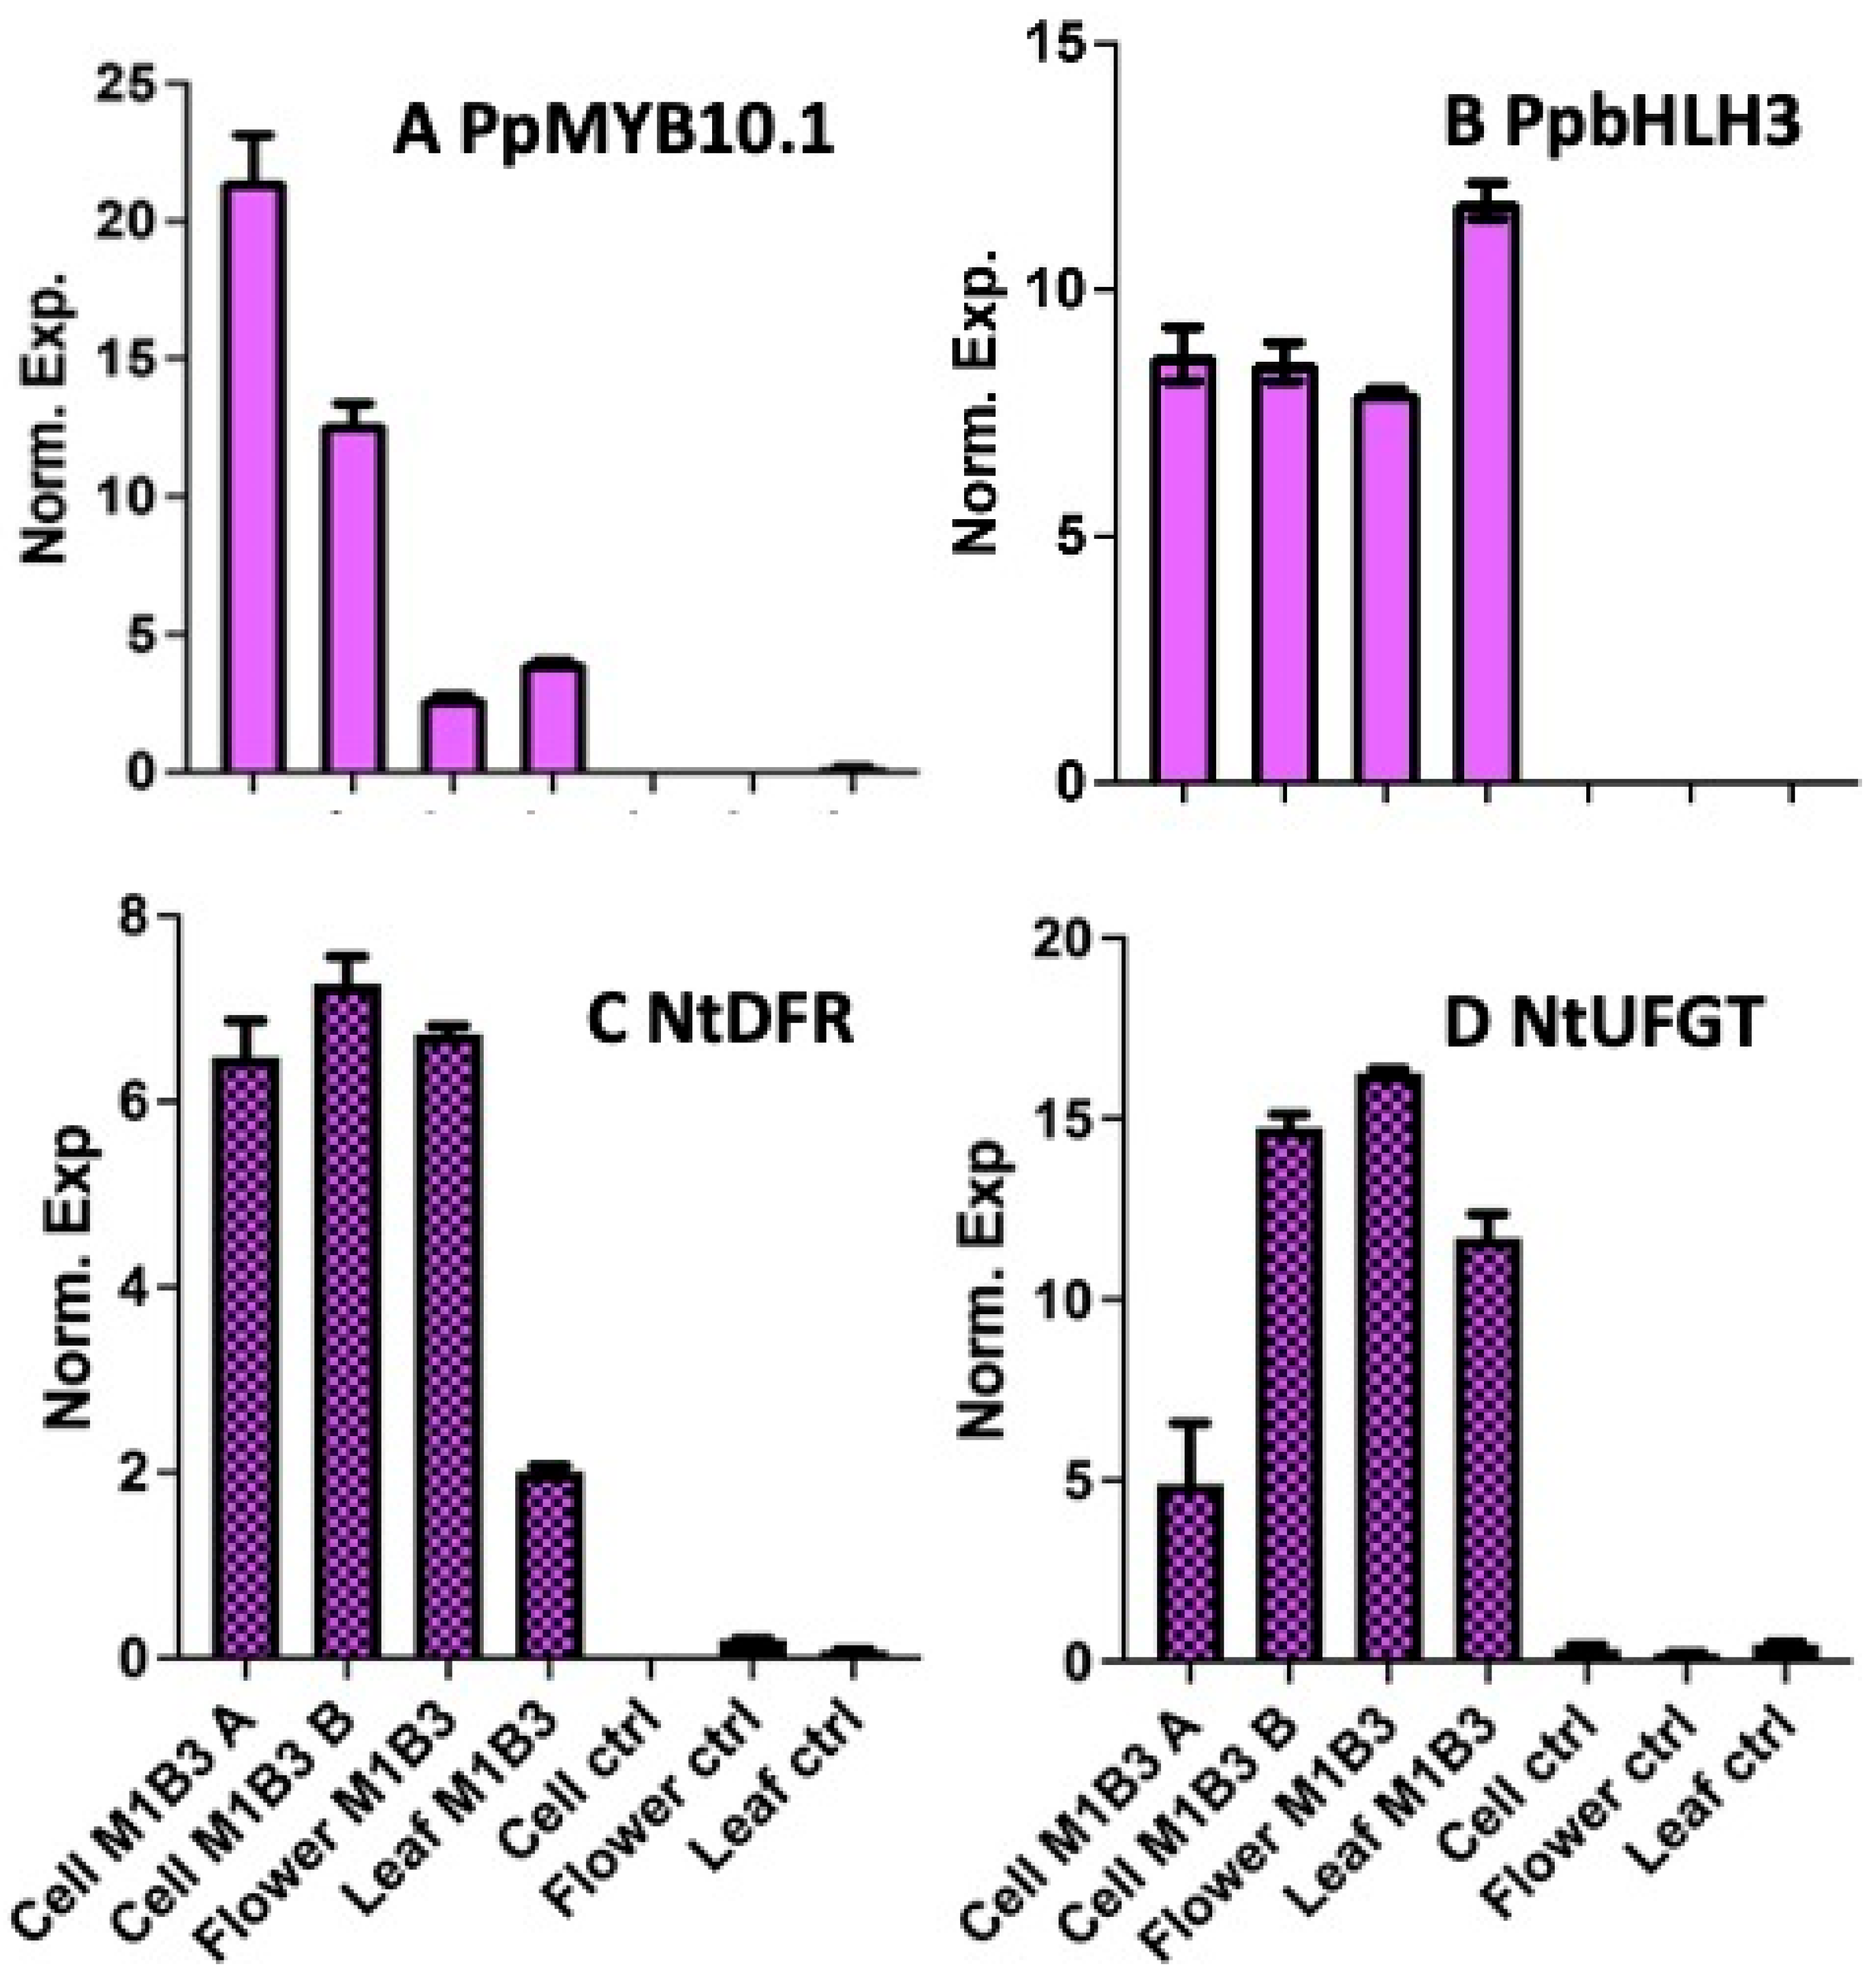
2.1.3. Molecular Characterization of Tobacco M1B3 Plant Cell Lines
2.2. Chemical Characterization of the Polyphenol Extracts
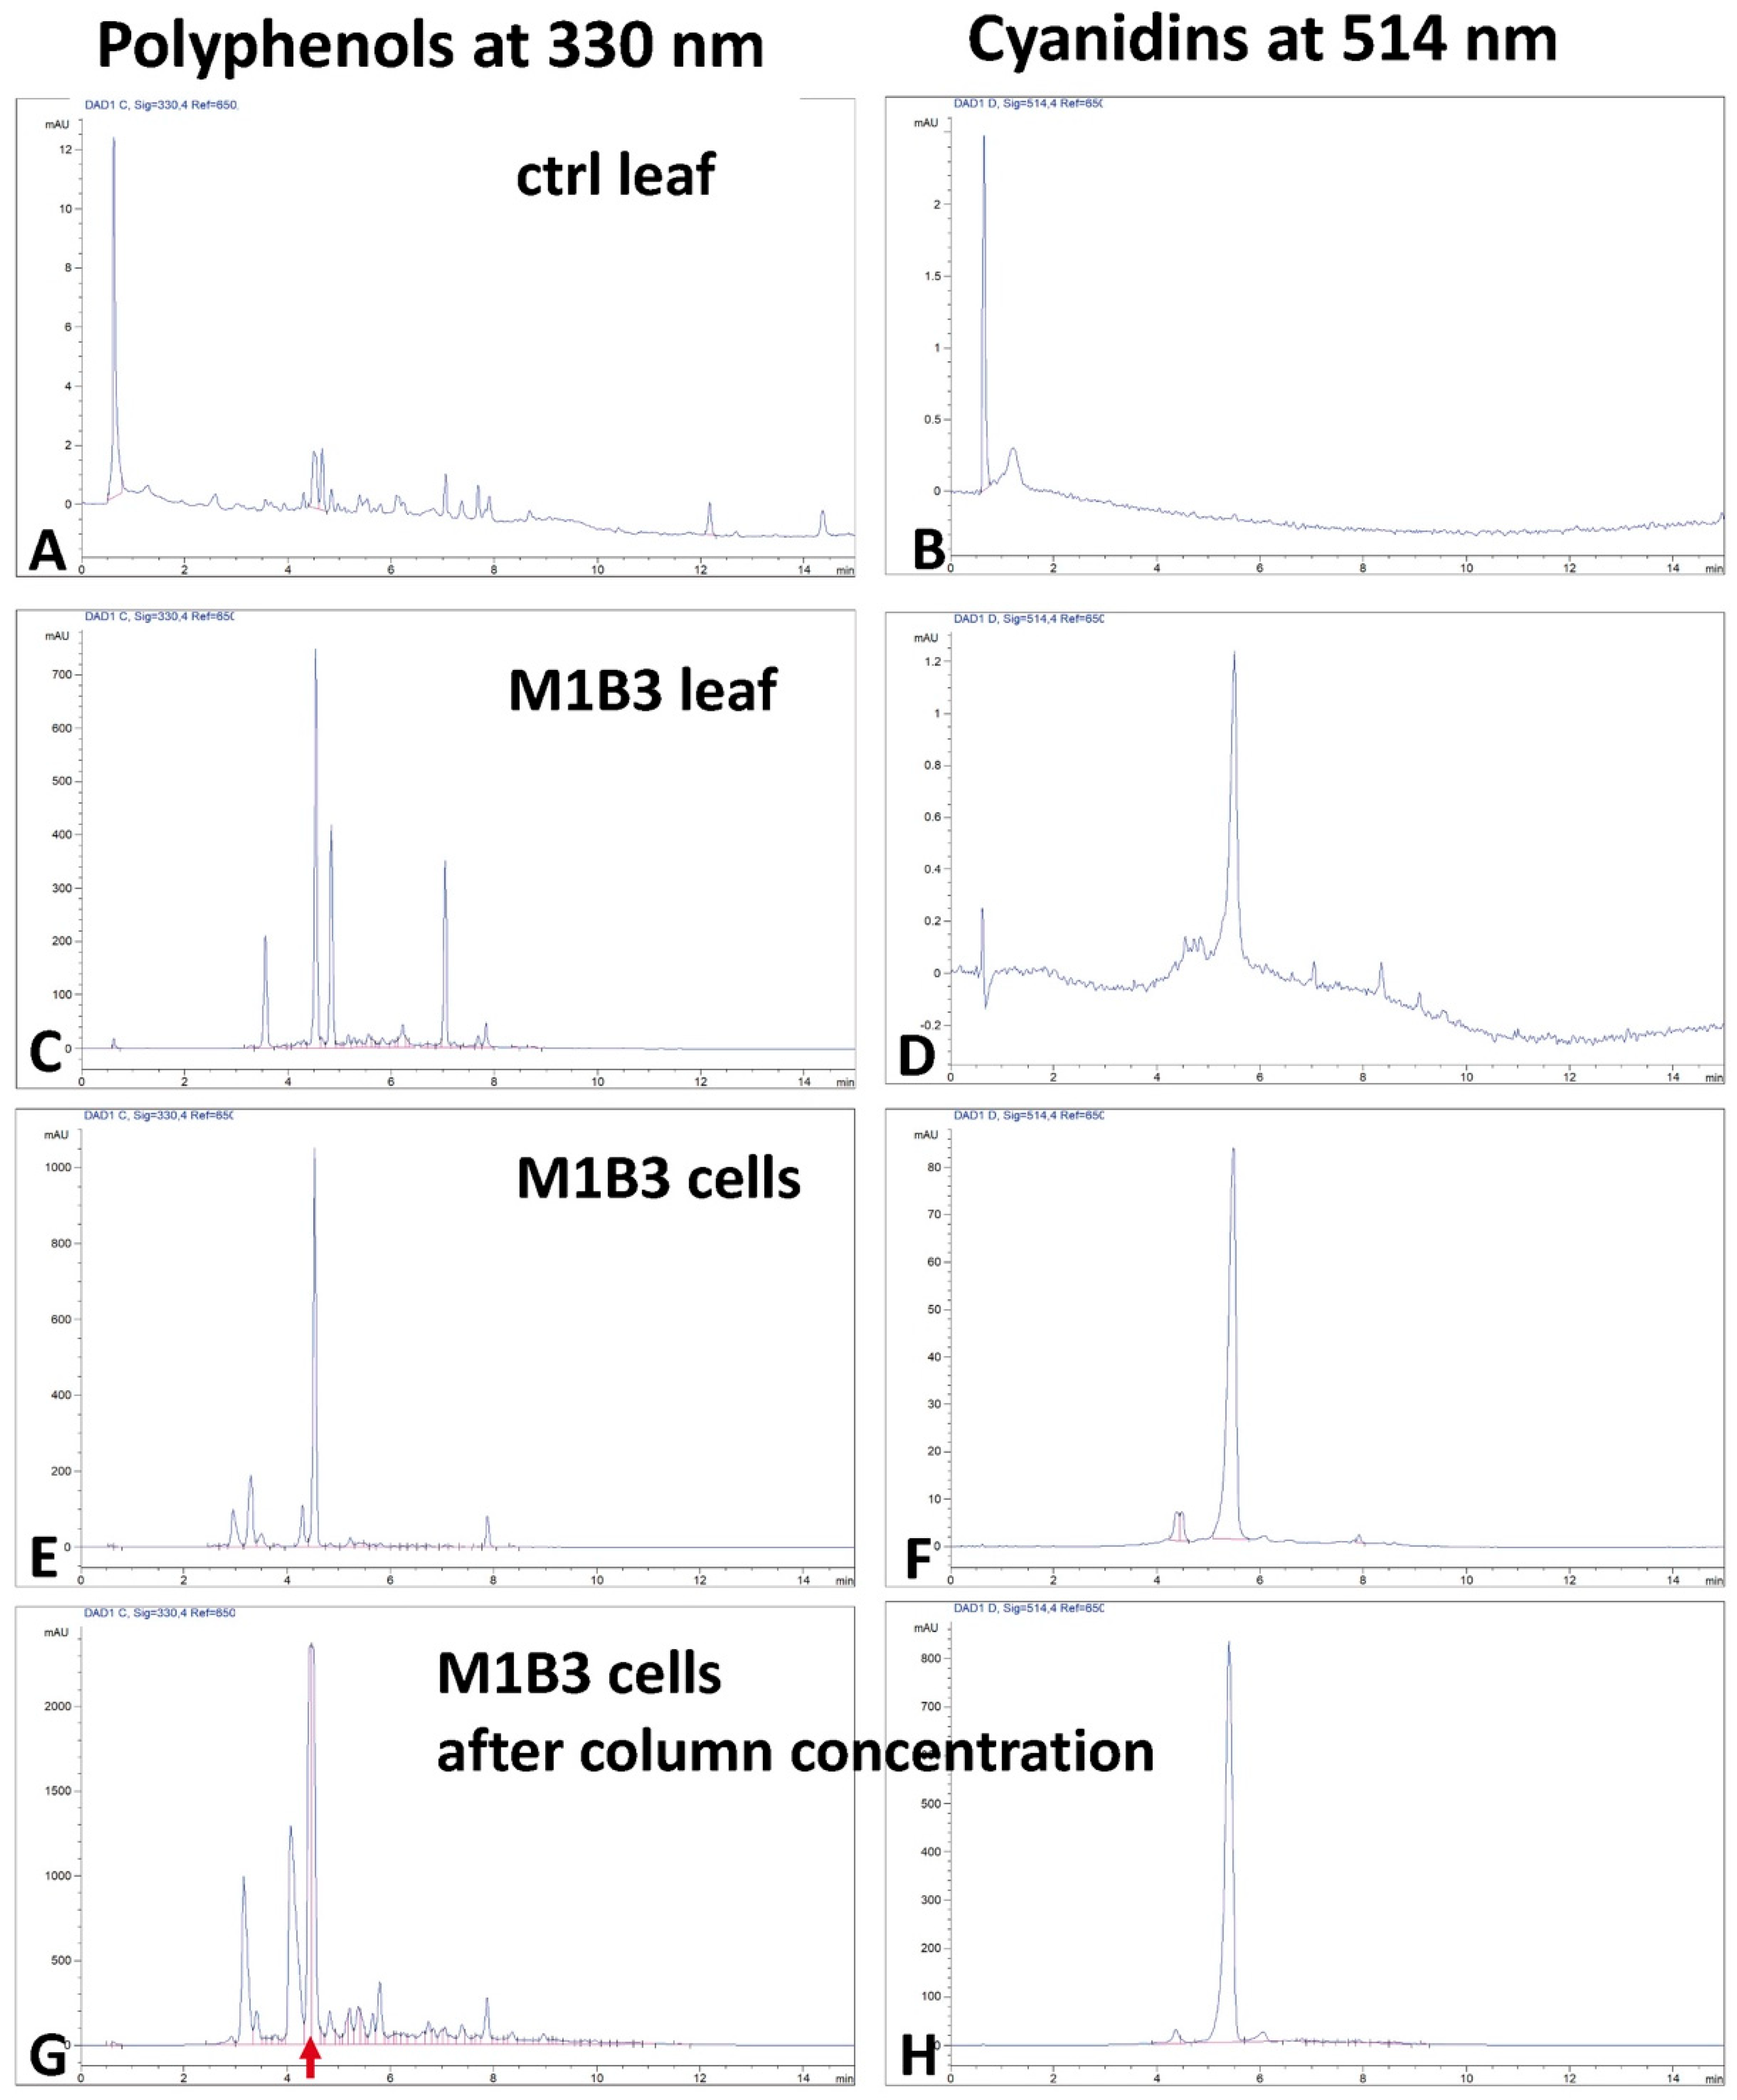
2.2.1. HPLC Characterization of the Polyphenol Extracts
2.2.2. Anthocyanin Characterization by HPLC–Mass Spectrometry
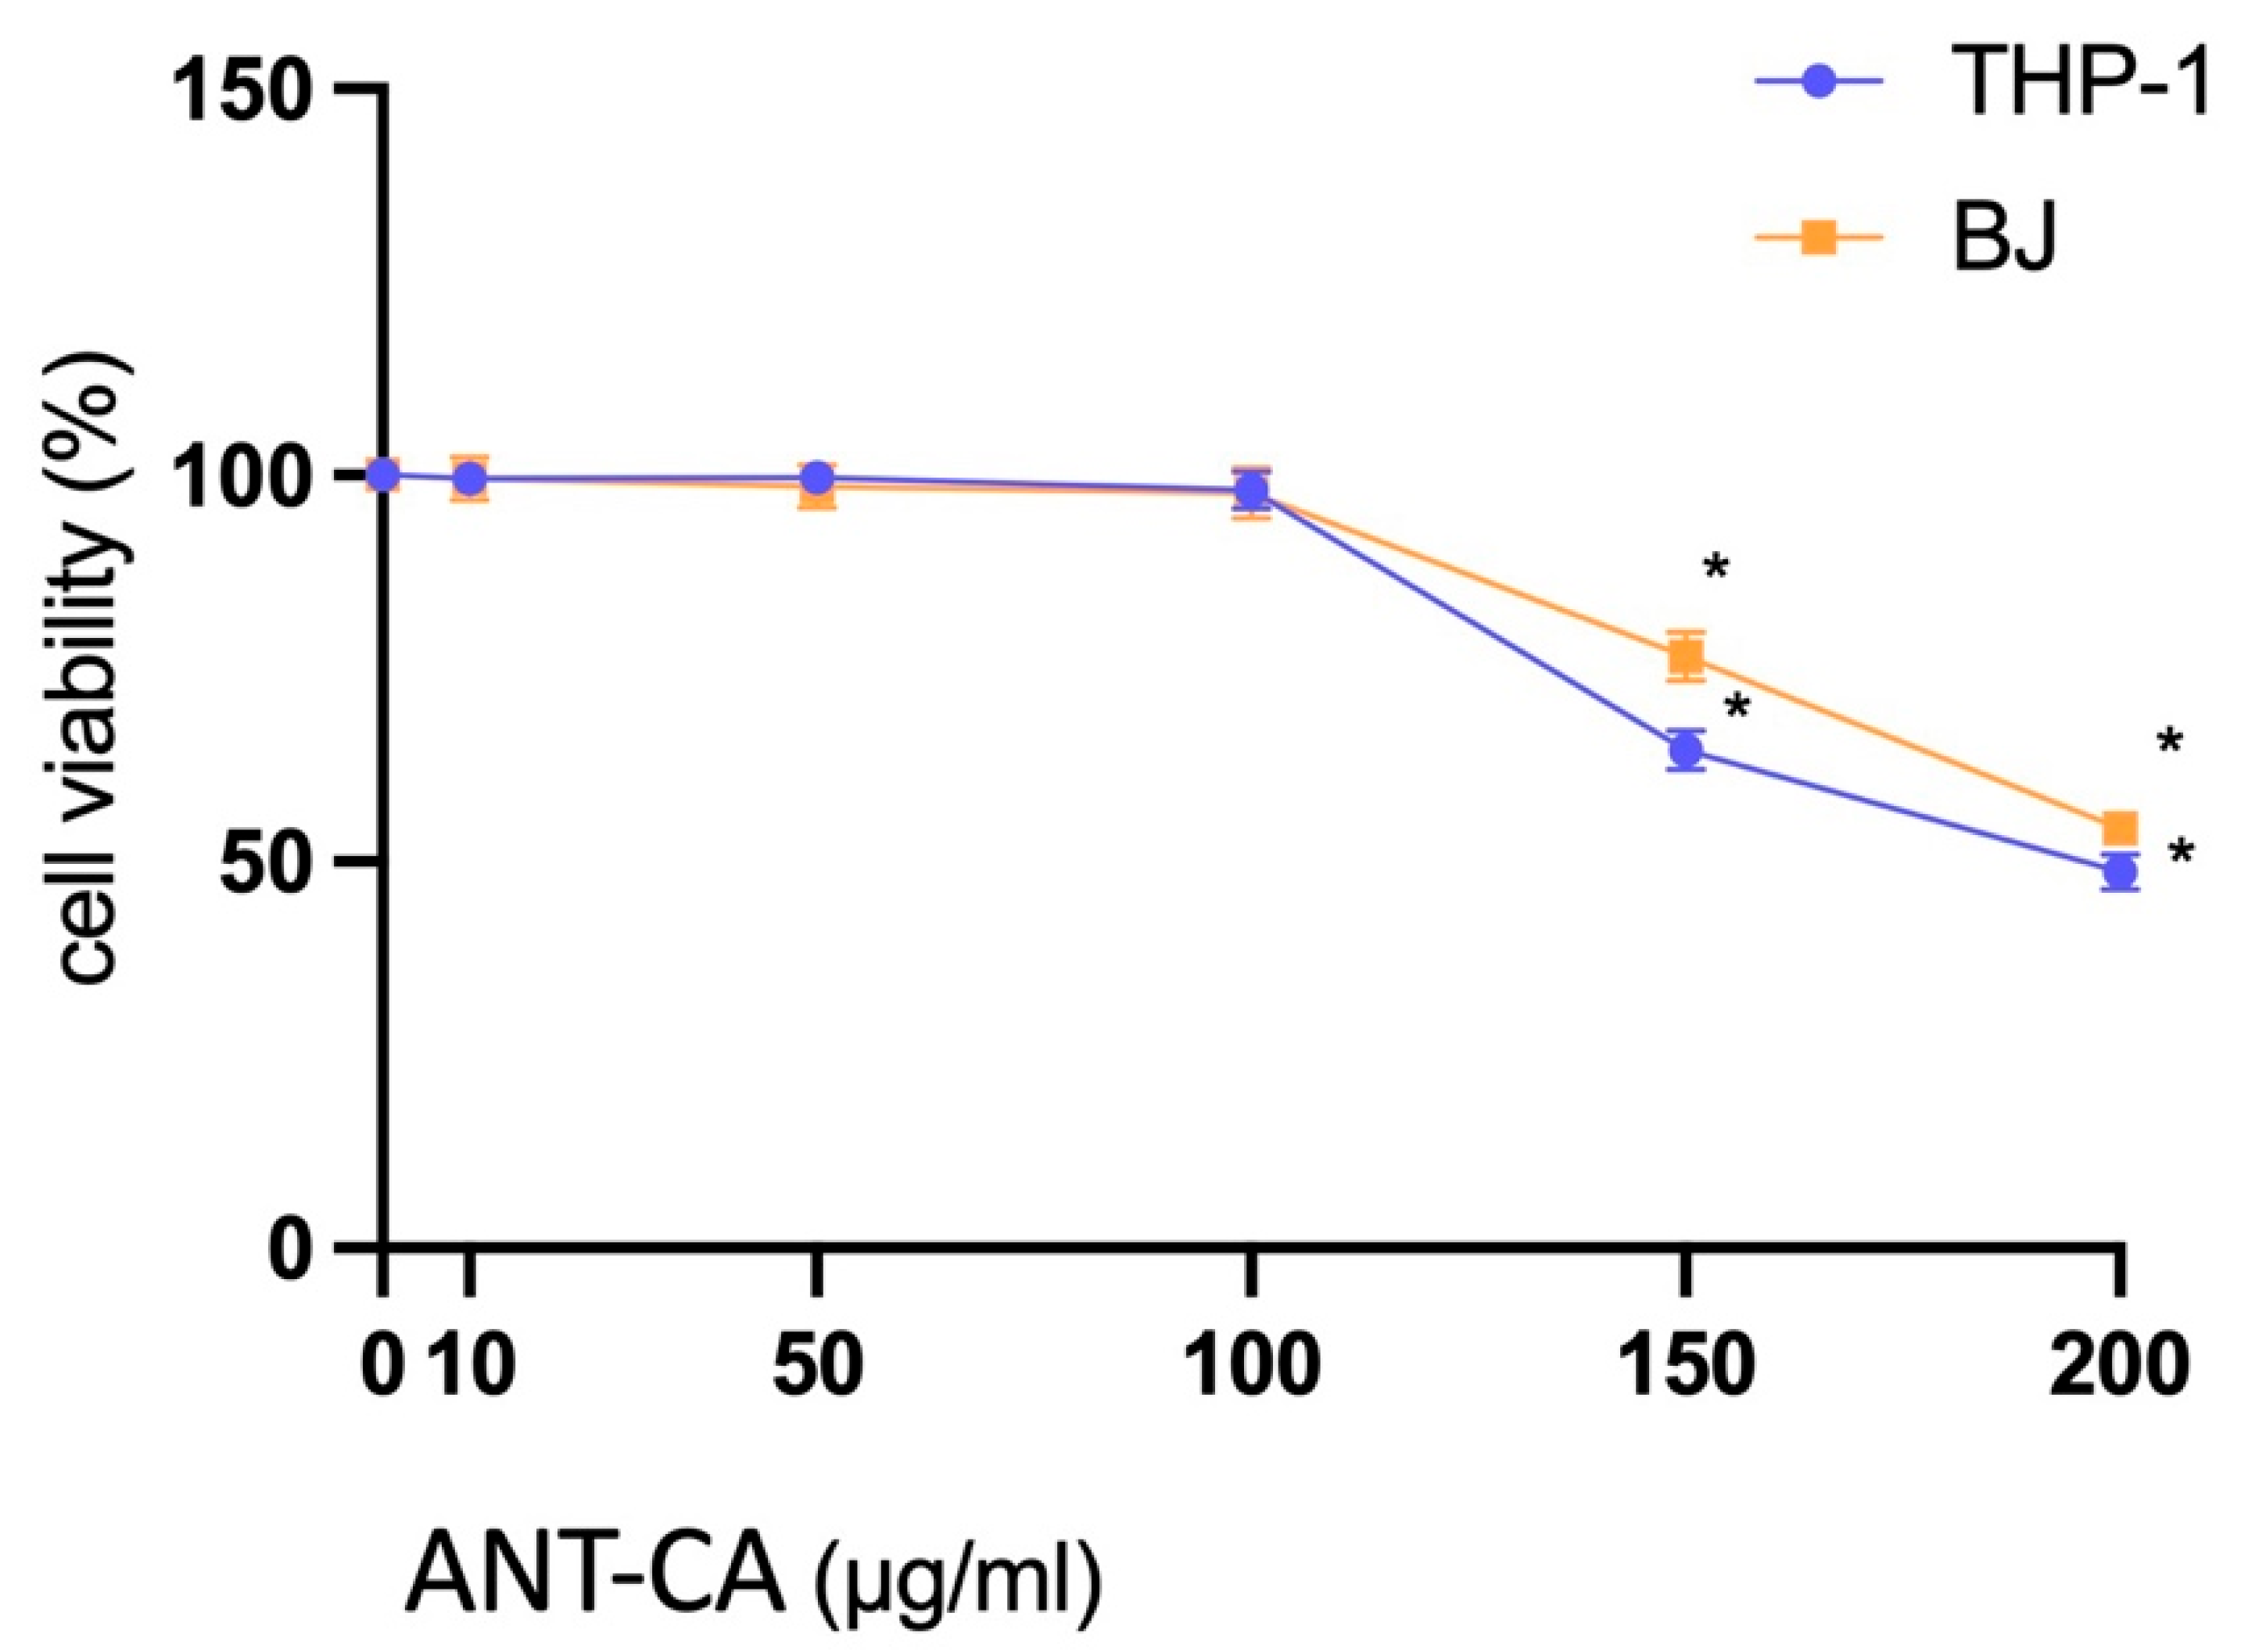
2.3. Cell Viability Assay with the ANT-CA
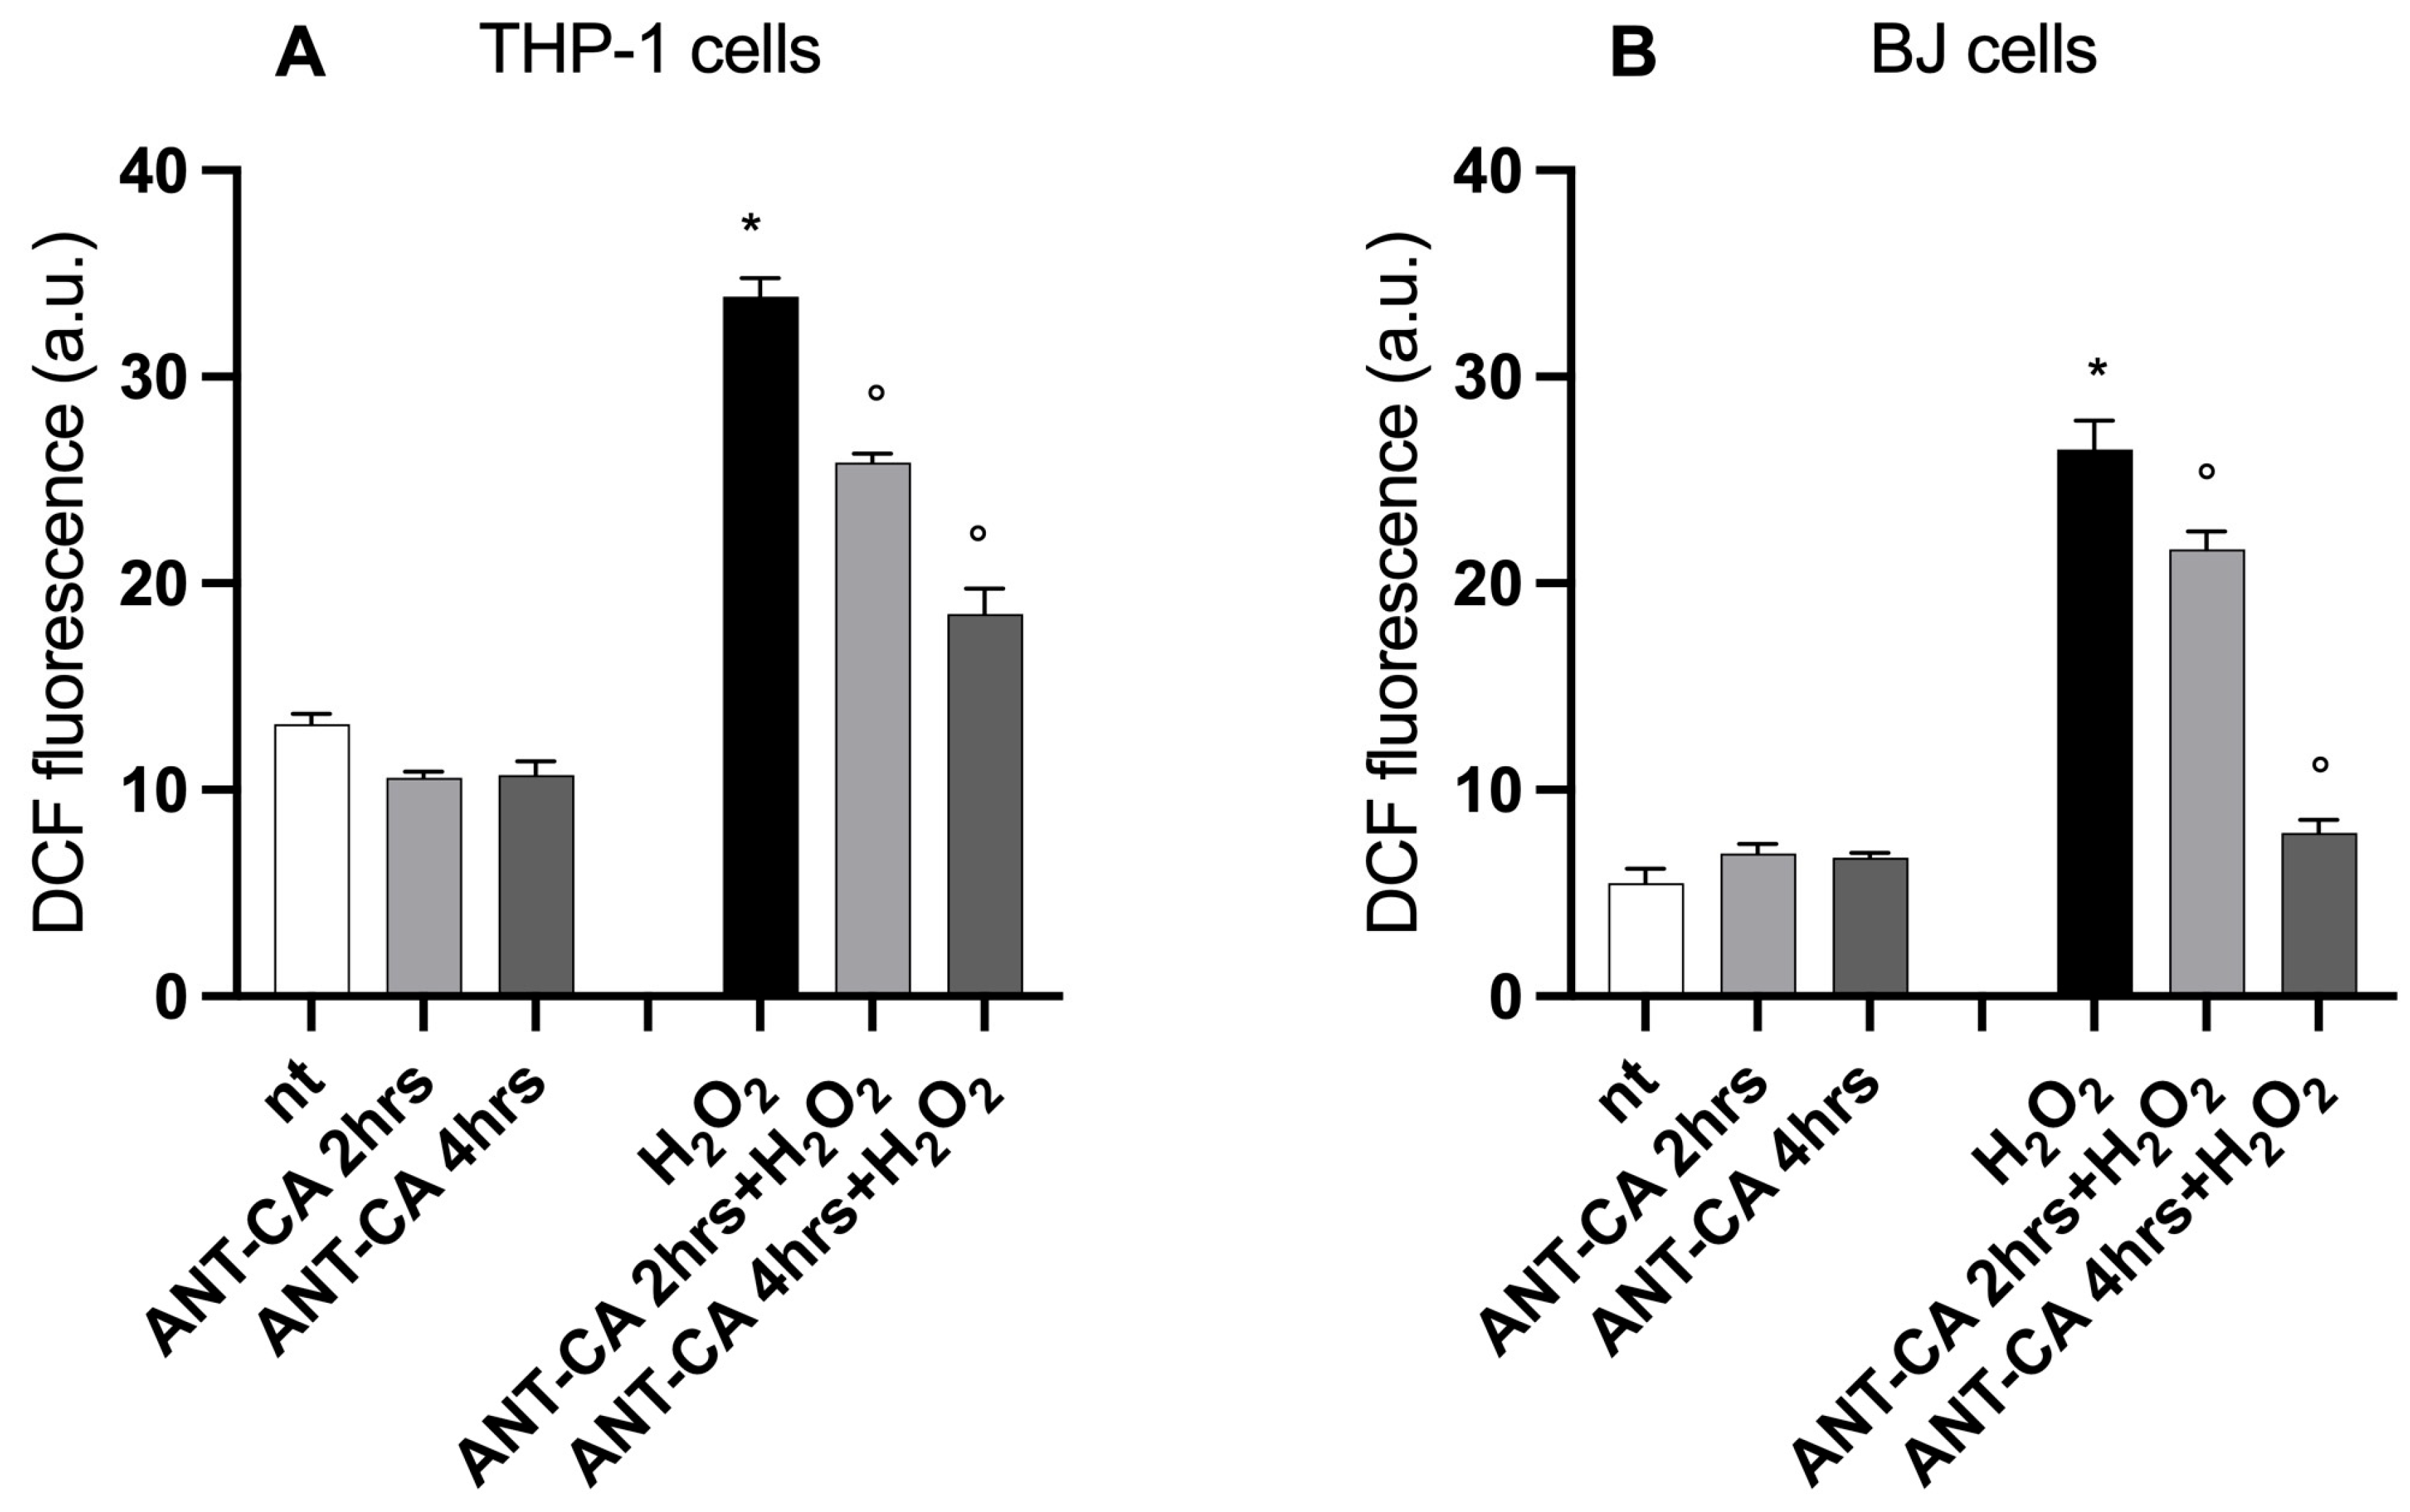
2.4. Incubation with ANT-CA Quenches Intracellular Reactive Oxygen Species Production
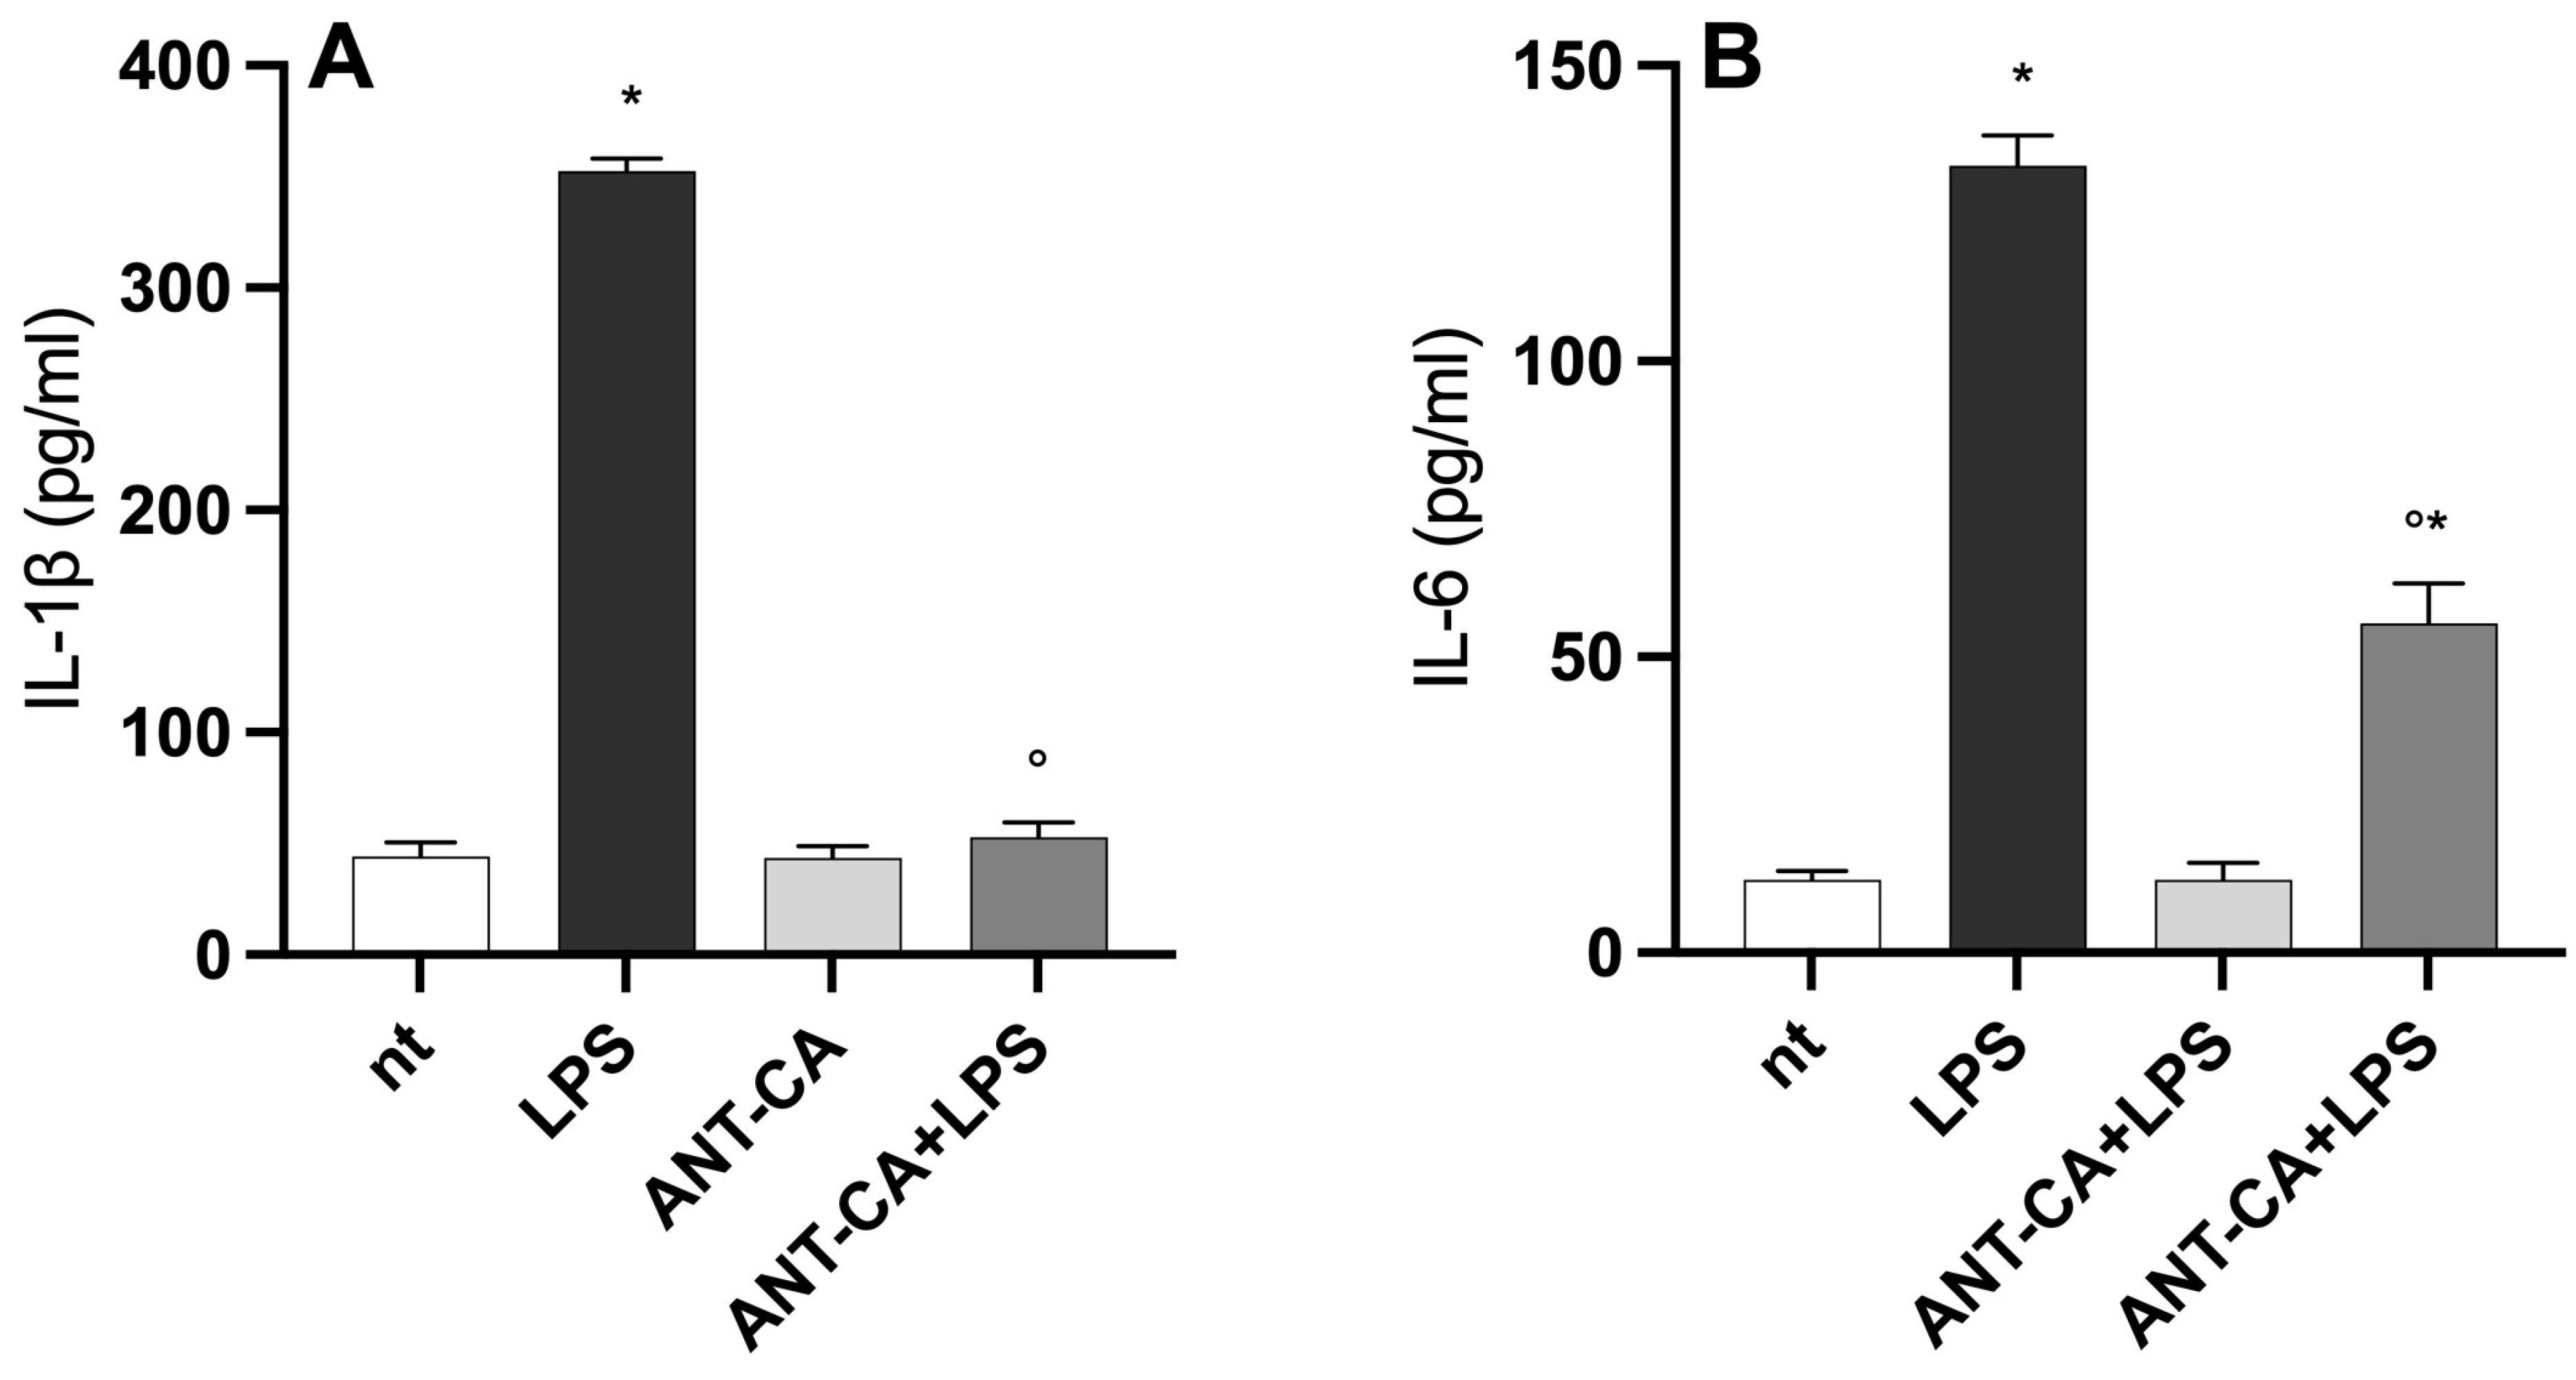
2.5. ANT-CA Reduces Lipopolysaccharide-Induced Inflammation in THP-1 Cells
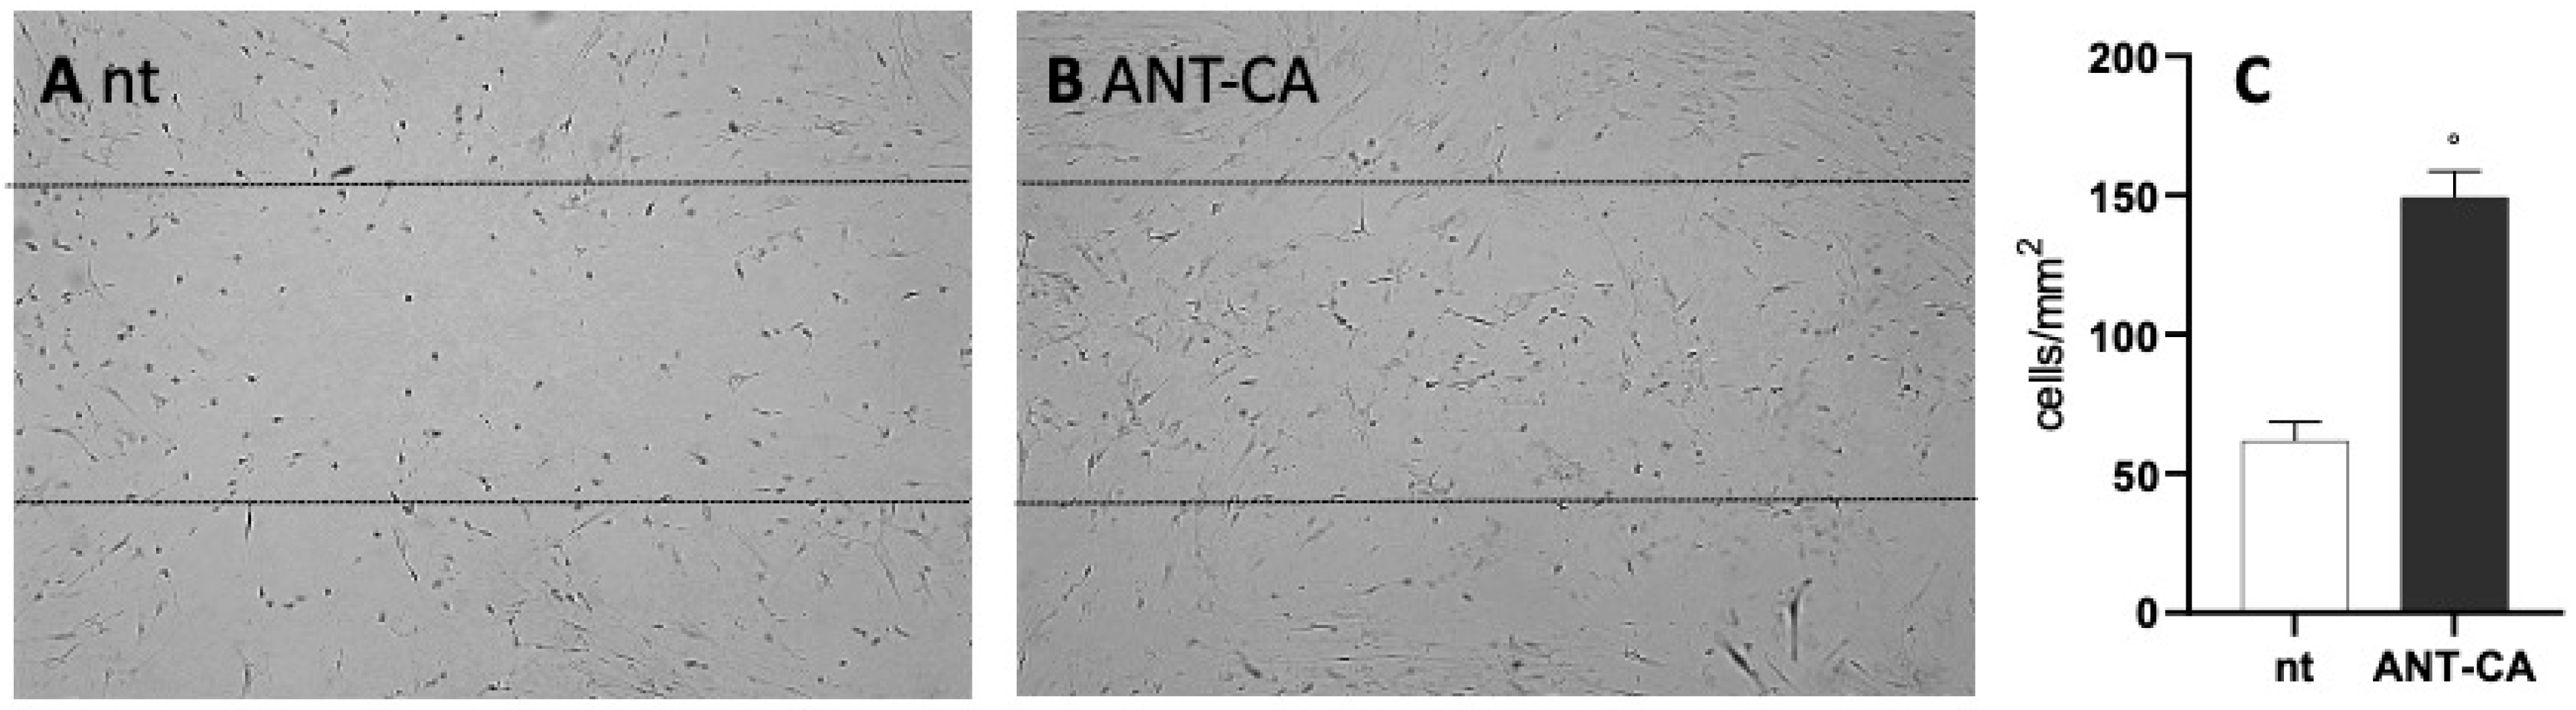
2.6. ANT-CA Reports In Vitro Wound Healing Potential
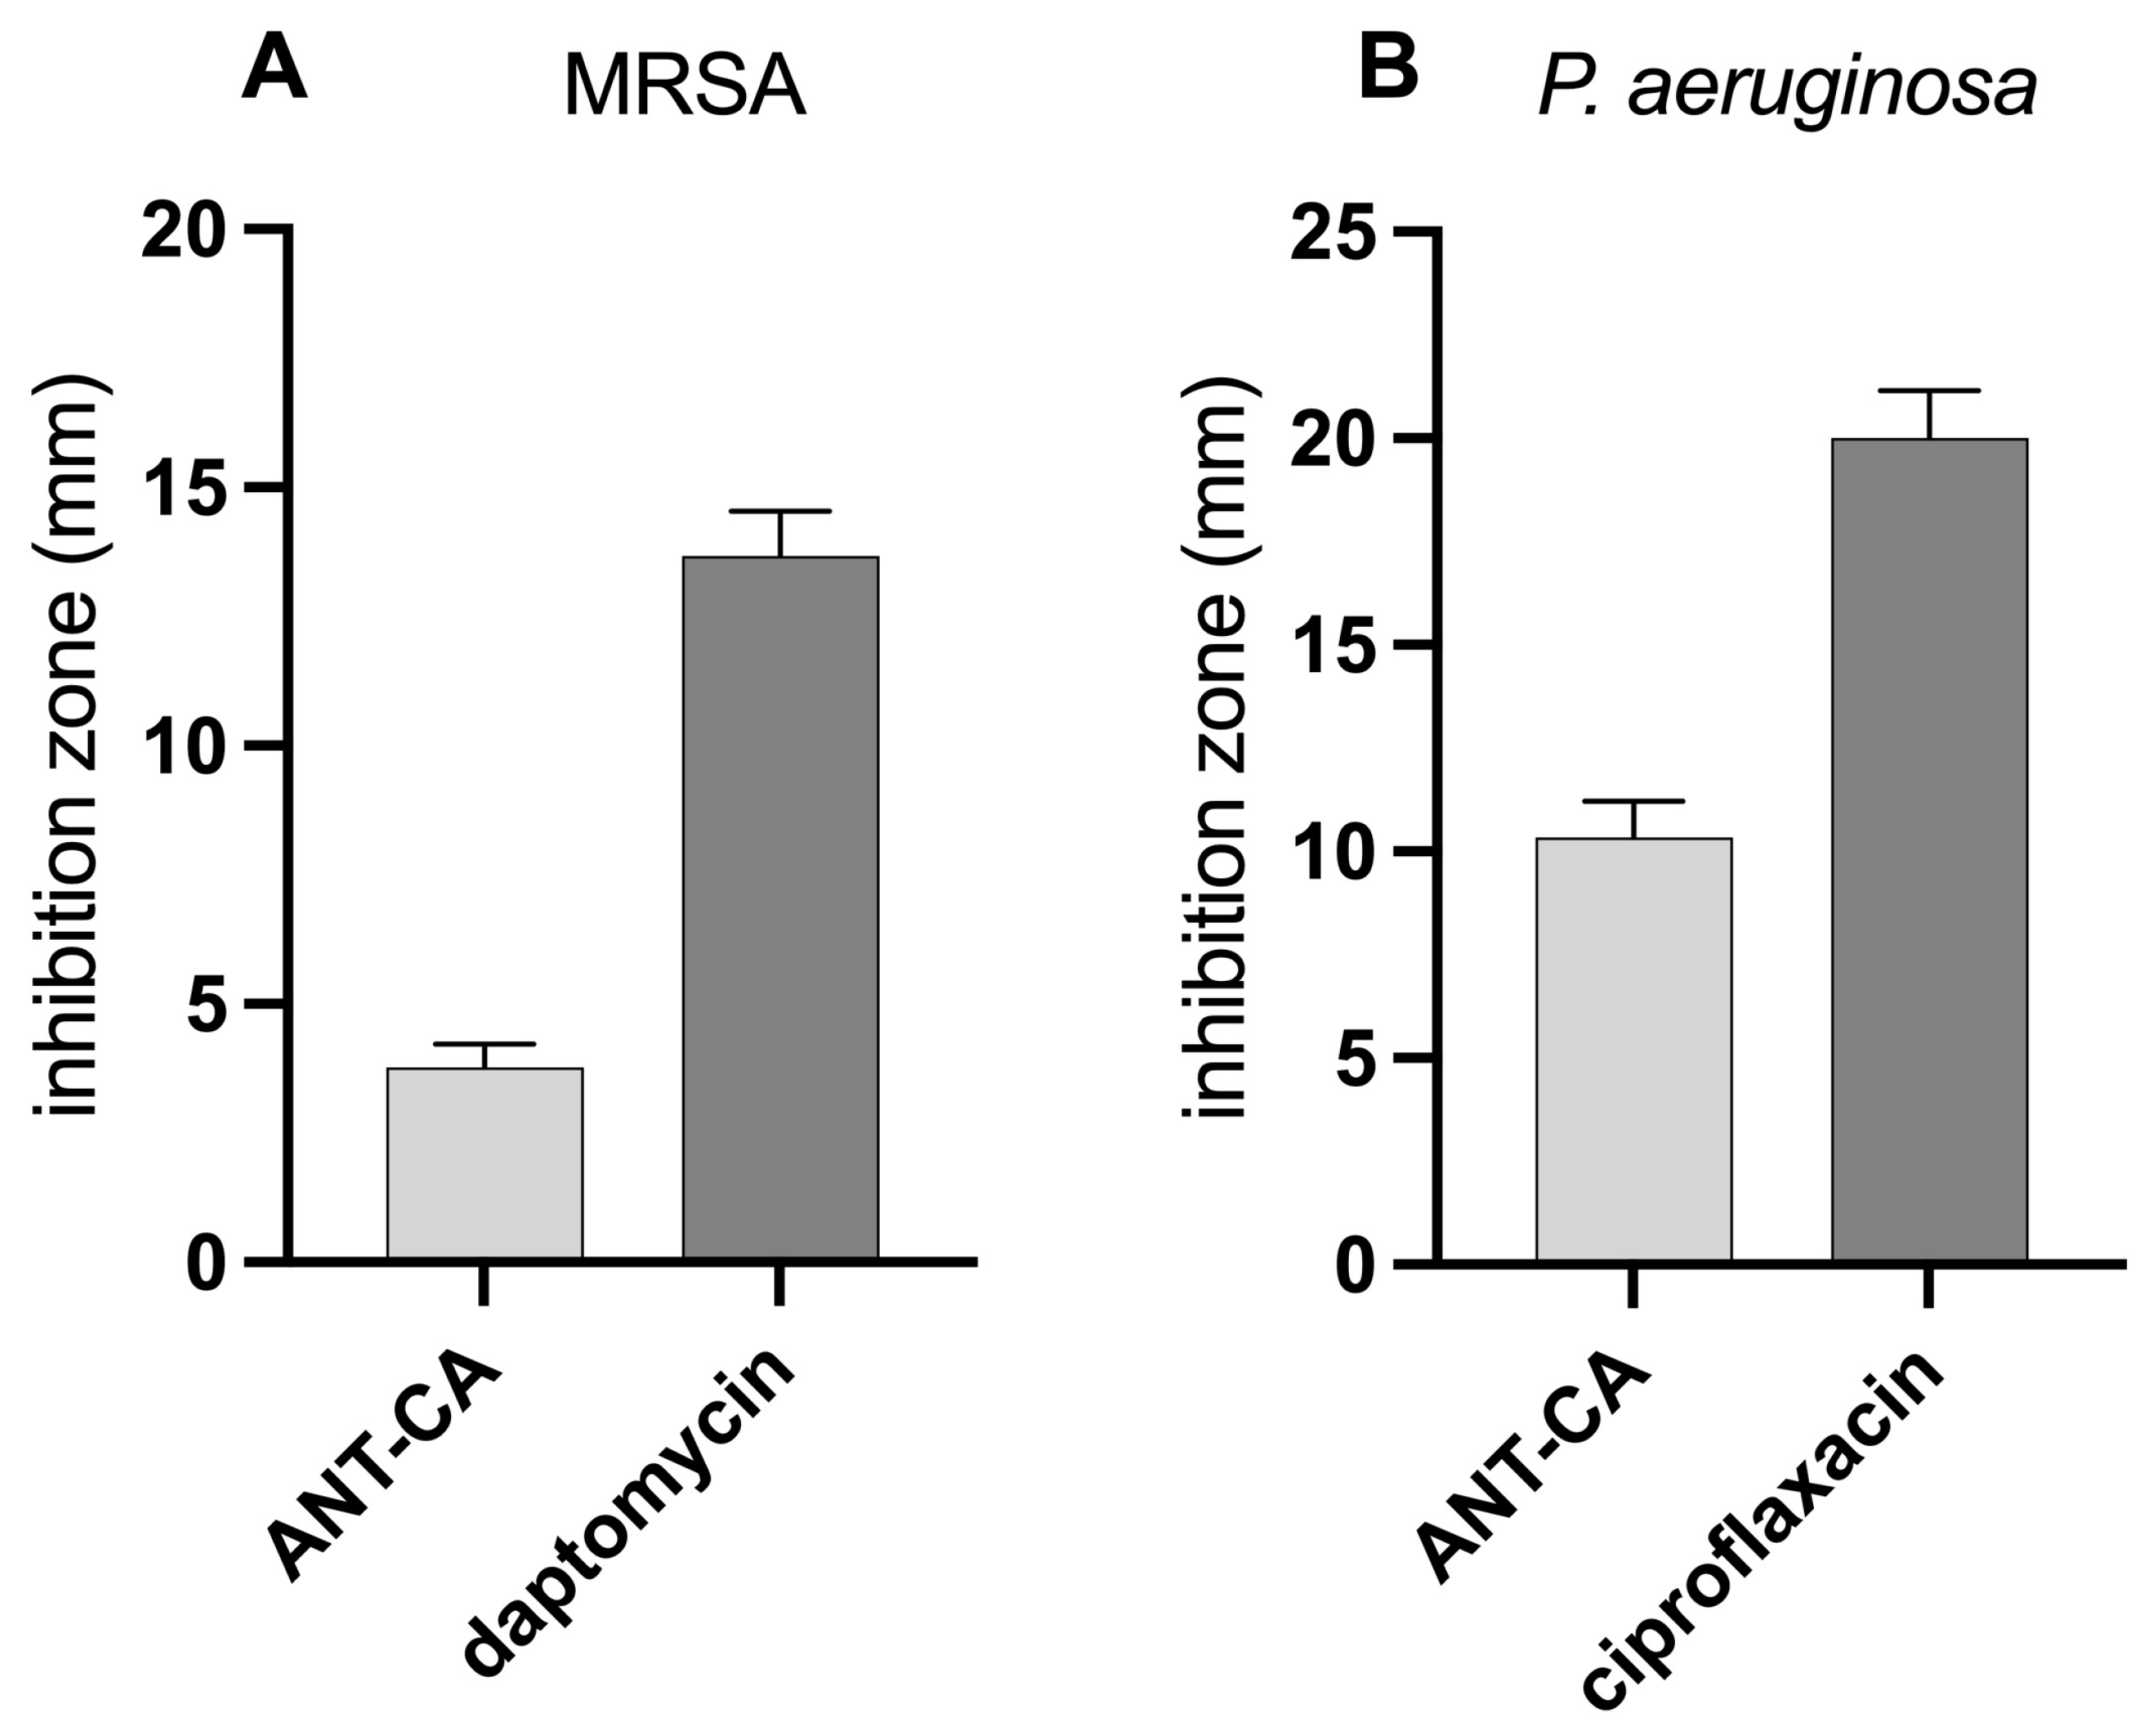
2.7. ANT-CA Demonstrates a Low Antibacterial Activity as Compared to Antibiotics
3. Discussion
4. Materials and Methods
4.1. Explant Source and Surface Sterilization
4.2. Callus Cultures Establishment
4.3. Callus Culture Selection and Liquid Growth Conditions
4.4. Total RNA Extraction and qRT-PCR Analyses
4.5. Anthocyanin Extraction from Small Samples
4.6. Anthocyanin Extraction, Purification, and Lyophilization from a Bioreactor
4.7. HPLC and MS Analysis
4.8. Cell Viability Assay
4.9. Intracellular Antioxidant Activity
4.10. Anti-Inflammatory Activity
4.11. Wound Healing Assay
4.12. Antibacterial Activity
4.13. Statistical Analysis
Author Contributions
Funding
Data Availability Statement
Acknowledgments
Conflicts of Interest
References
- Khoo, H.E.; Azlan, A.; Tang, S.T.; Lim, S.M. Anthocyanidins and Anthocyanins: Colored Pigments as Food, Pharmaceutical Ingredients, and the Potential Health Benefits. Food Nutr. Res. 2017, 61, 1361779. [Google Scholar] [PubMed]
- Xia, D.; He, G.; Wang, K.; Wang, T.; Zhu, Z.; Niu, Z.; Shi, G.; Liu, G. Anthocyanins Profiling Analysis and RNA-Seq Revealed the Dominating Pigments and Coloring Mechanism in Cyclamen Flowers. Biology 2022, 11, 1721. [Google Scholar] [CrossRef] [PubMed]
- Chaves-Silva, S.; Santos, A.L.D.; Chalfun-Júnior, A.; Zhao, J.; Peres, L.E.P.; Benedito, V.A. Understanding the Genetic Regulation of Anthocyanin Biosynthesis in Plants–Tools for Breeding Purple Varieties of Fruits and Vegetables. Phytochemistry 2018, 153, 11–27. [Google Scholar] [CrossRef]
- Huang, W.; Khaldun, A.B.M.; Lv, H.; Du, L.; Zhang, C.; Wang, Y. Isolation and Functional Characterization of a R2R3-MYB Regulator of the Anthocyanin Biosynthetic Pathway from Epimedium Sagittatum. Plant Cell Rep. 2016, 35, 883–894. [Google Scholar] [CrossRef] [PubMed]
- Petroni, K.; Tonelli, C. Recent Advances on the Regulation of Anthocyanin Synthesis in Reproductive Organs. Plant Sci. 2011, 181, 219–229. [Google Scholar] [CrossRef]
- Rahim, M.A.; Busatto, N.; Trainotti, L. Regulation of Anthocyanin Biosynthesis in Peach Fruits. Planta 2014, 240, 913–929. [Google Scholar] [CrossRef]
- Kaur, S.; Tiwari, V.; Kumari, A.; Chaudhary, E.; Sharma, A.; Ali, U.; Garg, M. Protective and Defensive Role of Anthocyanins under Plant Abiotic and Biotic Stresses: An Emerging Application in Sustainable Agriculture. J. Biotechnol. 2023, 361, 12–29. [Google Scholar] [CrossRef]
- Butelli, E.; Titta, L.; Giorgio, M.; Mock, H.-P.; Matros, A.; Peterek, S.; Schijlen, E.G.W.M.; Hall, R.D.; Bovy, A.G.; Luo, J.; et al. Enrichment of Tomato Fruit with Health-Promoting Anthocyanins by Expression of Select Transcription Factors. Nat. Biotechnol. 2008, 26, 1301–1308. [Google Scholar] [CrossRef]
- Vishnu, V.R.; Renjith, R.S.; Mukherjee, A.; Anil, S.R.; Sreekumar, J.; Jyothi, A.N. Comparative Study on the Chemical Structure and In Vitro Antiproliferative Activity of Anthocyanins in Purple Root Tubers and Leaves of Sweet Potato (Ipomoea batatas). J. Agric. Food Chem. 2019, 67, 2467–2475. [Google Scholar] [CrossRef]
- Smeriglio, A.; Barreca, D.; Bellocco, E.; Trombetta, D. Chemistry, Pharmacology and Health Benefits of Anthocyanins: Anthocyanins and Human Health. Phytother. Res. 2016, 30, 1265–1286. [Google Scholar] [CrossRef]
- Appelhagen, I.; Wulff-Vester, A.K.; Wendell, M.; Hvoslef-Eide, A.-K.; Russell, J.; Oertel, A.; Martens, S.; Mock, H.-P.; Martin, C.; Matros, A. Colour Bio-Factories: Towards Scale-up Production of Anthocyanins in Plant Cell Cultures. Metab. Eng. 2018, 48, 218–232. [Google Scholar] [CrossRef] [PubMed]
- Bapat, V.A.; Kavi Kishor, P.B.; Jalaja, N.; Jain, S.M.; Penna, S. Plant Cell Cultures: Biofactories for the Production of Bioactive Compounds. Agronomy 2023, 13, 858. [Google Scholar] [CrossRef]
- Wawrosch, C.; Zotchev, S.B. Production of Bioactive Plant Secondary Metabolites through in Vitro Technologies—Status and Outlook. Appl. Microbiol. Biotechnol. 2021, 105, 6649–6668. [Google Scholar] [CrossRef] [PubMed]
- Davies, K.M.; Deroles, S.C. Prospects for the Use of Plant Cell Cultures in Food Biotechnology. Curr. Opin. Biotechnol. 2014, 26, 133–140. [Google Scholar] [CrossRef]
- Eibl, R.; Meier, P.; Stutz, I.; Schildberger, D.; Hühn, T.; Eibl, D. Plant Cell Culture Technology in the Cosmetics and Food Industries: Current State and Future Trends. Appl. Microbiol. Biotechnol. 2018, 102, 8661–8675. [Google Scholar] [CrossRef] [PubMed]
- Zhong, J.-J.; Yoshida, M.; Fujiyama, K.; Seki, T.; Yoshida, T. Enhancement of Anthocyanin Production by Perilla Frutescens Cells in a Stirred Bioreactor with Internal Light Irradiation. J. Ferment. Bioeng. 1993, 75, 299–303. [Google Scholar] [CrossRef]
- Hiroyuki, H.; Kousuke, H.; Eiji, N.; Mariko, O.; Yoshihito, K.; Setsuro, H.; Takeshi, K. Enhanced Anthocyanin Production from Grape Callus in an Air-Lift Type Bioreactor Using a Viscous Additive-Supplemented Medium. J. Biosci. Bioeng. 2002, 94, 135–139. [Google Scholar] [CrossRef]
- Meyer, J.E.; Pépin, M.-F.; Smith, M.A.L. Anthocyanin Production from Vaccinium Pahalae: Limitations of the Physical Microenvironment. J. Biotechnol. 2002, 93, 45–57. [Google Scholar] [CrossRef]
- Saad, K.R.; Kumar, G.; Mudliar, S.N.; Giridhar, P.; Shetty, N.P. Salt Stress-Induced Anthocyanin Biosynthesis Genes and MATE Transporter Involved in Anthocyanin Accumulation in Daucus Carota Cell Culture. ACS Omega 2021, 6, 24502–24514. [Google Scholar] [CrossRef]
- Smith, M.A.L.; Reid, J.F.; Hansen, A.C.; Li, Z.; Madhavi, D.L. Non-Destructive Machine Vision Analysis of Pigment-Producing Cell Cultures. J. Biotechnol. 1995, 40, 1–11. [Google Scholar] [CrossRef]
- Zhang, P.; Zhu, H. Anthocyanins in Plant Food: Current Status, Genetic Modification, and Future Perspectives. Molecules 2023, 28, 866. [Google Scholar] [CrossRef] [PubMed]
- Rahim, M.A.; Resentini, F.; Dalla Vecchia, F.; Trainotti, L. Effects on Plant Growth and Reproduction of a Peach R2R3-MYB Transcription Factor Overexpressed in Tobacco. Front. Plant Sci. 2019, 10, 1143. [Google Scholar] [CrossRef]
- Rutherford, S.; Brandizzi, F.; Townley, H.; Craft, J.; Wang, Y.; Jepson, I.; Martinez, A.; Moore, I. Improved Transcriptional Activators and Their Use in Mis-Expression Traps in Arabidopsis. Plant J. 2005, 43, 769–788. [Google Scholar]
- Tena, N.; Martín, J.; Asuero, A.G. State of the Art of Anthocyanins: Antioxidant Activity, Sources, Bioavailability, and Therapeutic Effect in Human Health. Antioxidants 2020, 9, 451. [Google Scholar] [CrossRef]
- Zhou, L.-L.; Zeng, H.-N.; Shi, M.-Z.; Xie, D.-Y. Development of Tobacco Callus Cultures over Expressing Arabidopsis PAP1/MYB75 Transcription Factor and Characterization of Anthocyanin Biosynthesis. Planta 2008, 229, 37–51. [Google Scholar] [CrossRef] [PubMed]
- Albert, N.W.; Davies, K.M.; Lewis, D.H.; Zhang, H.; Montefiori, M.; Brendolise, C.; Boase, M.R.; Ngo, H.; Jameson, P.E.; Schwinn, K.E. A Conserved Network of Transcriptional Activators and Repressors Regulates Anthocyanin Pigmentation in Eudicots. Plant Cell 2014, 26, 962–980. [Google Scholar] [CrossRef]
- Outchkourov, N.S.; Karlova, R.; Hölscher, M.; Schrama, X.; Blilou, I.; Jongedijk, E.; Simon, C.D.; van Dijk, A.D.J.; Bosch, D.; Hall, R.D.; et al. Transcription Factor-Mediated Control of Anthocyanin Biosynthesis in Vegetative Tissues. Plant Physiol. 2018, 176, 1862–1878. [Google Scholar] [CrossRef] [PubMed]
- Naveed, M.; Hejazi, V.; Abbas, M.; Kamboh, A.A.; Khan, G.J.; Shumzaid, M.; Ahmad, F.; Babazadeh, D.; FangFang, X.; Modarresi-Ghazani, F.; et al. Chlorogenic Acid (CGA): A Pharmacological Review and Call for Further Research. Biomed. Pharmacother. 2018, 97, 67–74. [Google Scholar] [CrossRef]
- Zafra-Stone, S.; Yasmin, T.; Bagchi, M.; Chatterjee, A.; Vinson, J.A.; Bagchi, D. Berry Anthocyanins as Novel Antioxidants in Human Health and Disease Prevention. Mol. Nutr. Food Res. 2007, 51, 675–683. [Google Scholar] [CrossRef]
- Olas, B.; Białecki, J.; Urbańska, K.; Bryś, M. The Effects of Natural and Synthetic Blue Dyes on Human Health: A Review of Current Knowledge and Therapeutic Perspectives. Adv. Nutr. 2021, 12, 2301–2311. [Google Scholar] [CrossRef]
- Limsitthichaikoon, S.; Khampaenjiraroch, B.; Damrongrungruang, T.; Limphirat, W.; Thapphasaraphong, S.; Priprem, A. Topical Oral Wound Healing Potential of Anthocyanin Complex: Animal and Clinical Studies. Ther. Deliv. 2018, 9, 359–374. [Google Scholar] [CrossRef]
- Xu, L.; Choi, T.H.; Kim, S.; Kim, S.H.; Chang, H.W.; Choe, M.; Kwon, S.Y.; Hur, J.A.; Shin, S.C.; Chung, J.I.; et al. Anthocyanins from Black Soybean Seed Coat Enhance Wound Healing. Ann. Plast. Surg. 2013, 71, 415–420. [Google Scholar] [CrossRef]
- The European Parliament and of the Council. Regulation (EC) No 1223/2009 of the European Parliament and of the Council of 30 November 2009 on Cosmetic Products (Recast) (Text with EEA Relevance)Text with EEA Relevance; The European Parliament and of the Council: Brussels, Belgium, 2020; Available online: https://eur-lex.europa.eu/eli/reg/2009/1223/oj (accessed on 15 July 2023).
- Chang, S.; Puryear, J.; Cairney, J. A Simple and Efficient Method for Isolating RNA from Pine Trees. Plant Mol. Biol. Report. 1993, 11, 113–116. [Google Scholar] [CrossRef]
- Muller, P.Y.; Janovjak, H.; Miserez, A.R.; Dobbie, Z. Processing of Gene Expression Data Generated by Quantitative Real-Time RT-PCR. BioTechniques 2002, 32, 1378–1379. [Google Scholar]
- Baxter, E.W.; Graham, A.E.; Re, N.A.; Carr, I.M.; Robinson, J.I.; Mackie, S.L.; Morgan, A.W. Standardized Protocols for Differentiation of THP-1 Cells to Macrophages with Distinct M(IFNγ + LPS), M(IL-4) and M(IL-10) Phenotypes. J. Immunol. Methods 2020, 478, 112721. [Google Scholar] [CrossRef] [PubMed]
- Denizot, F.; Lang, R. Rapid Colorimetric Assay for Cell Growth and Survival: Modifications to the Tetrazolium Dye Procedure Giving Improved Sensitivity and Reliability. J. Immunol. Methods 1986, 89, 271–277. [Google Scholar] [CrossRef]
- Brun, P.; Vono, M.; Venier, P.; Tarricone, E.; Deligianni, V.; Martines, E.; Zuin, M.; Spagnolo, S.; Cavazzana, R.; Cardin, R.; et al. Disinfection of Ocular Cells and Tissues by Atmospheric-Pressure Cold Plasma. PLoS ONE 2012, 7, e33245. [Google Scholar] [CrossRef] [PubMed]
- Voltan, S.; Martines, D.; Elli, M.; Brun, P.; Longo, S.; Porzionato, A.; Macchi, V.; D’Incà, R.; Scarpa, M.; Palù, G.; et al. Lactobacillus crispatus M247-Derived H2O2 Acts as a Signal Transducing Molecule Activating Peroxisome Proliferator Activated Receptor-γ in the Intestinal Mucosa. Gastroenterology 2008, 135, 1216–1227. [Google Scholar] [CrossRef] [PubMed]


| MS Ion [M]+ (m/z) | MS/MS Ions [M]+ (m/z) | Theoretical MS [M]+ (m/z) | ppm | Rt (min) | % Anthocyanins (Peak Area/Total Peak Area) | Name | Formula |
|---|---|---|---|---|---|---|---|
| 595.1650 | 287.0569, 449.0889 | 595.1657 | 1.2 | 4.02 | 72.5 | cyanidin 3-rutinoside | C27H31O15+ |
| 627.1507 | 303.0434, 465.0923 | 627.1555 | 7.6 | 5.77 | 10.3 | delphinidin 3,5-diglucoside | C27H31O17+ |
| 611.1566 | 303.0434, 465.0923 | 611.1606 | 6.5 | 6.6 | 10.0 | delphinidin 3-rutinoside | C27H31O16+ |
| 789.2044 | 627.1507, 465.0901 | 789.2084 | 5.1 | 2.12 | 0.7 | delphinidin 3,5,3’-triglucoside | C33H41O22+ |
| 641.1721 | 317.0614, 479.1162 | 641.1712 | 1.4 | 5.21 | 3.8 | petunidin 3,5 diglucoside | C28H33O17+ |
| 317.0687 | 302.0363, 285.0330 | 317.0655 | 10 | 7.43 | 0.6 | petunidin | C16H13O7+ |
| Gene Name | Primer | Sequence (5′ → 3′) | Accession no. (Phytozome/GeneBank) |
|---|---|---|---|
| MYB10.1 | For | CAGGAAGGACAGCGAATGATG | ppa026640m |
| Rev | TCGGGGTTGAGGTCTTATTACG | ||
| bHLH3 | For | TCTTGTTCAGCGTTCCGTTCCT | ppa002884m |
| Rev | TTGGCGCTGAGCTCATCTTGTG | ||
| NtDFR | For | CAGAGAAGGCCGCAATGGAAGC | AB289448 |
| Rev | GGTGGGAATGTAGGCGTGAGGAAT | ||
| NtUFGT | For | CAATGAGTGCATTGGATGCC | FG627024 |
| Rev | CCAGCTCCATTAGGTCCTTG | ||
| NtUBI | For | AGGGAAGCAACTTGAAGATGGA | XM_016614723 |
| Rev | CCCCTCAAACGCAACACC |
Disclaimer/Publisher’s Note: The statements, opinions and data contained in all publications are solely those of the individual author(s) and contributor(s) and not of MDPI and/or the editor(s). MDPI and/or the editor(s) disclaim responsibility for any injury to people or property resulting from any ideas, methods, instructions or products referred to in the content. |
© 2023 by the authors. Licensee MDPI, Basel, Switzerland. This article is an open access article distributed under the terms and conditions of the Creative Commons Attribution (CC BY) license (https://creativecommons.org/licenses/by/4.0/).
Share and Cite
Carpi, A.; Rahim, M.A.; Marin, A.; Armellin, M.; Brun, P.; Miotto, G.; Dal Monte, R.; Trainotti, L. Optimization of Anthocyanin Production in Tobacco Cells. Int. J. Mol. Sci. 2023, 24, 13711. https://doi.org/10.3390/ijms241813711
Carpi A, Rahim MA, Marin A, Armellin M, Brun P, Miotto G, Dal Monte R, Trainotti L. Optimization of Anthocyanin Production in Tobacco Cells. International Journal of Molecular Sciences. 2023; 24(18):13711. https://doi.org/10.3390/ijms241813711
Chicago/Turabian StyleCarpi, Andrea, Md Abdur Rahim, Angela Marin, Marco Armellin, Paola Brun, Giovanni Miotto, Renzo Dal Monte, and Livio Trainotti. 2023. "Optimization of Anthocyanin Production in Tobacco Cells" International Journal of Molecular Sciences 24, no. 18: 13711. https://doi.org/10.3390/ijms241813711