
Corneal Wound Healing in the Presence of Antifibrotic Antibody Targeting Collagen Fibrillogenesis: A Pilot Study


Abstract
:1. Introduction
2. Results
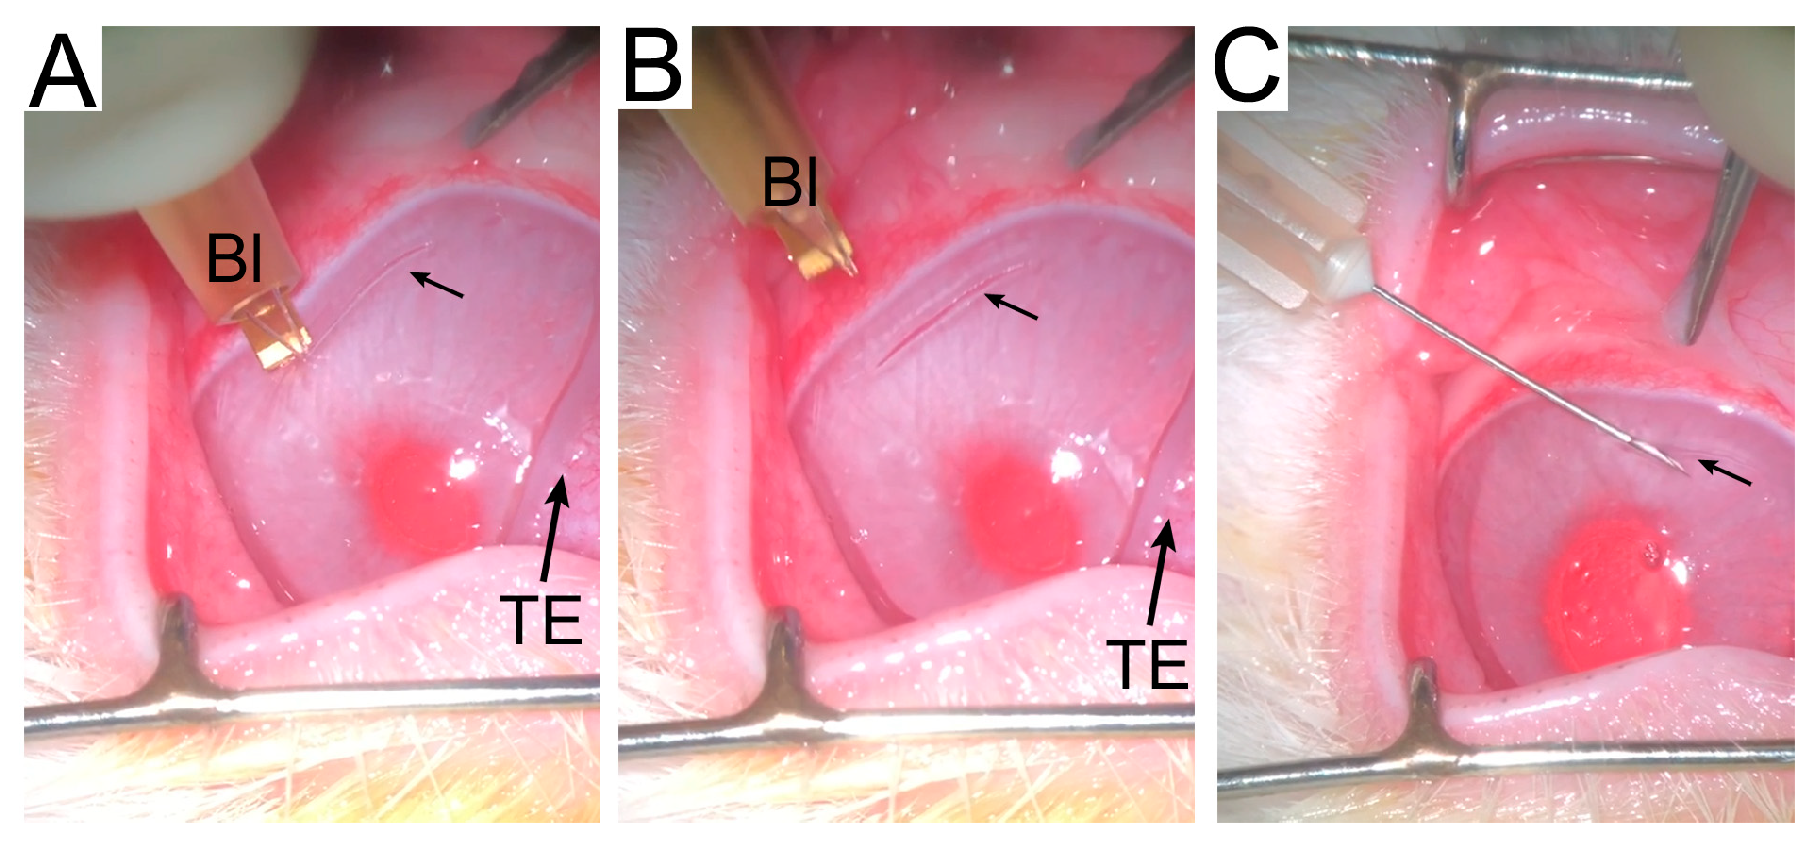
2.1. Animal Model
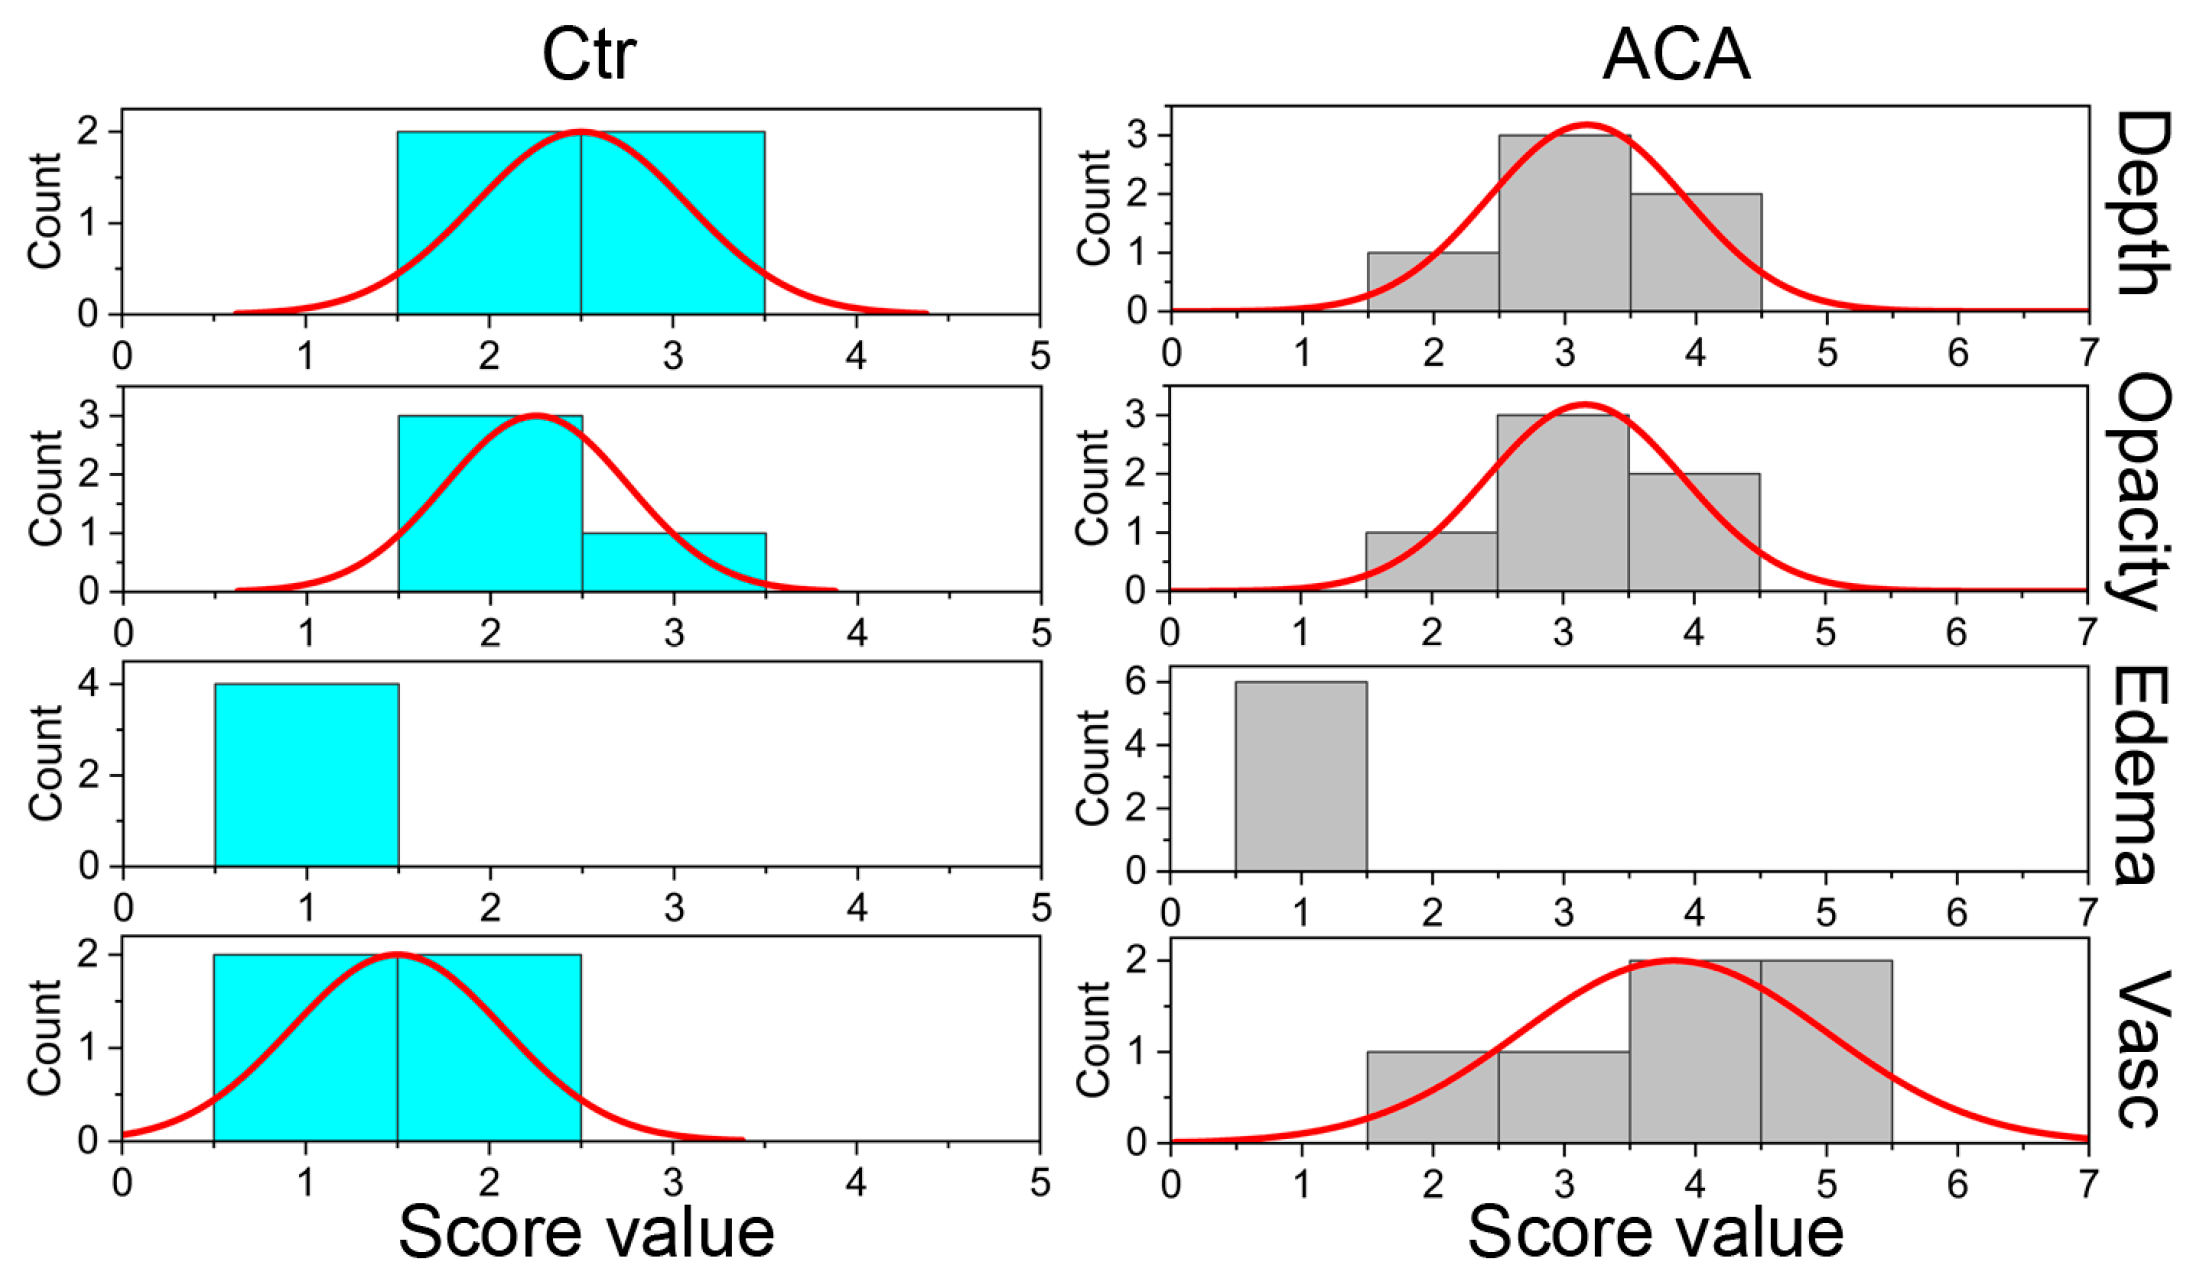
2.2. In-Life Assessment of Corneal Scars
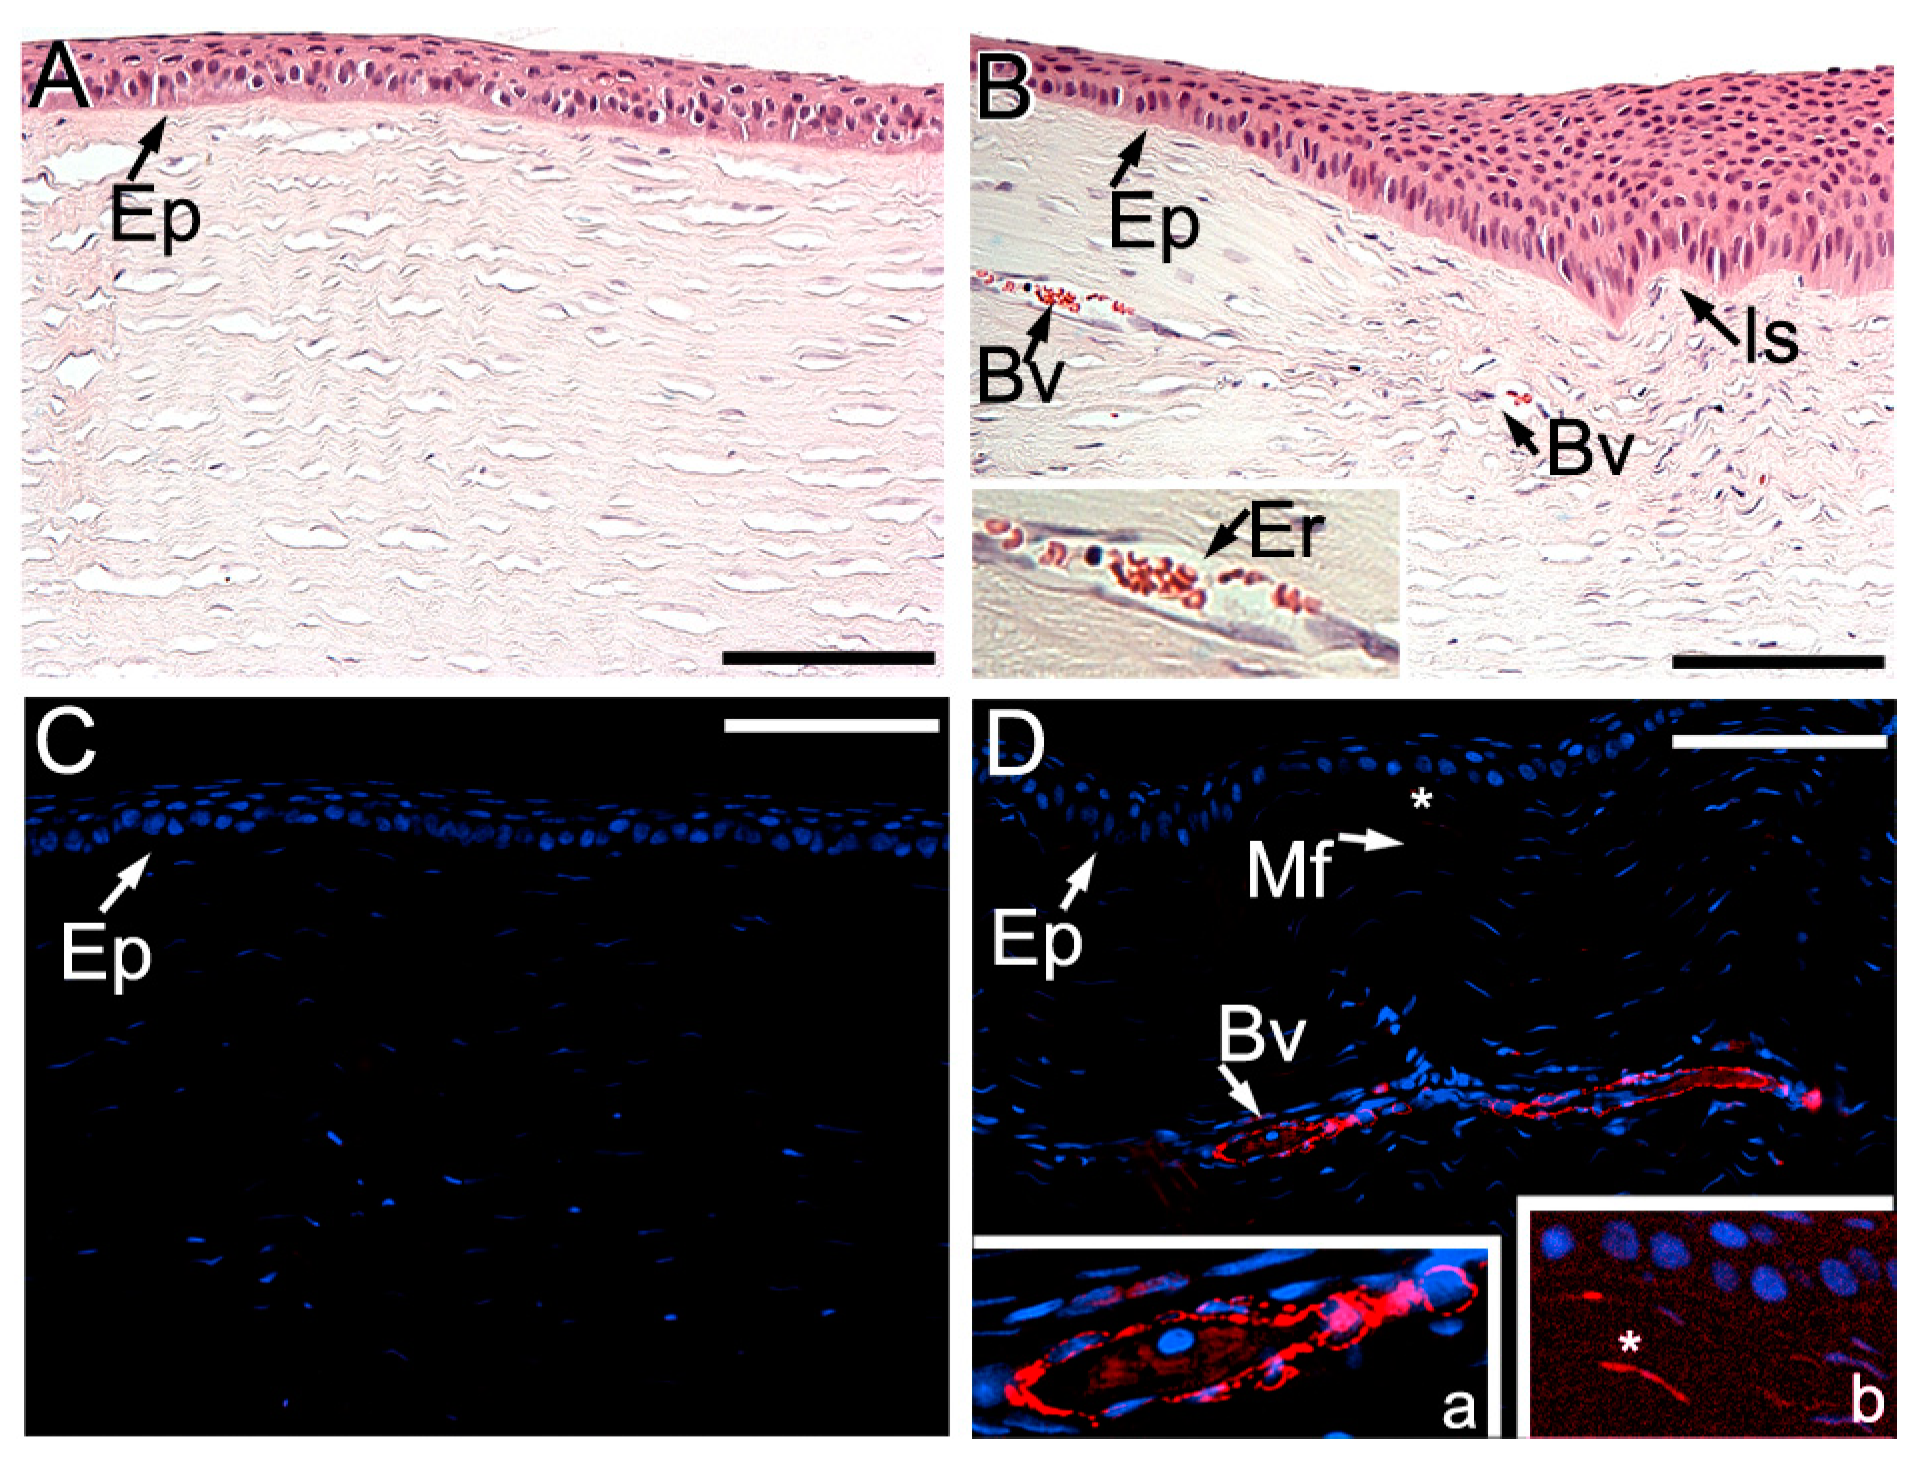
2.3. Histopathology of Injury Sites
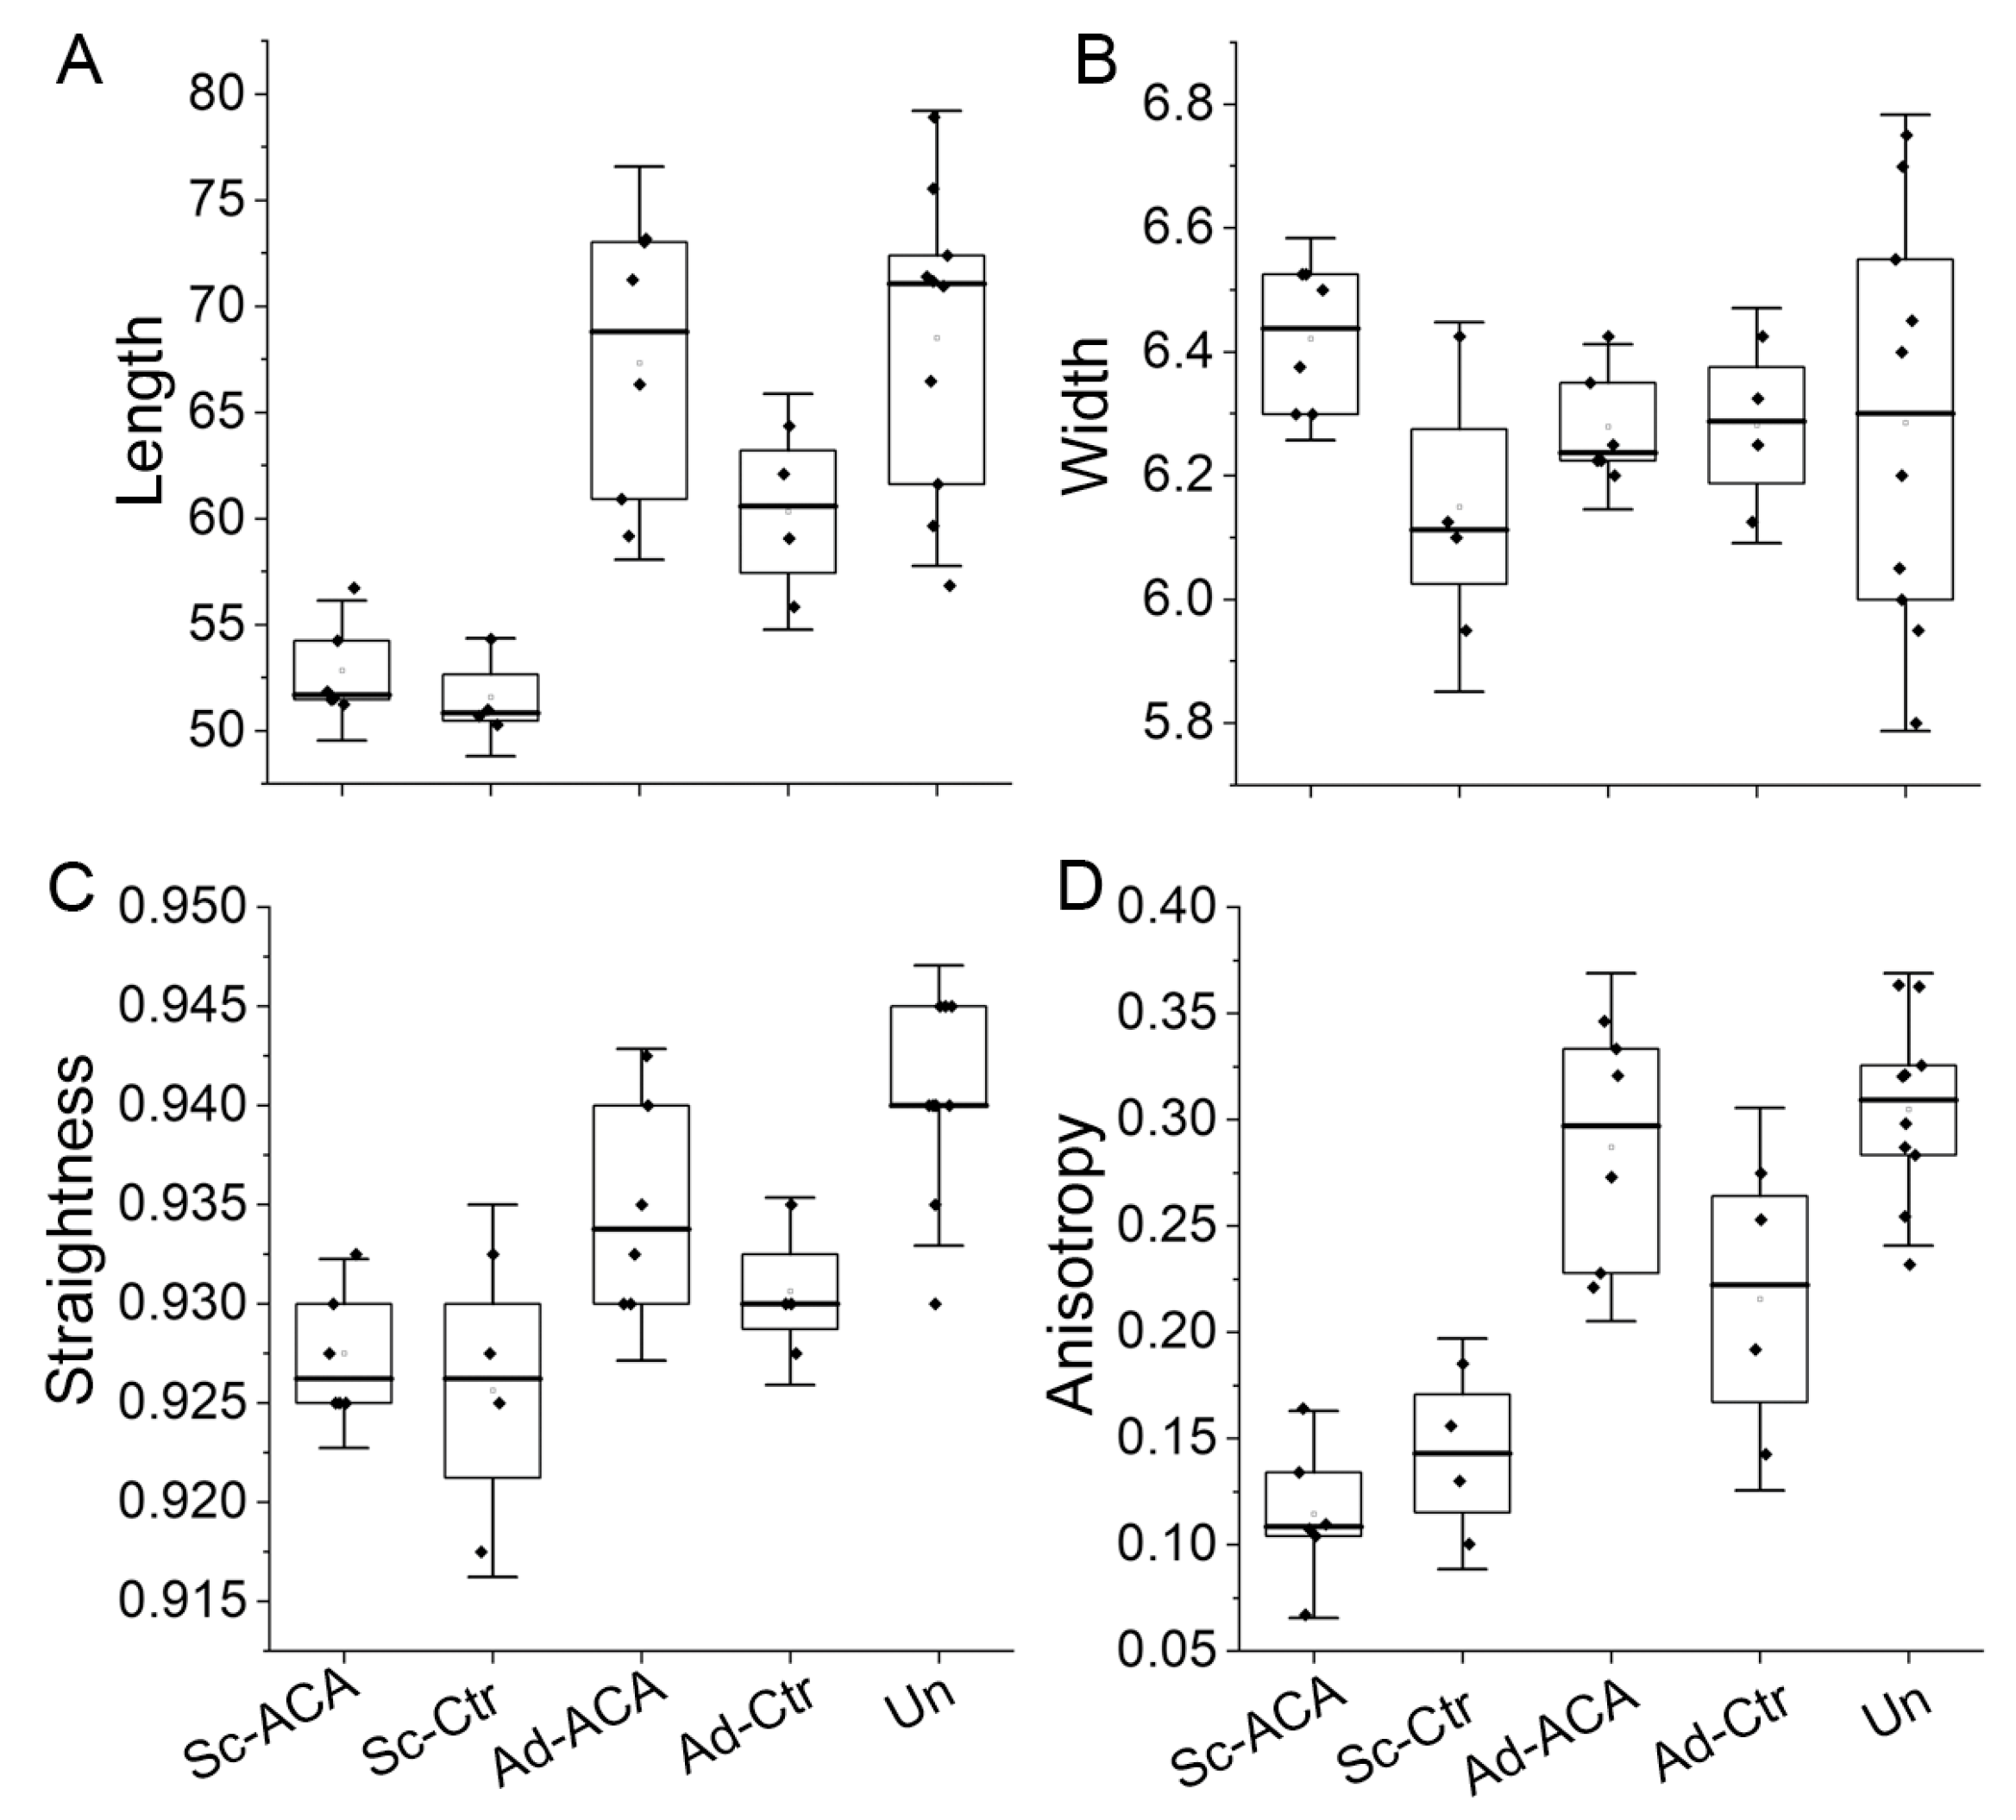
2.4. Collagen Fibrils’ Morphology and Organization
2.4.1. Length
2.4.2. Width
2.4.3. Straightness
2.4.4. Anisotropy of the Fibrils
2.5. Fourier Transform Infrared Spectroscopy (FTIR)-Based Collagen and PG Content Assays
2.5.1. Relative Collagen Content
2.5.2. Relative PG Content
2.6. Two-Dimensional Correlation FTIR Spectroscopy (2DCS)
3. Discussion
3.1. Corneal Scarring
3.2. Antiscarring ACA to Treat Corneal Scarring
3.2.1. In-Life ACA Effects
3.2.2. ACA Effects on ECM Formed at Injury Sites
3.2.3. ACA Impact on the Fibrillar Architecture of Scar Neotissue
3.2.4. Spectroscopic Assays of Scar Neotissue Formed in ACA’s Presence
3.2.5. Limitations and Clinical Implications
4. Materials and Methods
4.1. ACA Preparation
4.2. Surgical Procedure and ACA Application
4.3. Postoperative Monitoring of the Corneas
4.4. Tissue Collection
4.5. Histopathology of the Eyes
4.6. Analysis of Collagen Fibrils’ Morphology and Organization
4.7. Fourier Transform Infrared Spectroscopy (FTIR)-Based Collagen and PG Content Assays
4.8. Two-Dimensional Correlation FTIR Spectroscopy (2DCS)
Author Contributions
Funding
Institutional Review Board Statement
Informed Consent Statement
Data Availability Statement
Acknowledgments
Conflicts of Interest
References
- Siadat, S.M.; Ruberti, J.W. Mechanochemistry of Collagen. Acta Biomater. 2023, 163, 50–62. [Google Scholar] [CrossRef]
- Lee, R.E.; Davison, P.F. Collagen composition and turnover in ocular tissues of the rabbit. Exp. Eye Res. 1981, 32, 737–745. [Google Scholar] [CrossRef] [PubMed]
- Birk, D.E. Type V collagen: Heterotypic type I/V collagen interactions in the regulation of fibril assembly. Micron 2001, 32, 223–237. [Google Scholar] [CrossRef]
- Birk, D.E.; Fitch, J.M.; Babiarz, J.P.; Doane, K.J.; Linsenmayer, T.F. Collagen fibrillogenesis in vitro: Interaction of types I and V collagen regulates fibril diameter. J. Cell Sci. 1990, 95 Pt 4, 649–657. [Google Scholar] [CrossRef] [PubMed]
- Birk, D.E.; Fitch, J.M.; Babiarz, J.P.; Linsenmayer, T.F. Collagen type I and type V are present in the same fibril in the avian corneal stroma. J. Cell Biol. 1988, 106, 999–1008. [Google Scholar] [CrossRef]
- Massoudi, D.; Malecaze, F.; Galiacy, S.D. Collagens and proteoglycans of the cornea: Importance in transparency and visual disorders. Cell Tissue Res. 2016, 363, 337–349. [Google Scholar] [CrossRef]
- Hassell, J.R.; Birk, D.E. The molecular basis of corneal transparency. Exp. Eye Res. 2010, 91, 326–335. [Google Scholar] [CrossRef] [PubMed]
- Komai, Y.; Ushiki, T. The three-dimensional organization of collagen fibrils in the human cornea and sclera. Investig. Ophthalmol. Vis. Sci. 1991, 32, 2244–2258. [Google Scholar]
- Lorenzo-Martín, E.; Gallego-Muñoz, P.; Mar, S.; Fernández, I.; Cidad, P.; Martínez-García, M.C. Dynamic changes of the extracellular matrix during corneal wound healing. Exp. Eye Res. 2019, 186, 107704. [Google Scholar] [CrossRef]
- de Oliveira, R.C.; Wilson, S.E. Fibrocytes, wound healing, and corneal fibrosis. Investig. Ophthalmol. Vis. Sci. 2020, 61, 28. [Google Scholar] [CrossRef]
- Wilson, S.E.; Sampaio, L.P.; Shiju, T.M.; Hilgert, G.S.; de Oliveira, R.C. Corneal opacity: Cell biological determinants of the transition from transparency to transient haze to scarring fibrosis, and resolution, after injury. Investig. Ophthalmol. Vis. Sci. 2022, 63, 22. [Google Scholar] [CrossRef] [PubMed]
- Ljubimov, A.V.; Saghizadeh, M. Progress in corneal wound healing. Prog. Retin. Eye Res. 2015, 49, 17–45. [Google Scholar] [CrossRef]
- Yang, G.N.; Roberts, P.K.; Gardner-Russell, J.; Shah, M.H.; Couper, T.A.; Zhu, Z.; Pollock, G.A.; Dusting, G.J.; Daniell, M. From bench to clinic: Emerging therapies for corneal scarring. Pharmacol. Ther. 2023, 242, 108349. [Google Scholar] [CrossRef]
- Castelli, M.S.; McGonigle, P.; Hornby, P.J. The pharmacology and therapeutic applications of monoclonal antibodies. Pharmacol. Res. Perspect. 2019, 7, e00535. [Google Scholar] [CrossRef]
- Selkoe, D.J. Alzheimer disease and aducanumab: Adjusting our approach. Nat. Rev. Neurol. 2019, 15, 365–366. [Google Scholar] [CrossRef]
- Zahavi, D.; Weiner, L. Monoclonal antibodies in cancer therapy. Antibodies 2020, 9, 34. [Google Scholar] [CrossRef]
- Wang, Z.; Wang, G.; Lu, H.; Li, H.; Tang, M.; Tong, A. Development of therapeutic antibodies for the treatment of diseases. Mol. Biomed. 2022, 3, 35. [Google Scholar] [CrossRef] [PubMed]
- Rodrigues, E.B.; Farah, M.E.; Maia, M.; Penha, F.M.; Regatieri, C.; Melo, G.B.; Pinheiro, M.M.; Zanetti, C.R. Therapeutic monoclonal antibodies in ophthalmology. Prog. Retin. Eye Res. 2009, 28, 117–144. [Google Scholar] [CrossRef] [PubMed]
- Fertala, J.; Wang, M.L.; Rivlin, M.; Beredjiklian, P.K.; Abboud, J.; Arnold, W.V.; Fertala, A. Extracellular Targets to Reduce Excessive Scarring in Response to Tissue Injury. Biomolecules 2023, 13, 758. [Google Scholar] [CrossRef]
- Chung, H.J.; Steplewski, A.; Chung, K.Y.; Uitto, J.; Fertala, A. Collagen fibril formation: A new target to limit fibrosis. J. Biol. Chem. 2008, 283, 25879–25886. [Google Scholar] [CrossRef]
- Fertala, J.; Steplewski, A.; Kostas, J.; Beredjiklian, P.; Williams, G.; Arnold, W.; Abboud, J.; Bhardwaj, A.; Hou, C.; Fertala, A. Engineering and characterization of the chimeric antibody that targets the C-terminal telopeptide of the alpha2 chain of human collagen I: A next step in the quest to reduce localized fibrosis. Connect Tissue Res. 2013, 54, 187–196. [Google Scholar] [CrossRef] [PubMed]
- Steplewski, A.; Fertala, J.; Tomlinson, R.E.; Wang, M.L.; Donahue, A.; Arnold, W.V.; Rivlin, M.; Beredjiklian, P.K.; Abboud, J.A.; Namdari, S.; et al. Mechanisms of reducing joint stiffness by blocking collagen fibrillogenesis in a rabbit model of posttraumatic arthrofibrosis. PLoS ONE 2021, 16, e0257147. [Google Scholar] [CrossRef]
- Steplewski, A.; Fertala, J.; Beredjiklian, P.K.; Abboud, J.A.; Wang, M.L.Y.; Namdari, S.; Barlow, J.; Rivlin, M.; Arnold, W.V.; Kostas, J.; et al. Blocking collagen fibril formation in injured knees reduces flexion contracture in a rabbit model. J. Orthop. Res. 2017, 35, 1038–1046. [Google Scholar] [CrossRef] [PubMed]
- Barrientez, B.; Nicholas, S.E.; Whelchel, A.; Sharif, R.; Hjortdal, J.; Karamichos, D. Corneal injury: Clinical and molecular aspects. Exp. Eye Res. 2019, 186, 107709. [Google Scholar] [CrossRef]
- Boudaoud, A.; Burian, A.; Borowska-Wykret, D.; Uyttewaal, M.; Wrzalik, R.; Kwiatkowska, D.; Hamant, O. FibrilTool, an ImageJ plug-in to quantify fibrillar structures in raw microscopy images. Nat. Protoc. 2014, 9, 457–463. [Google Scholar] [CrossRef]
- Schneider, C.A.; Rasband, W.S.; Eliceiri, K.W. NIH Image to ImageJ: 25 years of image analysis. Nat. Methods 2012, 9, 671–675. [Google Scholar] [CrossRef] [PubMed]
- Shukla, A.G.; Milman, T.; Fertala, J.; Steplewski, A.; Fertala, A. Scar formation in the presence of mitomycin C and the anti-fibrotic antibody in a rabbit model of glaucoma microsurgery: A pilot study. Heliyon 2023, 9, e15368. [Google Scholar] [CrossRef] [PubMed]
- Wilson, S.E.; Mohan, R.R.; Mohan, R.R.; Ambrosio, R., Jr.; Hong, J.; Lee, J. The corneal wound healing response:: Cytokine-mediated interaction of the epithelium, stroma, and inflammatory cells. Prog. Retin. Eye Res. 2001, 20, 625–637. [Google Scholar] [CrossRef]
- Jester, J.V.; Petroll, W.M.; Cavanagh, H.D. Corneal stromal wound healing in refractive surgery: The role of myofibroblasts. Prog. Retin. Eye Res. 1999, 18, 311–356. [Google Scholar] [CrossRef]
- Zhou, H.Y.; Cao, Y.; Wu, J.; Zhang, W.S. Role of corneal collagen fibrils in corneal disorders and related pathological conditions. Int. J. Ophthalmol. 2017, 10, 803–811. [Google Scholar]
- Meek, K.M.; Leonard, D.W.; Connon, C.J.; Dennis, S.; Khan, S. Transparency, swelling and scarring in the corneal stroma. Eye 2003, 17, 927–936. [Google Scholar] [CrossRef] [PubMed]
- Yang, C.J.; Nguyen, D.D.; Lai, J.Y. Poly (l-Histidine)-Mediated On-Demand Therapeutic Delivery of Roughened Ceria Nanocages for Treatment of Chemical Eye Injury. Adv. Sci. 2023, e2302174. [Google Scholar] [CrossRef]
- Deshmukh, R.; Reddy, J.C.; Rapuano, C.J.; Vaddavalli, P.K. Phototherapeutic keratectomy: Indications, methods and decision making. Indian J. Ophthalmol. 2020, 68, 2856–2866. [Google Scholar] [PubMed]
- Rahman, I.; Carley, F.; Hillarby, C.; Brahma, A.; Tullo, A.B. Penetrating keratoplasty: Indications, outcomes, and complications. Eye 2009, 23, 1288–1294. [Google Scholar] [CrossRef]
- Lynch, C.M.; Hart, B.W.; Grewal, I.S. Practical considerations for nonclinical safety evaluation of therapeutic monoclonal antibodies. MAbs 2009, 1, 2–11. [Google Scholar] [CrossRef] [PubMed]
- Guidance for Industry; Preclinical Safety Evaluation of Biotechnology-Derived Pharmaceuticals. Available online: https://www.fda.gov/regulatory-information/search-fda-guidance-documents/s6-preclinical-safety-evaluation-biotechnology-derived-pharmaceuticals (accessed on 20 June 2023).
- Bettelheim, F.A.; Plessy, B. The hydration of proteoglycans of bovine cornea. Biochim. Biophys. Acta (BBA)-Gen. Subj. 1975, 381, 203–214. [Google Scholar] [CrossRef]
- Borcherding, M.S.; Blacik, L.; Sittig, R.; Bizzell, J.W.; Breen, M.; Weinstein, H. Proteoglycans and collagen fibre organization in human corneoscleral tissue. Exp. Eye Res. 1975, 21, 59–70. [Google Scholar] [CrossRef]
- Müller, L.J.; Pels, E.; Schurmans, L.R.; Vrensen, G.F. A new three-dimensional model of the organization of proteoglycans and collagen fibrils in the human corneal stroma. Exp. Eye Res. 2004, 78, 493–501. [Google Scholar] [CrossRef]
- Dawson, D.G.; Kramer, T.R.; Grossniklaus, H.E.; Waring, G.O.; Edelhauser, H.F. Histologic, ultrastructural, and immunofluorescent evaluation of human laser-assisted in situ keratomileusis corneal wounds. Arch. Ophthalmol. 2005, 123, 741–756. [Google Scholar] [CrossRef]
- Castoro, J.A.; Bettelheim, A.A.; Bettelheim, F. Water gradients across bovine cornea. Investig. Ophthalmol. Vis. Sci. 1988, 29, 963–968. [Google Scholar]
- Puri, S.; Coulson-Thomas, Y.M.; Gesteira, T.F.; Coulson-Thomas, V.J. Distribution and function of glycosaminoglycans and proteoglycans in the development, homeostasis and pathology of the ocular surface. Front. Cell Dev. Biol. 2020, 8, 731. [Google Scholar] [CrossRef] [PubMed]
- Funderburgh, J.L.; Chandler, J. Proteoglycans of rabbit corneas with nonperforating wounds. Investig. Ophthalmol. Vis. Sci. 1989, 30, 435–442. [Google Scholar]
- Akhtar, S.; Bron, A.J.; Salvi, S.M.; Hawksworth, N.R.; Tuft, S.J.; Meek, K.M. Ultrastructural analysis of collagen fibrils and proteoglycans in keratoconus. Acta Ophthalmol. 2008, 86, 764–772. [Google Scholar] [CrossRef]
- Quantock, A.; Meek, K.; Fullwood, N.; Zabel, R. Scheie’s syndrome: The architecture of corneal collagen and distribution of corneal proteoglycans. Can. J. Ophthalmol. 1993, 28, 266–272. [Google Scholar]
- Meek, K.M.; Boote, C. The use of X-ray scattering techniques to quantify the orientation and distribution of collagen in the corneal stroma. Prog. Retin. Eye Res. 2009, 28, 369–392. [Google Scholar] [CrossRef]
- Fertala, J.; Rivlin, M.; Wang, M.L.; Beredjiklian, P.K.; Steplewski, A.; Fertala, A. Collagen-rich deposit formation in the sciatic nerve after injury and surgical repair: A study of collagen-producing cells in a rabbit model. Brain Behav. 2020, 10, e01802. [Google Scholar] [CrossRef]
- Junqueira, L.C.; Bignolas, G.; Brentani, R.R. Picrosirius staining plus polarization microscopy, a specific method for collagen detection in tissue sections. Histochem. J. 1979, 11, 447–455. [Google Scholar] [CrossRef] [PubMed]
- Rich, L.; Whittaker, P. Collagen and picrosirius red staining: A polarized light assessment of fibrillar hue and spatial distribution. J. Morphol. Sci. 2005, 22, 97–104. [Google Scholar]
- Bredfeldt, J.S.; Liu, Y.; Pehlke, C.A.; Conklin, M.W.; Szulczewski, J.M.; Inman, D.R.; Keely, P.J.; Nowak, R.D.; Mackie, T.R.; Eliceiri, K.W. Computational segmentation of collagen fibers from second-harmonic generation images of breast cancer. J. Biomed. Opt. 2014, 19, 16007. [Google Scholar] [CrossRef]
- Stein, A.M.; Vader, D.A.; Jawerth, L.M.; Weitz, D.A.; Sander, L.M. An algorithm for extracting the network geometry of three-dimensional collagen gels. J. Microsc. 2008, 232, 463–475. [Google Scholar] [CrossRef]
- Wu, J.; Rajwa, B.; Filmer, D.L.; Hoffmann, C.M.; Yuan, B.; Chiang, C.-S.; Sturgis, J.; Robinson, J.P. Analysis of orientations of collagen fibers by novel fiber-tracking software. Microsc. Microanal. 2003, 9, 574–580. [Google Scholar] [CrossRef]
- Baker, M.J.; Trevisan, J.; Bassan, P.; Bhargava, R.; Butler, H.J.; Dorling, K.M.; Fielden, P.R.; Fogarty, S.W.; Fullwood, N.J.; Heys, K.A.; et al. Using Fourier transform IR spectroscopy to analyze biological materials. Nat. Protoc. 2014, 9, 1771–1791. [Google Scholar] [CrossRef]
- Querido, W.; Kandel, S.; Pleshko, N. Applications of Vibrational Spectroscopy for Analysis of Connective Tissues. Molecules 2021, 26, 922. [Google Scholar] [CrossRef] [PubMed]
- Camacho, N.P.; West, P.; Torzilli, P.A.; Mendelsohn, R. FTIR microscopic imaging of collagen and proteoglycan in bovine cartilage. Biopolymers 2001, 62, 1–8. [Google Scholar] [CrossRef]
- Jayasuriya, A.C.; Scheinbeim, J.I.; Lubkin, V.; Bennett, G.; Kramer, P. Piezoelectric and mechanical properties in bovine cornea. J. Biomed. Mater. Res. A 2003, 66, 260–265. [Google Scholar] [CrossRef]
- Cheheltani, R.; Rosano, J.M.; Wang, B.; Sabri, A.K.; Pleshko, N.; Kiani, M.F. Fourier transform infrared spectroscopic imaging of cardiac tissue to detect collagen deposition after myocardial infarction. J. Biomed. Opt. 2012, 17, 056014. [Google Scholar] [CrossRef] [PubMed]
- Steplewski, A.; Fertala, J.; Tomlinson, R.; Hoxha, K.; Han, L.; Thakar, O.; Klein, J.; Abboud, J.; Fertala, A. The impact of cholesterol deposits on the fibrillar architecture of the Achilles tendon in a rabbit model of hypercholesterolemia. J. Orthop. Surg. Res. 2019, 14, 172. [Google Scholar] [CrossRef]
- Vidal, B.d.C.; Mello, M.L.S. FT-IR microspectroscopy of rat ear cartilage. PLoS ONE 2016, 11, e0151989. [Google Scholar] [CrossRef] [PubMed]
- Rieppo, L.; Saarakkala, S.; Narhi, T.; Helminen, H.J.; Jurvelin, J.S.; Rieppo, J. Application of second derivative spectroscopy for increasing molecular specificity of Fourier transform infrared spectroscopic imaging of articular cartilage. Osteoarthr. Cartil. 2012, 20, 451–459. [Google Scholar] [CrossRef]
- Gieroba, B.; Przekora, A.; Kalisz, G.; Kazimierczak, P.; Song, C.L.; Wojcik, M.; Ginalska, G.; Kazarian, S.G.; Sroka-Bartnicka, A. Collagen maturity and mineralization in mesenchymal stem cells cultured on the hydroxyapatite-based bone scaffold analyzed by ATR-FTIR spectroscopic imaging. Mater. Sci. Eng. C Mater. Biol. Appl. 2021, 119, 111634. [Google Scholar] [CrossRef]
- Noda, I. Generalized two-dimensional correlation method applicable to infrared, Raman, and other types of spectroscopy. Appl. Spectrosc. 1993, 47, 1329–1336. [Google Scholar] [CrossRef]
- Noda, I.; Dowrey, A.; Marcott, C.; Story, G.; Ozaki, Y. Generalized two-dimensional correlation spectroscopy. Appl. Spectrosc. 2000, 54, 236A–248A. [Google Scholar] [CrossRef]
- Noda, I. Techniques of two-dimensional (2D) correlation spectroscopy useful in life science research. Biomed. Spectrosc. Imaging 2015, 4, 109–127. [Google Scholar] [CrossRef]


| Scar Parameter | Grading Scores | ||||
|---|---|---|---|---|---|
| 1 | 2 | 3 | 4 | 5 | |
| Depth | Absent | Superficial ¼ of the cornea | Superficial ½ of the cornea | Superficial ¾ of the cornea | Full thickness |
| Opacity | Absent | Faint haze | Mild opacification | Moderate opacification | Severe opacification |
| Edema | Absent | Faint | Mild | Moderate | Severe |
| Vascularization | Absent | Vessels approaching but not reaching the incision edge | Vessels reaching but not crossing the incision edge | Vessels crossing the incision edge but with a minimal extension on the distal side | Vessels extending on both sides of the incision |
| Mann–Whitney U Test Parameters | Injury Site Parameter | |||||
|---|---|---|---|---|---|---|
| Depth a | Opacity a | Edema a | Vascularization a | Fibrosis b | Inflammation b | |
| Mann–Whitney U | 6.0 | 4.0 | 12.0 | 1.0 | 5.0 | 0.0 |
| Z | −1.389 | −1.826 | 0.0 | −2.397 | −1.845 | −2.711 |
| p | 0.165 | 0.068 | 1.0 | 0.017 | 0.065 | 0.007 |
| Mean ranks: Ctr; ACA | 4.00; 6.50 | 3.50; 6.83 | 5.50; 5.50 | 2.75; 7.33 | 3.75; 6.67 | 2.50; 7.50 |
Disclaimer/Publisher’s Note: The statements, opinions and data contained in all publications are solely those of the individual author(s) and contributor(s) and not of MDPI and/or the editor(s). MDPI and/or the editor(s) disclaim responsibility for any injury to people or property resulting from any ideas, methods, instructions or products referred to in the content. |
© 2023 by the authors. Licensee MDPI, Basel, Switzerland. This article is an open access article distributed under the terms and conditions of the Creative Commons Attribution (CC BY) license (https://creativecommons.org/licenses/by/4.0/).
Share and Cite
Syed, Z.A.; Milman, T.; Fertala, J.; Steplewski, A.; Fertala, A. Corneal Wound Healing in the Presence of Antifibrotic Antibody Targeting Collagen Fibrillogenesis: A Pilot Study. Int. J. Mol. Sci. 2023, 24, 13438. https://doi.org/10.3390/ijms241713438
Syed ZA, Milman T, Fertala J, Steplewski A, Fertala A. Corneal Wound Healing in the Presence of Antifibrotic Antibody Targeting Collagen Fibrillogenesis: A Pilot Study. International Journal of Molecular Sciences. 2023; 24(17):13438. https://doi.org/10.3390/ijms241713438
Chicago/Turabian StyleSyed, Zeba A., Tatyana Milman, Jolanta Fertala, Andrzej Steplewski, and Andrzej Fertala. 2023. "Corneal Wound Healing in the Presence of Antifibrotic Antibody Targeting Collagen Fibrillogenesis: A Pilot Study" International Journal of Molecular Sciences 24, no. 17: 13438. https://doi.org/10.3390/ijms241713438