
Underfeeding Alters Brain Tissue Synthesis Rate in a Rat Brain Injury Model
 , , ,
, , ,
Abstract
:1. Introduction
2. Results
2.1. Behavioral Changes Due to BI
2.2. Underfeeding Causes a Suppression of Protein Synthesis in Specific Tissue Regions
2.3. BI Causes an Increase in Protein Synthesis in the Cortical Regions of the Brain
2.4. Adequate Nutrition Normalizes Protein Synthesis Post-Injury
2.5. The Relationship between Underfeeding and fSR, Evidence That UF+BI Leads to an Altered Protein Partitioning
3. Discussion
3.1. Clinical Ramifications of Acute Underfeeding Post-Injury
3.2. Changes in Brain Region Protein Dynamics Post-BI
3.3. Limitations
4. Materials and Methods
4.1. Overall Study Design
4.2. Brain Injury Model
4.3. Labeled Water and Body Water Enrichment Analysis
4.4. Tissue Isolation
4.5. Measuring Protein Fractional Synthesis Rate
4.6. Statistical Analyses
5. Conclusions
Author Contributions
Funding
Institutional Review Board Statement
Informed Consent Statement
Acknowledgments
Conflicts of Interest
References
- Peterson, A.B.; Thomas, K.E.; Zhou, H. Surveillance Report of Traumatic Brain Injury-Related Deaths by Age Group, Sex, and Mechanism of Injury—United States, 2018 and 2019; Centers for Disease Control and Prevention, US Department of Health and Human Services: Washington, DC, USA, 2022.
- Peterson, A.B.; Xu, L.; Daugherty, J.; Breiding, M.J. Surveillance Report of Traumatic Brain Injury-Related Emergency Department Visits, Hospitalizations, and Deaths, United States, 2014; Centers for Disease Control and Prevention, US Department of Health and Human Services: Washington, DC, USA, 2019.
- Amyot, F.; Kenney, K.; Moore, C.; Haber, M.; Turtzo, L.C.; Shenouda, C.; Silverman, E.; Gong, Y.; Qu, B.-X.; Harburg, L. Imaging of cerebrovascular function in chronic traumatic brain injury. J. Neurotrauma 2018, 35, 1116–1123. [Google Scholar] [CrossRef] [PubMed]
- TalavageThomas, M.; NaumanEric, A.; BreedloveEvan, L.; DyeAnne, E.; MorigakiKatherine, E.; LeverenzLarry, J. Functionally-detected cognitive impairment in high school football players without clinically-diagnosed concussion. J. Neurotrauma 2014, 31, 327–338. [Google Scholar]
- Veksler, R.; Vazana, U.; Serlin, Y.; Prager, O.; Ofer, J.; Shemen, N.; Fisher, A.M.; Minaeva, O.; Hua, N.; Saar-Ashkenazy, R. Slow blood-to-brain transport underlies enduring barrier dysfunction in American football players. Brain 2020, 143, 1826–1842. [Google Scholar] [CrossRef]
- Rattanachaiwong, S.; Singer, P. Indirect calorimetry as point of care testing. Clin. Nutr. 2019, 38, 2531–2544. [Google Scholar] [CrossRef]
- McEvoy, C.T.; Cran, G.W.; Cooke, S.R.; Young, I.S. Resting energy expenditure in non-ventilated, non-sedated patients recovering from serious traumatic brain injury: Comparison of prediction equations with indirect calorimetry values. Clin. Nutr. 2009, 28, 526–532. [Google Scholar] [CrossRef] [PubMed]
- Pepe, J.L.; Barba, C.A. The metabolic response to acute traumatic brain injury and implications for nutritional support. J. Head Trauma Rehabil. 1999, 14, 462–474. [Google Scholar] [CrossRef]
- Glenn, T.C.; Martin, N.A.; McArthur, D.L.; Hovda, D.A.; Vespa, P.; Johnson, M.L.; Horning, M.A.; Brooks, G.A. Endogenous nutritive support after traumatic brain injury: Peripheral lactate production for glucose supply via gluconeogenesis. J. Neurotrauma 2015, 32, 811–819. [Google Scholar] [CrossRef] [PubMed]
- Charrueau, C.; Belabed, L.; Besson, V.; Chaumeil, J.-C.; Cynober, L.; Moinard, C. Metabolic response and nutritional support in traumatic brain injury: Evidence for resistance to renutrition. J. Neurotrauma 2009, 26, 1911–1920. [Google Scholar] [CrossRef]
- Moinard, C.; Neveux, N.; Royo, N.; Genthon, C.; Marchand-Verrecchia, C.; Plotkine, M.; Cynober, L. Characterization of the alteration of nutritional state in brain injury induced by fluid percussion in rats. Intensive Care Med. 2005, 31, 281–288. [Google Scholar] [CrossRef]
- Shi, J.; Dong, B.; Mao, Y.; Guan, W.; Cao, J.; Zhu, R.; Wang, S. Traumatic brain injury and hyperglycemia, a potentially modifiable risk factor. Oncotarget 2016, 7, 71052. [Google Scholar] [CrossRef]
- Maxwell, J.; Gwardschaladse, C.; Lombardo, G.; Petrone, P.; Policastro, A.; Karev, D.; Prabhakaran, K.; Betancourt, A.; Marini, C. The impact of measurement of respiratory quotient by indirect calorimetry on the achievement of nitrogen balance in patients with severe traumatic brain injury. Eur. J. Trauma Emerg. Surg. 2017, 43, 775–782. [Google Scholar] [CrossRef] [PubMed]
- Dickerson, R.N.; Pitts, S.L.; Maish, G.O., III; Schroeppel, T.J.; Magnotti, L.J.; Croce, M.A.; Minard, G.; Brown, R.O. A reappraisal of nitrogen requirements for patients with critical illness and trauma. J. Trauma Acute Care Surg. 2012, 73, 549–557. [Google Scholar] [CrossRef] [PubMed]
- Glenn, T.C.; Martin, N.A.; Horning, M.A.; McArthur, D.L.; Hovda, D.A.; Vespa, P.; Brooks, G.A. Lactate: Brain fuel in human traumatic brain injury: A comparison with normal healthy control subjects. J. Neurotrauma 2015, 32, 820–832. [Google Scholar] [CrossRef]
- Shlosberg, D.; Benifla, M.; Kaufer, D.; Friedman, A. Blood–brain barrier breakdown as a therapeutic target in traumatic brain injury. Nat. Rev. Neurol. 2010, 6, 393–403. [Google Scholar] [CrossRef]
- Kim, S.Y.; Senatorov, V.V.; Morrissey, C.S.; Lippmann, K.; Vazquez, O.; Milikovsky, D.Z.; Gu, F.; Parada, I.; Prince, D.A.; Becker, A.J. TGFβ signaling is associated with changes in inflammatory gene expression and perineuronal net degradation around inhibitory neurons following various neurological insults. Sci. Rep. 2017, 7, 7711. [Google Scholar] [CrossRef]
- Senatorov Jr, V.V.; Friedman, A.R.; Milikovsky, D.Z.; Ofer, J.; Saar-Ashkenazy, R.; Charbash, A.; Jahan, N.; Chin, G.; Mihaly, E.; Lin, J.M. Blood-brain barrier dysfunction in aging induces hyperactivation of TGFβ signaling and chronic yet reversible neural dysfunction. Sci. Transl. Med. 2019, 11, eaaw8283. [Google Scholar] [CrossRef] [PubMed]
- Curl, C.C.; Kumar, A.; Peck, A.J.; Arevalo, J.A.; Gleason, A.; Leija, R.G.; Osmond, A.D.; Duong, J.J.; Miller, B.F.; Horning, M.A.; et al. Fractional Gluconeogenesis: A Biomarker of Dietary Energy Adequacy in a Rat Brain Injury Model. Metabolites 2022, 12, 1163. [Google Scholar] [CrossRef]
- Bodsch, W.; Takahashi, K.; Barbier, A.; Ophoff, B.G.; Hossmann, K.-A. Cerebral protein synthesis and ischemia. Prog. Brain Res. 1985, 63, 197–210. [Google Scholar]
- Dienel, G.; Pulsinelli, W.; Duffy, T. Regional protein synthesis in rat brain following acute hemispheric ischemia. J. Neurochem. 1980, 35, 1216–1226. [Google Scholar] [CrossRef]
- Bouma, G.J.; Muizelaar, J.P.; Choi, S.C.; Newlon, P.G.; Young, H.F. Cerebral circulation and metabolism after severe traumatic brain injury: The elusive role of ischemia. J. Neurosurg. 1991, 75, 685–693. [Google Scholar] [CrossRef]
- Stiefel, M.F.; Tomita, Y.; Marmarou, A. Secondary ischemia impairing the restoration of ion homeostasis following traumatic brain injury. J. Neurosurg. 2005, 103, 707–714. [Google Scholar] [CrossRef]
- Vespa, P.; Bergsneider, M.; Hattori, N.; Wu, H.-M.; Huang, S.-C.; Martin, N.A.; Glenn, T.C.; McArthur, D.L.; Hovda, D.A. Metabolic crisis without brain ischemia is common after traumatic brain injury: A combined microdialysis and positron emission tomography study. J. Cereb. Blood Flow Metab. 2005, 25, 763–774. [Google Scholar] [CrossRef]
- Glenn, T.C.; Kelly, D.F.; Boscardin, W.J.; McArthur, D.L.; Vespa, P.; Oertel, M.; Hovda, D.A.; Bergsneider, M.; Hillered, L.; Martin, N.A. Energy dysfunction as a predictor of outcome after moderate or severe head injury: Indices of oxygen, glucose, and lactate metabolism. J. Cereb. Blood Flow Metab. 2003, 23, 1239–1250. [Google Scholar] [CrossRef]
- Calloway, D.H.; Spector, H. Nitrogen balance as related to caloric and protein intake in active young men. Am. J. Clin. Nutr. 1954, 2, 405–412. [Google Scholar] [CrossRef]
- Rosenthal, H.L.; Allison, J. Dietary Energy Requirements, Effects of Caloric Intake on Nitrogen Balance and Organ Composition of Adult Rats. J. Agric. Food Chem. 1956, 4, 792–796. [Google Scholar] [CrossRef]
- Oxfeldt, M.; Phillips, S.M.; Andersen, O.E.; Johansen, F.T.; Bangshaab, M.; Risikesan, J.; McKendry, J.; Melin, A.K.; Hansen, M. Low energy availability reduces myofibrillar and sarcoplasmic muscle protein synthesis in trained females. J. Physiol. 2003, 601, 3481–3497. [Google Scholar] [CrossRef]
- Yuan, C.L.; Sharma, N.; Gilge, D.A.; Stanley, W.C.; Li, Y.; Hatzoglou, M.; Previs, S.F. Preserved protein synthesis in the heart in response to acute fasting and chronic food restriction despite reductions in liver and skeletal muscle. Am. J. Physiol.-Endocrinol. Metab. 2008, 295, E216–E222. [Google Scholar] [CrossRef]
- Todd, K.S.; Butterfield, G.E.; Calloway, D.H. Nitrogen balance in men with adequate and deficient energy intake at three levels of work. J. Nutr. 1984, 114, 2107–2118. [Google Scholar] [CrossRef]
- Pessoa, L. Understanding brain networks and brain organization. Phys. Life Rev. 2014, 11, 400–435. [Google Scholar] [CrossRef]
- Pascual-Leone, A.; Amedi, A.; Fregni, F.; Merabet, L.B. The plastic human brain cortex. Annu. Rev. Neurosci. 2005, 28, 377–401. [Google Scholar] [CrossRef]
- Pellerin, L.; Magistretti, P.J. Glutamate uptake into astrocytes stimulates aerobic glycolysis: A mechanism coupling neuronal activity to glucose utilization. Proc. Natl. Acad. Sci. USA 1994, 91, 10625–10629. [Google Scholar] [CrossRef] [PubMed]
- Schurr, A. Lactate: The ultimate cerebral oxidative energy substrate? J. Cereb. Blood Flow Metab. 2006, 26, 142–152. [Google Scholar] [CrossRef] [PubMed]
- Brooks, G.A. The lactate shuttle during exercise and recovery. Med. Sci. Sports Exerc. 1986, 18, 360–368. [Google Scholar] [CrossRef]
- Brooks, G.A.; Arevalo, J.A.; Osmond, A.D.; Leija, R.G.; Curl, C.C.; Tovar, A.P. Lactate in contemporary biology: A phoenix risen 1. J. Physiol. 2022, 600, 1229–1251. [Google Scholar] [CrossRef]
- Brooks, G.A. The science and translation of lactate shuttle theory. Cell Metab. 2018, 27, 757–785. [Google Scholar] [CrossRef]
- Pellerin, L.; Pellegri, G.; Bittar, P.G.; Charnay, Y.; Bouras, C.; Martin, J.-L.; Stella, N.; Magistretti, P.J. Evidence supporting the existence of an activity-dependent astrocyte-neuron lactate shuttle. Dev. Neurosci. 1998, 20, 291–299. [Google Scholar] [CrossRef]
- Pellerin, L.; Magistretti, P.J. Sweet sixteen for ANLS. J. Cereb. Blood Flow Metab. 2012, 32, 1152–1166. [Google Scholar] [CrossRef]
- Prins, M.; Giza, C. Induction of monocarboxylate transporter 2 expression and ketone transport following traumatic brain injury in juvenile and adult rats. Dev. Neurosci. 2006, 28, 447–456. [Google Scholar] [CrossRef]
- Reid, J.J.; Linden, M.A.; Peelor, F.F., III; Miller, R.A.; Hamilton, K.L.; Miller, B.F. Brain protein synthesis rates in the UM-HET3 mouse following treatment with rapamycin or rapamycin with metformin. J. Gerontol. Ser. A 2020, 75, 40–49. [Google Scholar] [CrossRef]
- Miller, B.F.; Reid, J.J.; Price, J.C.; Lin, H.-J.L.; Atherton, P.J.; Smith, K. CORP: The use of deuterated water for the measurement of protein synthesis. J. Appl. Physiol. 2020, 128, 1163–1176. [Google Scholar] [CrossRef]
- Orendorff, R.; Peck, A.J.; Zheng, B.; Shirazi, S.N.; Ferguson, R.M.; Khandhar, A.P.; Kemp, S.J.; Goodwill, P.; Krishnan, K.M.; Brooks, G.A. First in vivo traumatic brain injury imaging via magnetic particle imaging. Phys. Med. Biol. 2017, 62, 3501. [Google Scholar] [CrossRef]
- Abbott, C.B.; Lawrence, M.M.; Kobak, K.A.; Lopes, E.B.P.; Peelor, F.F., III; Donald, E.J.; Van Remmen, H.; Griffin, T.M.; Miller, B.F. A novel stable isotope approach demonstrates surprising degree of age-related decline in skeletal muscle collagen proteostasis. Function 2021, 2, zqab028. [Google Scholar] [CrossRef]
- Hokanson, J.F.; Mercier, J.G.; Brooks, G.A. Cyclosporine A decreases rat skeletal muscle mitochondrial respiration in vitro. Am. J. Respir. Crit. Care Med. 1995, 151, 1848–1851. [Google Scholar] [CrossRef]
- Miller, B.F.; Robinson, M.M.; Bruss, M.D.; Hellerstein, M.; Hamilton, K.L. A comprehensive assessment of mitochondrial protein synthesis and cellular proliferation with age and caloric restriction. Aging Cell 2012, 11, 150–161. [Google Scholar] [CrossRef]
- Hellerstein, M.K.; Neese, R.A. Mass isotopomer distribution analysis at eight years: Theoretical, analytic, and experimental considerations. Am. J. Physiol.-Endocrinol. Metab. 1999, 276, E1146–E1170. [Google Scholar] [CrossRef]


| Tissue Fraction | Ad Libitum-Fed Animals | Underfed Animals |
|---|---|---|
| Gastrocnemius | ||
| Whole | 2.70 ± 0.17% | 2.38 ± 0.39% * |
| Mitochondria | 2.80 ± 0.16% | 2.56 ± 0.20 * |
| Cytosol | 2.76 ± 0.38% | 2.71 ± 0.19% |
| Heart | ||
| Whole | 2.40 ± 0.30% | 2.34 ± 0.25% |
| Mitochondria | 1.86 ± 0.66% | 2.10 ± 0.57% |
| Cytosol | 2.38 ± 0.33% | 2.29 ± 0.24% |
| Left Cortex | ||
| Whole | 2.29 ± 0.14% | 2.02 ± 0.36% * |
| Mitochondria | 2.19 ± 0.08% | 2.16 ± 0.17% * |
| Cytosol | 2.43 ± 0.14% | 2.38 ± 0.24% |
| Right Cortex | ||
| Whole | 2.19 ± 0.10% | 2.10 ± 0.24% |
| Mitochondria | 2.24 ± 0.10% | 2.19 ± 0.19% |
| Cytosol | 2.33 ± 0.29% | 2.19 ± 0.33% |
| Left Cerebellum | ||
| Whole | 2.14 ± 0.14% | 2.00 ± 0.29% |
| Mitochondria | 2.29 ± 0.14% | 2.29 ± 0.19% |
| Cytosol | 2.48 ± 0.14% | 2.43 ± 0.19% |
| Right Cerebellum | ||
| Whole | 1.81 ± 0.42% | 1.71 ± 0.38% |
| Mitochondria | 1.81 ± 0.57% | 1.76 ± 0.52% |
| Cytosol | 2.29 ± 0.43% | 2.24 ± 0.43% |
| Hippocampus | ||
| Whole | 2.33 ± 0.14% | 2.38 ± 0.10% |
| Mitochondria | 2.33 ± 0.24% | 2.38 ± 0.10% |
| Cytosol | 2.67 ± 0.10% | 2.67 ± 0.19% |
| Tissue Fraction | Sham Animals | BI Animals |
|---|---|---|
| Gastrocnemius | ||
| Whole | 2.53 ± 0.29% | 2.54 ± 0.39% |
| Mitochondria | 2.64 ± 0.25% | 2.68 ± 0.20% |
| Cytosol | 2.60 ± 0.35% | 2.85 ± 0.18% |
| Heart | ||
| Whole | 2.48 ± 0.30% | 2.28 ± 0.22% |
| Mitochondria | 2.24 ± 0.46% | 1.76 ± 0.67% |
| Cytosol | 2.43 ± 0.25% | 2.25 ± 0.32% |
| Left Cortex | ||
| Whole | 1.93 ± 0.38% | 2.28 ± 0.18% * |
| Mitochondria | 2.04 ± 0.12% | 2.19 ± 0.14% * |
| Cytosol | 2.31 ± 0.20% | 2.49 ± 0.18% * |
| Right Cortex | ||
| Whole | 2.05 ± 0.19% | 2.23 ± 0.14% * |
| Mitochondria | 2.12 ± 0.09% | 2.28 ± 0.14% * |
| Cytosol | 2.36 ± 0.18% | 2.14 ± 0.37% |
| Left Cerebellum | ||
| Whole | 2.11 ± 0.12% | 2.05 ± 0.25% |
| Mitochondria | 2.21 ± 0.16% | 2.33 ± 0.14% |
| Cytosol | 2.41 ± 0.15% | 2.48 ± 0.17% |
| Right Cerebellum | ||
| Whole | 1.92 ± 0.34% | 1.61 ± 0.41% & |
| Mitochondria | 2.08 ± 0.32% | 1.58 ± 0.57 * |
| Cytosol | 2.49 ± 0.13% | 2.05 ± 0.45% * |
| Hippocampus | ||
| Whole | 2.39 ± 0.14% | 2.33 ± 0.10% |
| Mitochondria | 2.37 ± 0.22% | 2.33 ± 0.14% |
| Cytosol | 2.65 ± 0.20% | 2.68 ± 0.14% |
| Tissue Fraction | Control | BI | UF | BI+UF |
|---|---|---|---|---|
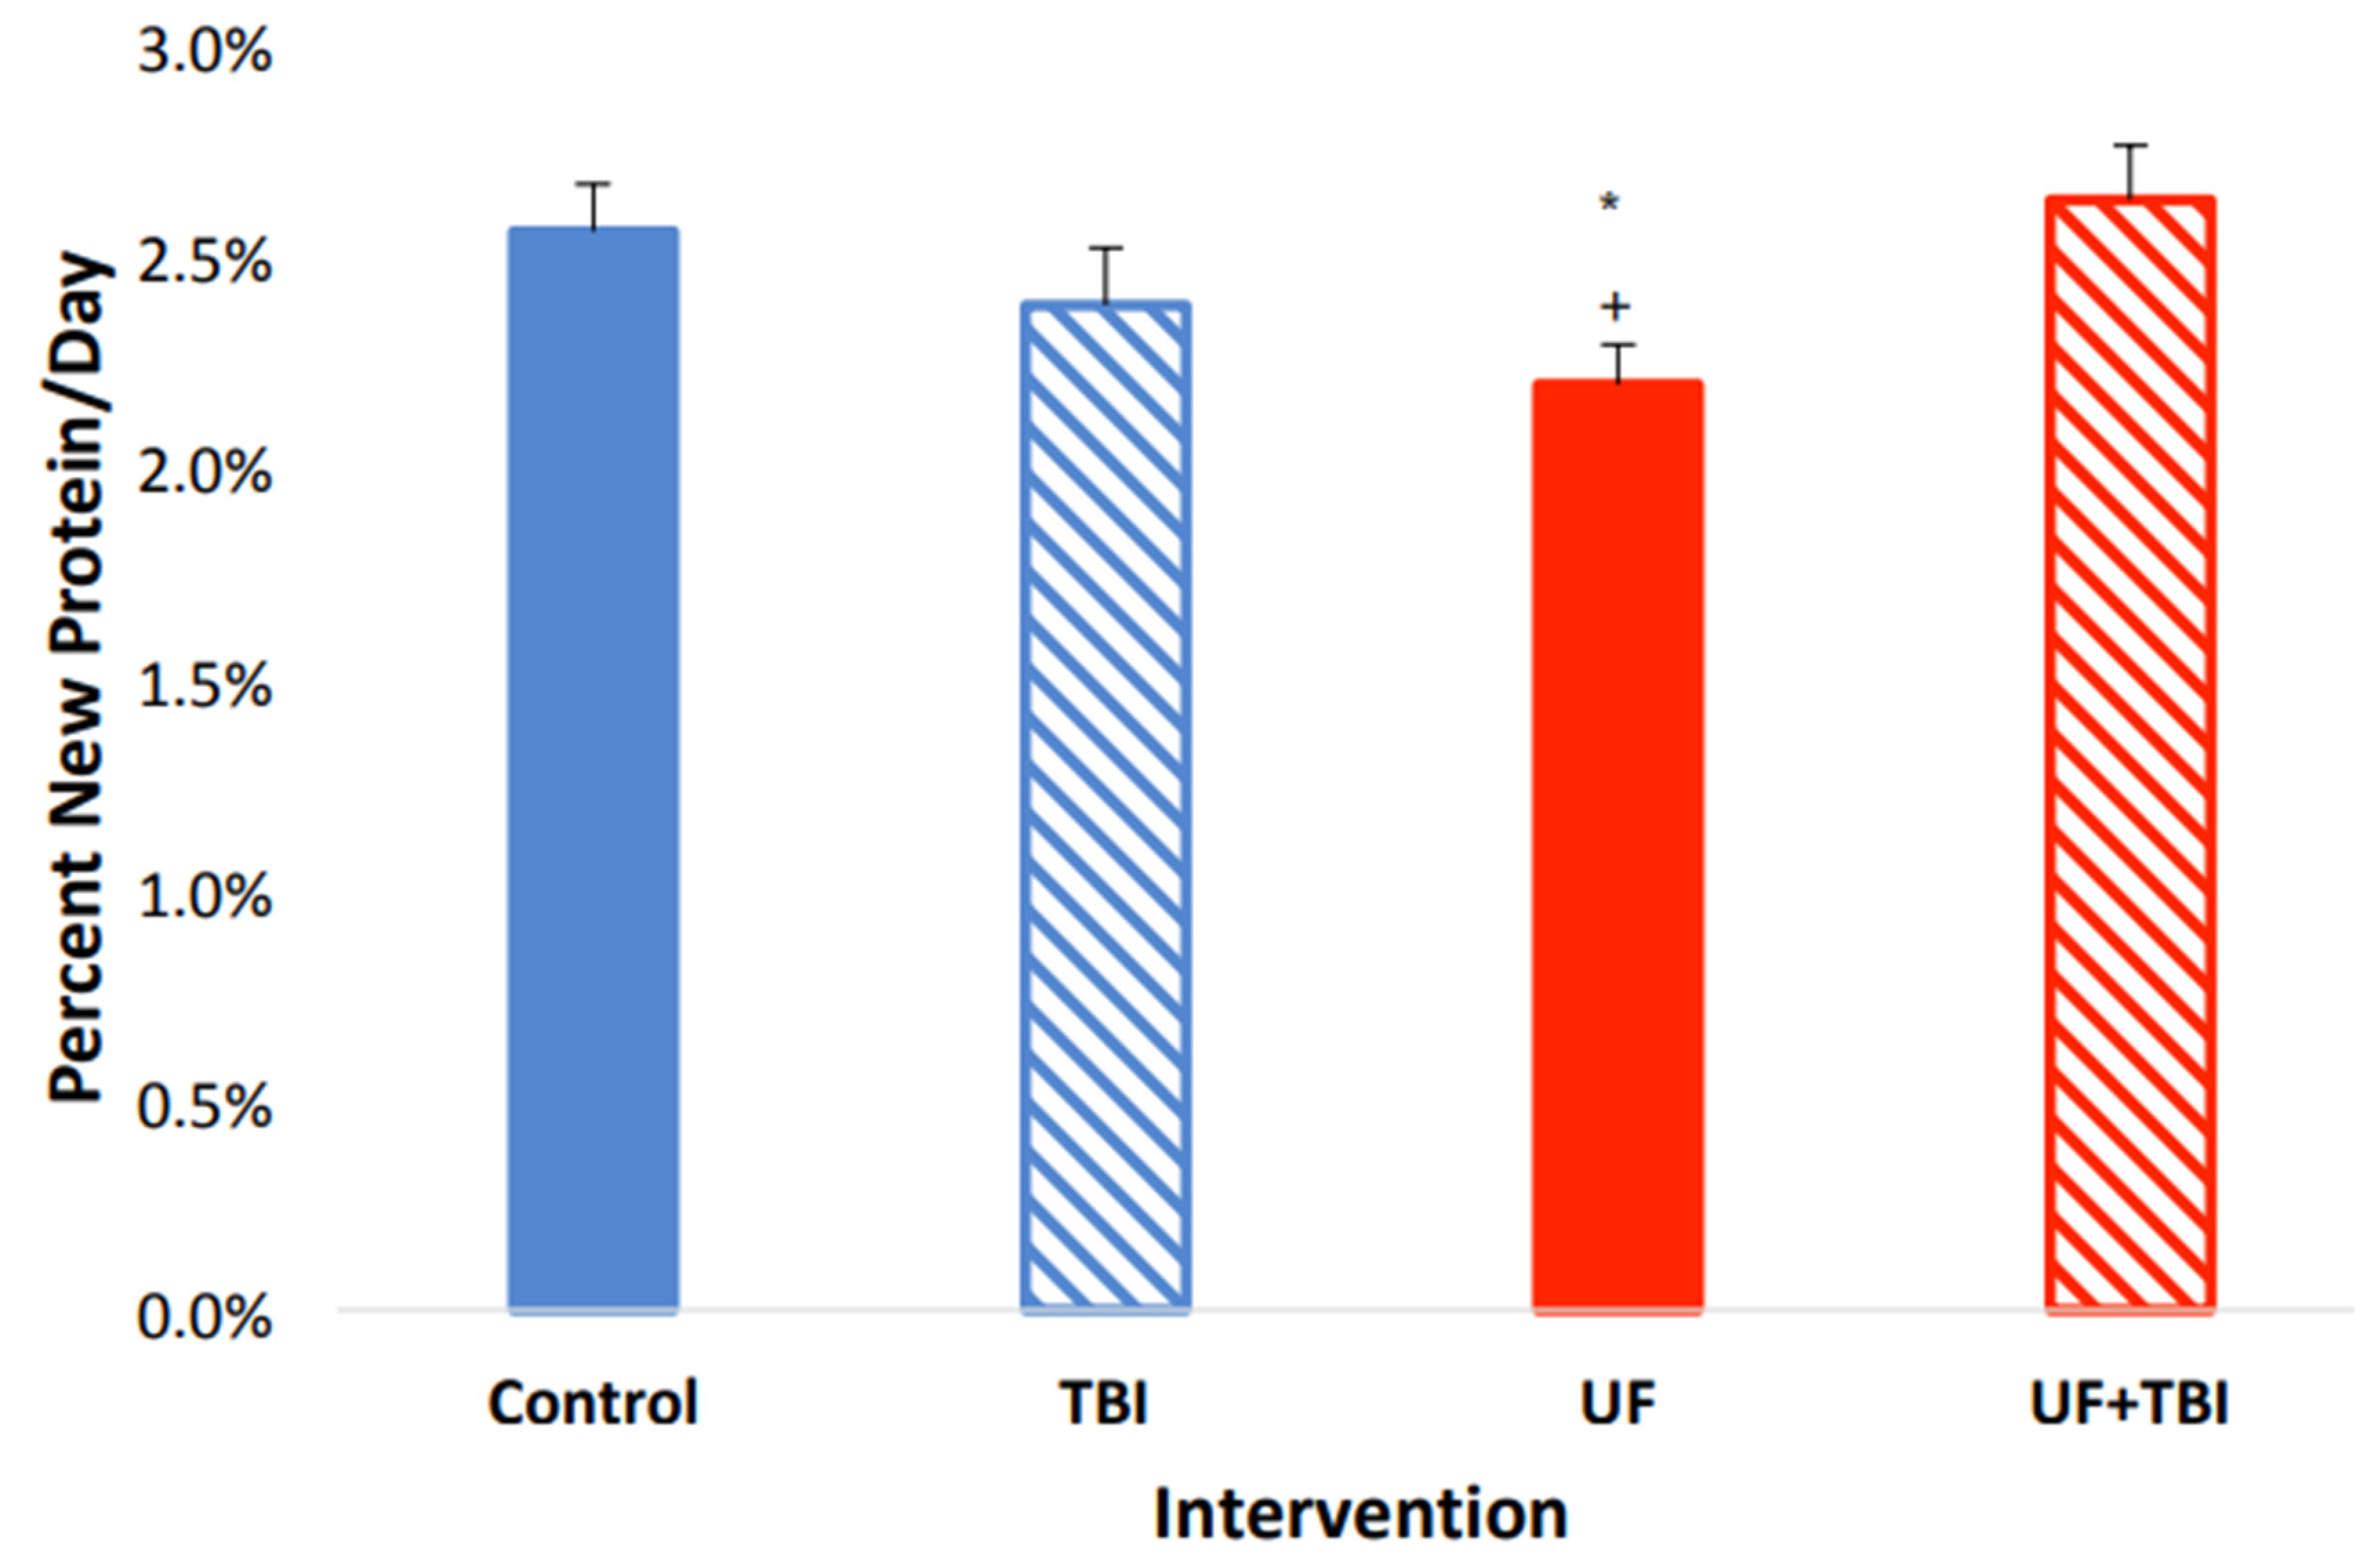
| Gastrocnemius | ||||
| Whole | 2.76 ± 0.32% | 2.66 ± 0.05% | 2.37 ± 0.18% | 2.39 ± 0.57% |
| Mitochondria | 2.91 ± 0.22% | 2.75 ± 0.11% | 2.51 ± 0.14% * | 2.61 ± 0.27% |
| Cytosol | 2.50 ± 0.63% | 2.90 ± 0.18% | 2.64 ± 0.17% | 2.78 ± 0.18% |
| Heart | ||||
| Whole | 2.63 ± 0.42% | 2.29 ± 0.16% | 2.40 ± 0.22% | 2.27 ± 0.30% |
| Mitochondria | 2.14 ± 0.82% | 1.70 ± 0.64% | 2.29 ± 0.23% | 1.84± 0.77% |
| Cytosol | 2.66 ± 0.25% | 2.22 ± 0.31% | 2.31 ± 0.15% | 2.27 ± 0.37% |
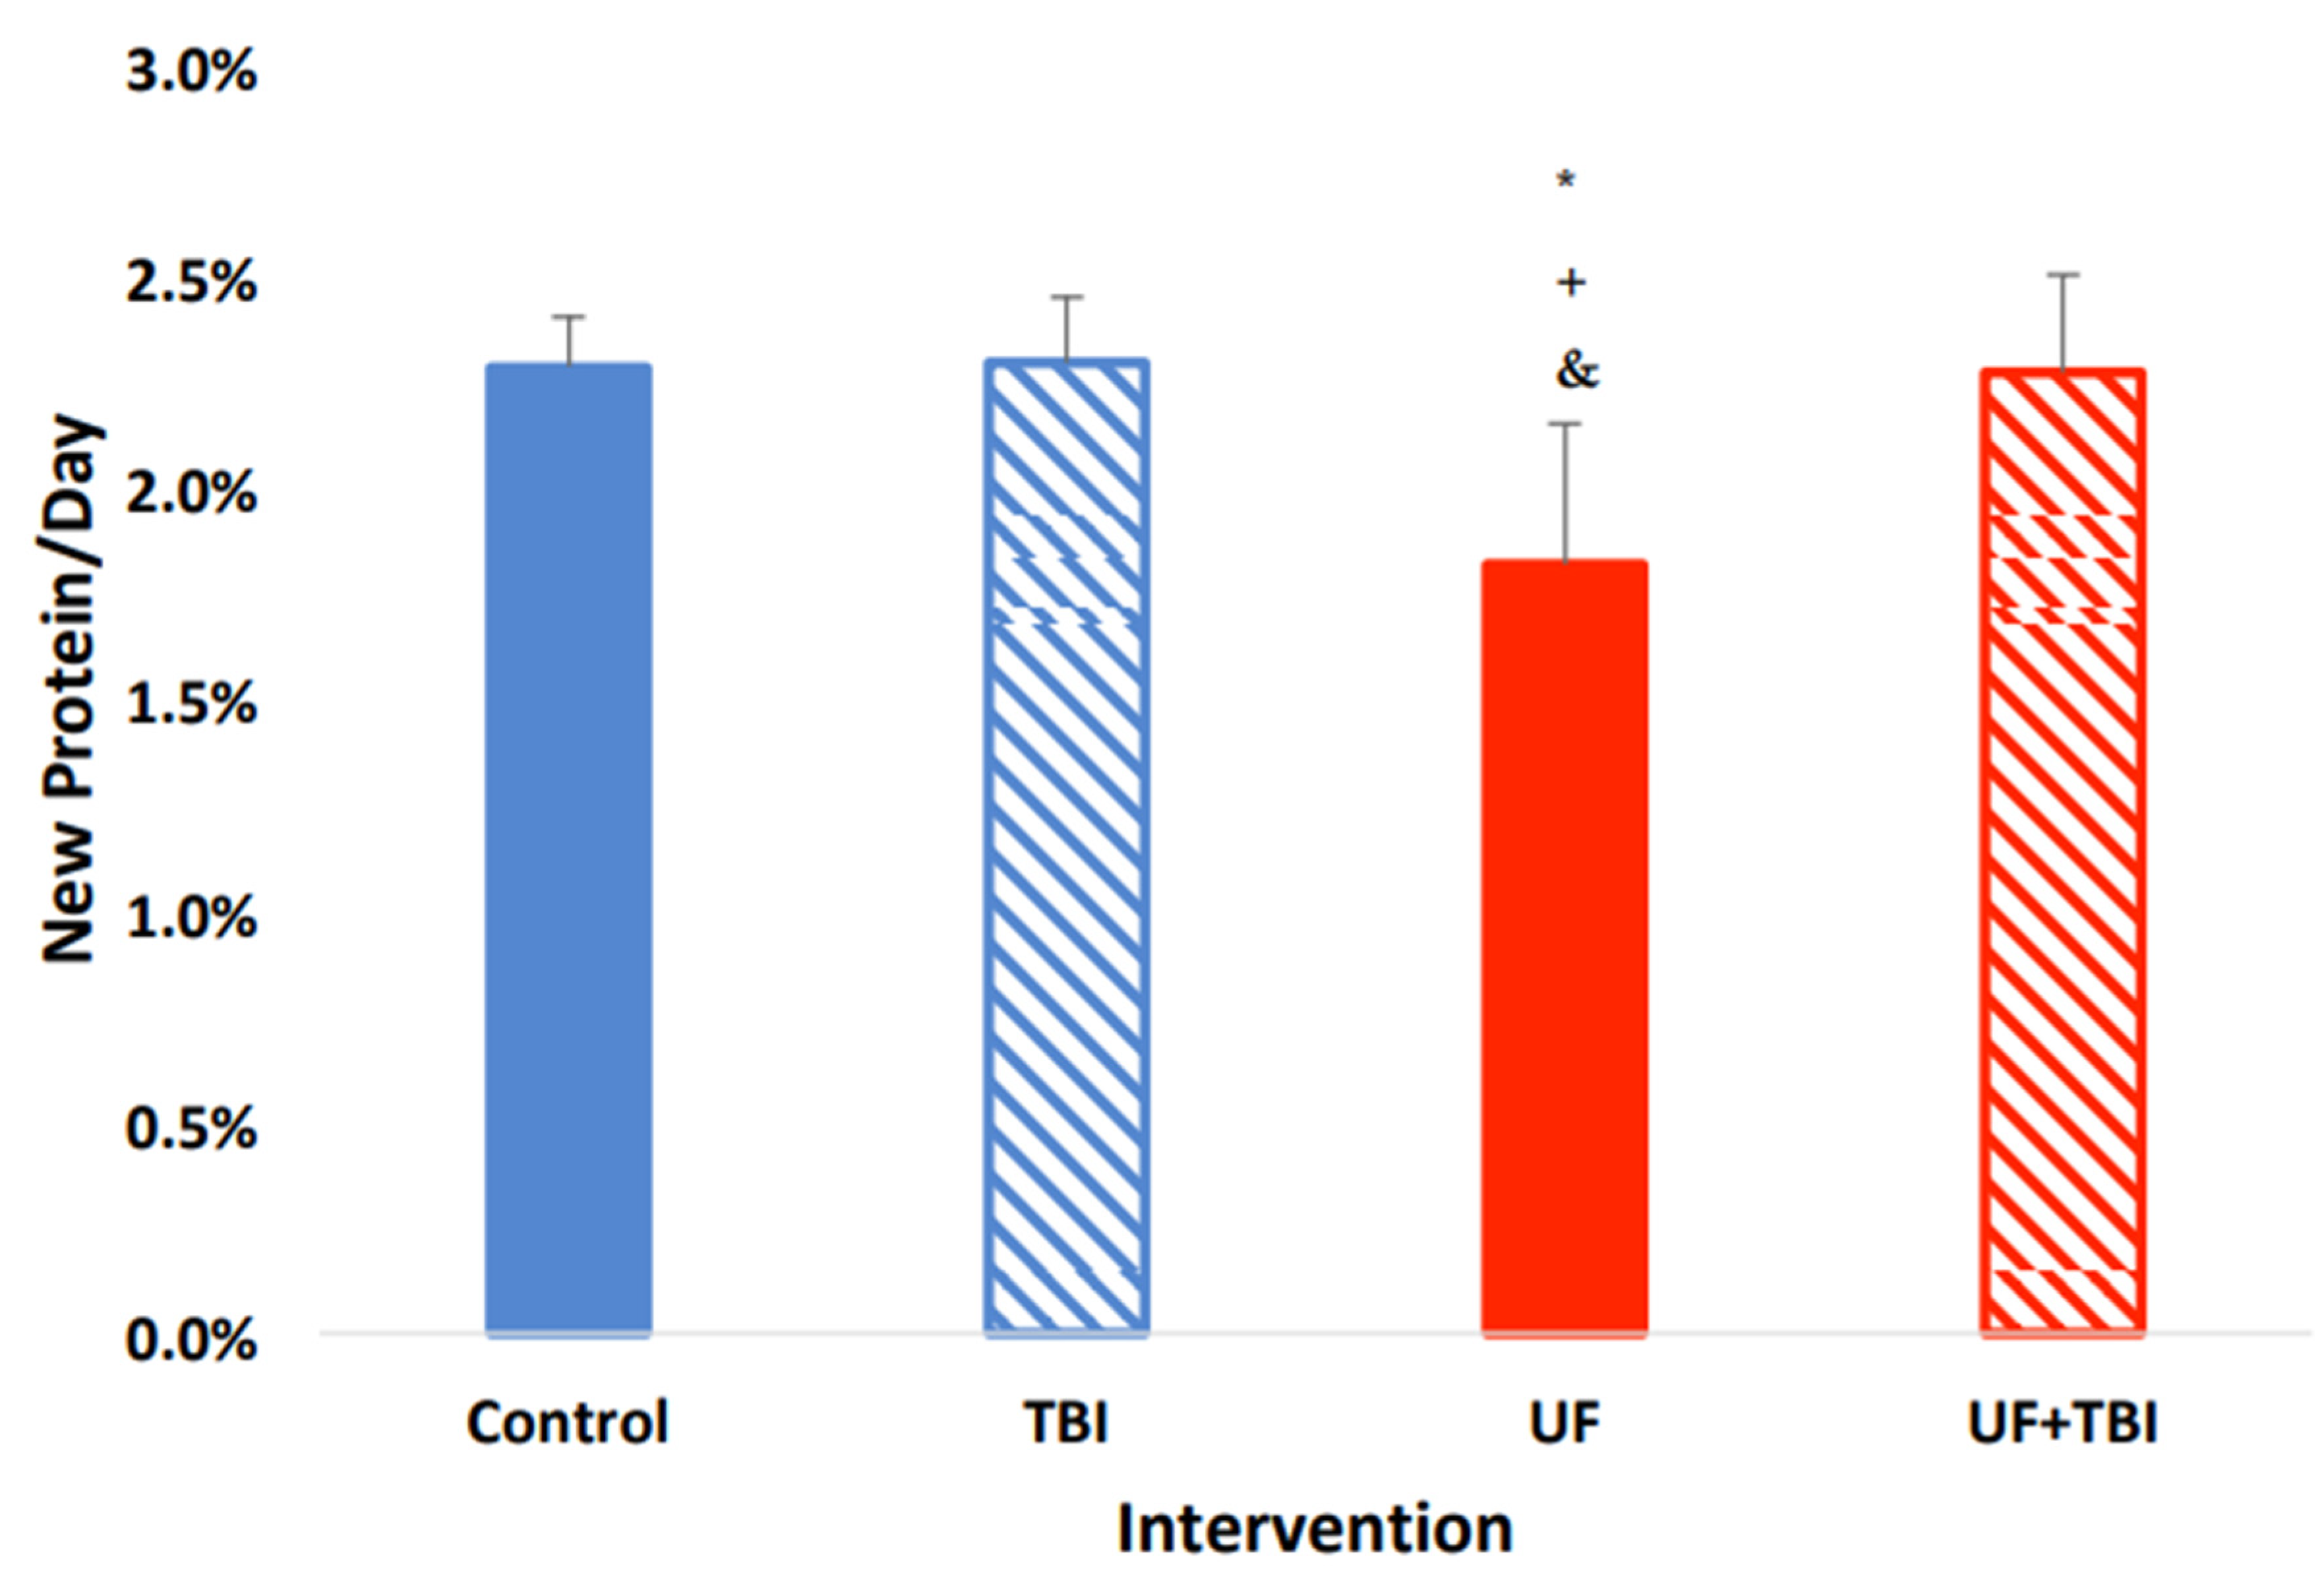
| Left Cortex | ||||
| Whole | 2.28 ± 0.12% | 2.29 ± 0.15% | 1.81 ± 0.33% *+& | 2.28 ± 0.23% |
| Mitochondria | 2.17% ± 0.02% | 2.19 ± 0.10% | 1.96 ± 0.10% *+& | 2.17± 0.17% |
| Cytosol | 2.55 ± 0.11% | 2.38 ± 0.13% | 2.19 ± 0.09% *+ | 2.63 ± 0.13% |
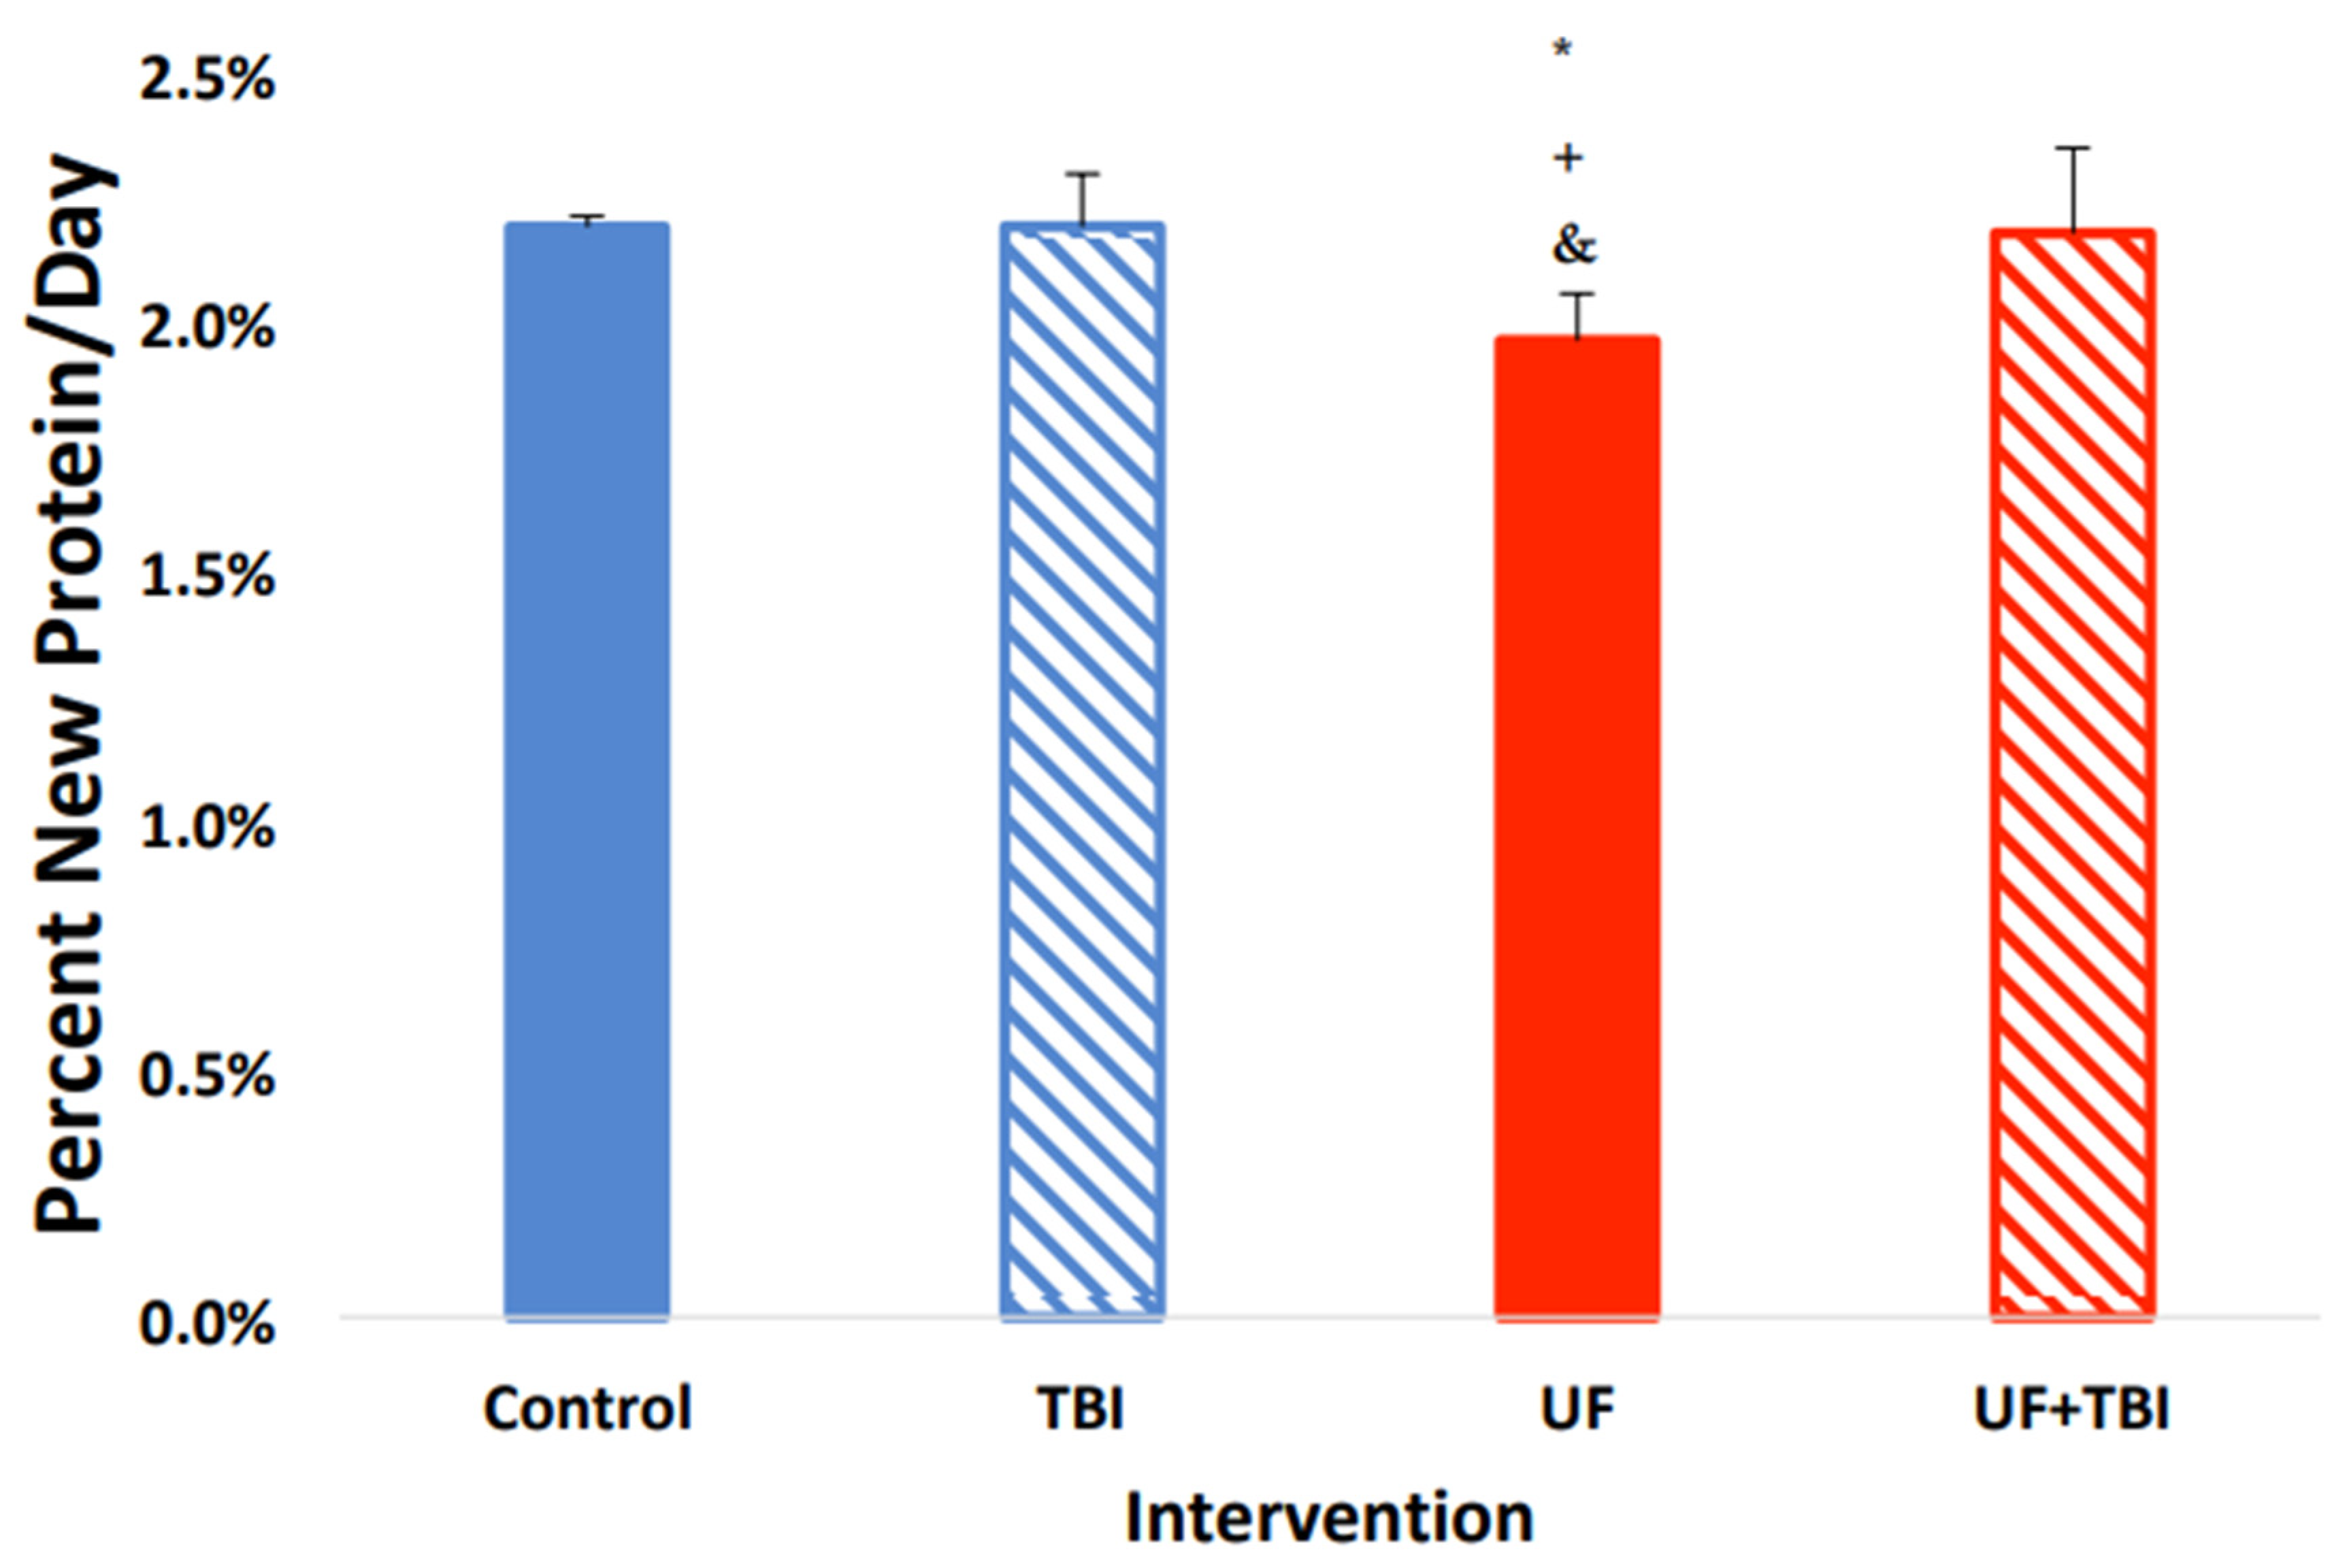
| Right Cortex | ||||
| Whole | 2.24 ± 0.06% | 2.167 ± 0.11% | 1.96 ± 0.14% *+& | 2.29 ± 0.17% |
| Mitochondria | 2.20 ± 0.07% | 2.25 ± 0.13% | 2.07 ± 0.21% + | 2.29 ± 0.21% |
| Cytosol | 2.56 ± 0.05% | 2.21 ± 0.28% | 2.26 ± 0.12% | 2.06 ± 0.48% |
| Left Cerebellum | ||||
| Whole | 2.23 ± 0.20% | 2.08 ± 0.10% | 1.86 ± 0.35% + | 2.14 ± 0.16% |
| Mitochondria | 2.35 ± 0.23% | 2.26 ± 0.07% | 2.14 ± 0. 06% | 2.42 ±0.15% |
| Cytosol | 2.51 ± 0.15% | 2.51 ± 0.15% | 2.51 ± 0.15% | 2.51 ± 0.15% |
| Right Cerebellum | ||||
| Whole | 2.44 ± 0.13% | 2.44 ± 0.13% | 2.44 ± 0.13% | 2.44 ± 0.13% |
| Mitochondria | 2.36 ± 0.13% | 2.36 ± 0.13% | 2.36 ± 0.13% | 2.36 ± 0.13% |
| Cytosol | 2.54 ± 0.22% | 2.54 ± 0.22% | 2.54 ± 0.22% | 2.54 ± 0.22% |
| Hippocampus | ||||
| Whole | 2.47 ± 0.17% | 2.28 ± 0.07% | 2.35 ± 0.11% | 2.39 ±0.11% |
| Mitochondria | 2.32 ± 0.41% | 2.31 ± 0.16% | 2.39 ± 0.07% | 2.35 ± 0.19% |
| Cytosol | 2.73 ± 0.09% | 2.60 ± 0.10% | 2.60 ± 0.23% | 2.76 ± 0.15% |
| Tissue | With UF+BI | Without UF+BI | Difference |
|---|---|---|---|
| Gastrocnemius | |||
| Whole | −0.51 * | −0.63 ** | 0.12 |
| Mitochondria | −0.50 * | −0.59 ** | 0.08 |
| Cytosol | −0.23 | −0.28 | 0.05 |
| Heart | |||
| Whole | 0.04 | 0.18 | 0.14 |
| Mitochondria | 0.31 | 0.50 + | 0.19 |
| Cytosol | −0.02 | −0.01 | 0.01 |
| Left Cortex | |||
| Whole | −0.41 + | −0.63 ** | 0.22 |
| Mitochondria | −0.47 * | −0.79 ** | 0.32 |
| Cytosol | −0.13 | −0.49 + | 0.35 |
| Right Cortex | |||
| Whole | −0.28 | −0.61 ** | 0.33 |
| Mitochondria | −0.25 | −0.66 ** | 0.4 |
| Cytosol | −0.18 | 0.06 | 0.25 |
| Left Cerebellum | |||
| Whole | −0.31 | −0.49 + | 0.18 |
| Mitochondria | −0.03 | −0.31 | 0.28 |
| Cytosol | 0 | −0.14 | 0.14 |
| Right Cerebellum | |||
| Whole | 0.09 | 0.15 | 0.07 |
| Mitochondria | 0.12 | 0.38 | 0.27 |
| Cytosol | 0.02 | 0.21 | 0.19 |
| Hippocampus | |||
| Whole | 0.33 | 0.26 | 0.07 |
| Mitochondria | 0.37 | 0.43 | 0.06 |
| Cytosol | 0.08 | 0.01 | 0.07 |
| Group | Number of Animals | Pre-Intervention | 24 h Post-Intervention | 13 Days Post-Intervention | Total Weight Change |
|---|---|---|---|---|---|
| Control | 3 | 249.3 ± 2.1 g | 248.7 ± 0.6 g | 294.3 ± 6.7 g | 45.0 ± 6.2 g |
| BI | 6 | 252.2 ± 15.8 g | 241.2 ± 15.5 g * | 285.3 ± 16.1 g | 33.2 ± 20.6 g |
| UF | 6 | 292.16 ± 14.8 g *+^ | 291.5 ± 15.3 g | 278.3 ± 10.6 g | −13.83 ± 13.2 g *+ |
| UF+BI | 5 | 244.8 ± 13.9 g | 233.0 ± 12.1 g * | 216.6015.8 g *$+ | −28.20 ± 7.0 g *+ |
Disclaimer/Publisher’s Note: The statements, opinions and data contained in all publications are solely those of the individual author(s) and contributor(s) and not of MDPI and/or the editor(s). MDPI and/or the editor(s) disclaim responsibility for any injury to people or property resulting from any ideas, methods, instructions or products referred to in the content. |
© 2023 by the authors. Licensee MDPI, Basel, Switzerland. This article is an open access article distributed under the terms and conditions of the Creative Commons Attribution (CC BY) license (https://creativecommons.org/licenses/by/4.0/).
Share and Cite
Curl, C.C.; Leija, R.G.; Arevalo, J.A.; Osmond, A.D.; Duong, J.J.; Kaufer, D.; Horning, M.A.; Brooks, G.A. Underfeeding Alters Brain Tissue Synthesis Rate in a Rat Brain Injury Model. Int. J. Mol. Sci. 2023, 24, 13195. https://doi.org/10.3390/ijms241713195
Curl CC, Leija RG, Arevalo JA, Osmond AD, Duong JJ, Kaufer D, Horning MA, Brooks GA. Underfeeding Alters Brain Tissue Synthesis Rate in a Rat Brain Injury Model. International Journal of Molecular Sciences. 2023; 24(17):13195. https://doi.org/10.3390/ijms241713195
Chicago/Turabian StyleCurl, Casey C., Robert G. Leija, Jose A. Arevalo, Adam D. Osmond, Justin J. Duong, Daniela Kaufer, Michael A. Horning, and George A. Brooks. 2023. "Underfeeding Alters Brain Tissue Synthesis Rate in a Rat Brain Injury Model" International Journal of Molecular Sciences 24, no. 17: 13195. https://doi.org/10.3390/ijms241713195