
Shedding Light on the Photophysics and Photochemistry of I-Motifs Using Quantum Mechanical Calculations

Abstract
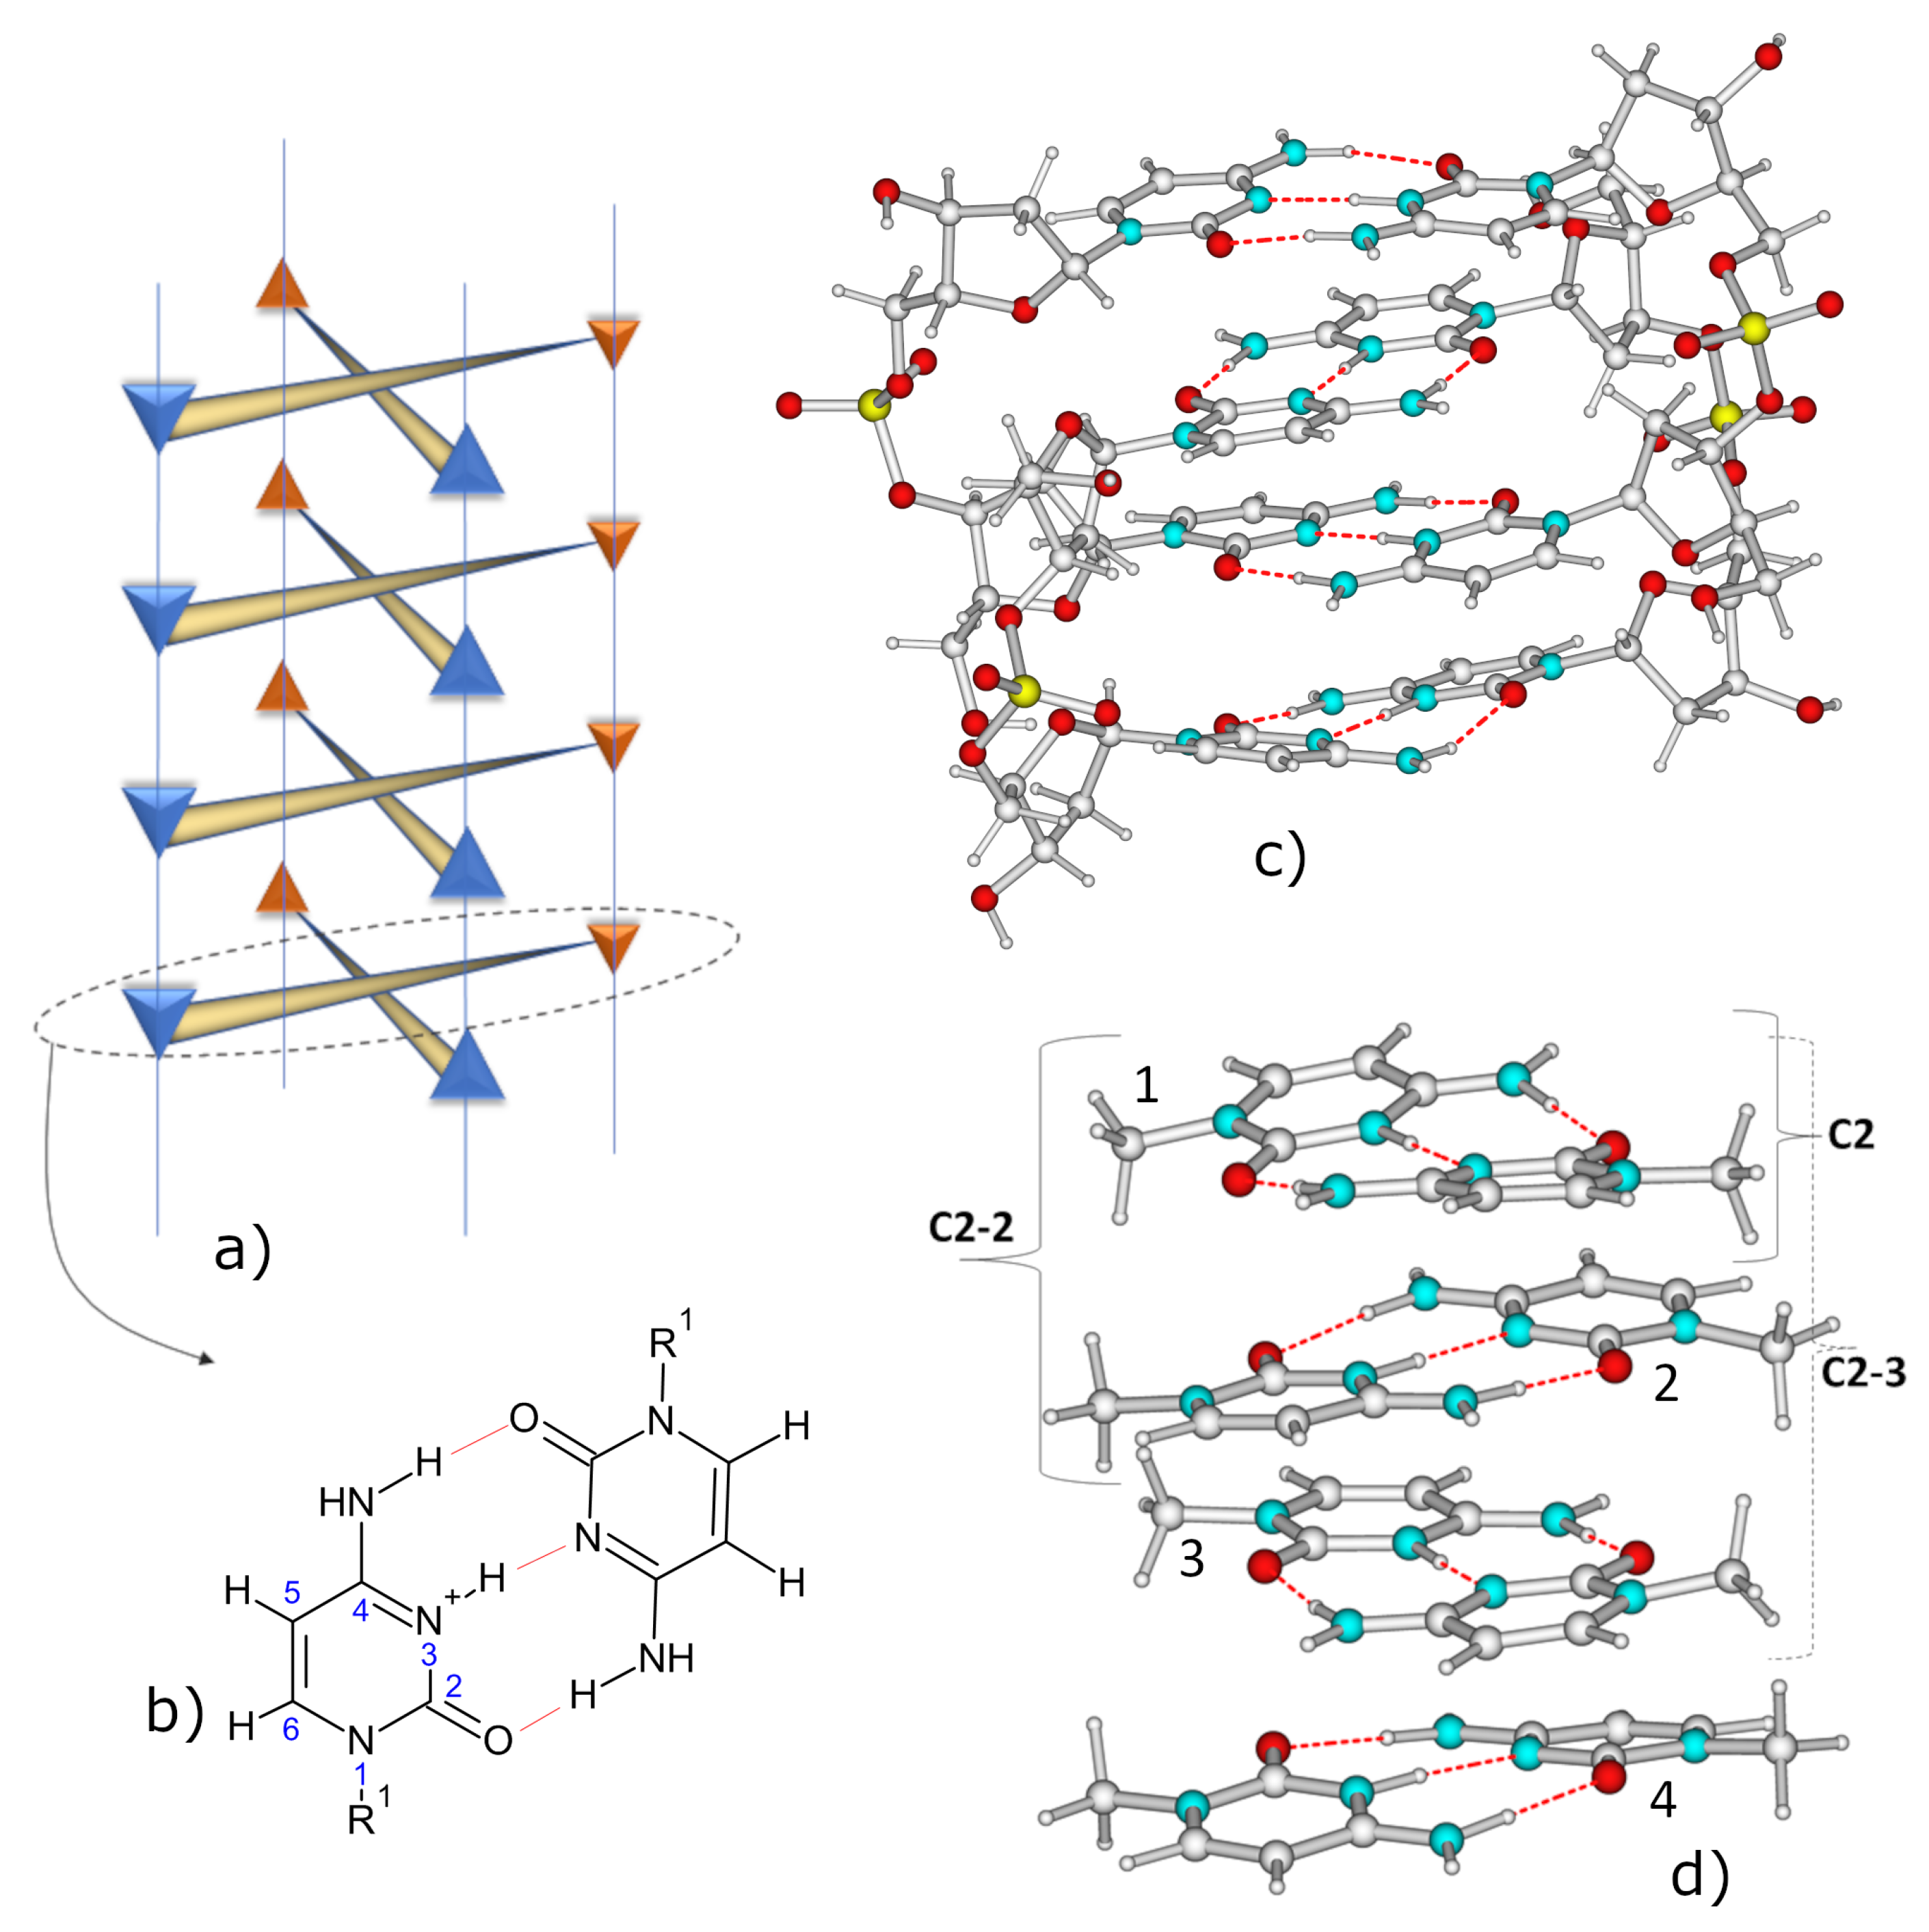
:1. Introduction
2. Results
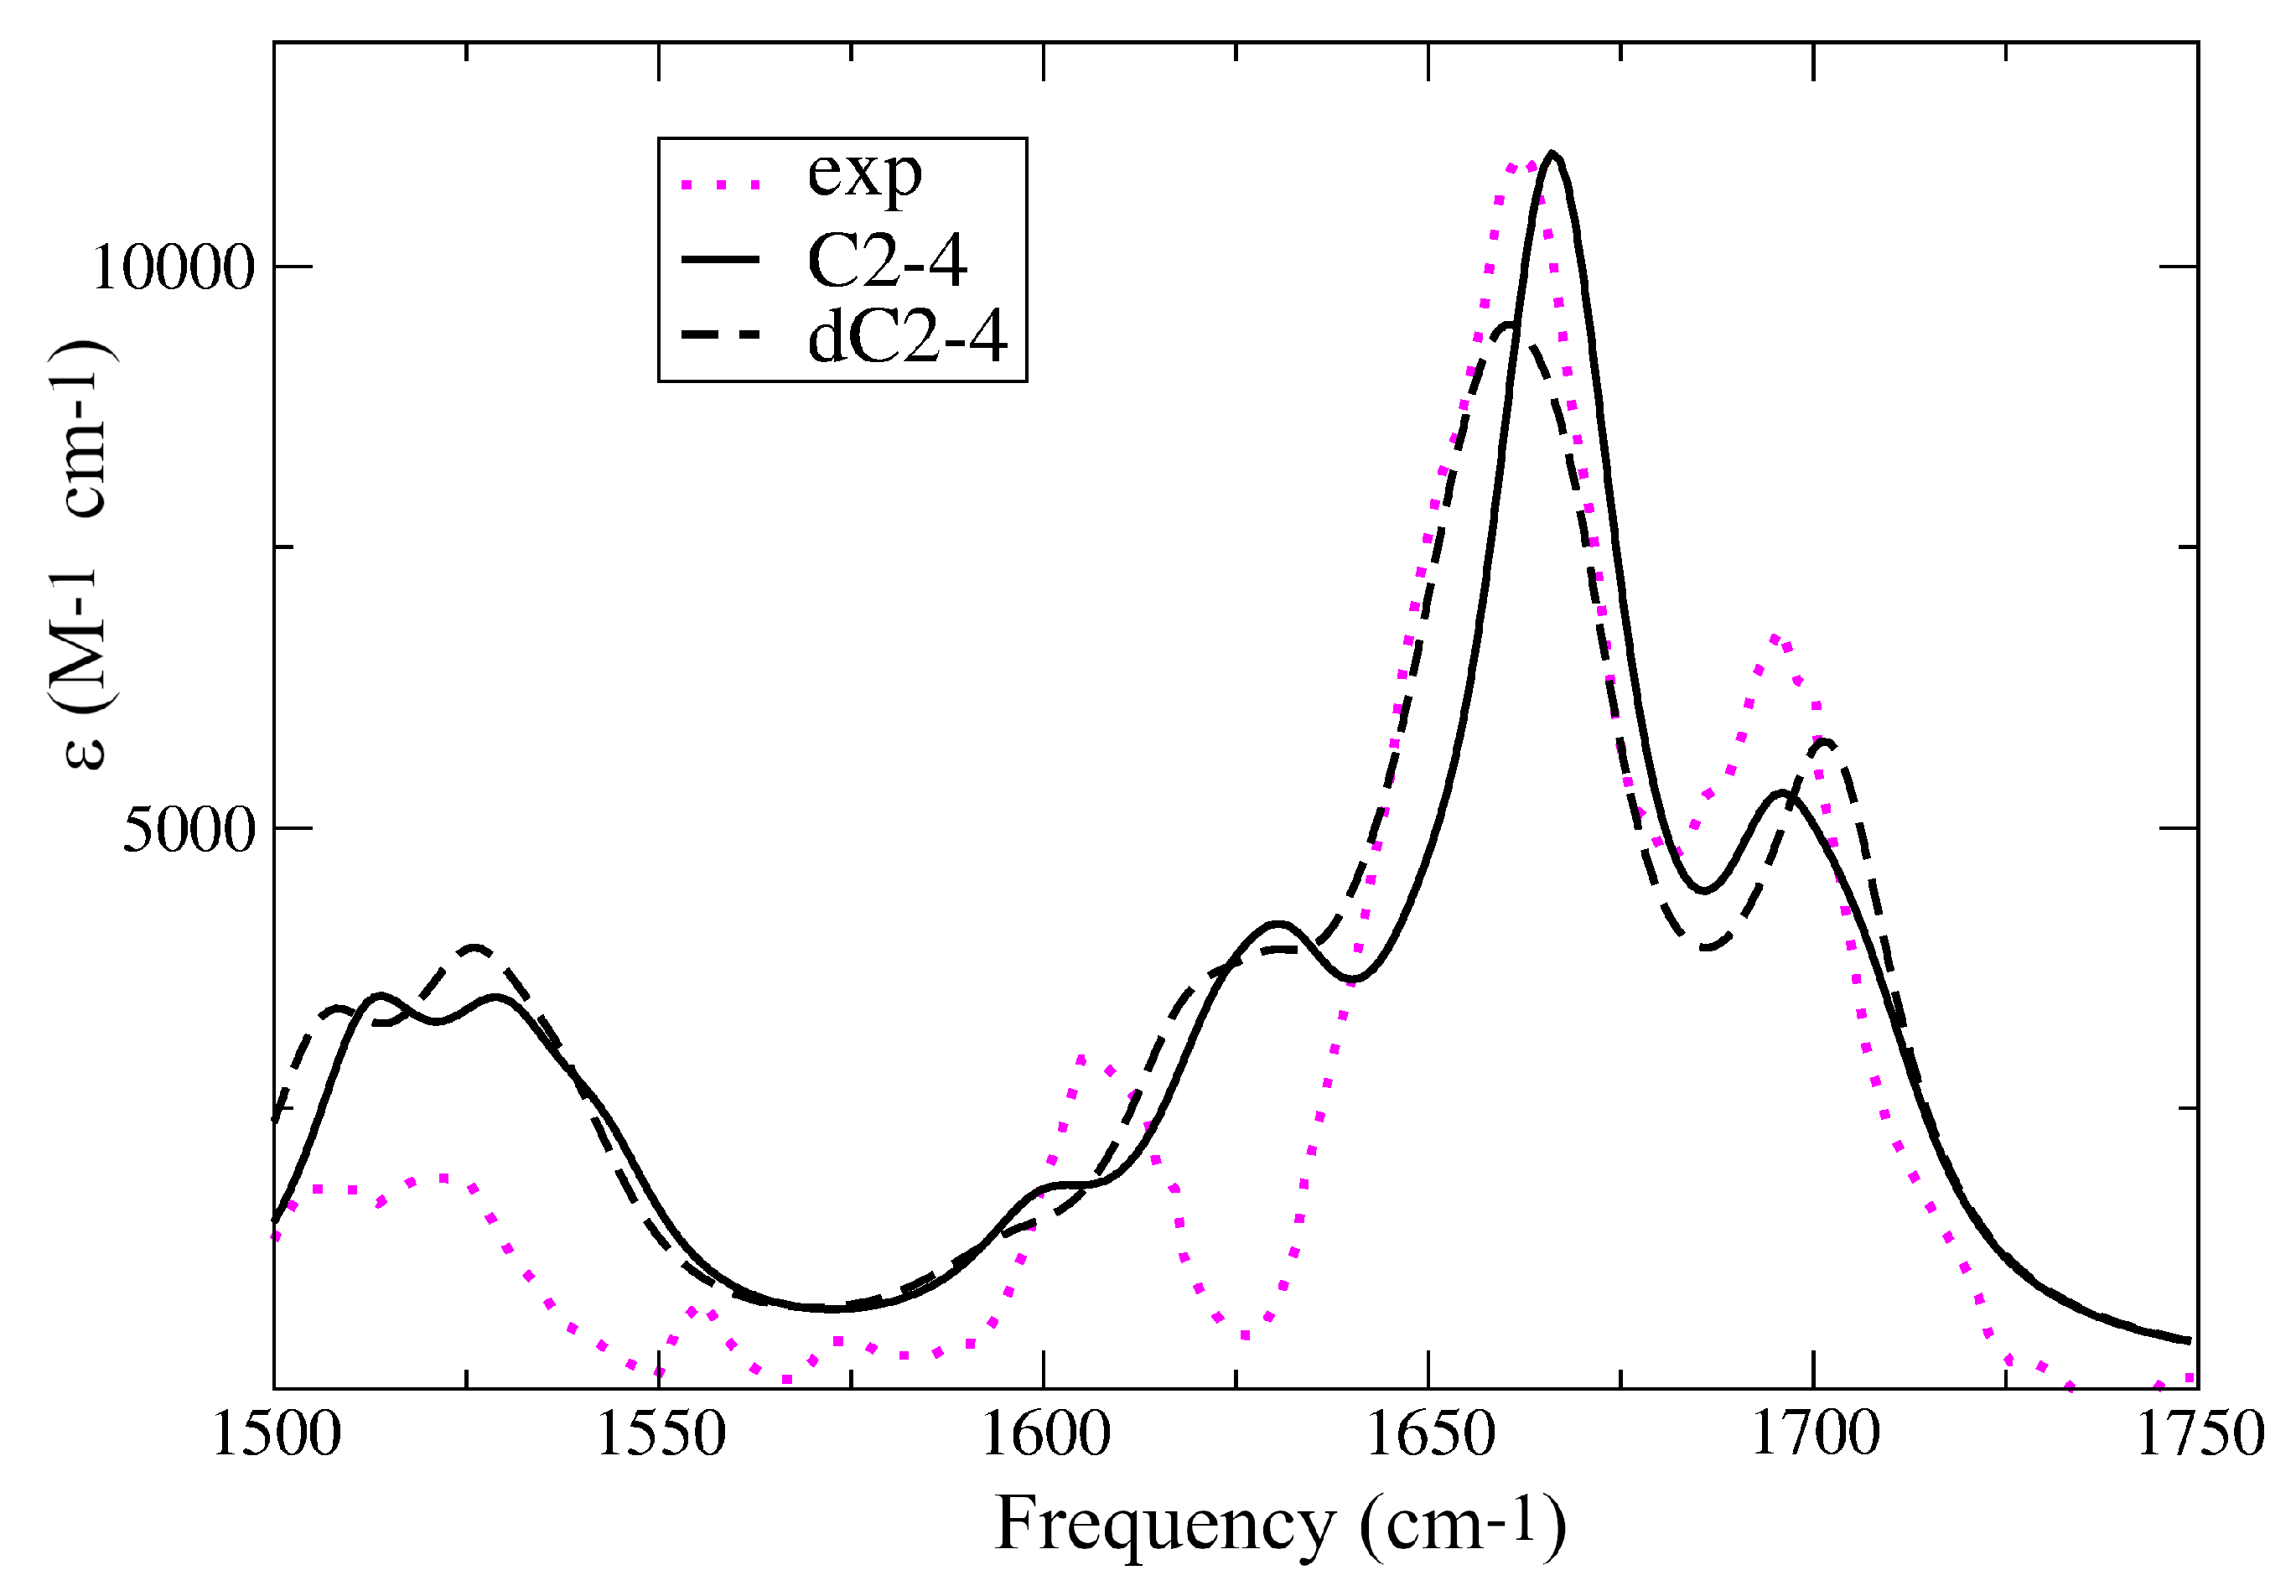
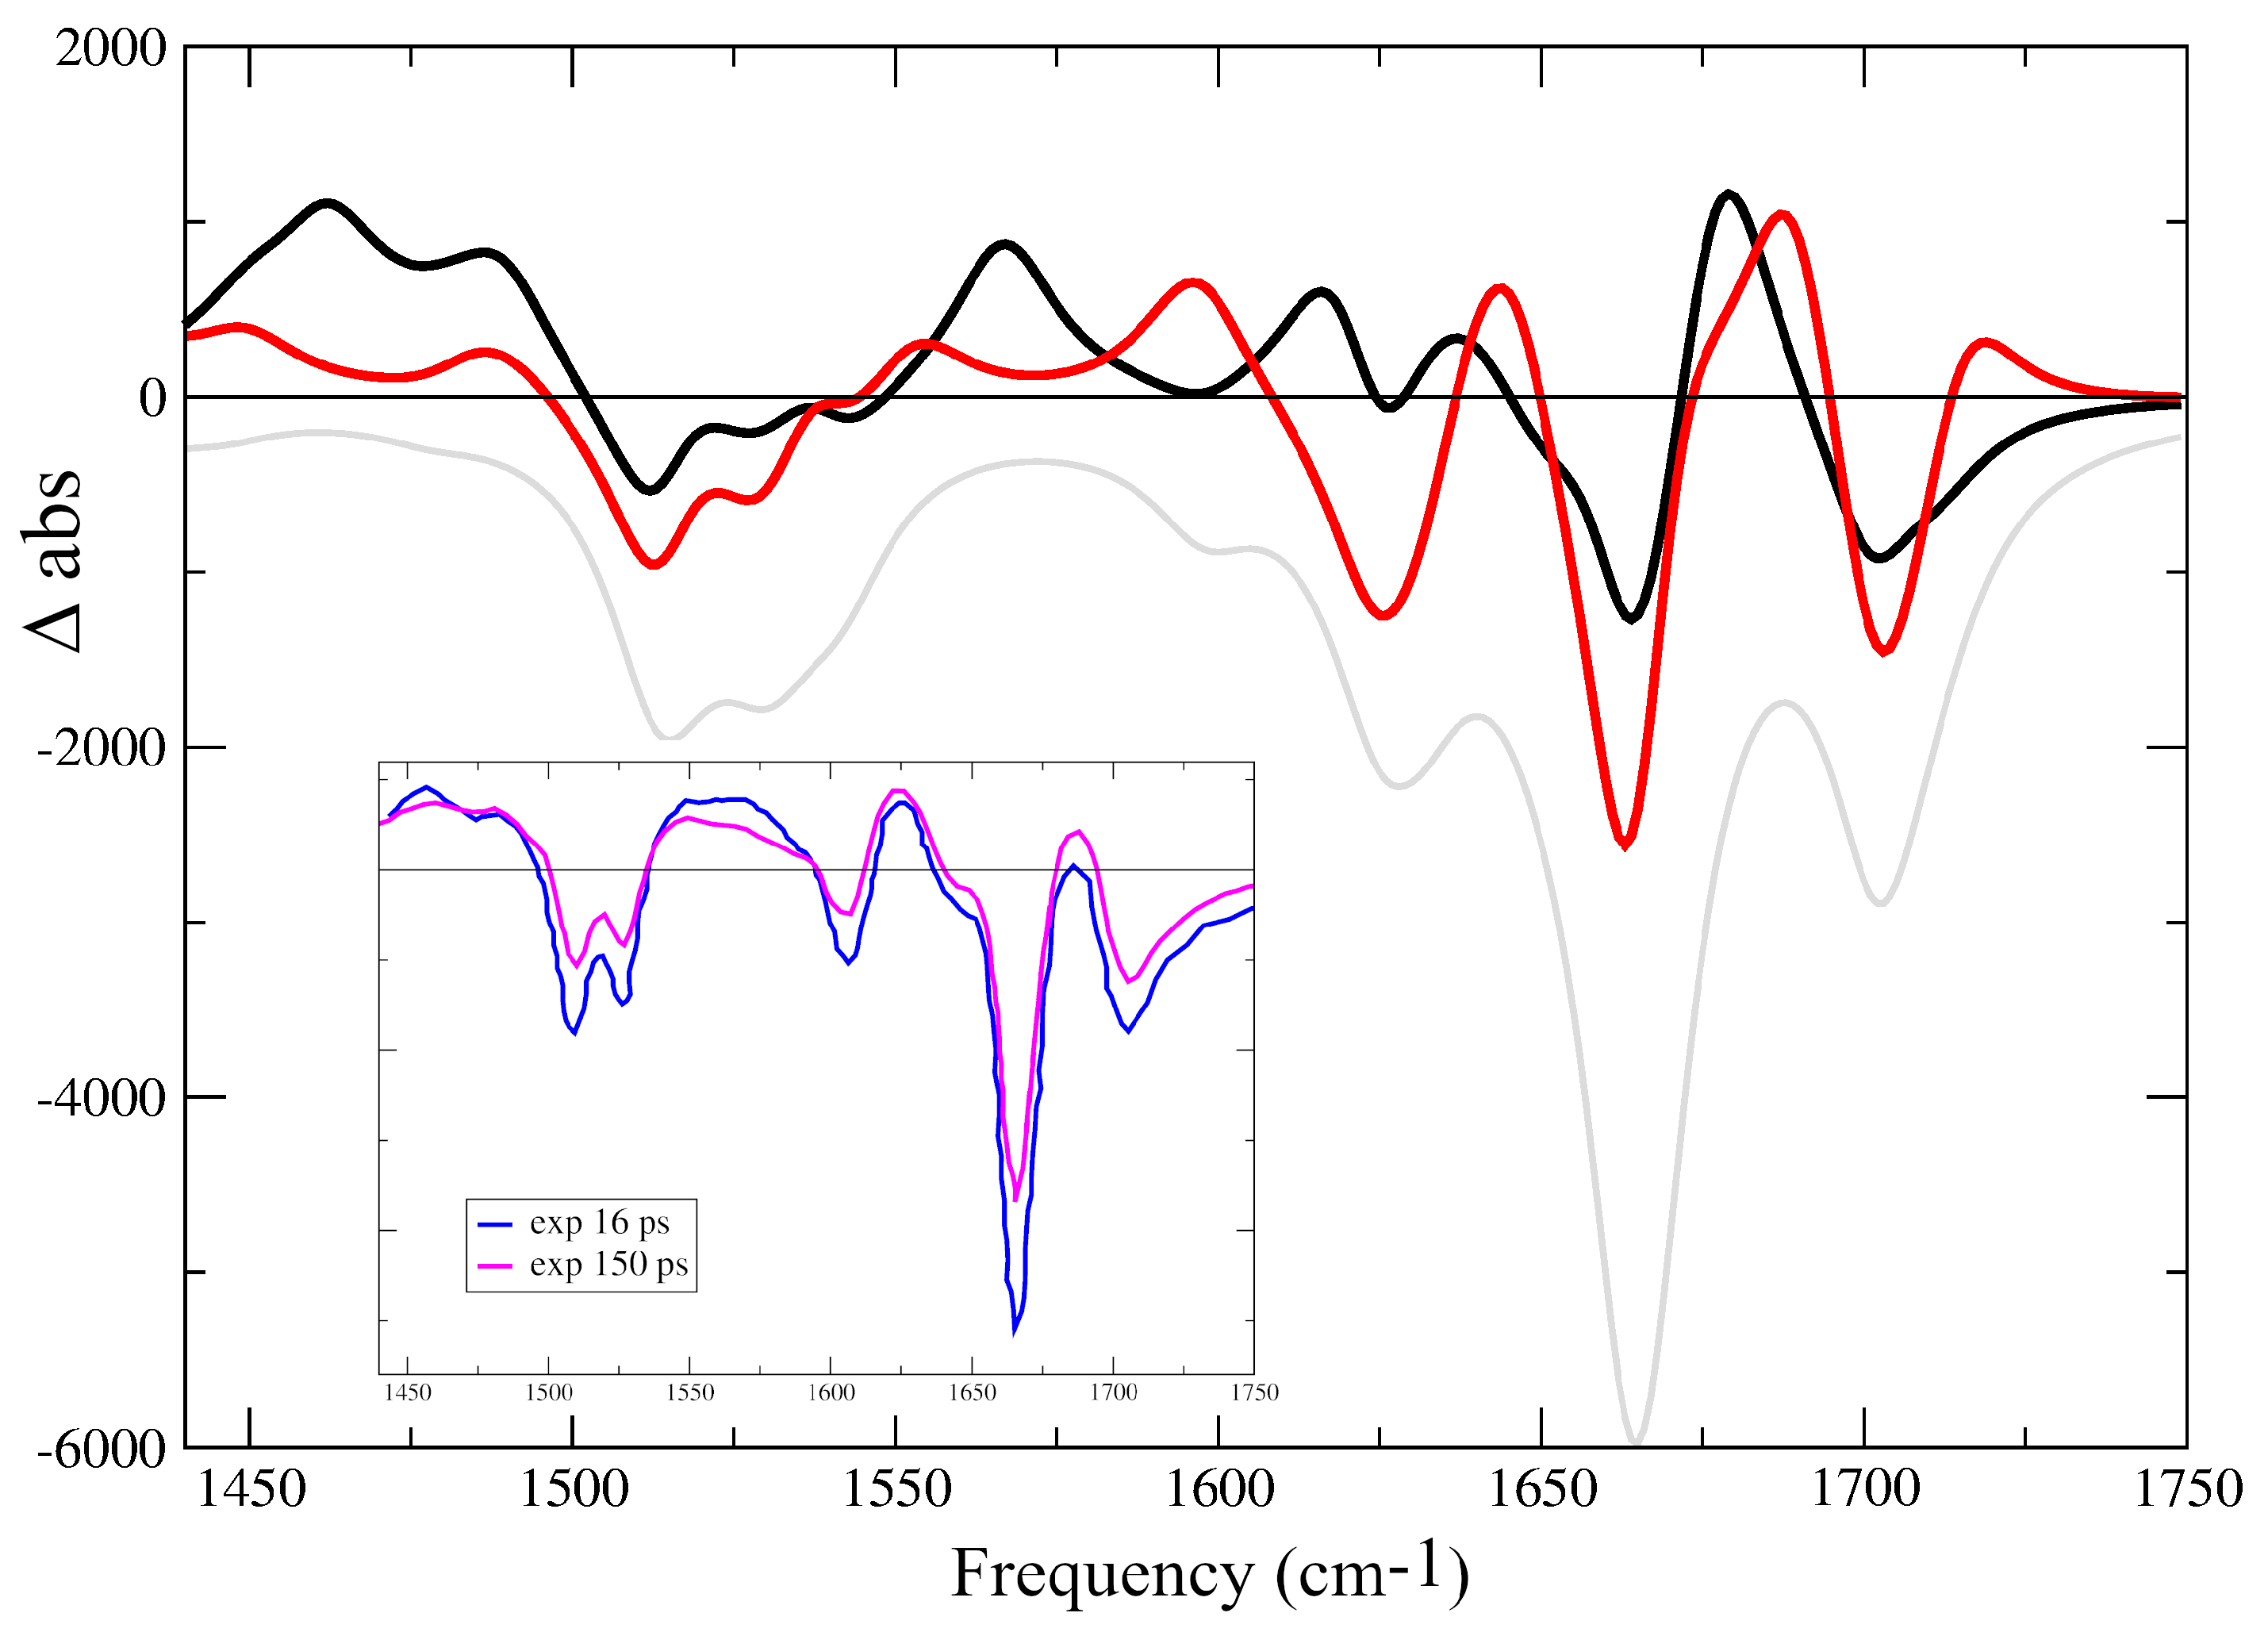
2.1. IR Spectra
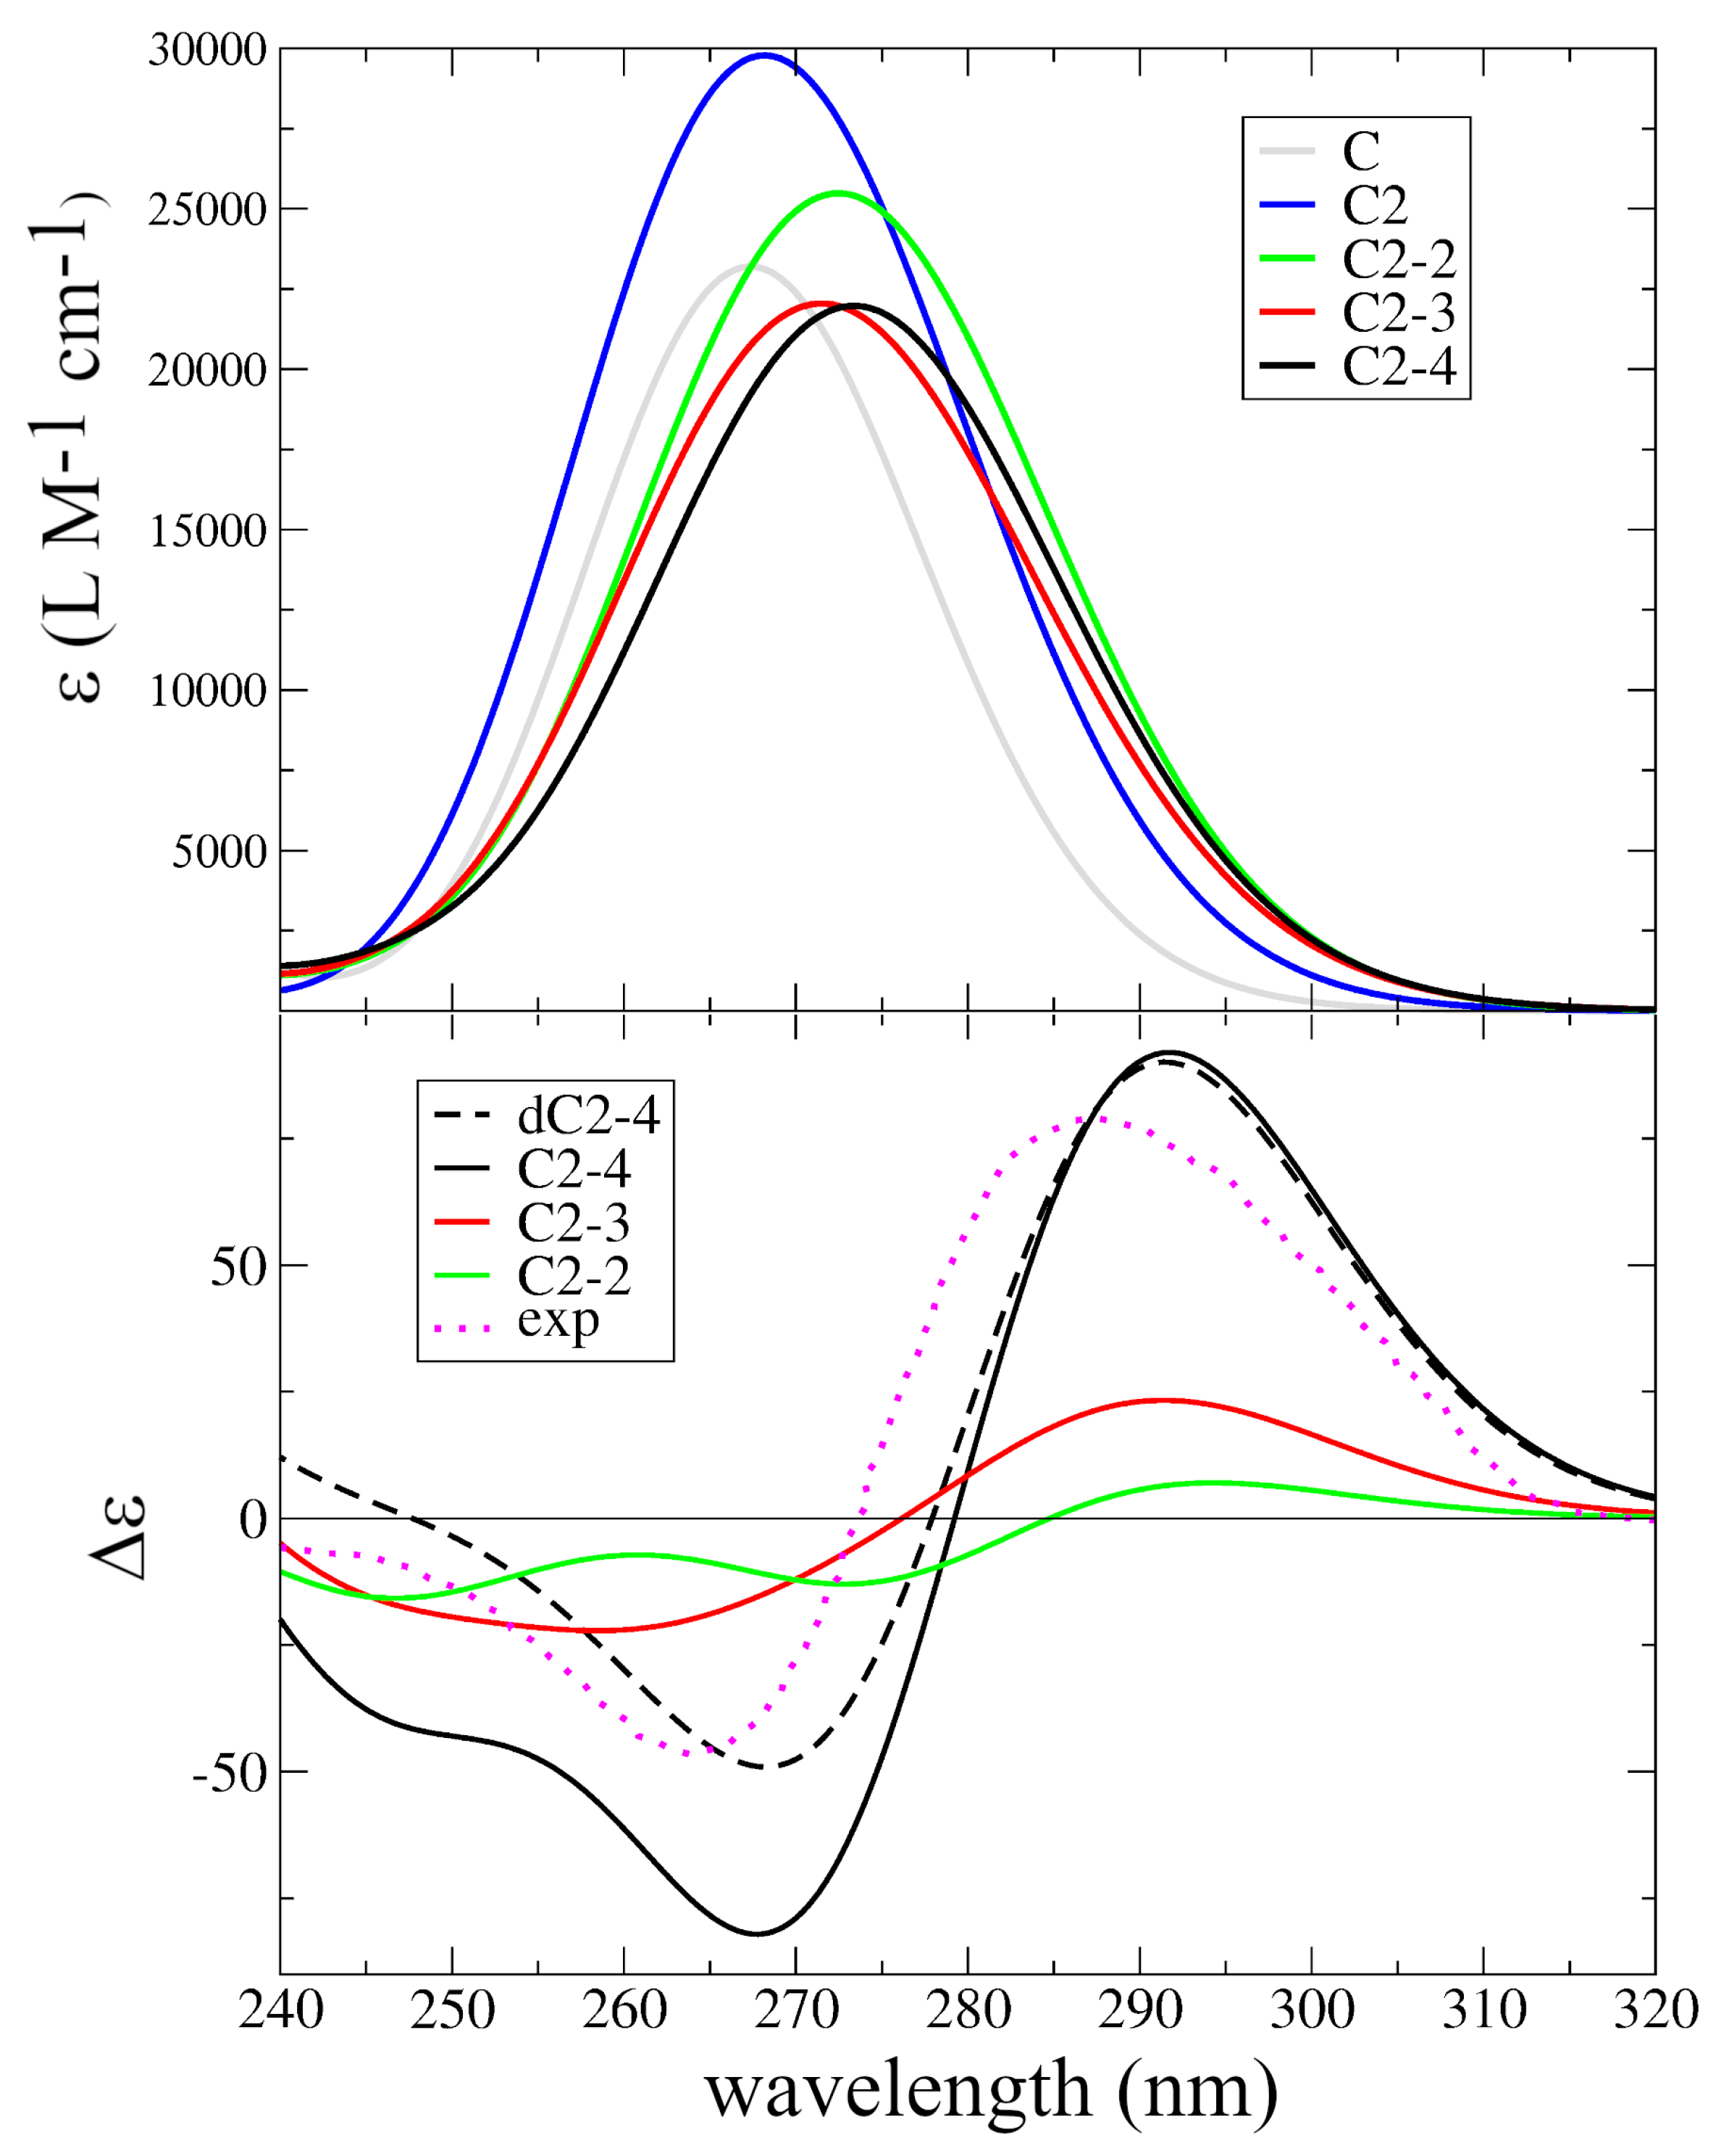
2.2. Assignment of the Steady State Optical Spectra
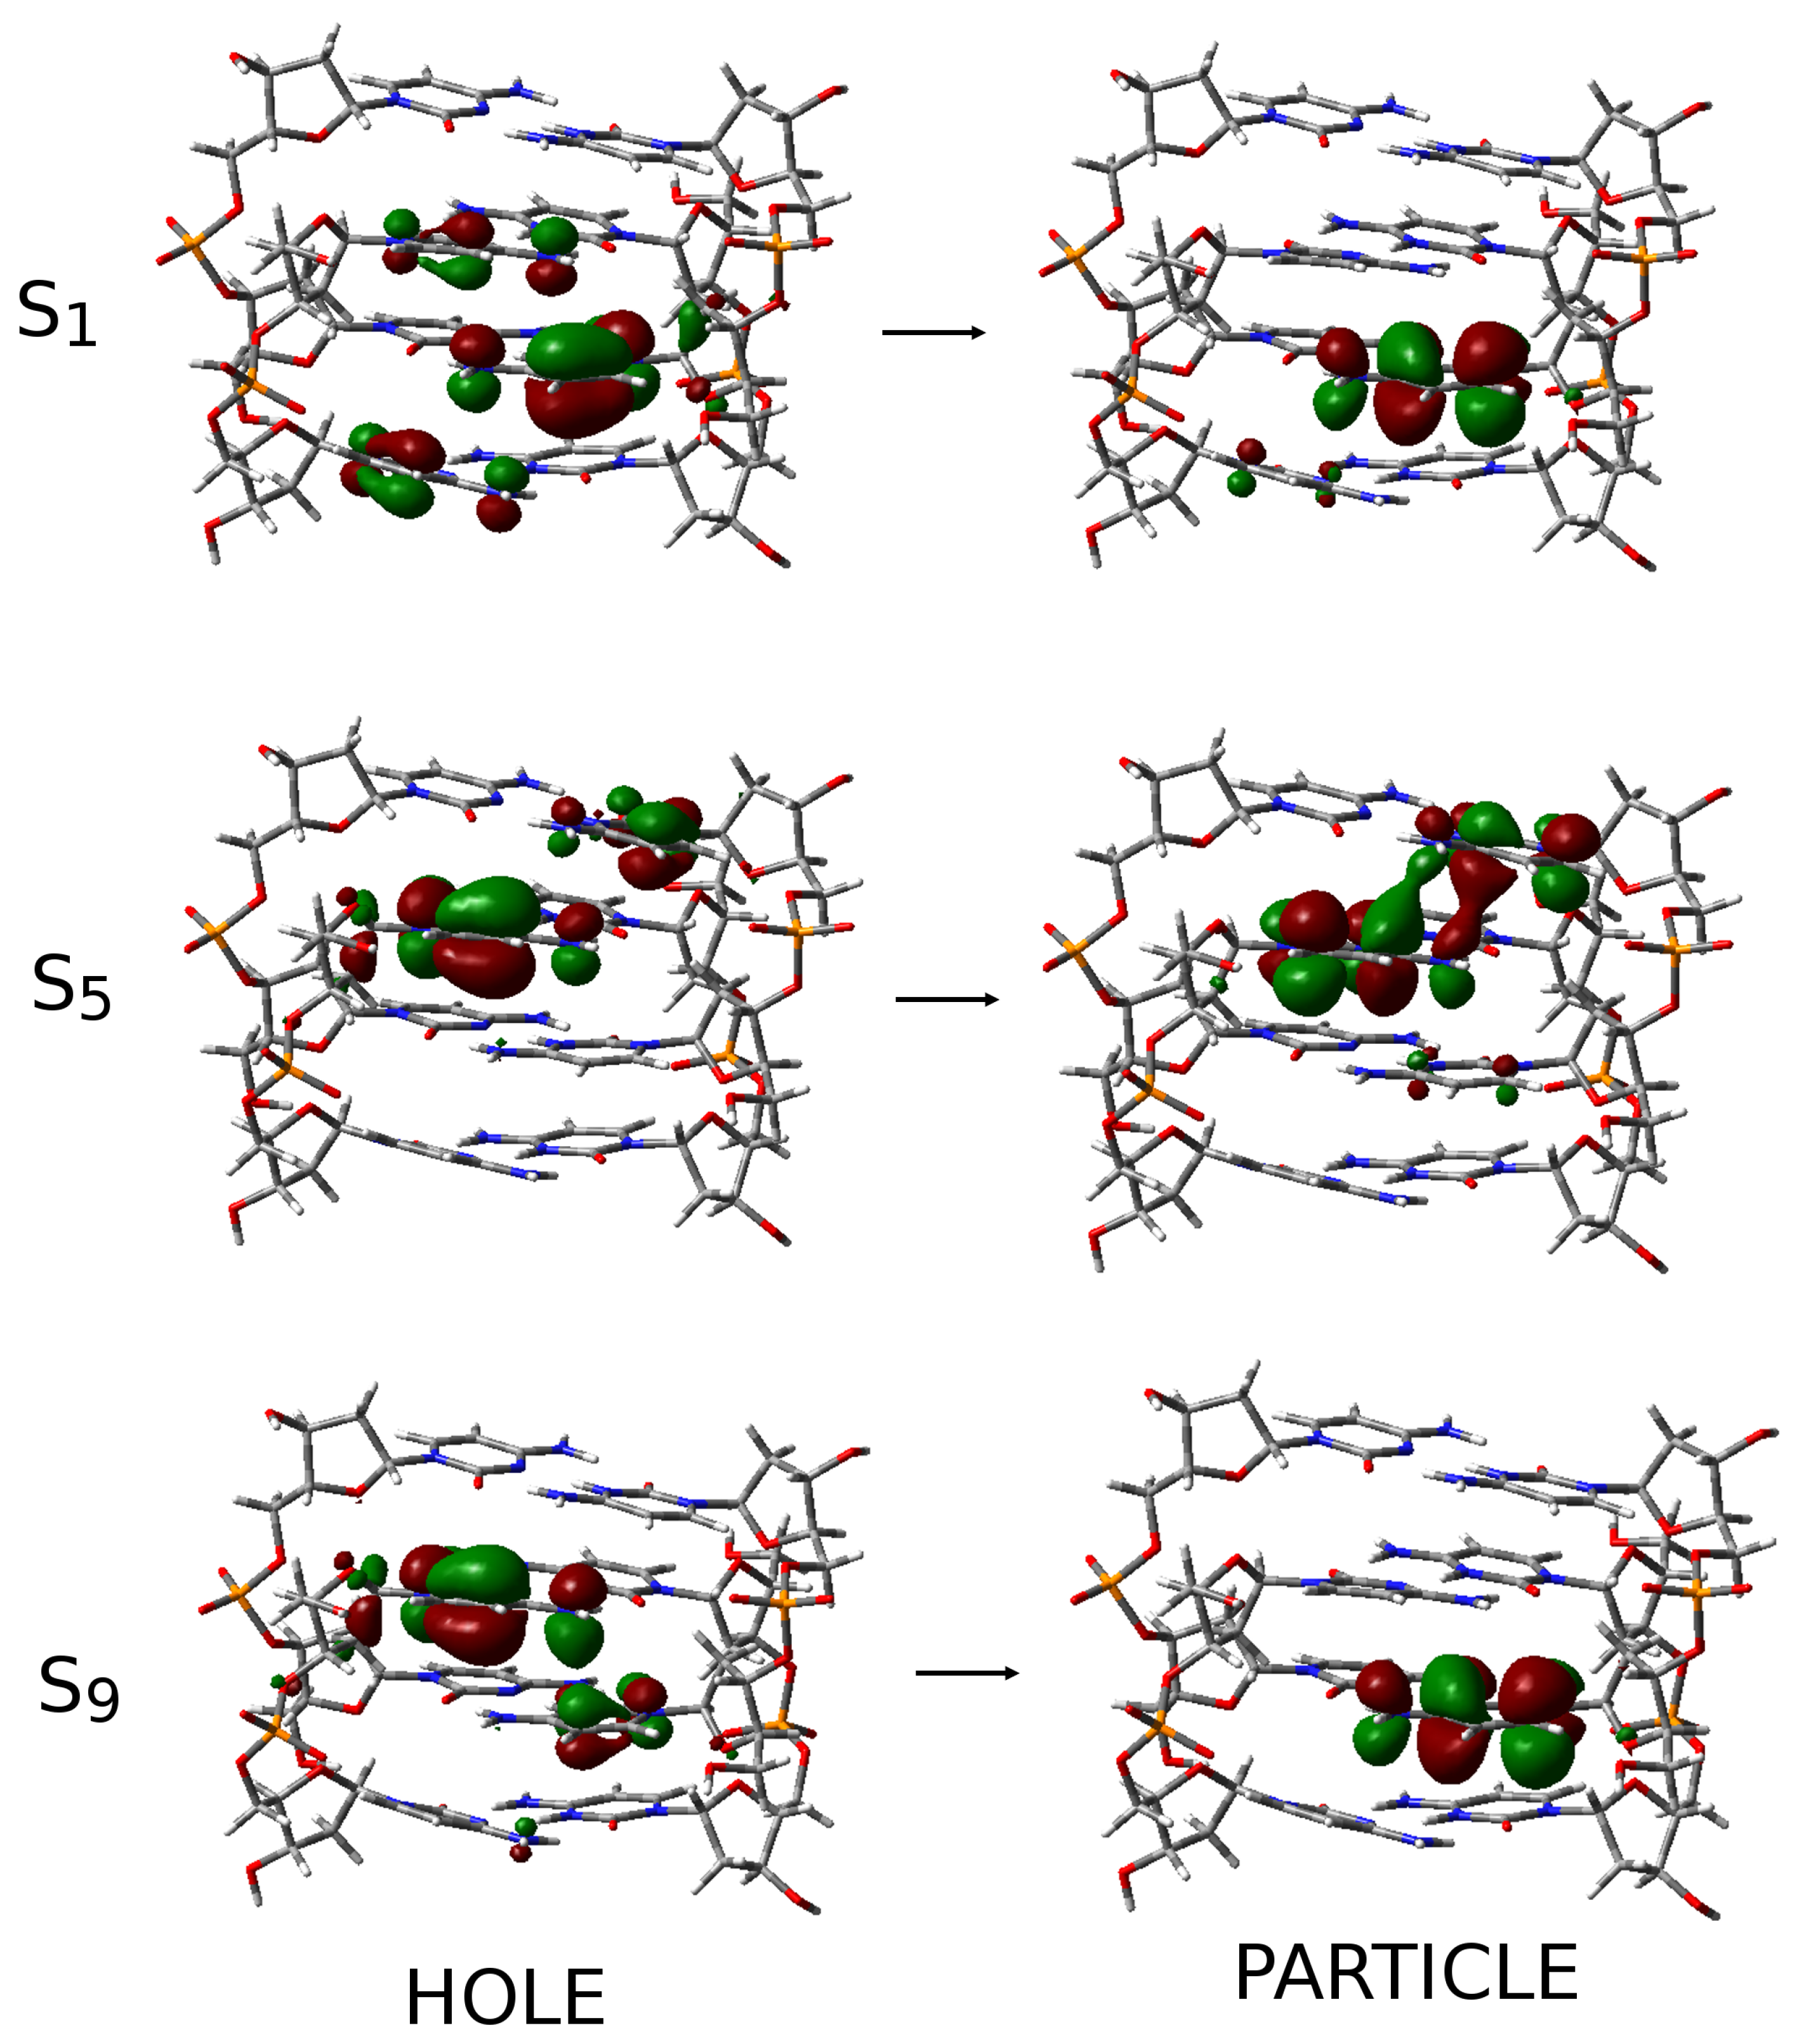
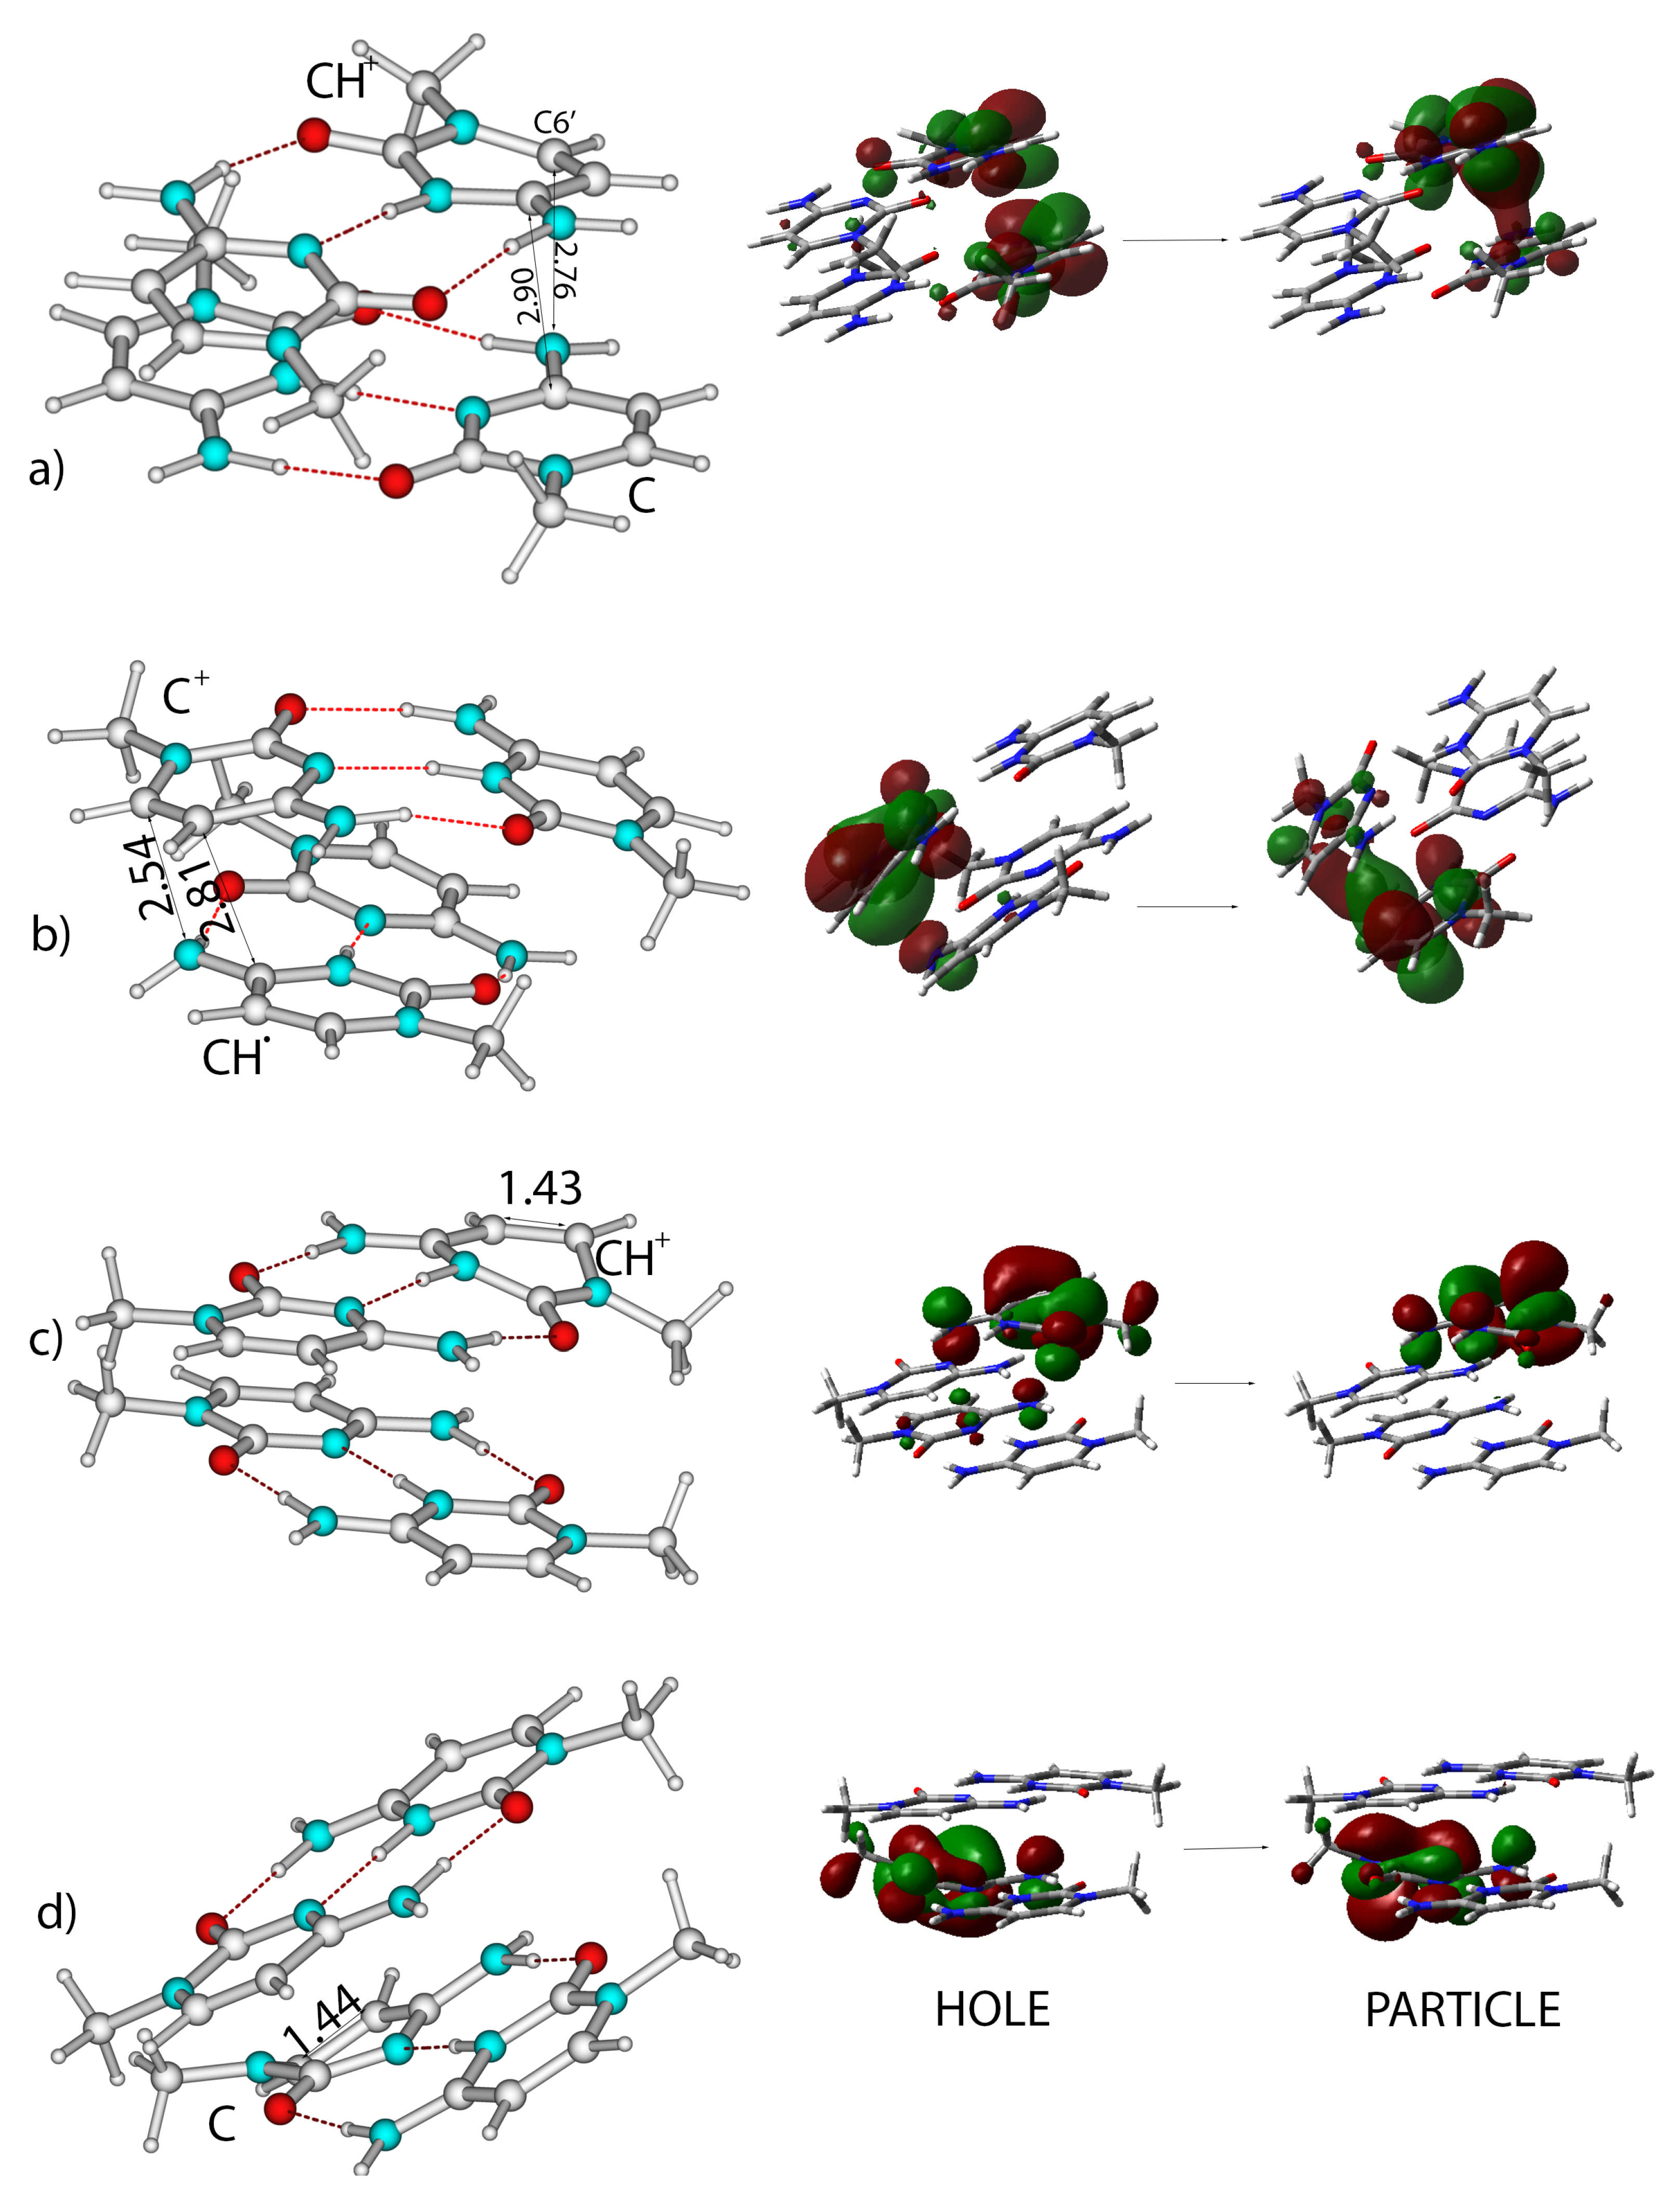
2.3. Excited State Minima
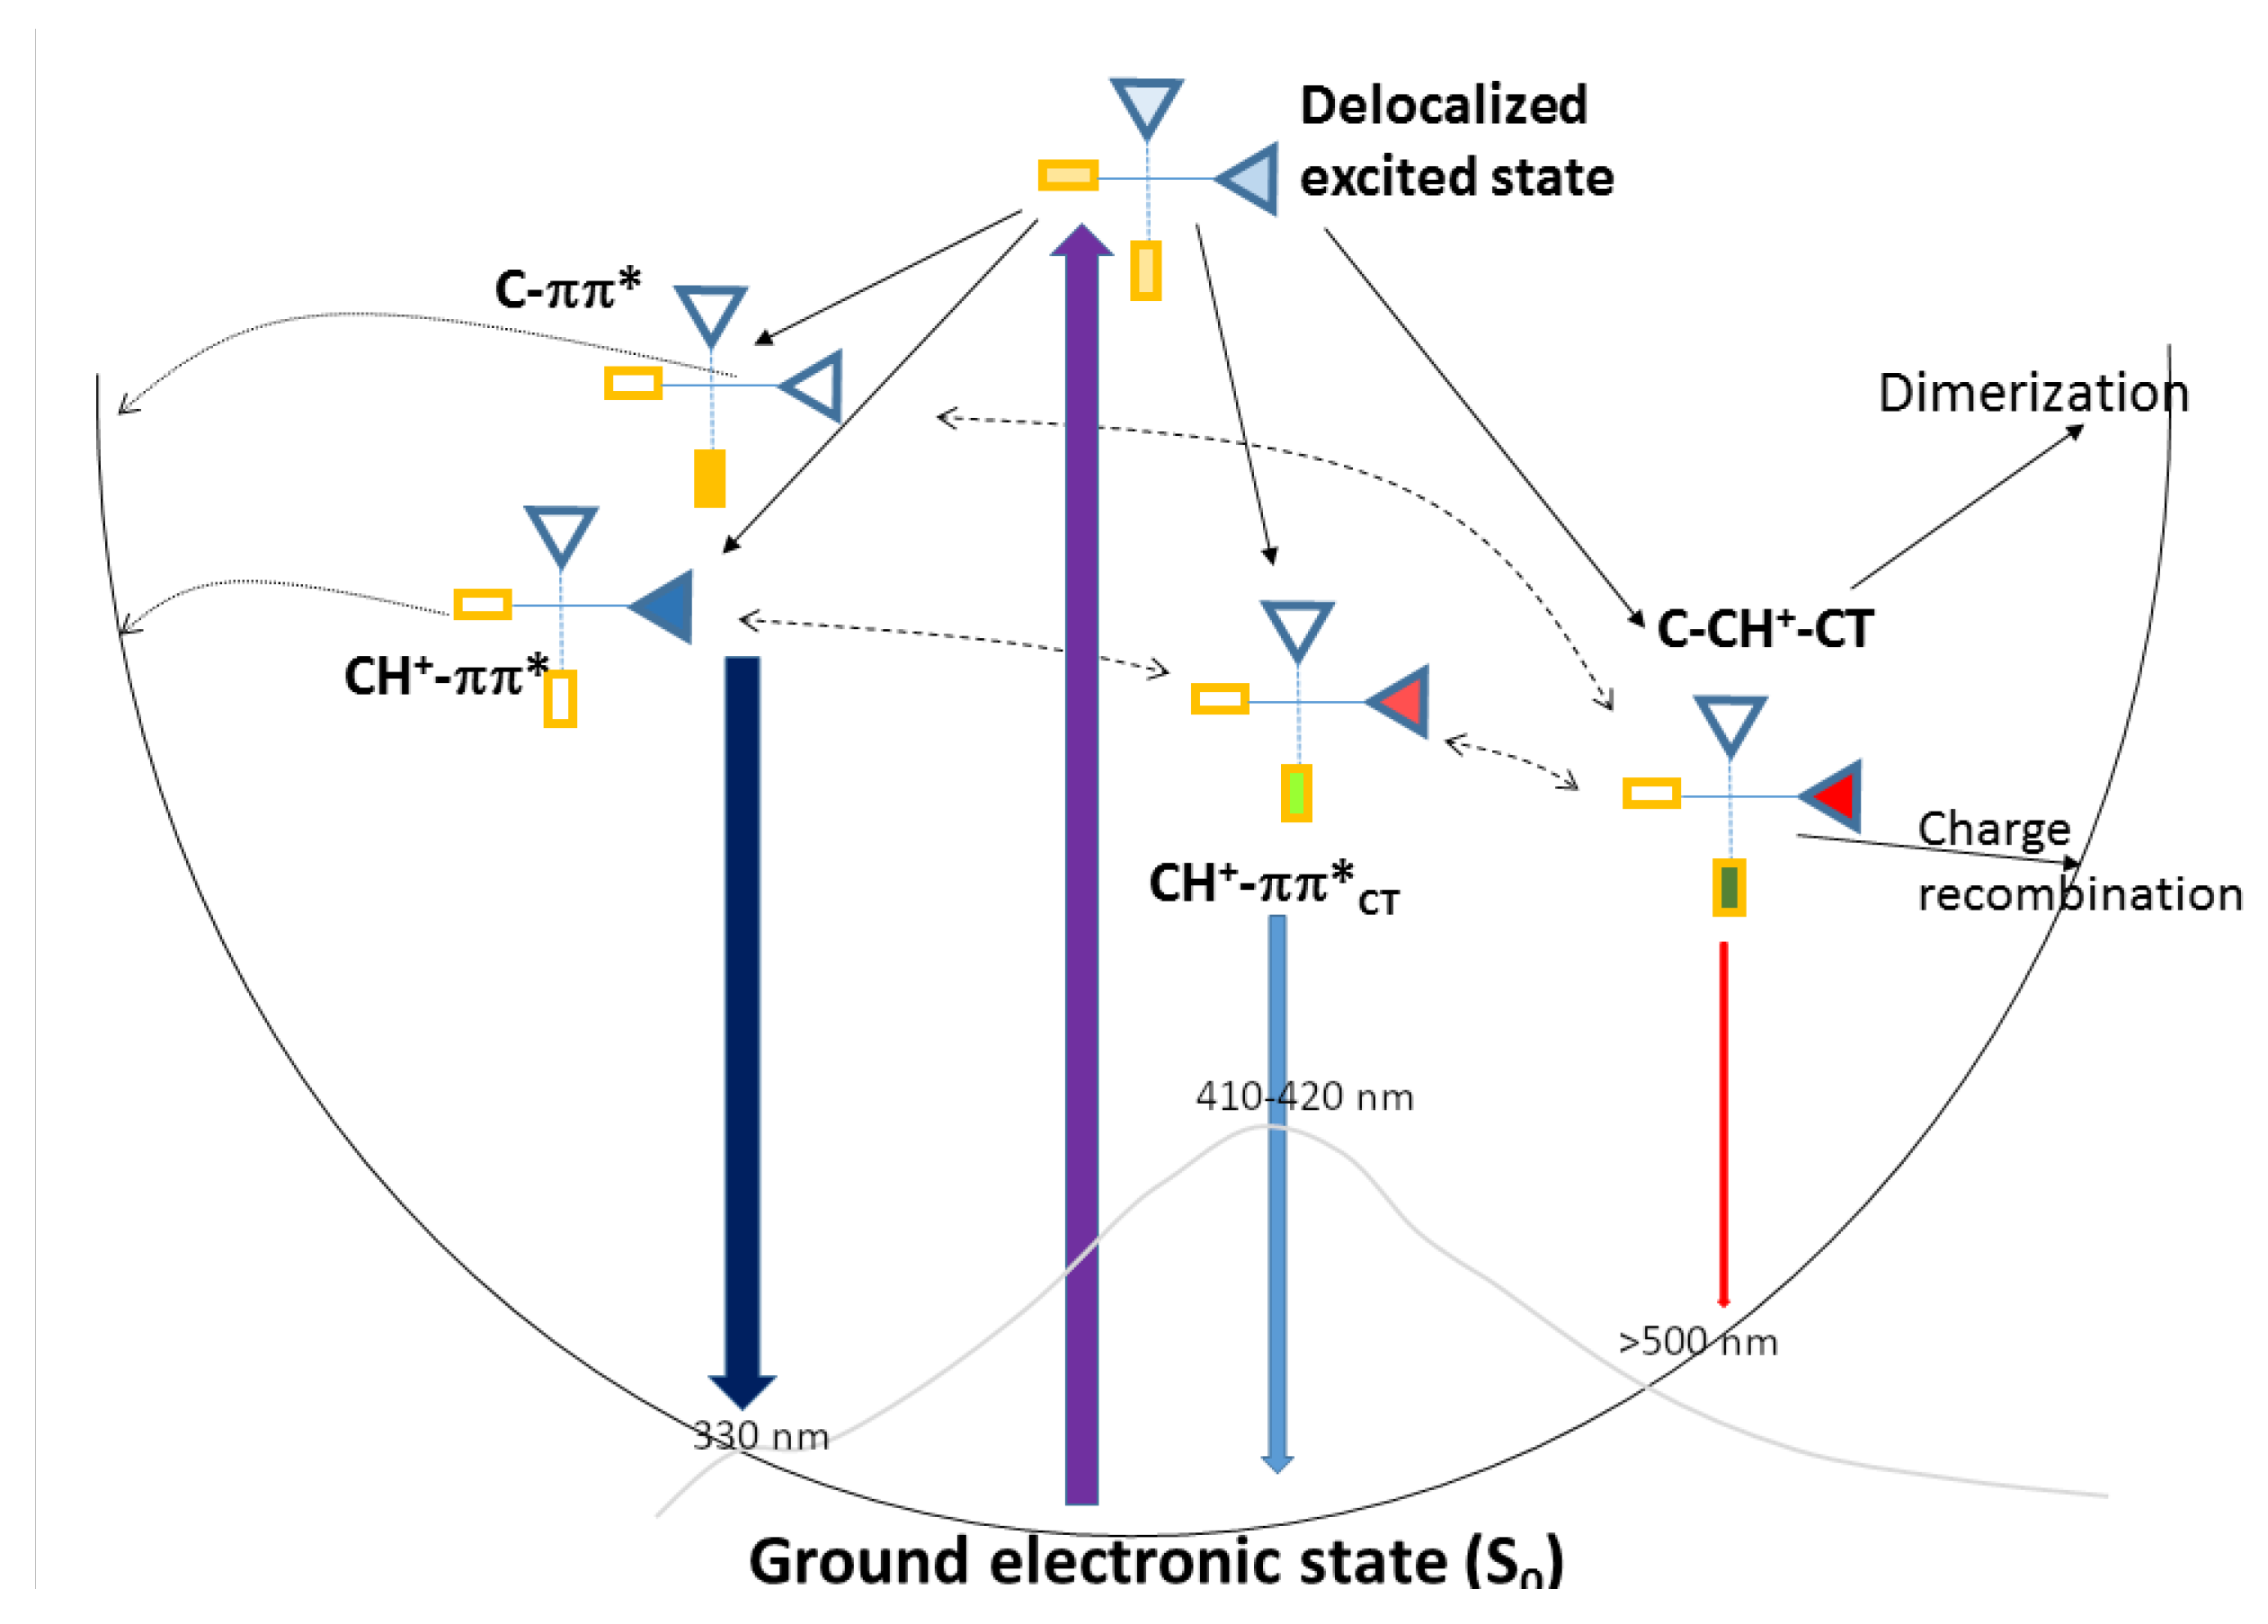
2.4. Photophysical Decay Paths
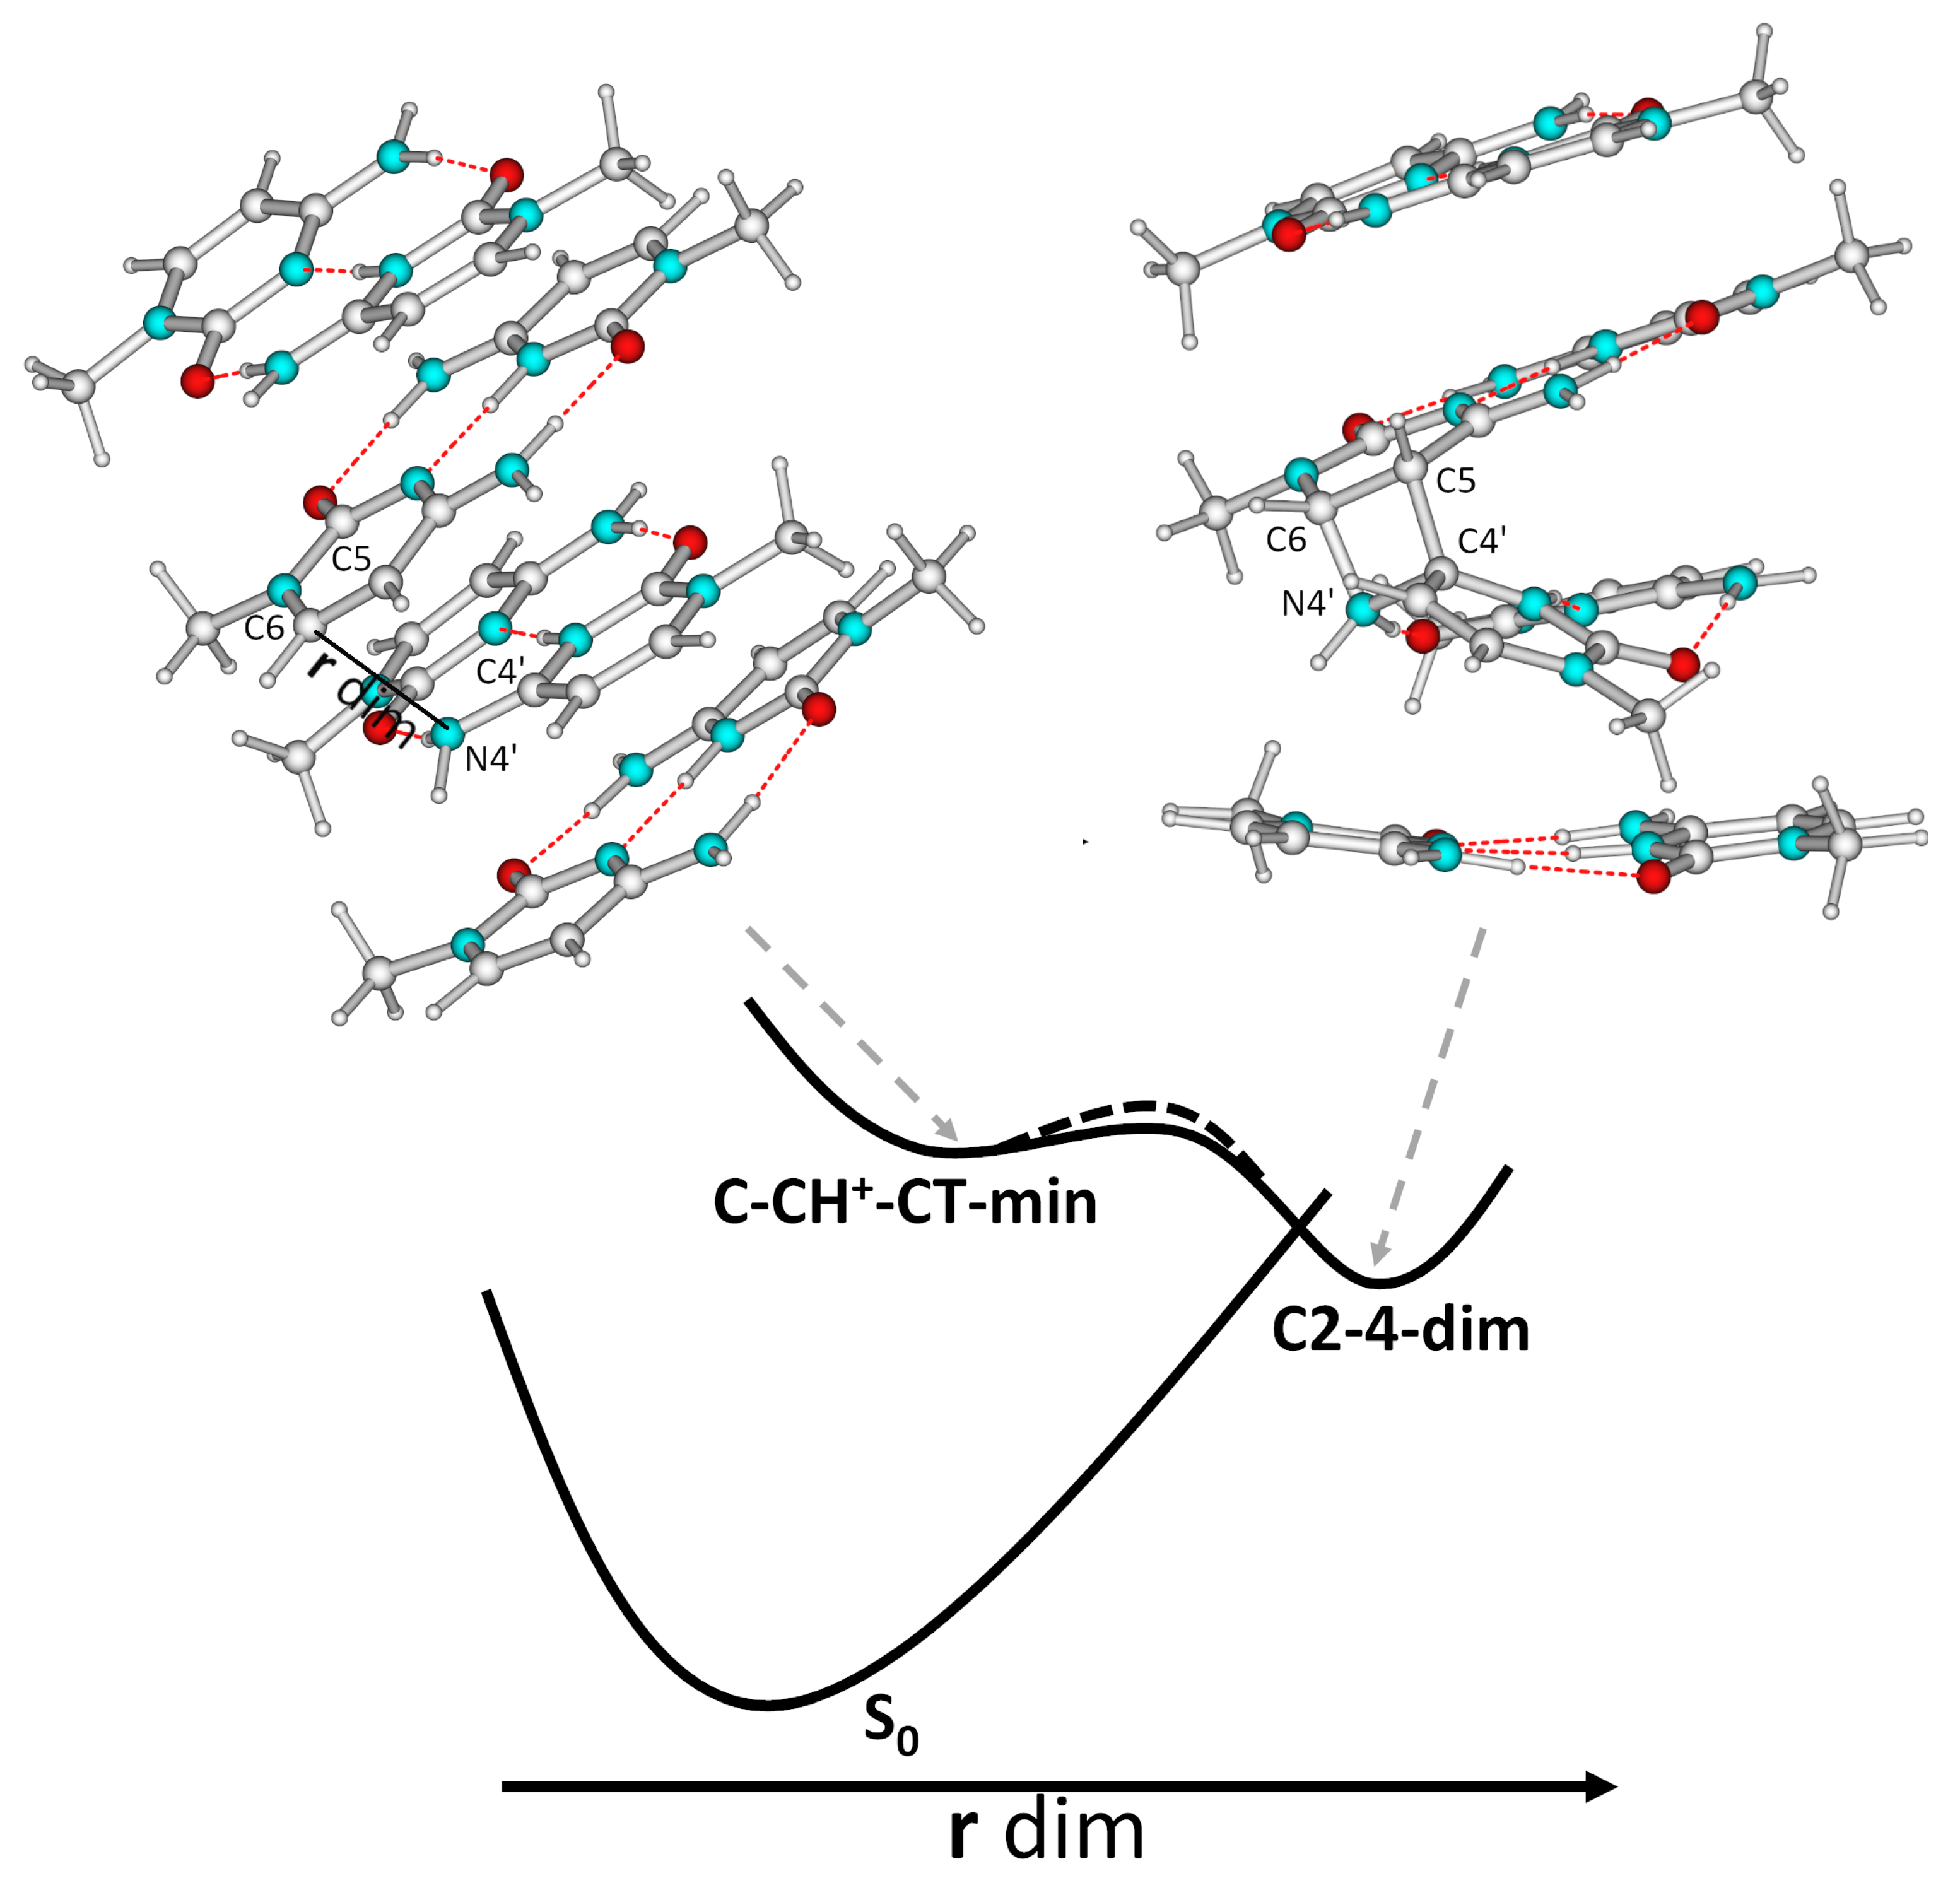
2.5. Photochemical Paths
3. Discussion
4. Materials and Methods
5. Conclusions
Supplementary Materials
Funding
Institutional Review Board Statement
Data Availability Statement
Conflicts of Interest
References
- Gehring, K.; Leroy, J.L.; Guéron, M. A tetrameric DNA structure with protonated cytosine-cytosine base pairs. Nature 1993, 363, 561. [Google Scholar] [CrossRef]
- Mergny, J.L.; Lacroix, L.; Han, X.; Leroy, J.L.; Helene, C. Intramolecular Folding of Pyrimidine Oligodeoxynucleotides into an i-DNA Motif. J. Am. Chem. Soc. 1995, 117, 8887–8898. [Google Scholar] [CrossRef]
- Day, H.A.; Pavlou, P.; Waller, Z.A.E. I-Motif DNA: Structure, Stability and Targeting with Ligands. Bioorg. Med. Chem. 2014, 22, 4407. [Google Scholar] [CrossRef]
- Abou Assi, H.; Garavís, M.; González, C.; Damha, M.J. I-Motif DNA: Structural Features and Significance to Cell Biology. Nucleic Acids Res. 2018, 46, 8038. [Google Scholar] [CrossRef] [PubMed] [Green Version]
- Shugar, D.; Fox, J.J. Spectrophotometric studies op nucleic acid derivatives and related compounds as a function of pH: I. Pyrimidines. Biochim. Biophys. Acta 1952, 9, 199–218. [Google Scholar] [CrossRef]
- Rajendran, A.; Nakano, S.I.; Sugimoto, N. Molecular crowding of the cosolutes induces an intramolecular i-motif structure of triplet repeat DNA oligomers at neutral pH. Chem. Comm. 2010, 46, 1299–1301. [Google Scholar] [CrossRef] [PubMed]
- Wright, E.P.; Huppert, J.L.; Waller, Z.A.E. Identification of multiple genomic DNA sequences which form i-motif structures at neutral pH. Nucleic Acids Res. 2017, 45, 2951–2959. [Google Scholar] [CrossRef] [Green Version]
- Dzatko, S.; Krafcikova, M.; Hänsel-Hertsch, R.; Fessl, T.; Fiala, R.; Loja, T.; Krafcik, D.; Mergny, J.L.; Foldynova-Trantirkova, S.; Trantirek, L. Evaluation of the Stability of DNA i-Motifs in the Nuclei of Living Mammalian Cells. Angew. Chem. Int. Ed. 2018, 57, 2165–2169. [Google Scholar] [CrossRef] [Green Version]
- Zeraati, M.; Langley, D.B.; Schofield, P.; Moye, A.L.; Rouet, R.; Hughes, W.E.; Bryan, T.M.; Dinger, M.E.; Christ, D. I-Motif DNA Structures Are Formed in the Nuclei of Human Cells. Nat. Chem. 2018, 10, 631. [Google Scholar] [CrossRef]
- Kang, H.J.; Kendrick, S.; Hecht, S.M.; Hurley, L.H. The Transcriptional Complex between the BCL2 I-Motif and HnRNP LL Is a Molecular Switch for Control of Gene Expression That Can Be Modulated by Small Molecules. J. Am. Chem. Soc. 2014, 136, 4172. [Google Scholar] [CrossRef]
- Kendrick, S.; Kang, H.J.; Alam, M.P.; Madathil, M.M.; Agrawal, P.; Gokhale, V.; Yang, D.; Hecht, S.M.; Hurley, L.H. The Dynamic Character of the BCL2 Promoter I-Motif Provides a Mechanism for Modulation of Gene Expression by Compounds That Bind Selectively to the Alternative DNA Hairpin Structure. J. Am. Chem. Soc. 2014, 136, 4161. [Google Scholar] [CrossRef]
- Kaiser, C.E.; Van Ert, N.A.; Agrawal, P.; Chawla, R.; Yang, D.; Hurley, L.H. Insight into the Complexity of the I-Motif and G-Quadruplex DNA Structures Formed in the KRAS Promoter and Subsequent Drug-Induced Gene Repression. J. Am. Chem. Soc. 2017, 139, 8522. [Google Scholar] [CrossRef] [PubMed]
- Takahashi, S.; Brazier, J.A.; Sugimoto, N. Topological Impact of Noncanonical DNA Structures on Klenow Fragment of DNA Polymerase. Proc. Natl. Acad. Sci. USA 2017, 114, 9605. [Google Scholar] [CrossRef] [PubMed]
- Garavís, M.; Escaja, N.; Gabelica, V.; Villasante, A.; González, C. Centromeric Alpha-Satellite DNA Adopts Dimeric i-Motif Structures Capped by at Hoogsteen Base Pairs. Chem. Eur. J. 2015, 21, 9816. [Google Scholar] [CrossRef] [Green Version]
- Phan, A.T.; Guéron, M.; Leroy, J.L. The solution structure and internal motions of a fragment of the cytidine-rich strand of the human telomere11Edited by I. Tinoco. J. Mol. Biol. 2000, 299, 123–144. [Google Scholar] [CrossRef]
- Ruggiero, E.; Lago, S.; Šket, P.; Nadai, M.; Frasson, I.; Plavec, J.; Richter, S.N. A dynamic i-motif with a duplex stem-loop in the long terminal repeat promoter of the HIV-1 proviral genome modulates viral transcription. Nucleic Acids Res. 2019, 47, 11057–11068. [Google Scholar] [CrossRef] [Green Version]
- Brown, S.L.; Kendrick, S. The i-Motif as a Molecular Target: More Than a Complementary DNA Secondary Structure. Pharmaceuticals 2021, 14, 96. [Google Scholar] [CrossRef]
- Debnath, M.; Fatma, K.; Dash, J. Chemical Regulation of DNA i-Motifs for Nanobiotechnology and Therapeutics. Angew. Chem. Int. Ed. 2019, 58, 2942–2957. [Google Scholar] [CrossRef] [PubMed]
- Luo, X.; Zhang, J.; Gao, Y.; Pan, W.; Yang, Y.; Li, X.; Chen, L.; Wang, C.; Wang, Y. Emerging roles of i-motif in gene expression and disease treatment. Front. Pharmacol. 2023, 14, 1136251. [Google Scholar] [CrossRef] [PubMed]
- Dong, Y.; Yang, Z.; Liu, D. DNA Nanotechnology Based on I-Motif Structures. Acc. Chem. Res. 2014, 47, 1853. [Google Scholar] [CrossRef]
- Peng, Y.; Wang, X.; Xiao, Y.; Feng, L.; Zhao, C.; Ren, J.; Qu, X. i-Motif Quadruplex DNA-Based Biosensor for Distinguishing Single- and Multiwalled Carbon Nanotubes. J. Am. Chem. Soc. 2009, 131, 13813–13818. [Google Scholar] [CrossRef] [PubMed]
- Nesterova, I.V.; Nesterov, E.E. Rational Design of Highly Responsive pH Sensors Based on DNA I-Motif. J. Am. Chem. Soc. 2014, 136, 8843. [Google Scholar] [CrossRef] [PubMed]
- Dembska, A.; Bielecka, P.; Juskowiak, B. pH-Sensing Fluorescence Oligonucleotide Probes Based on an i-Motif Scaffold: A Review. Anal. Methods 2017, 9, 6092. [Google Scholar] [CrossRef]
- Alba, J.J.; Sadurní, A.; Gargallo, R. Nucleic Acid i-Motif Structures in Analytical Chemistry. Crit. Rev. Anal. Chem. 2016, 46, 443–454. [Google Scholar] [CrossRef] [Green Version]
- Yatsunyk, L.A.; Mendoza, O.; Mergny, J.L. “Nano-oddities”: Unusual Nucleic Acid Assemblies for DNA-Based Nanostructures and Nanodevices. Acc. Chem. Res. 2014, 47, 1836–1844. [Google Scholar] [CrossRef]
- Turaev, A.V.; Isaakova, E.A.; Severov, V.V.; Bogomazova, A.N.; Zatsepin, T.S.; Sardushkin, M.V.; Aralov, A.V.; Lagarkova, M.A.; Pozmogova, G.E.; Varizhuk, A.M. Genomic DNA i-motifs as fast sensors responsive to near-physiological pH microchanges. Biosens. Bioelectron. 2021, 175, 112864. [Google Scholar] [CrossRef]
- Wimberger, L.; Rizzuto, F.J.; Beves, J.E. Modulating the Lifetime of DNA Motifs Using Visible Light and Small Molecules. J. Am. Chem. Soc. 2023, 145, 2088–2092. [Google Scholar] [CrossRef]
- Fleming, A.M.; Ding, Y.; Rogers, R.A.; Zhu, J.; Zhu, J.; Burton, A.D.; Carlisle, C.B.; Burrows, C.J. 4n-1 Is a “Sweet Spot” in DNA i-Motif Folding of 2’-Deoxycytidine Homopolymers. J. Am. Chem. Soc. 2017, 139, 4682. [Google Scholar] [CrossRef]
- Dvořáková, Z.; Renčiuk, D.; Kejnovská, I.; Školáková, P.; Bednářová, K.; Sagi, J.; Vorlíčková, M. i-Motif of cytosine-rich human telomere DNA fragments containing natural base lesions. Nucleic Acids Res. 2018, 46, 1624–1634. [Google Scholar] [CrossRef] [Green Version]
- Školáková, P.; Gajarský, M.; Palacký, J.; Šubert, D.; Renčiuk, D.; Trantírek, L.; Mergny, J.L.; Vorlíčková, M. DNA i-motif formation at neutral pH is driven by kinetic partitioning. Nucleic Acids Res. 2023, 51, 2950–2962. [Google Scholar] [CrossRef]
- Cheng, M.; Qiu, D.; Tamon, L.; Ištvánková, E.; Víšková, P.; Amrane, S.; Guédin, A.; Chen, J.; Lacroix, L.; Ju, H.; et al. Thermal and pH Stabilities of I-DNA: Confronting in Vitro Experiments with Models and In-Cell NMR Data. Angew. Chem. Int. Ed. 2021, 60, 10286. [Google Scholar] [CrossRef] [PubMed]
- Mir, B.; Serrano, I.; Buitrago, D.; Orozco, M.; Escaja, N.; González, C. Prevalent Sequences in the Human Genome Can Form Mini I-Motif Structures at Physiological pH. J. Am. Chem. Soc. 2017, 139, 13985. [Google Scholar] [CrossRef] [Green Version]
- Serrano-Chacón, I.; Mir, B.; Cupellini, L.; Colizzi, F.; Orozco, M.; Escaja, N.; González, C. pH-Dependent Capping Interactions Induce Large-Scale Structural Transitions in i-Motifs. J. Am. Chem. Soc. 2023, 145, 3696–3705. [Google Scholar] [CrossRef]
- Iaccarino, N.; Cheng, M.; Qiu, D.; Pagano, B.; Amato, J.; Di Porzio, A.; Zhou, J.; Randazzo, A.; Mergny, J.L. Effects of Sequence and Base Composition on the CD and TDS Profiles of i-DNA. Angew. Chem. Int. Ed. 2021, 60, 10295–10303. [Google Scholar] [CrossRef] [PubMed]
- Rodriguez, J.; Domínguez, A.; Aviñó, A.; Borgonovo, G.; Eritja, R.; Mazzini, S.; Gargallo, R. Exploring the stabilizing effect on the i-motif of neighboring structural motifs and drugs. Int. J. Biol. Macromol. 2023, 242, 124794. [Google Scholar] [CrossRef]
- Mondal, M.; Bhattacharyya, D.; Gao, Y.Q. Structural Properties and Influence of Solvent on the Stability of Telomeric Four-Stranded i-Motif DNA. Phys. Chem. Chem. Phys. 2019, 21, 21549. [Google Scholar] [CrossRef]
- Mondal, M.; Gao, Y.Q. Microscopic Insight into pH-Dependent Conformational Dynamics and Noncanonical Base Pairing in Telomeric i-Motif DNA. J. Phys. Chem. Lett. 2022, 13, 5109. [Google Scholar] [CrossRef]
- Amato, J.; Iaccarino, N.; D’Aria, F.; D’Amico, F.; Randazzo, A.; Giancola, C.; Cesàro, A.; Di Fonzo, S.; Pagano, B. Conformational plasticity of DNA secondary structures: Probing the conversion between i-motif and hairpin species by circular dichroism and ultraviolet resonance Raman spectroscopies. Phys. Chem. Chem. Phys. 2022, 24, 7028–7044. [Google Scholar] [CrossRef] [PubMed]
- Benabou, S.; Aviñó, A.; Eritja, R.; González, C.; Gargallo, R. Fundamental aspects of the nucleic acid i-motif structures. RSC Adv. 2014, 4, 26956–26980. [Google Scholar] [CrossRef] [Green Version]
- Školáková, P.; Renčiuk, D.; Palacký, J.; Krafčík, D.; Dvořáková, Z.; Kejnovská, I.; Bednářová, K.; Vorlíčková, M. Systematic investigation of sequence requirements for DNA i-motif formation. Nucleic Acids Res. 2019, 47, 2177–2189. [Google Scholar] [CrossRef] [Green Version]
- Improta, R.; Douki, T. DNA Photodamage: From Light Absorption to Cellular Responses and Skin Cancer; Royal Society of Chemistry: London, UK, 2021. [Google Scholar]
- Cadet, J.; Vigny, P. The Photochemistry of Nucleic Acids. In Bioinorganic Photochemistry; Morrison, H., Ed.; Wiley: Hoboken, NJ, USA, 1990; Volume 1, pp. 1–272. [Google Scholar]
- Cadet, J.; Grand, A.; Douki, T. Solar UV Radiation-Induced DNA Bipyrimidine Photoproducts: Formation and Mechanistic Insights. In Photoinduced Phenomena in Nucleic Acids II: DNA Fragments and Phenomenological Aspects; Barbatti, M., Borin, A.C., Ullrich, S., Eds.; Springer International Publishing: Berlin/Heidelberg, Germany, 2015; pp. 249–275. [Google Scholar] [CrossRef]
- Taylor, J.S. Unraveling the Molecular Pathway from Sunlight to Skin Cancer. Acc. Chem. Res. 1994, 27, 76–82. [Google Scholar] [CrossRef]
- Martínez Fernández, L.; Santoro, F.; Improta, R. Nucleic Acids as a Playground for the Computational Study of the Photophysics and Photochemistry of Multichromophore Assemblies. Acc. Chem. Res. 2022, 55, 2077–2087. [Google Scholar] [CrossRef]
- Gustavsson, T.; Markovitsi, D. Fundamentals of the Intrinsic DNA Fluorescence. Acc. Chem. Res. 2021, 54, 1226–1235. [Google Scholar] [CrossRef] [PubMed]
- Schreier, W.J.; Gilch, P.; Zinth, W. Early Events of DNA Photodamage. Ann. Rev. Phys. Chem. 2015, 66, 497–519. [Google Scholar] [CrossRef]
- Chen, J.; Zhang, Y.; Kohler, B. Excited states in DNA strands investigated by ultrafast laser spectroscopy. Top. Curr. Chem. 2015, 356, 39. [Google Scholar] [PubMed]
- Crespo-Hernández, C.E.; Cohen, B.; Hare, P.M.; Kohler, B. Ultrafast Excited-State Dynamics in Nucleic Acids. Chem. Rev. 2004, 104, 1977–2020. [Google Scholar] [CrossRef]
- Barbatti, M.; Borin, C.A.; Ullrich, S. Photoinduced Phenomena in Nucleic Acids I: Nucleobases in the Gas Phase and in Solvents; Springer International Publishing: Cham, Switzerland, 2015; Volume 355, pp. 1–358. [Google Scholar]
- Improta, R.; Santoro, F.; Blancafort, L. Quantum mechanical studies on the photophysics and the photochemistry of nucleic acids and nucleobases. Chem. Rev. 2016, 116, 3540–3593. [Google Scholar] [CrossRef]
- Martínez-Fernández, L.; Esposito, L.; Improta, R. Studying the excited electronic states of guanine rich DNA quadruplexes by quantum mechanical methods: Main achievements and perspectives. Photochem. Photobiol. Sci. 2020, 19, 436–444. [Google Scholar] [CrossRef]
- Martinez-Fernandez, L.; Changenet, P.; Banyasz, A.; Gustavsson, T.; Markovitsi, D.; Improta, R. Comprehensive Study of Guanine Excited State Relaxation and Photoreactivity in G-quadruplexes. J. Phys. Chem. Lett. 2019, 10, 6873–6877. [Google Scholar] [CrossRef]
- Changenet-Barret, P.; Hua, Y.; Markovitsi, D. Electronic Excitations in Guanine Quadruplexes. In Photoinduced Phenomena in Nucleic Acids II: DNA Fragments and Phenomenological Aspects; Barbatti, M., Borin, A.C., Ullrich, S., Eds.; Springer International Publishing: Cham, Switzerland, 2015; pp. 183–201. [Google Scholar]
- Keane, P.M.; Wojdyla, M.; Doorley, G.W.; Kelly, J.M.; Parker, A.W.; Clark, I.P.; Greetham, G.M.; Towrie, M.; Magno, L.M.; Quinn, S.J. Long-lived excited states in i-motif DNA studied by picosecond time-resolved IR spectroscopy. Chem. Commun. 2014, 50, 2990–2992. [Google Scholar] [CrossRef]
- Cohen, B.; Larson, M.H.; Kohler, B. Ultrafast excited-state dynamics of RNA and DNA C tracts. Chem. Phys. 2008, 350, 165–174. [Google Scholar] [CrossRef] [PubMed] [Green Version]
- Benabou, S.; Ruckebusch, C.; Sliwa, M.; Aviñó, A.; Eritja, R.; Gargallo, R.; de Juan, A. Study of light-induced formation of photodimers in the i-motif nucleic acid structure by rapid-scan FTIR difference spectroscopy and hybrid hard- and soft-modelling. Phys. Chem. Chem. Phys. 2018, 20, 19635–19646. [Google Scholar] [CrossRef] [PubMed]
- Ma, C.; Chan, R.C.T.; Chan, C.T.L.; Wong, A.K.W.; Chung, B.P.Y.; Kwok, W.M. Fluorescence and Ultrafast Fluorescence Unveil the Formation, Folding Molecularity, and Excitation Dynamics of Homo-Oligomeric and Human Telomeric i-Motifs at Acidic and Neutral pH. Chem. Asian J. 2018, 13, 3706–3717. [Google Scholar] [CrossRef]
- Reveguk, Z.V.; Khoroshilov, E.V.; Sharkov, A.V.; Pomogaev, V.A.; Buglak, A.A.T.A.N.; Kononov, I. Exciton Absorption and Luminescence in i-Motif DNA. Sci. Rep. 2019, 9, 15988. [Google Scholar] [CrossRef] [Green Version]
- Cadet, J.; Davies, K.J.A.; Medeiros, M.H.G.; Di Mascio, P.; Wagner, J.R. Formation and repair of oxidatively generated damage in cellular DNA. Free Radic. Biol. Med. 2017, 107, 13. [Google Scholar] [CrossRef]
- Wang, Y.; Zhao, H.; Yang, C.; Jie, J.; Dai, X.; Zhou, Q.; Liu, K.; Song, D.; Su, H. Degradation of Cytosine Radical Cations in 2’-Deoxycytidine and in i-Motif DNA: Hydrogen-Bonding Guided Pathways. J. Am. Chem. Soc. 2019, 141, 1970–1979. [Google Scholar] [CrossRef]
- Kreutzer, D.A.; Essigmann, J.M. Oxidized, deaminated cytosines are a source of C → T transitions in vivo. Proc. Natl. Acad. Sci. USA 1998, 95, 3578. [Google Scholar] [CrossRef] [PubMed]
- Malliavin, T.E.; Gau, J.; Snoussi, K.; Leroy, J.L. Stability of the I-motif structure is related to the interactions between phosphodiester backbones. Biophys. J. 2003, 84, 3838–3847. [Google Scholar] [CrossRef] [Green Version]
- Berger, I.; Egli, M.; Rich, A. Inter-strand C-H…O hydrogen bonds stabilizing four-stranded intercalated molecules: Stereoelectronic effects of O4’ in cytosine-rich DNA. Proc. Natl. Acad. Sci. USA 1996, 93, 12116–12121. [Google Scholar] [CrossRef]
- Tsankov, D.; Krasteva, M.; Andrushchenko, V.; van de Sande, J.; Wieser, H. Vibrational circular dichroism signature of hemiprotonated intercalated four-stranded i-DNA. Biophys. Chem. 2006, 119, 1–6. [Google Scholar] [CrossRef]
- Holm, A.I.S.; Nielsen, L.M.; Kohler, B.; Hoffmann, S.V.; Nielsen, S.B. Electronic coupling between cytosine bases in DNA single strands and i-motifs revealed from synchrotron radiation circular dichroism experiments. Phys. Chem. Chem. Phys. 2010, 12, 3426–3430. [Google Scholar] [CrossRef] [PubMed]
- Martinez Fernandez, L.; Improta, R. The photophysics of protonated cytidine and hemiprotonated cytidine base pair: A computational study. Photochem. Photobiol. 2023, in press. [Google Scholar] [CrossRef] [PubMed]
- Martínez-Fernández, L.; Pepino, A.J.; Segarra-Martí, J.; Jovaišaitė, J.; Vaya, I.; Nenov, A.; Markovitsi, D.; Gustavsson, T.; Banyasz, A.; Garavelli, M.; et al. Photophysics of Deoxycytidine and 5-Methyldeoxycytidine in Solution: A Comprehensive Picture by Quantum Mechanical Calculations and Femtosecond Fluorescence Spectroscopy. J. Am. Chem. Soc. 2017, 139, 7780–7791. [Google Scholar] [CrossRef] [PubMed]
- Martínez-Fernández, L.; Improta, R. Sequence dependence on DNA photochemistry: A computational study of photodimerization pathways in TpdC and dCpT dinucleotides. Photochem. Photobiol. Sci. 2018, 17, 586–591. [Google Scholar] [CrossRef]
- Improta, R.; Barone, V. Interplay between “Neutral” and “Charge-Transfer” Excimers Rules the Excited State Decay in Adenine-Rich Polynucleotides. Angew. Chem. Int. Ed. 2011, 50, 12016–12019. [Google Scholar] [CrossRef]
- Tomasi, J.; Mennucci, B.; Cammi, R. Quantum mechanical continuum solvation models. Chem. Rev. 2005, 105, 2999–3094. [Google Scholar] [CrossRef]
- Keane, P.M.; Baptista, F.R.; Gurung, S.P.; Devereux, S.J.; Sazanovich, I.V.; Towrie, M.; Brazier, J.A.; Cardin, C.J.; Kelly, J.M.; Quinn, S.J. Long-Lived Excited-State Dynamics of i-Motif Structures Probed by Time-Resolved Infrared Spectroscopy. ChemPhysChem 2016, 17, 1281–1287. [Google Scholar] [CrossRef] [Green Version]
- Lieblein, A.L.; Krämer, M.; Dreuw, A.; Fürtig, B.; Schwalbe, H. The Nature of Hydrogen Bonds in Cytidine⋯H+⋯Cytidine DNA Base Pairs. Angew. Chem. Int. Ed. 2012, 51, 4067–4070. [Google Scholar] [CrossRef]
- Douki, T. The variety of UV-induced pyrimidine dimeric photoproducts in DNA as shown by chromatographic quantification methods. Photochem. Photobiol. Sci. 2013, 12, 1286–1302. [Google Scholar] [CrossRef]
- Zhao, Y.; Truhlar, D.G. Density Functionals with Broad Applicability in Chemistry. Acc. Chem. Res. 2008, 41, 157–167. [Google Scholar] [CrossRef]
- Green, J.A.; Asha, H.; Santoro, F.; Improta, R. Excitonic Model for Strongly Coupled Multichromophoric Systems: The Electronic Circular Dichroism Spectra of Guanine Quadruplexes as Test Cases. J. Chem. Theory Comput. 2021, 17, 405–415. [Google Scholar] [CrossRef] [PubMed]
- Asha, H.; Green, J.A.; Esposito, L.; Martinez-Fernandez, L.; Santoro, F.; Improta, R. Effect of the Thermal Fluctuations of the Photophysics of GC and CG DNA Steps: A Computational Dynamical Study. J. Phys. Chem. B 2022, 126, 10608–10621. [Google Scholar] [CrossRef]
- Asha, H.; Green, J.A.; Esposito, L.; Santoro, F.; Improta, R. Computing the electronic circular dichroism spectrum of DNA quadruple helices of different topology: A critical test for a generalized excitonic model based on a fragment diabatization. Chirality 2023, in press. [Google Scholar] [CrossRef] [PubMed]
- Yanai, T.; Tew, D.; Handy, N. A new hybrid exchange-correlation functional using the Coulomb-attenuating method (CAM-B3LYP). Chem. Phys. Lett. 2004, 393, 51. [Google Scholar] [CrossRef] [Green Version]
- Chai, J.D.; Head-Gordon, M. Long-range corrected hybrid density functionals with damped atom–atom dispersion corrections. Phys. Chem. Chem. Phys. 2008, 10, 6615–6620. [Google Scholar] [CrossRef] [Green Version]
- Avila Ferrer, F.J.; Cerezo, J.; Stendardo, E.; Improta, R.; Santoro, F. Insights for an Accurate Comparison of Computational Data to Experimental Absorption and Emission Spectra: Beyond the Vertical Transition Approximation. J. Chem. Theory Comput. 2013, 9, 2072–2082. [Google Scholar] [CrossRef]
- Green, J.A.; Jouybari, M.Y.; Aranda, D.; Improta, R.; Santoro, F. Nonadiabatic Absorption Spectra and Ultrafast Dynamics of DNA and RNA Photoexcited Nucleobases. Molecules 2021, 26, 1743. [Google Scholar] [CrossRef]
- Kashinski, D.O.; Chase, G.M.; Nelson, R.G.; Di Nallo, O.E.; Scales, A.N.; VanderLey, D.L.; Byrd, E.F.C. Harmonic Vibrational Frequencies: Approximate Global Scaling Factors for TPSS, M06, and M11 Functional Families Using Several Common Basis Sets. J. Phys. Chem. A 2017, 121, 2265–2273. [Google Scholar] [CrossRef]
- Irikura, K.K.; Johnson, R.D.; Kacker, R.N. Uncertainties in Scaling Factors for ab Initio Vibrational Frequencies. J. Phys. Chem. A 2005, 109, 8430–8437. [Google Scholar] [CrossRef]
- Frisch, M.J.; Trucks, G.W.; Schlegel, H.B.; Scuseria, G.E.; Robb, M.A.; Cheeseman, J.R.; Scalmani, G.; Barone, V.; Petersson, G.A.; Nakatsuji, H.; et al. Gaussian 16 Revision D.; Gaussian Inc.: Wallingford, UK, 2016; Volume 1. [Google Scholar]
- Rogers, R.A.; Fleming, A.M.; Burrows, C.J. Unusual Isothermal Hysteresis in DNA i-Motif pH Transitions: A Study of the RAD17 Promoter Sequence. Biophys. J. 2018, 114, 1804–1815. [Google Scholar] [CrossRef] [Green Version]
- Benabou, S.; Ruckebusch, C.; Sliwa, M.; Aviñó, A.; Eritja, R.; Gargallo, R.; de Juan, A. Study of conformational transitions of i-motif DNA using time-resolved fluorescence and multivariate analysis methods. Nucleic Acids Res. 2019, 47, 6590–6605. [Google Scholar] [CrossRef] [Green Version]
- Segatta, F.; Cupellini, L.; Garavelli, M.; Mennucci, B. Quantum Chemical Modeling of the Photoinduced Activity of Multichromophoric Biosystems. Chem. Rev. 2019, 119, 9361. [Google Scholar] [CrossRef] [Green Version]
- Jurinovich, S.; Cupellini, L.; Guido, C.A.; Mennucci, B. EXAT: EXcitonic analysis tool. J. Comput. Chem. 2018, 39, 279–286. [Google Scholar] [CrossRef] [PubMed]
- Dreuw, A.; Head-Gordon, M. Single-Reference ab Initio Methods for the Calculation of Excited States of Large Molecules. Chem. Rev. 2005, 105, 4009. [Google Scholar] [CrossRef] [PubMed]
- Zuluaga, C.; Spata, V.A.; Matsika, S. Benchmarking Quantum Mechanical Methods for the Description of Charge-Transfer States in π-Stacked Nucleobases. J. Chem. Theory Comp. 2021, 17, 376–387. [Google Scholar] [CrossRef]
- Santoro, F.; Green, J.A.; Martinez-Fernandez, L.; Cerezo, J.; Improta, R. Quantum and semiclassical dynamical studies of nonadiabatic processes in solution: Achievements and perspectives. Phys. Chem. Chem. Phys. 2021, 23, 8181–8199. [Google Scholar] [CrossRef]
- Capobianco, A.; Landi, A.; Peluso, A. Duplex DNA Retains the Conformational Features of Single Strands: Perspectives from MD Simulations and Quantum Chemical Computations. Int. J. Mol. Sci. 2022, 23, 14452. [Google Scholar] [CrossRef] [PubMed]
- Benabou, S.; Ferreira, R.; Avino, A.; Gonzalez, C.; Lyonnais, S.; Sola, M.; Eritja, R.; Jaumot, J.; Gargallo, R. Solution equilibria of cytosine- and guanine-rich sequences near the promoter region of the n-myc gene that contain stable hairpins within lateral loops. Biochim. Biophys. Acta (BBA) - General Subjects 2014, 1840, 41–52. [Google Scholar] [CrossRef] [PubMed] [Green Version]


Disclaimer/Publisher’s Note: The statements, opinions and data contained in all publications are solely those of the individual author(s) and contributor(s) and not of MDPI and/or the editor(s). MDPI and/or the editor(s) disclaim responsibility for any injury to people or property resulting from any ideas, methods, instructions or products referred to in the content. |
© 2023 by the author. Licensee MDPI, Basel, Switzerland. This article is an open access article distributed under the terms and conditions of the Creative Commons Attribution (CC BY) license (https://creativecommons.org/licenses/by/4.0/).
Share and Cite
Improta, R. Shedding Light on the Photophysics and Photochemistry of I-Motifs Using Quantum Mechanical Calculations. Int. J. Mol. Sci. 2023, 24, 12614. https://doi.org/10.3390/ijms241612614
Improta R. Shedding Light on the Photophysics and Photochemistry of I-Motifs Using Quantum Mechanical Calculations. International Journal of Molecular Sciences. 2023; 24(16):12614. https://doi.org/10.3390/ijms241612614
Chicago/Turabian StyleImprota, Roberto. 2023. "Shedding Light on the Photophysics and Photochemistry of I-Motifs Using Quantum Mechanical Calculations" International Journal of Molecular Sciences 24, no. 16: 12614. https://doi.org/10.3390/ijms241612614