

Histone Deacetylase Inhibitor (SAHA) Reduces Mortality in an Endotoxemia Mouse Model by Suppressing Glycolysis

 and
and 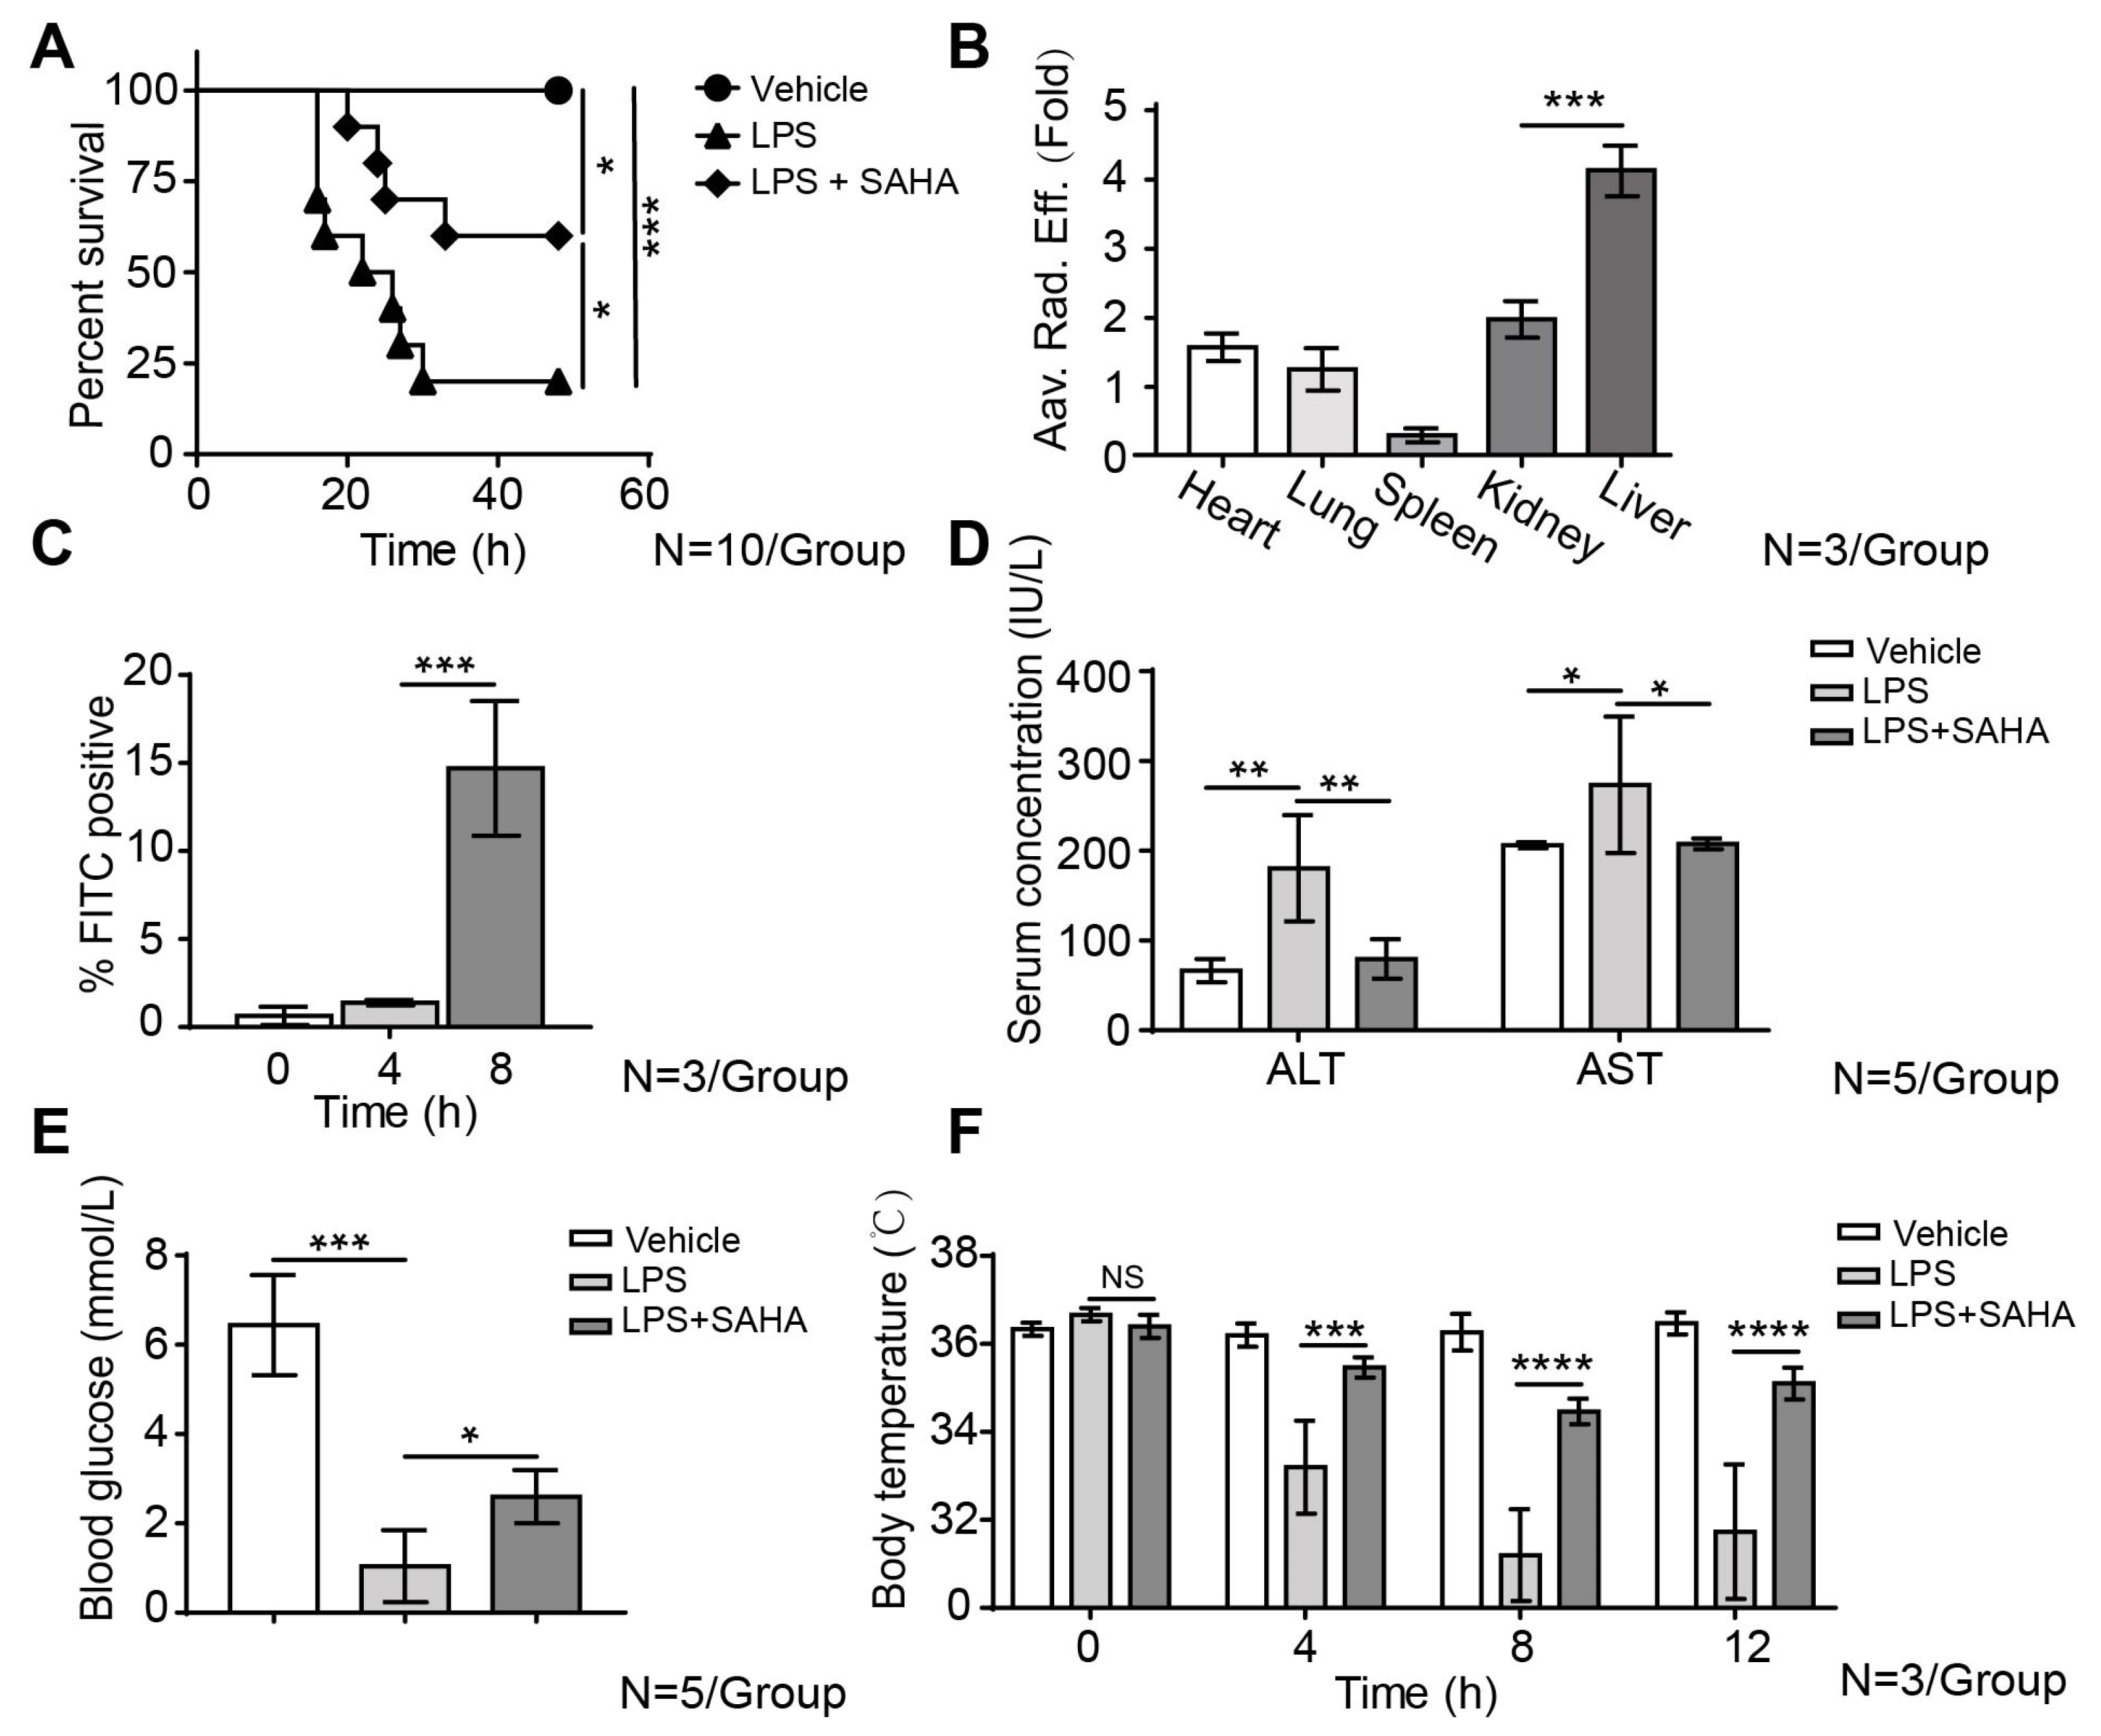
Abstract
:1. Introduction
2. Results
2.1. SAHA Inhibits Liver Inflammation and Reduces Mortality in the LPS-Induced Sepsis Mouse Model
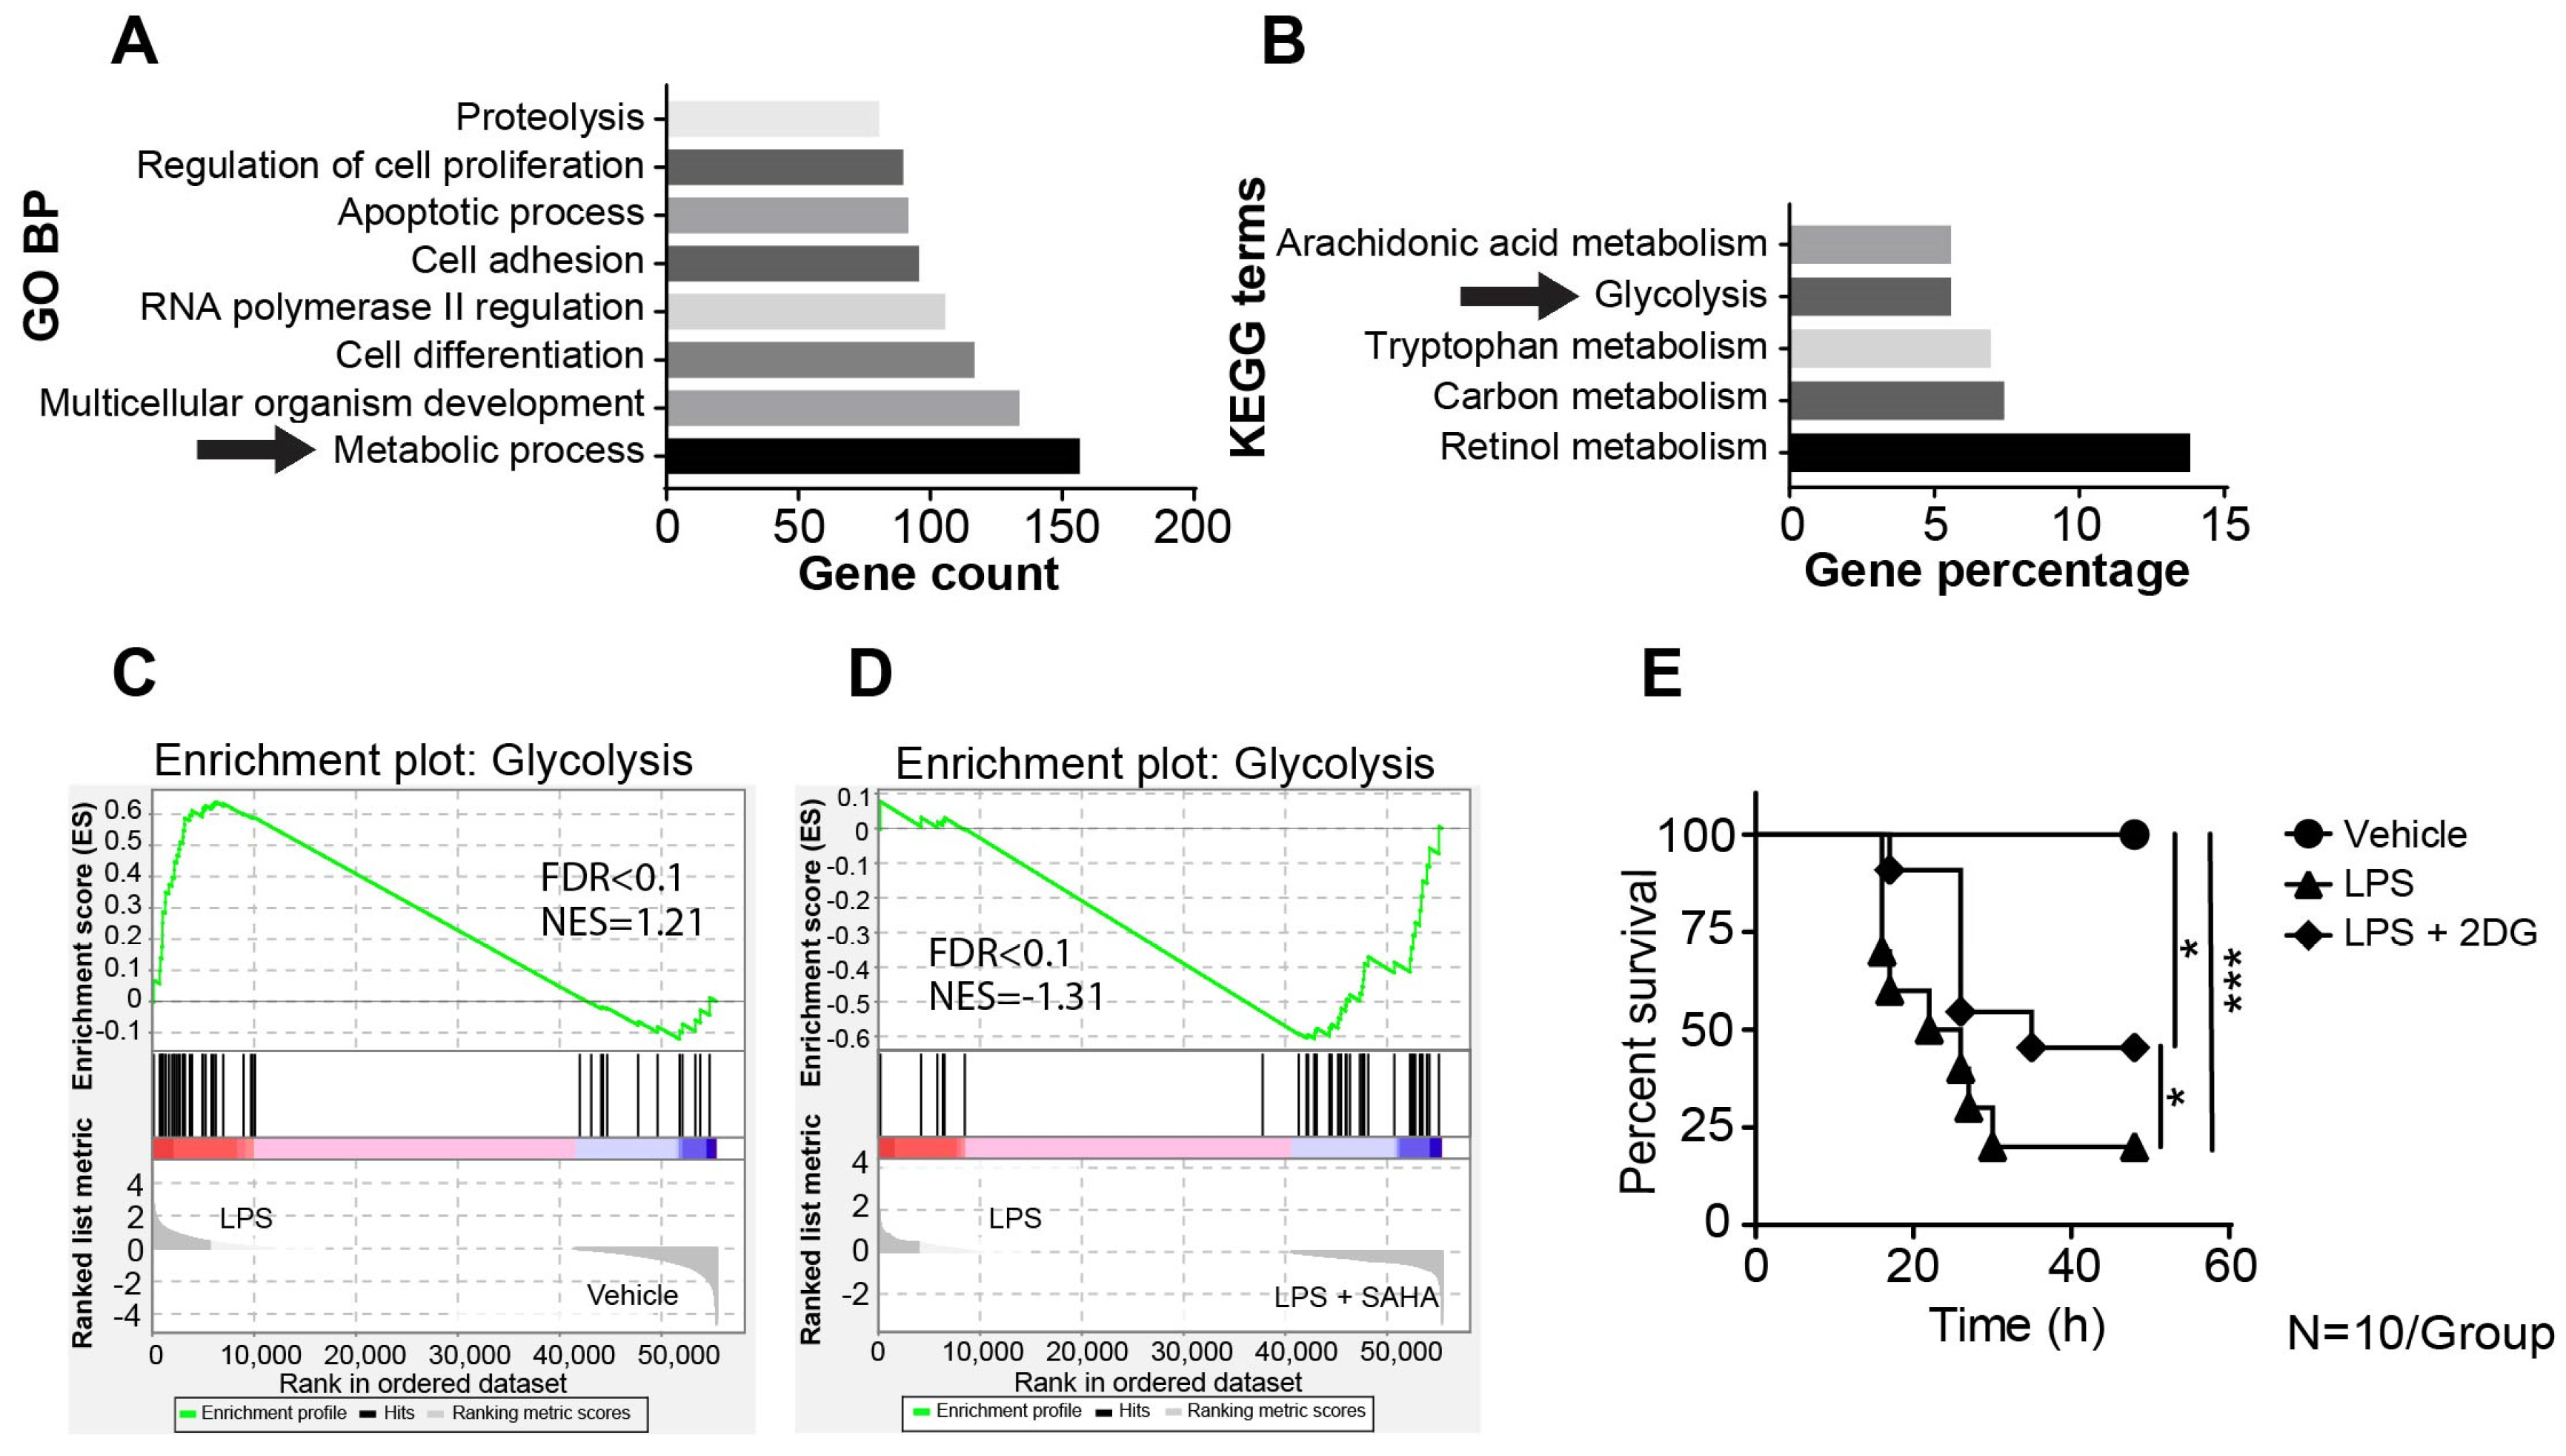
2.2. SAHA Suppresses Genes Involved in LPS-Induced Activation of the Glycolysis Pathway
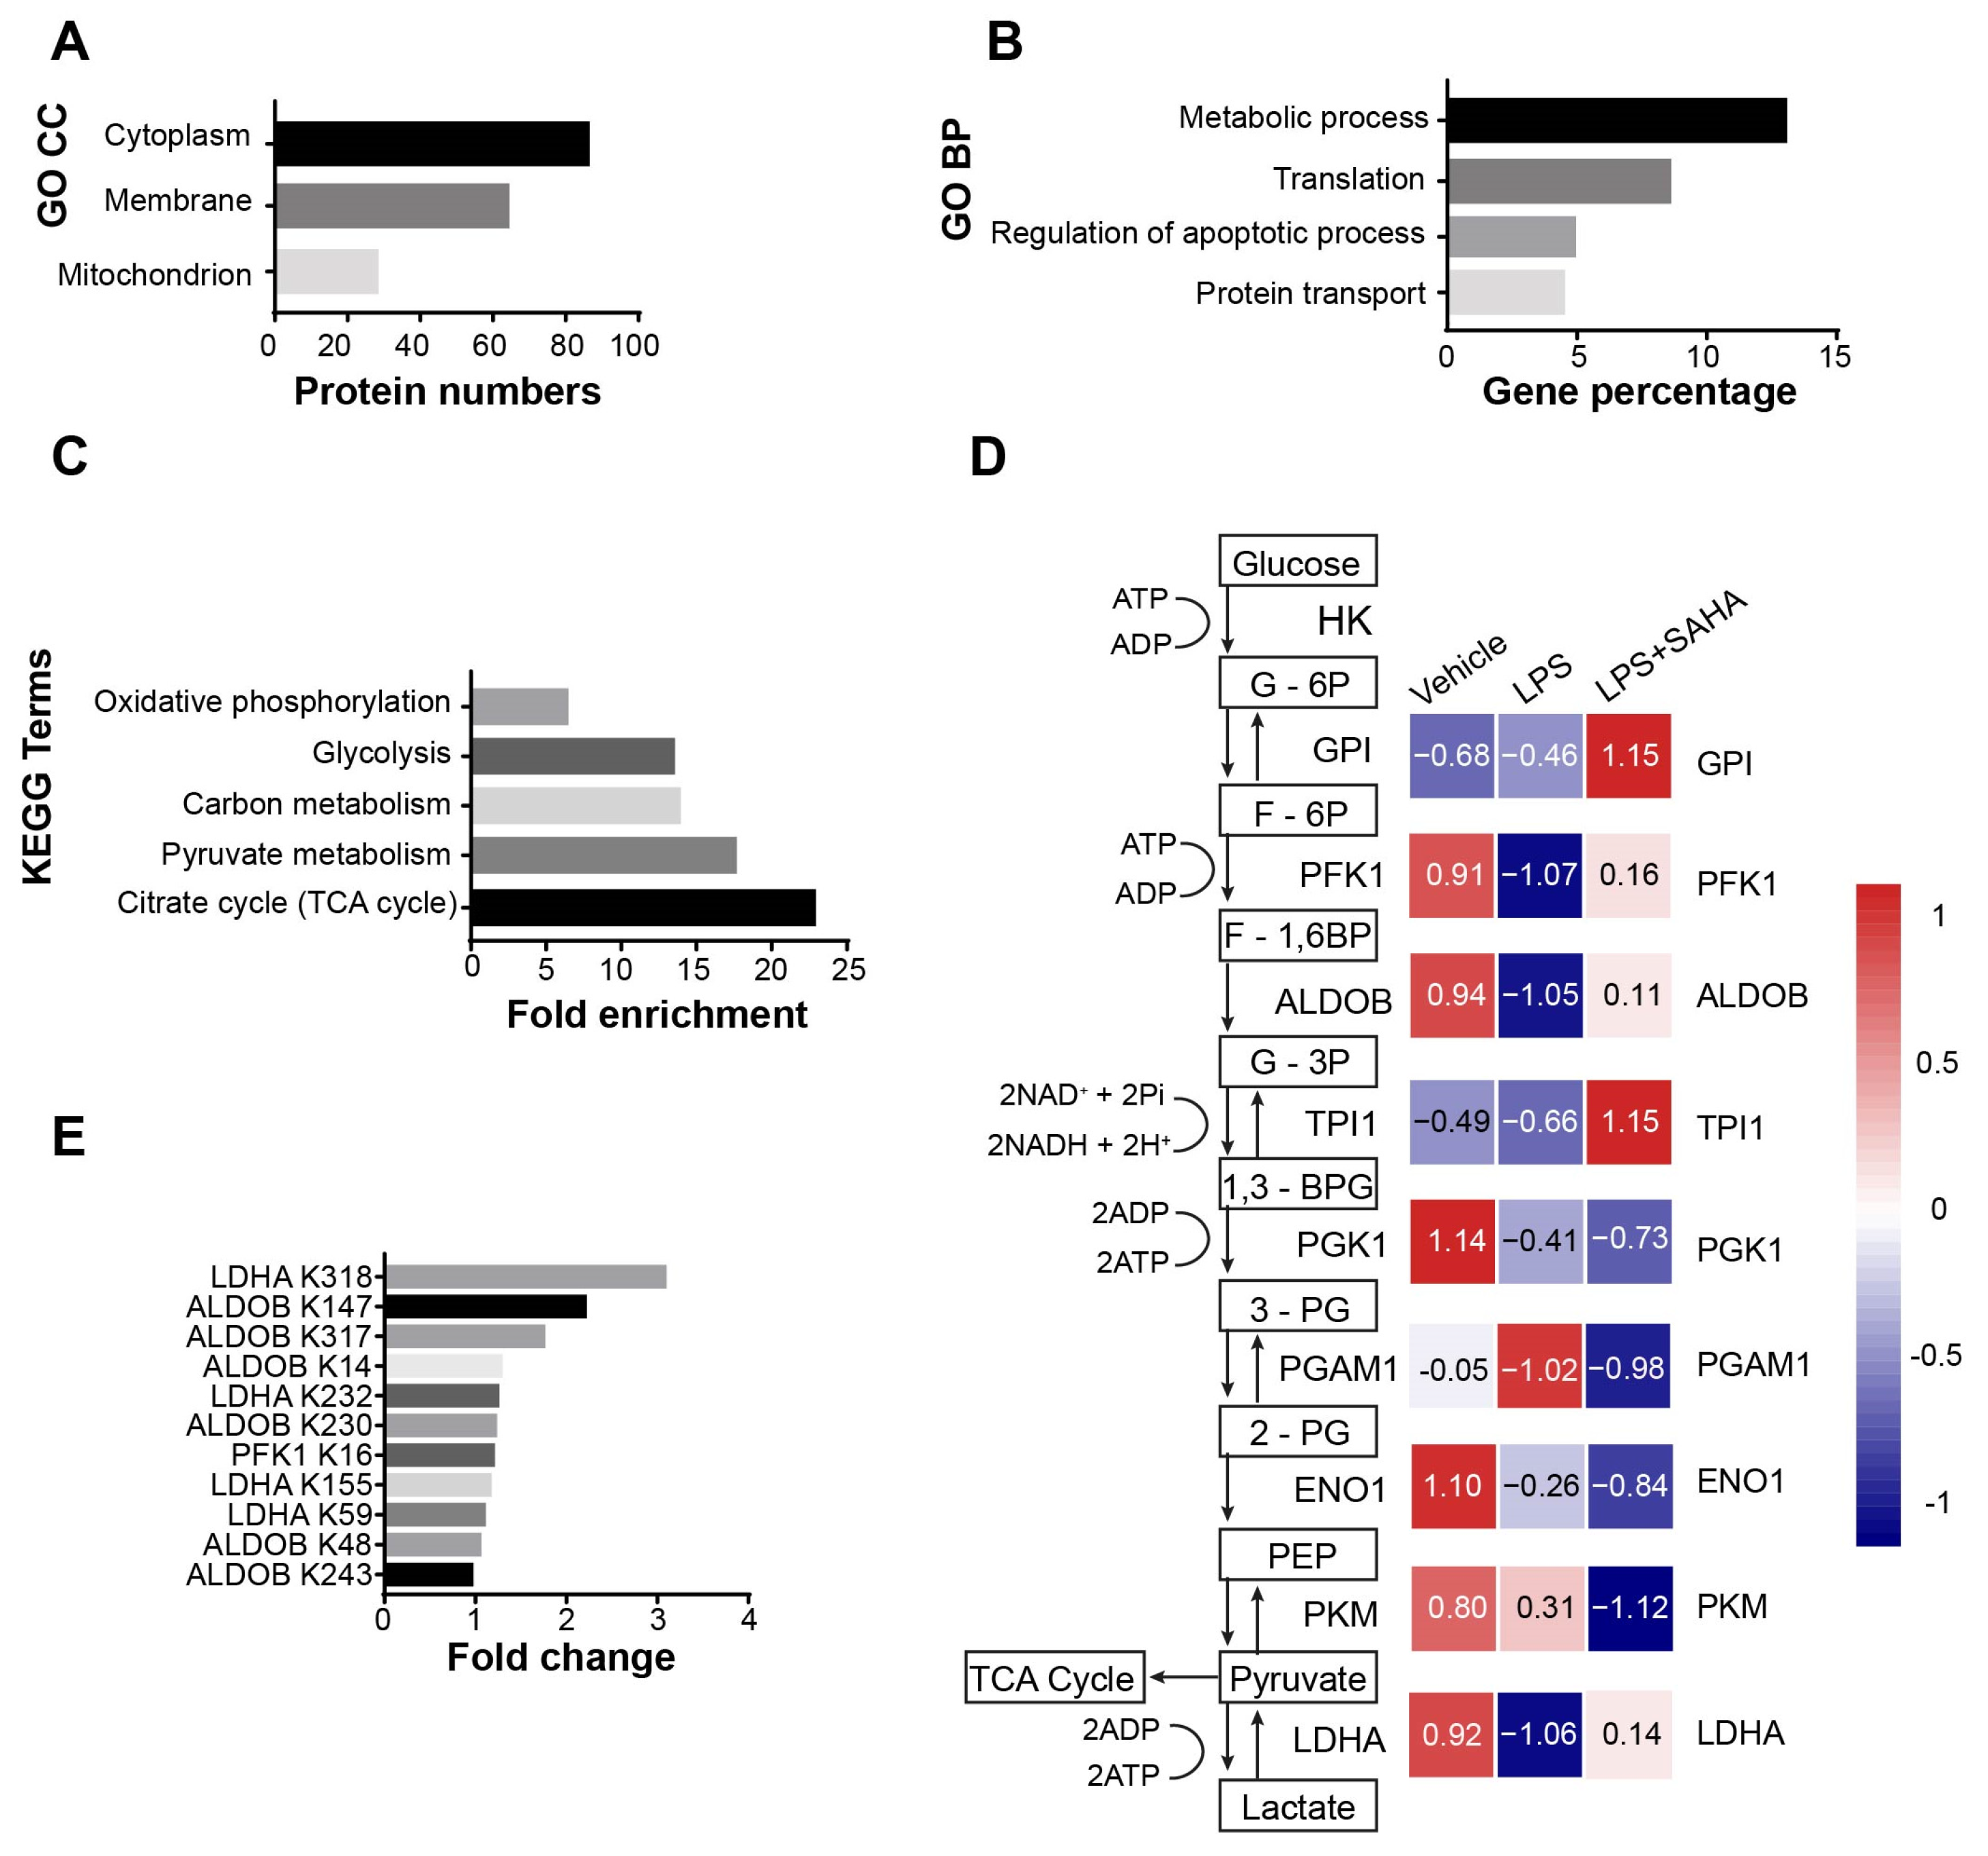
2.3. The Acetylation Pattern of Glycolytic Enzymes Is Altered in Septic Mice
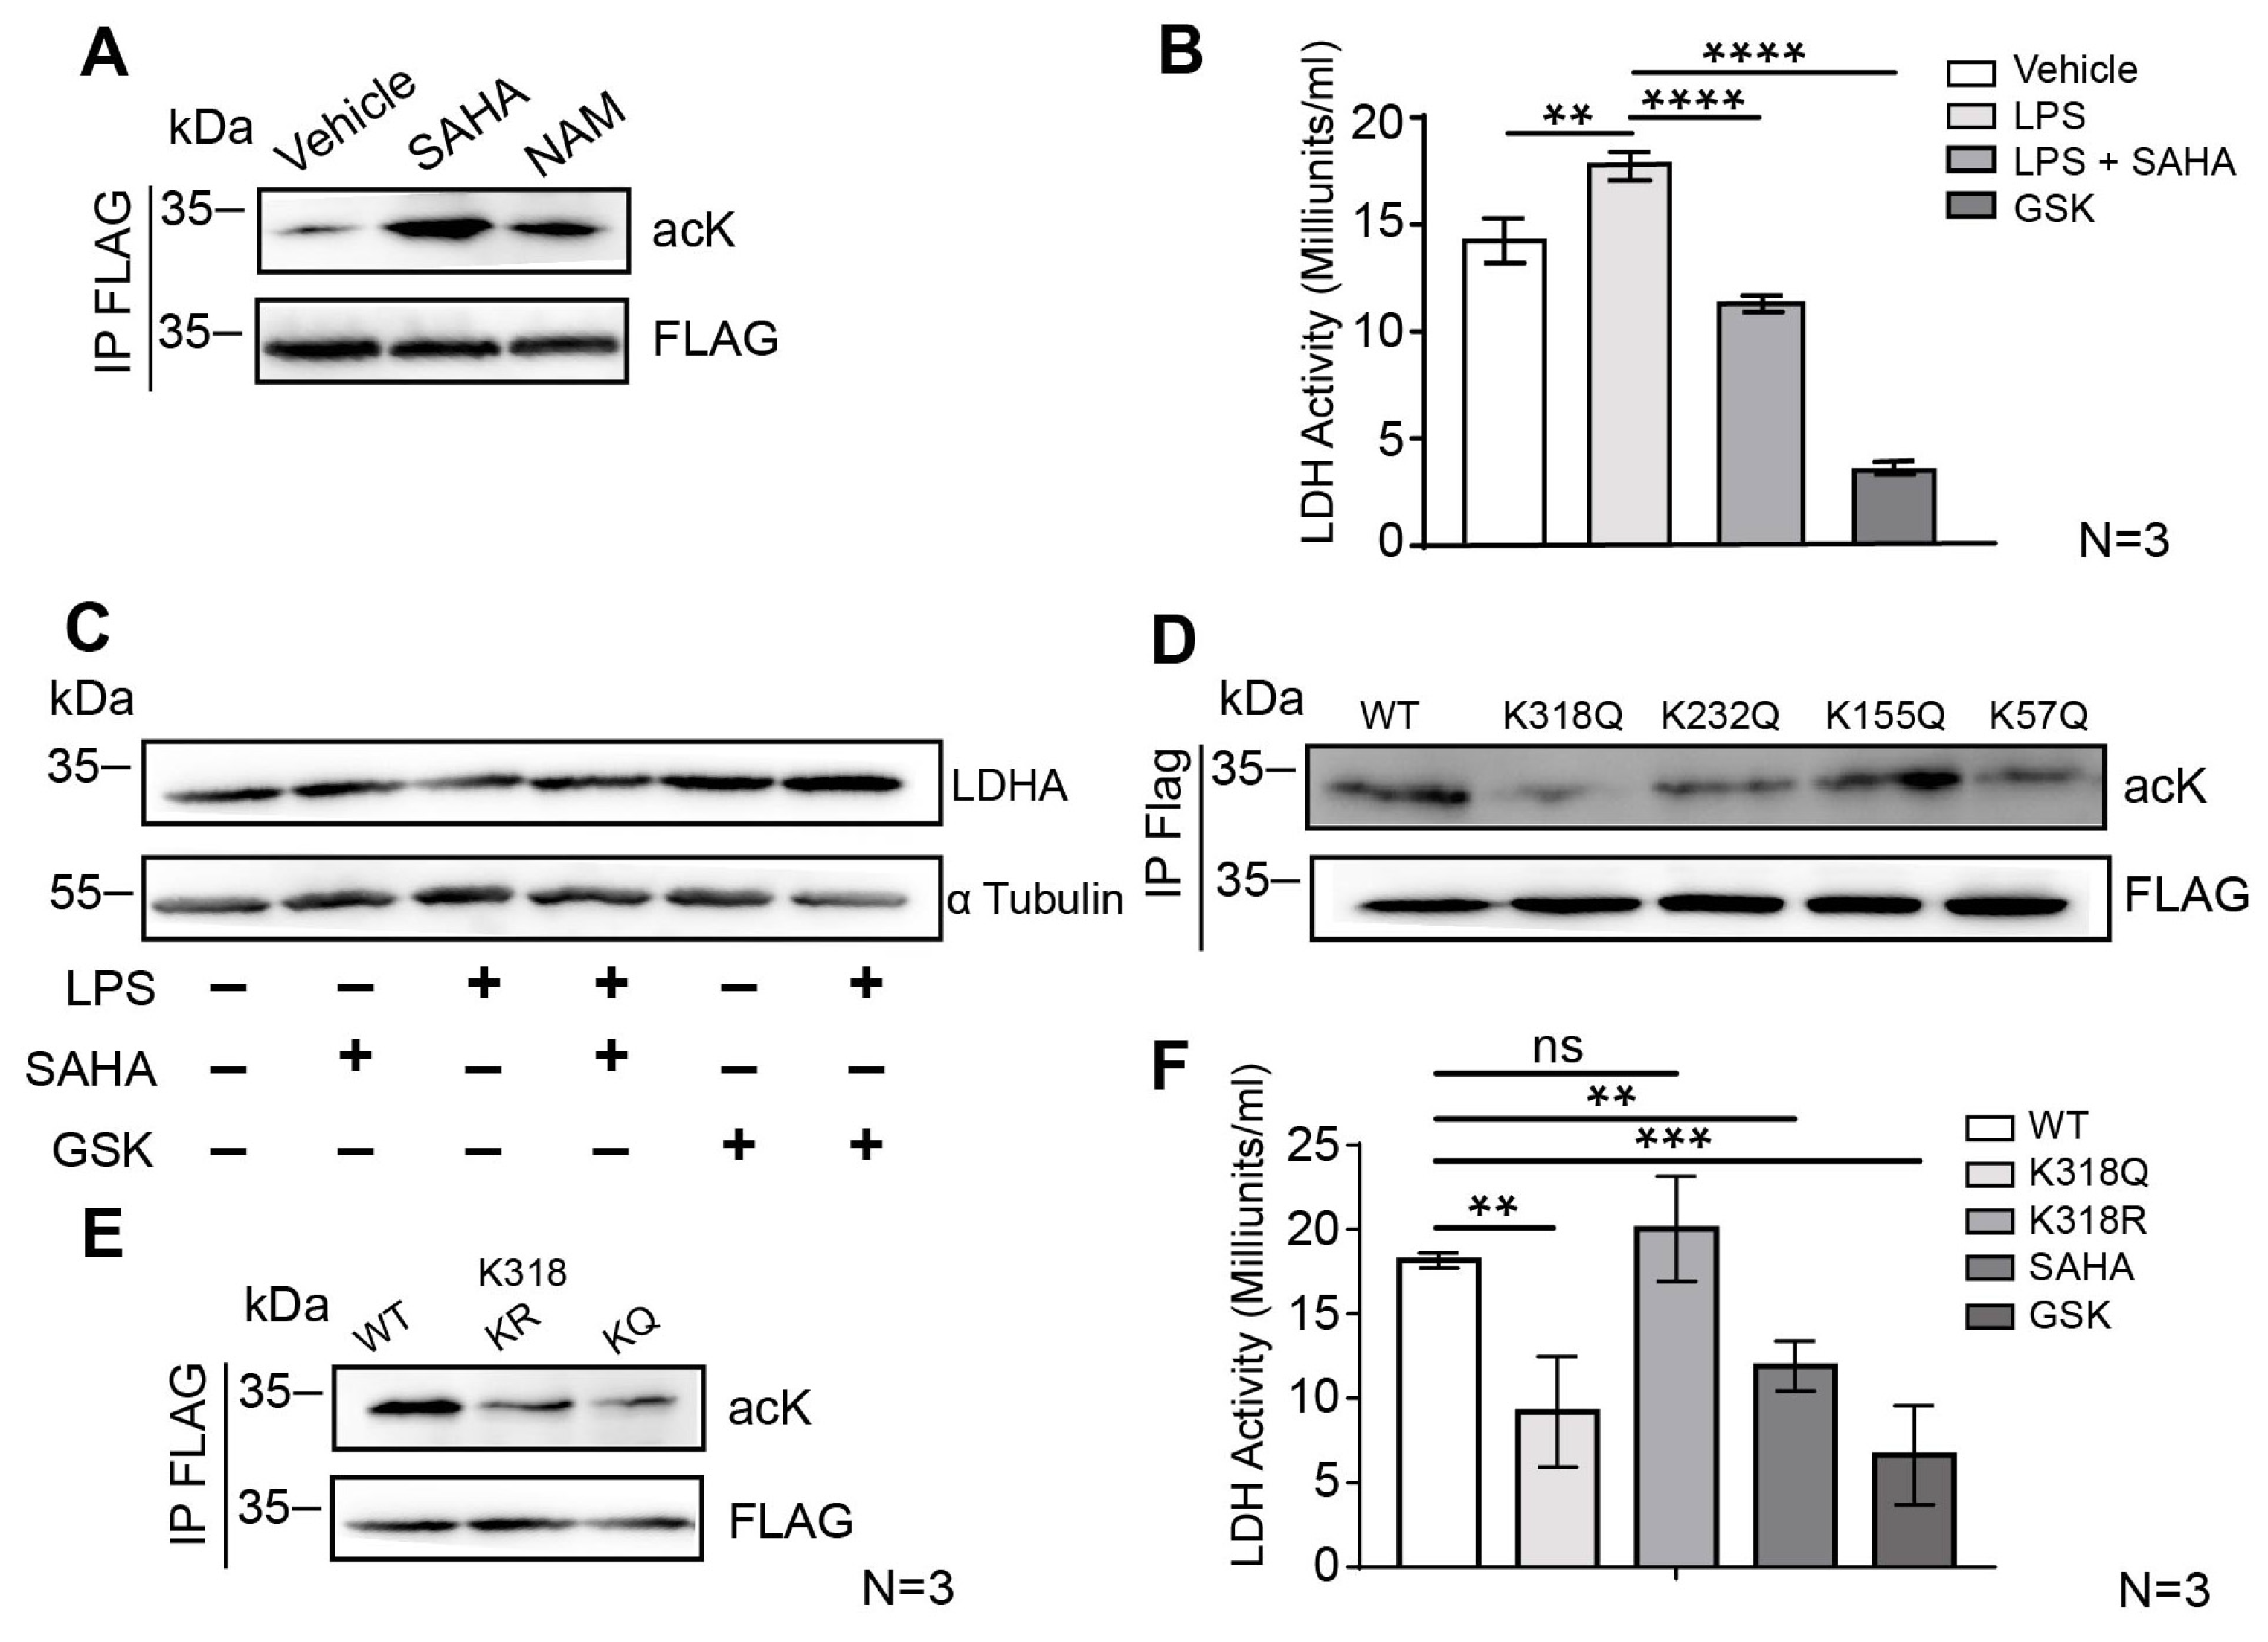
2.4. SAHA Attenuates Glycolysis via LDHA Acetylation on the Lysine 318 Site
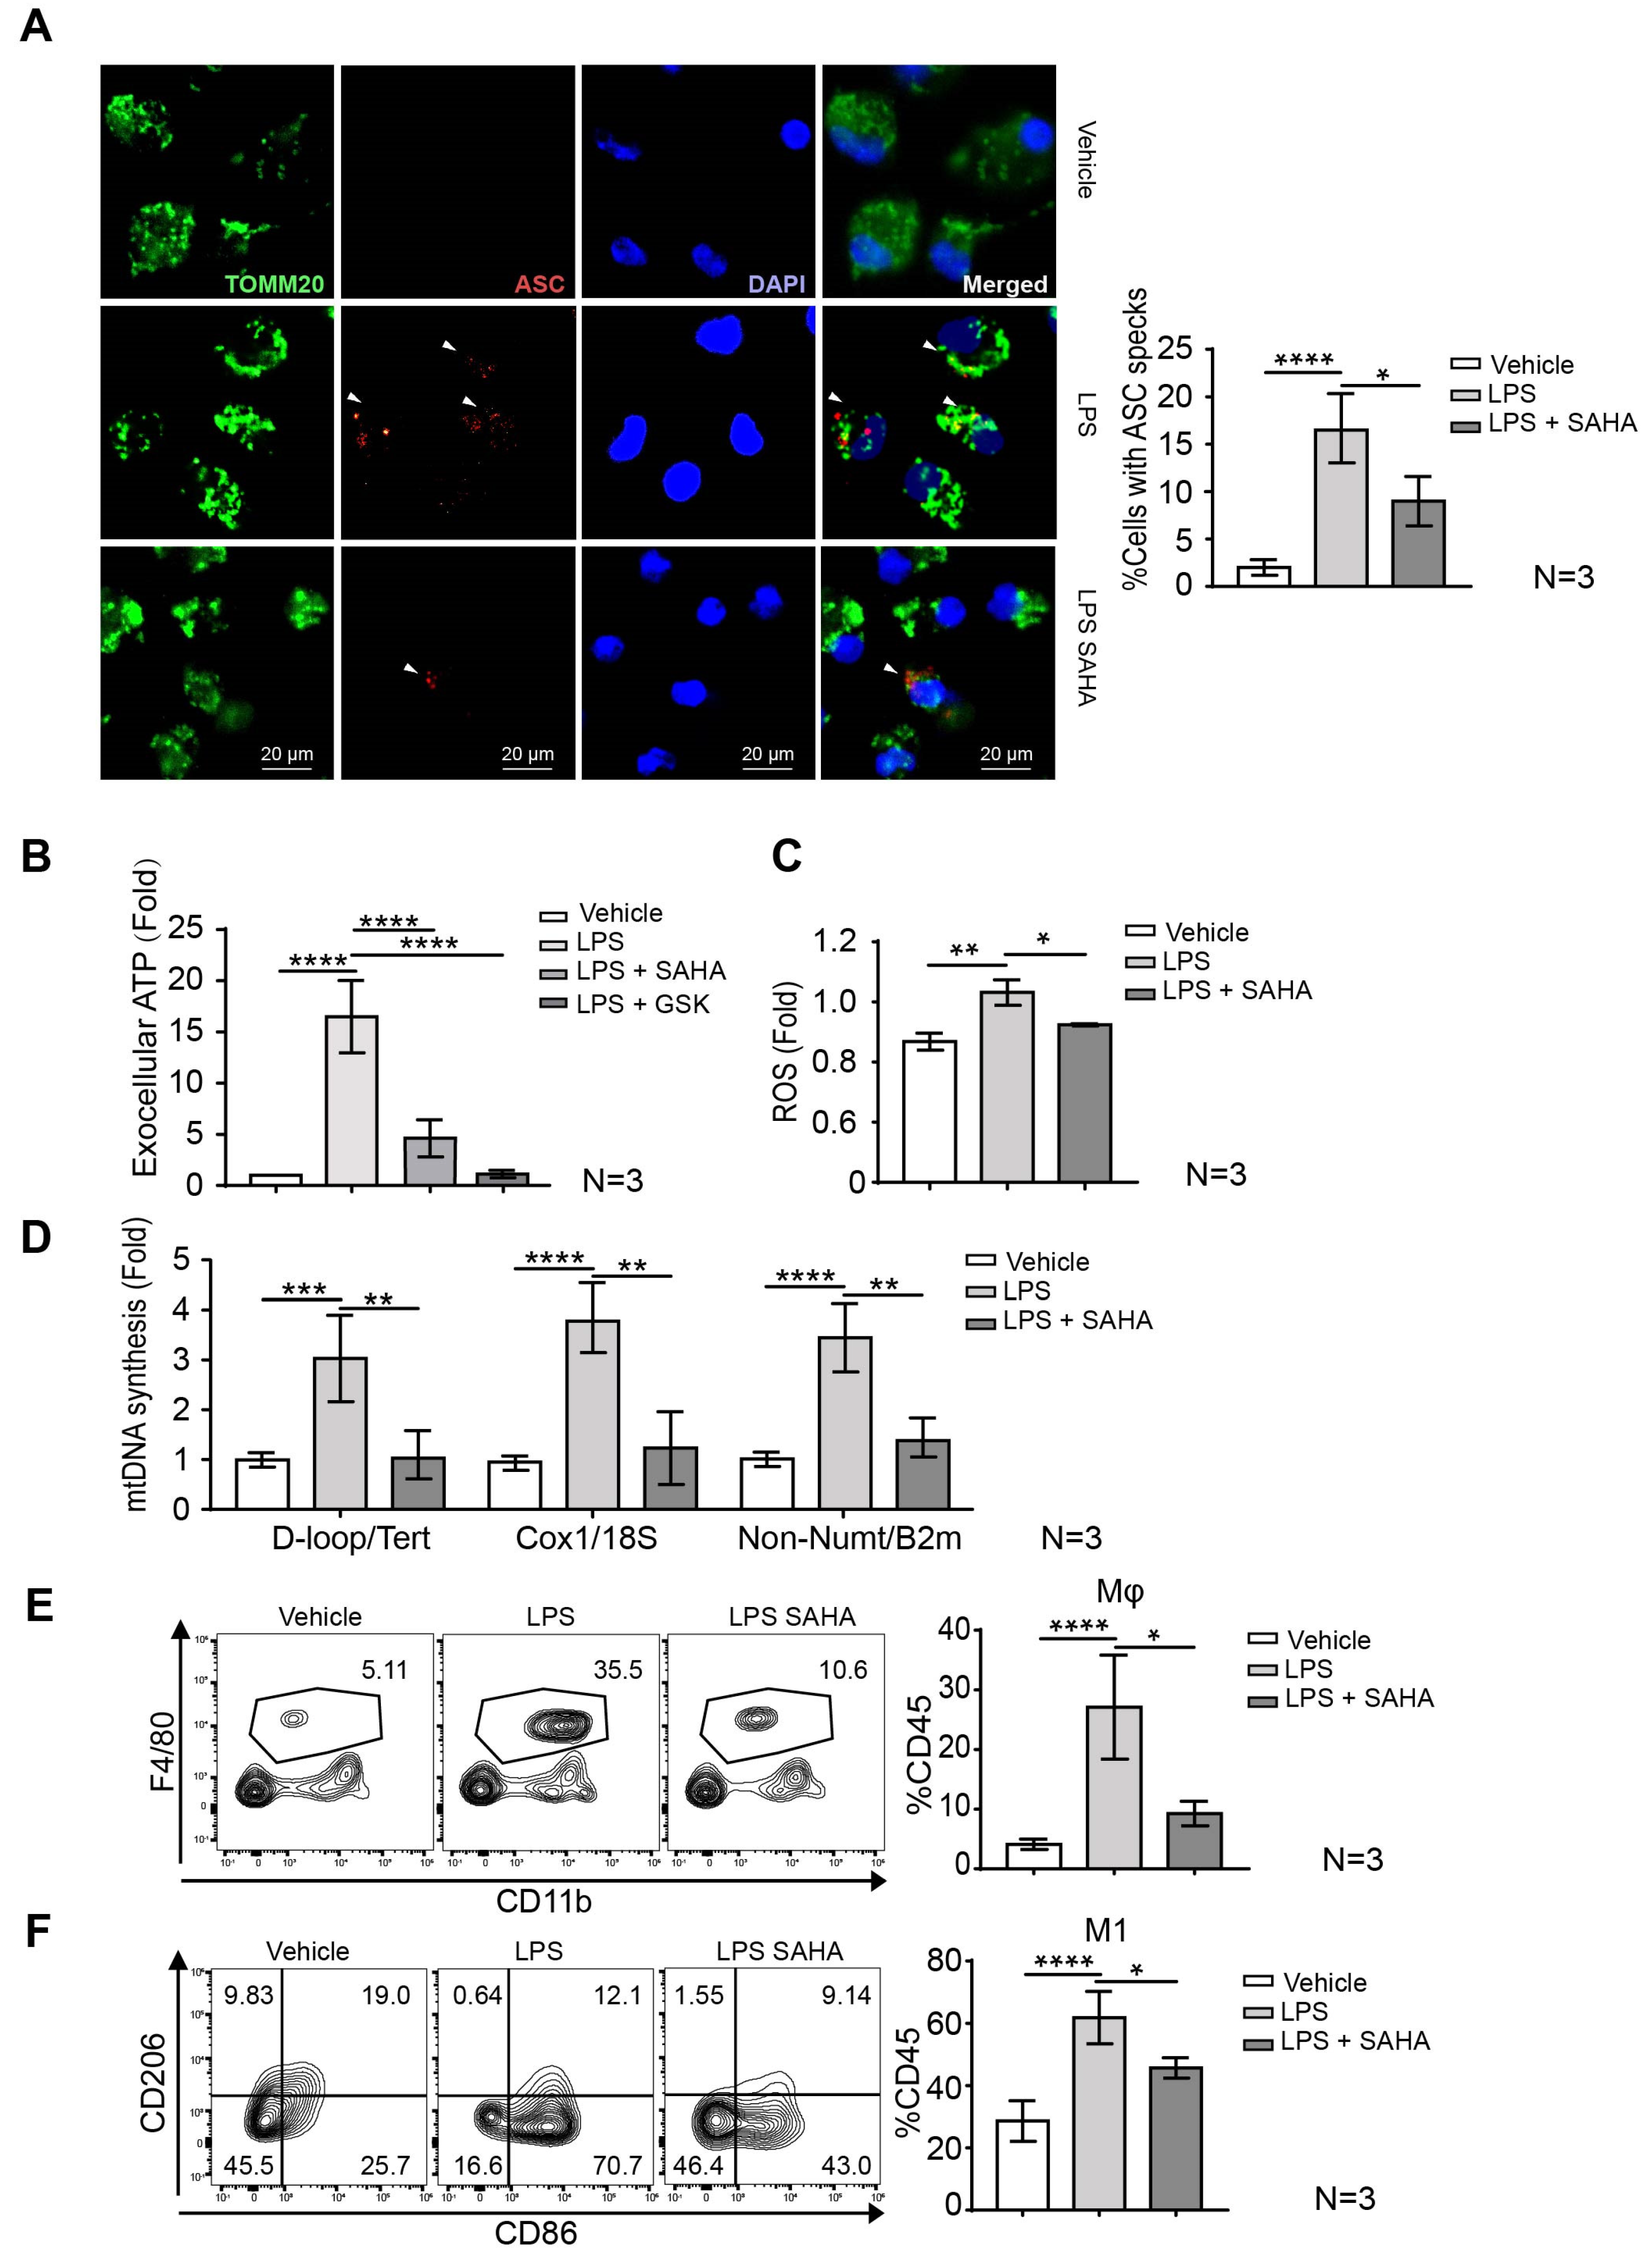
2.5. SAHA Blunts Macrophage Mobilization and Inflammasome Activation
3. Discussion
4. Materials and Methods
4.1. Septic Model and SAHA Treatment in Mice
4.2. Intrahepatic Immune Cell Isolation
4.3. Histological and Staining
4.4. Immunofluorescent Staining
4.5. LPS Accumulation Studies
4.6. Liver Transcriptome Profiling
4.7. Omics Data Analysis
4.8. LDH Assay
4.9. Site-Directed Mutagenesis
4.10. Primary Cell Culture
4.11. Expression of Recombinant Protein
4.12. qRT-PCR Analysis
4.13. Immunoprecipitation and Western Blot Analysis
4.14. LC-MS/MS Analysis
4.15. Flow Cytometry
4.16. Reactive Oxygen Species Measurement
5. Conclusions
Supplementary Materials
Author Contributions
Funding
Institutional Review Board Statement
Informed Consent Statement
Data Availability Statement
Conflicts of Interest
References
- Singer, M.; Deutschman, C.S.; Seymour, C.W.; Shankar-Hari, M.; Annane, D.; Bauer, M.; Bellomo, R.; Bernard, G.R.; Chiche, J.-D.; Coopersmith, C.M.; et al. The Third International Consensus Definitions for Sepsis and Septic Shock (Sepsis-3). JAMA 2016, 315, 801–810. [Google Scholar] [CrossRef]
- Rudd, K.E.; Johnson, S.C.; Agesa, K.M.; Shackelford, K.A.; Tsoi, D.; Kievlan, D.R.; Colombara, D.V.; Ikuta, K.S.; Kissoon, N.; Finfer, S.; et al. Global, regional, and national sepsis incidence and mortality, 1990–2017: Analysis for the Global Burden of Disease Study. Lancet 2020, 395, 200–211. [Google Scholar] [CrossRef] [Green Version]
- Cavaillon, J.-M.; Singer, M.; Skirecki, T. Sepsis therapies: Learning from 30 years of failure of translational research to propose new leads. EMBO Mol. Med. 2020, 12, e10128. [Google Scholar] [CrossRef]
- Marshall, J.C. Why have clinical trials in sepsis failed? Trends Mol. Med. 2014, 20, 195–203. [Google Scholar] [CrossRef] [PubMed]
- Fink, M.; Warren, H.S. Strategies to improve drug development for sepsis. Nat. Rev. Drug Discov. 2014, 13, 741–758. [Google Scholar] [CrossRef] [PubMed]
- Grimaldi, D.; Vincent, J.-L. Clinical trial research in focus: Rethinking trials in sepsis. Lancet Respir. Med. 2017, 5, 610–611. [Google Scholar] [CrossRef]
- Guarino, M.; Perna, B.; Cesaro, A.E.; Maritati, M.; Spampinato, M.D.; Contini, C.; De Giorgio, R. 2023 Update on Sepsis and Septic Shock in Adult Patients: Management in the Emergency Department. J. Clin. Med. 2023, 12, 3188. [Google Scholar] [CrossRef] [PubMed]
- Van der Poll, T.; van de Veerdonk, F.L.; Scicluna, B.P.; Netea, M.G. The immunopathology of sepsis and potential therapeutic targets. Nat. Rev. Immunol. 2017, 17, 407–420. [Google Scholar] [CrossRef] [PubMed]
- Strnad, P.; Tacke, F.; Koch, A.; Trautwein, C. Liver—Guardian, modifier and target of sepsis. Nat. Rev. Gastroenterol. Hepatol. 2017, 14, 55–66. [Google Scholar] [CrossRef]
- Martin, G.S.; Mannino, D.M.; Eaton, S.; Moss, M. The epidemiology of sepsis in the United States from 1979 through 2000. N. Engl. J. Med. 2003, 348, 1546–1554. [Google Scholar] [CrossRef] [Green Version]
- Blanco, J.; Muriel-Bombín, A.; Sagredo, V.; Taboada, F.; Gandía, F.; Tamayo, L.; Collado, J.; García-Labattut, Á.; Carriedo, D.; Valledor, M.; et al. Incidence, organ dysfunction and mortality in severe sepsis: A Spanish multicentre study. Crit. Care 2008, 12, R158. [Google Scholar] [CrossRef] [Green Version]
- Dhainaut, J.F.; Marin, N.; Mignon, A.; Vinsonneau, C. Hepatic response to sepsis: Interaction between coagulation and inflammatory processes. Crit. Care Med. 2001, 29 (Suppl. S7), S42–S47. [Google Scholar] [CrossRef] [PubMed]
- Ginhoux, F.; Guilliams, M. Tissue-Resident Macrophage Ontogeny and Homeostasis. Immunity 2016, 44, 439–449. [Google Scholar] [CrossRef]
- Sheng, J.; Ruedl, C.; Karjalainen, K. Most Tissue-Resident Macrophages Except Microglia Are Derived from Fetal Hematopoietic Stem Cells. Immunity 2015, 43, 382–393. [Google Scholar] [CrossRef] [PubMed] [Green Version]
- Hoeffel, G.; Chen, J.; Lavin, Y.; Low, D.; Almeida, F.F.; See, P.; Beaudin, A.E.; Lum, J.; Low, I.; Forsberg, E.C.; et al. C-Myb(+) erythro-myeloid progenitor-derived fetal monocytes give rise to adult tissue-resident macrophages. Immunity 2015, 42, 665–678. [Google Scholar] [CrossRef] [PubMed] [Green Version]
- Scott, C.L.; Guilliams, M. The role of Kupffer cells in hepatic iron and lipid metabolism. J. Hepatol. 2018, 69, 1197–1199. [Google Scholar] [CrossRef] [Green Version]
- Blériot, C.; Barreby, E.; Dunsmore, G.; Ballaire, R.; Chakarov, S.; Ficht, X.; De Simone, G.; Andreata, F.; Fumagalli, V.; Guo, W.; et al. A subset of Kupffer cells regulates metabolism through the expression of CD36. Immunity 2021, 54, 2101–2116.e6. [Google Scholar] [CrossRef]
- Odegaard, J.I.; Ricardo-Gonzalez, R.R.; Eagle, A.R.; Vats, D.; Morel, C.R.; Goforth, M.H.; Subramanian, V.; Mukundan, L.; Ferrante, A.W.; Chawla, A. Alternative M2 activation of Kupffer cells by PPARdelta ameliorates obesity-induced insulin resistance. Cell Metab. 2008, 7, 496–507. [Google Scholar] [CrossRef] [Green Version]
- Soto-Heredero, G.; de las Heras, M.M.G.; Gabandé-Rodríguez, E.; Oller, J.; Mittelbrunn, M. Glycolysis—A key player in the inflammatory response. FEBS J. 2020, 287, 3350–3369. [Google Scholar] [CrossRef] [Green Version]
- Ye, L.; Jiang, Y.; Zhang, M. Crosstalk between glucose metabolism, lactate production and immune response modulation. Cytokine Growth Factor Rev. 2022, 68, 81–92. [Google Scholar] [CrossRef]
- He, W.; Heinz, A.; Jahn, D.; Hiller, K. Complexity of macrophage metabolism in infection. Curr. Opin. Biotechnol. 2021, 68, 231–239. [Google Scholar] [CrossRef]
- Lotsios, N.S.; Keskinidou, C.; Jahaj, E.; Mastora, Z.; Dimopoulou, I.; Orfanos, S.E.; Vassilaki, N.; Vassiliou, A.G.; Kotanidou, A. Prognostic Value of HIF-1α-Induced Genes in Sepsis/Septic Shock. Med. Sci. 2023, 11, 41. [Google Scholar] [CrossRef]
- Buchwald, M.; Krämer, O.H.; Heinzel, T. HDACi—Targets beyond chromatin. Cancer Lett. 2009, 280, 160–167. [Google Scholar] [CrossRef] [PubMed]
- Krämer, O.H.; Göttlicher, M.; Heinzel, T. Histone deacetylase as a therapeutic target. Trends Endocrinol. Metab. TEM 2001, 12, 294–300. [Google Scholar] [CrossRef]
- Zhao, T.; Li, Y.; Liu, B.; Liu, Z.; Chong, W.; Duan, X.; Deperalta, D.K.; Velmahos, G.C.; Alam, H.B. Novel pharmacologic treatment attenuates septic shock and improves long-term survival. Surgery 2013, 154, 206–213. [Google Scholar] [CrossRef] [Green Version]
- Duvic, M.; Talpur, R.; Ni, X.; Zhang, C.; Hazarika, P.; Kelly, C.; Chiao, J.H.; Reilly, J.F.; Ricker, J.L.; Richon, V.M.; et al. Phase 2 trial of oral vorinostat (suberoylanilide hydroxamic acid, SAHA) for refractory cutaneous T-cell lymphoma (CTCL). Blood 2007, 109, 31–39. [Google Scholar] [CrossRef] [PubMed]
- Kühne, M.; Lindemann, H.; Grune, C.; Schröder, D.; Cseresnyés, Z.; Godmann, M.; Koschella, A.; Figge, M.T.; Eggeling, C.; Fischer, D.; et al. Biocompatible sulfated valproic acid-coupled polysaccharide-based nanocarriers with HDAC inhibitory activity. J. Control. Release Off. J. Control. Release Soc. 2021, 329, 717–730. [Google Scholar] [CrossRef]
- Zhao, T.; Li, Y.; Liu, B.; Wu, E.; Sillesen, M.; Velmahos, G.C.; Halaweish, I.; Alam, H.B. Histone deacetylase inhibitor treatment attenuates coagulation imbalance in a lethal murine model of sepsis. Surgery 2014, 156, 214–220. [Google Scholar] [CrossRef] [PubMed] [Green Version]
- Zhang, Q.; Luo, P.; Xia, F.; Tang, H.; Chen, J.; Zhang, J.; Liu, D.; Zhu, Y.; Liu, Y.; Gu, L.; et al. Capsaicin ameliorates inflammation in a TRPV1-independent mechanism by inhibiting PKM2-LDHA-mediated Warburg effect in sepsis. Cell Chem. Biol. 2022, 29, 1248–1259.e6. [Google Scholar] [CrossRef]
- Zhao, D.; Zou, S.-W.; Liu, Y.; Zhou, X.; Mo, Y.; Wang, P.; Xu, Y.-H.; Dong, B.; Xiong, Y.; Lei, Q.-Y.; et al. Lysine-5 acetylation negatively regulates lactate dehydrogenase A and is decreased in pancreatic cancer. Cancer Cell 2013, 23, 464–476. [Google Scholar] [CrossRef] [Green Version]
- Cheng, S.-C.; Joosten, L.A.B.; Netea, M.G. The interplay between central metabolism and innate immune responses. Cytokine Growth Factor Rev. 2014, 25, 707–713. [Google Scholar] [CrossRef] [PubMed]
- Jha, A.K.; Huang, S.C.-C.; Sergushichev, A.; Lampropoulou, V.; Ivanova, Y.; Loginicheva, E.; Chmielewski, K.; Stewart, K.M.; Ashall, J.; Everts, B.; et al. Network integration of parallel metabolic and transcriptional data reveals metabolic modules that regulate macrophage polarization. Immunity 2015, 42, 419–430. [Google Scholar] [CrossRef] [PubMed] [Green Version]
- Adcock, I.M. HDAC inhibitors as anti-inflammatory agents. Br. J. Pharmacol. 2007, 150, 829–831. [Google Scholar] [CrossRef] [PubMed]
- Sun, L.; Zhang, H.; Gao, P. Metabolic reprogramming and epigenetic modifications on the path to cancer. Protein Cell 2022, 13, 877–919. [Google Scholar] [CrossRef]
- Chang, W.J.; Chang, Y.H.; Toledo-Pereyra, L.H. Suberoylanilide hydroxamic acid (SAHA) as an agent to attenuate Toll-like receptor 4-induced septic shock. J. Surg. Res. 2013, 185, e35–e36. [Google Scholar] [CrossRef]
- Von Knethen, A.; Brüne, B. Histone Deacetylation Inhibitors as Therapy Concept in Sepsis. Int. J. Mol. Sci. 2019, 20, 346. [Google Scholar] [CrossRef] [Green Version]
- Li, Y.; Liu, B.; Fukudome, E.Y.; Kochanek, A.R.; Finkelstein, R.A.; Chong, W.; Jin, G.; Lu, J.; Demoya, M.A.; Velmahos, G.C.; et al. Surviving lethal septic shock without fluid resuscitation in a rodent model. Surgery 2010, 148, 246–254. [Google Scholar] [CrossRef] [Green Version]
- Li, Y.; Liu, B.; Zhao, H.; Sailhamer, E.A.; Fukudome, E.Y.; Zhang, X.; Kheirbek, T.; Finkelstein, R.A.; Velmahos, G.C.; Demoya, M.; et al. Protective effect of suberoylanilide hydroxamic acid against LPS-induced septic shock in rodents. Shock 2009, 32, 517–523. [Google Scholar] [CrossRef]
- Zhong, Z.; Liang, S.; Sanchez-Lopez, E.; He, F.; Shalapour, S.; Lin, X.-J.; Wong, J.; Ding, S.; Seki, E.; Schnabl, B.; et al. New mitochondrial DNA synthesis enables NLRP3 inflammasome activation. Nature 2018, 560, 198–203. [Google Scholar] [CrossRef]
- Shimada, K.; Crother, T.R.; Karlin, J.; Dagvadorj, J.; Chiba, N.; Chen, S.; Ramanujan, V.K.; Wolf, A.J.; Vergnes, L.; Ojcius, D.M.; et al. Oxidized mitochondrial DNA activates the NLRP3 inflammasome during apoptosis. Immunity 2012, 36, 401–414. [Google Scholar] [CrossRef] [Green Version]
- Alturkistani, H.A.; Tashkandi, F.M.; Mohammedsaleh, Z.M. Histological Stains: A Literature Review and Case Study. Glob. J. Health Sci. 2015, 8, 72–79. [Google Scholar] [CrossRef] [PubMed]
- Li, C.-J.; Xiao, Y.; Sun, Y.-C.; He, W.-Z.; Liu, L.; Huang, M.; He, C.; Huang, M.; Chen, K.-X.; Hou, J.; et al. Senescent immune cells release grancalcin to promote skeletal aging. Cell Metab. 2021, 33, 1957–1973.e6. [Google Scholar] [CrossRef] [PubMed]
- Iyer-Bierhoff, A.; Krogh, N.; Tessarz, P.; Ruppert, T.; Nielsen, H.; Grummt, I. SIRT7-Dependent Deacetylation of Fibrillarin Controls Histone H2A Methylation and rRNA Synthesis during the Cell Cycle. Cell Rep. 2018, 25, 2946–2954.e5. [Google Scholar] [CrossRef] [PubMed] [Green Version]


Disclaimer/Publisher’s Note: The statements, opinions and data contained in all publications are solely those of the individual author(s) and contributor(s) and not of MDPI and/or the editor(s). MDPI and/or the editor(s) disclaim responsibility for any injury to people or property resulting from any ideas, methods, instructions or products referred to in the content. |
© 2023 by the authors. Licensee MDPI, Basel, Switzerland. This article is an open access article distributed under the terms and conditions of the Creative Commons Attribution (CC BY) license (https://creativecommons.org/licenses/by/4.0/).
Share and Cite
Wu, Y.; He, Y.; Liu, C.; Ehle, C.; Iyer-Bierhoff, A.; Liu, B.; Heinzel, T.; Xing, S. Histone Deacetylase Inhibitor (SAHA) Reduces Mortality in an Endotoxemia Mouse Model by Suppressing Glycolysis. Int. J. Mol. Sci. 2023, 24, 12448. https://doi.org/10.3390/ijms241512448
Wu Y, He Y, Liu C, Ehle C, Iyer-Bierhoff A, Liu B, Heinzel T, Xing S. Histone Deacetylase Inhibitor (SAHA) Reduces Mortality in an Endotoxemia Mouse Model by Suppressing Glycolysis. International Journal of Molecular Sciences. 2023; 24(15):12448. https://doi.org/10.3390/ijms241512448
Chicago/Turabian StyleWu, Yunchen, Yudan He, Chen Liu, Charlotte Ehle, Aishwarya Iyer-Bierhoff, Bing Liu, Thorsten Heinzel, and Shaojun Xing. 2023. "Histone Deacetylase Inhibitor (SAHA) Reduces Mortality in an Endotoxemia Mouse Model by Suppressing Glycolysis" International Journal of Molecular Sciences 24, no. 15: 12448. https://doi.org/10.3390/ijms241512448