
Drought-Stress-Related Reprogramming of Gene Expression in Barley Involves Differential Histone Modifications at ABA-Related Genes

 , , , and
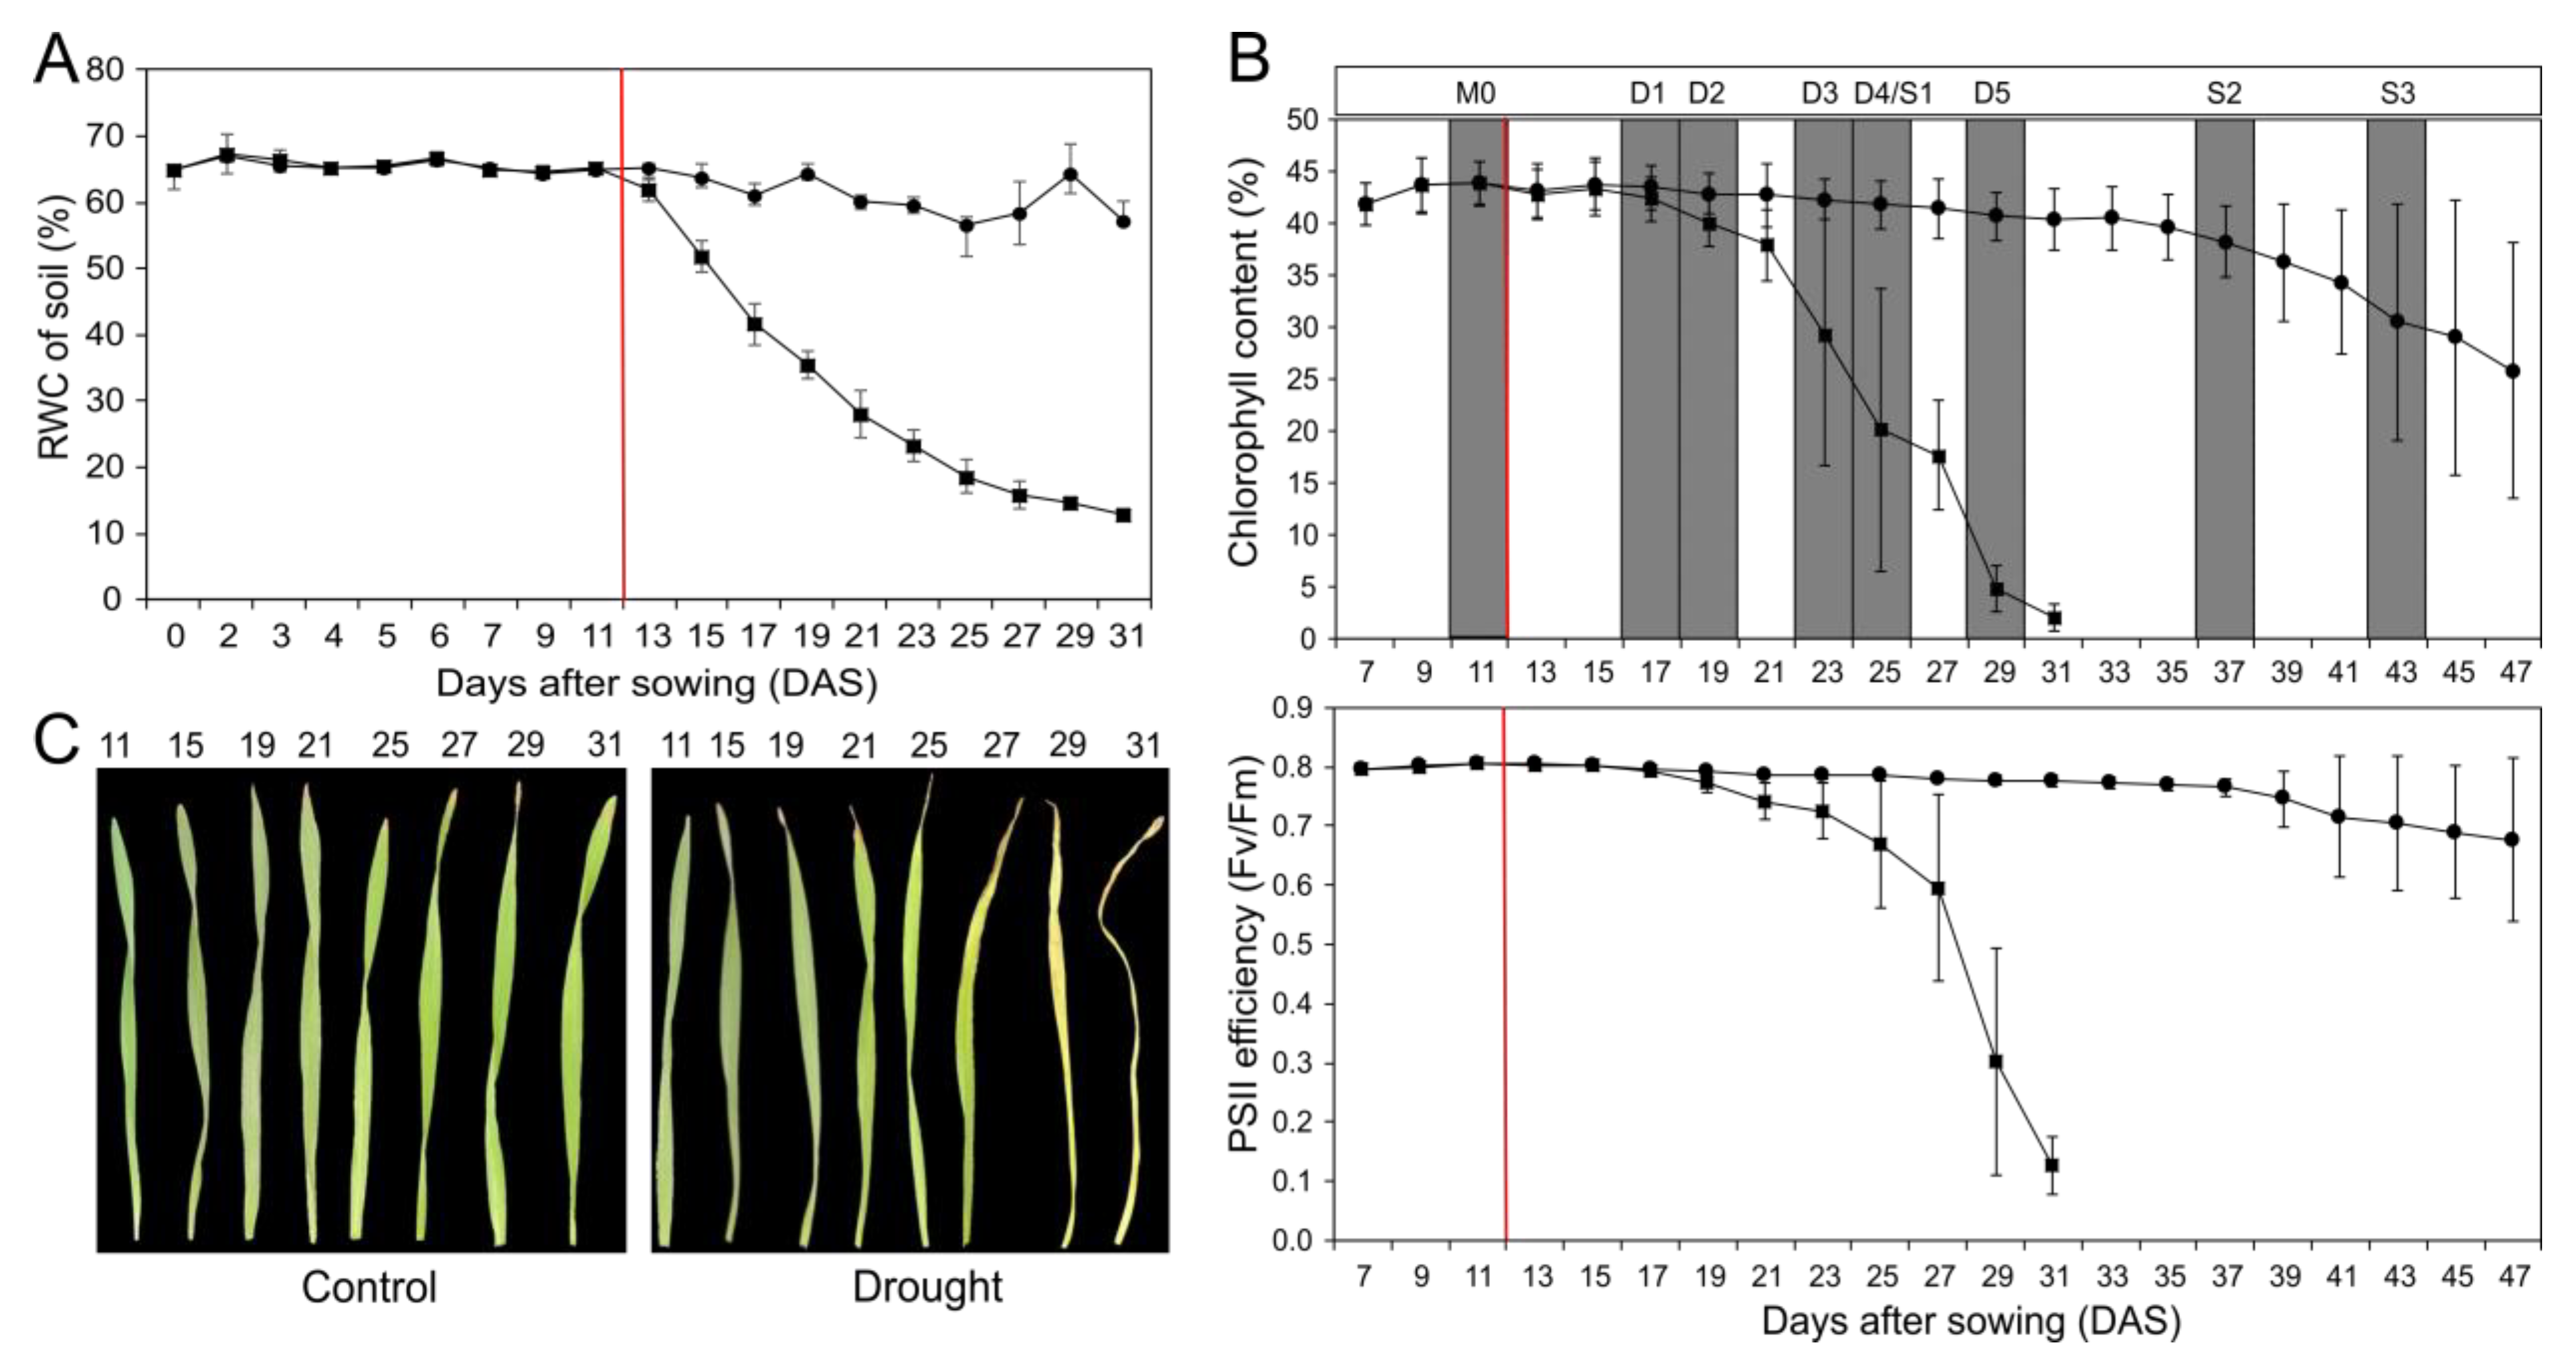
Abstract
:1. Introduction
2. Results
2.1. Set-up of Drought Stress Experiment
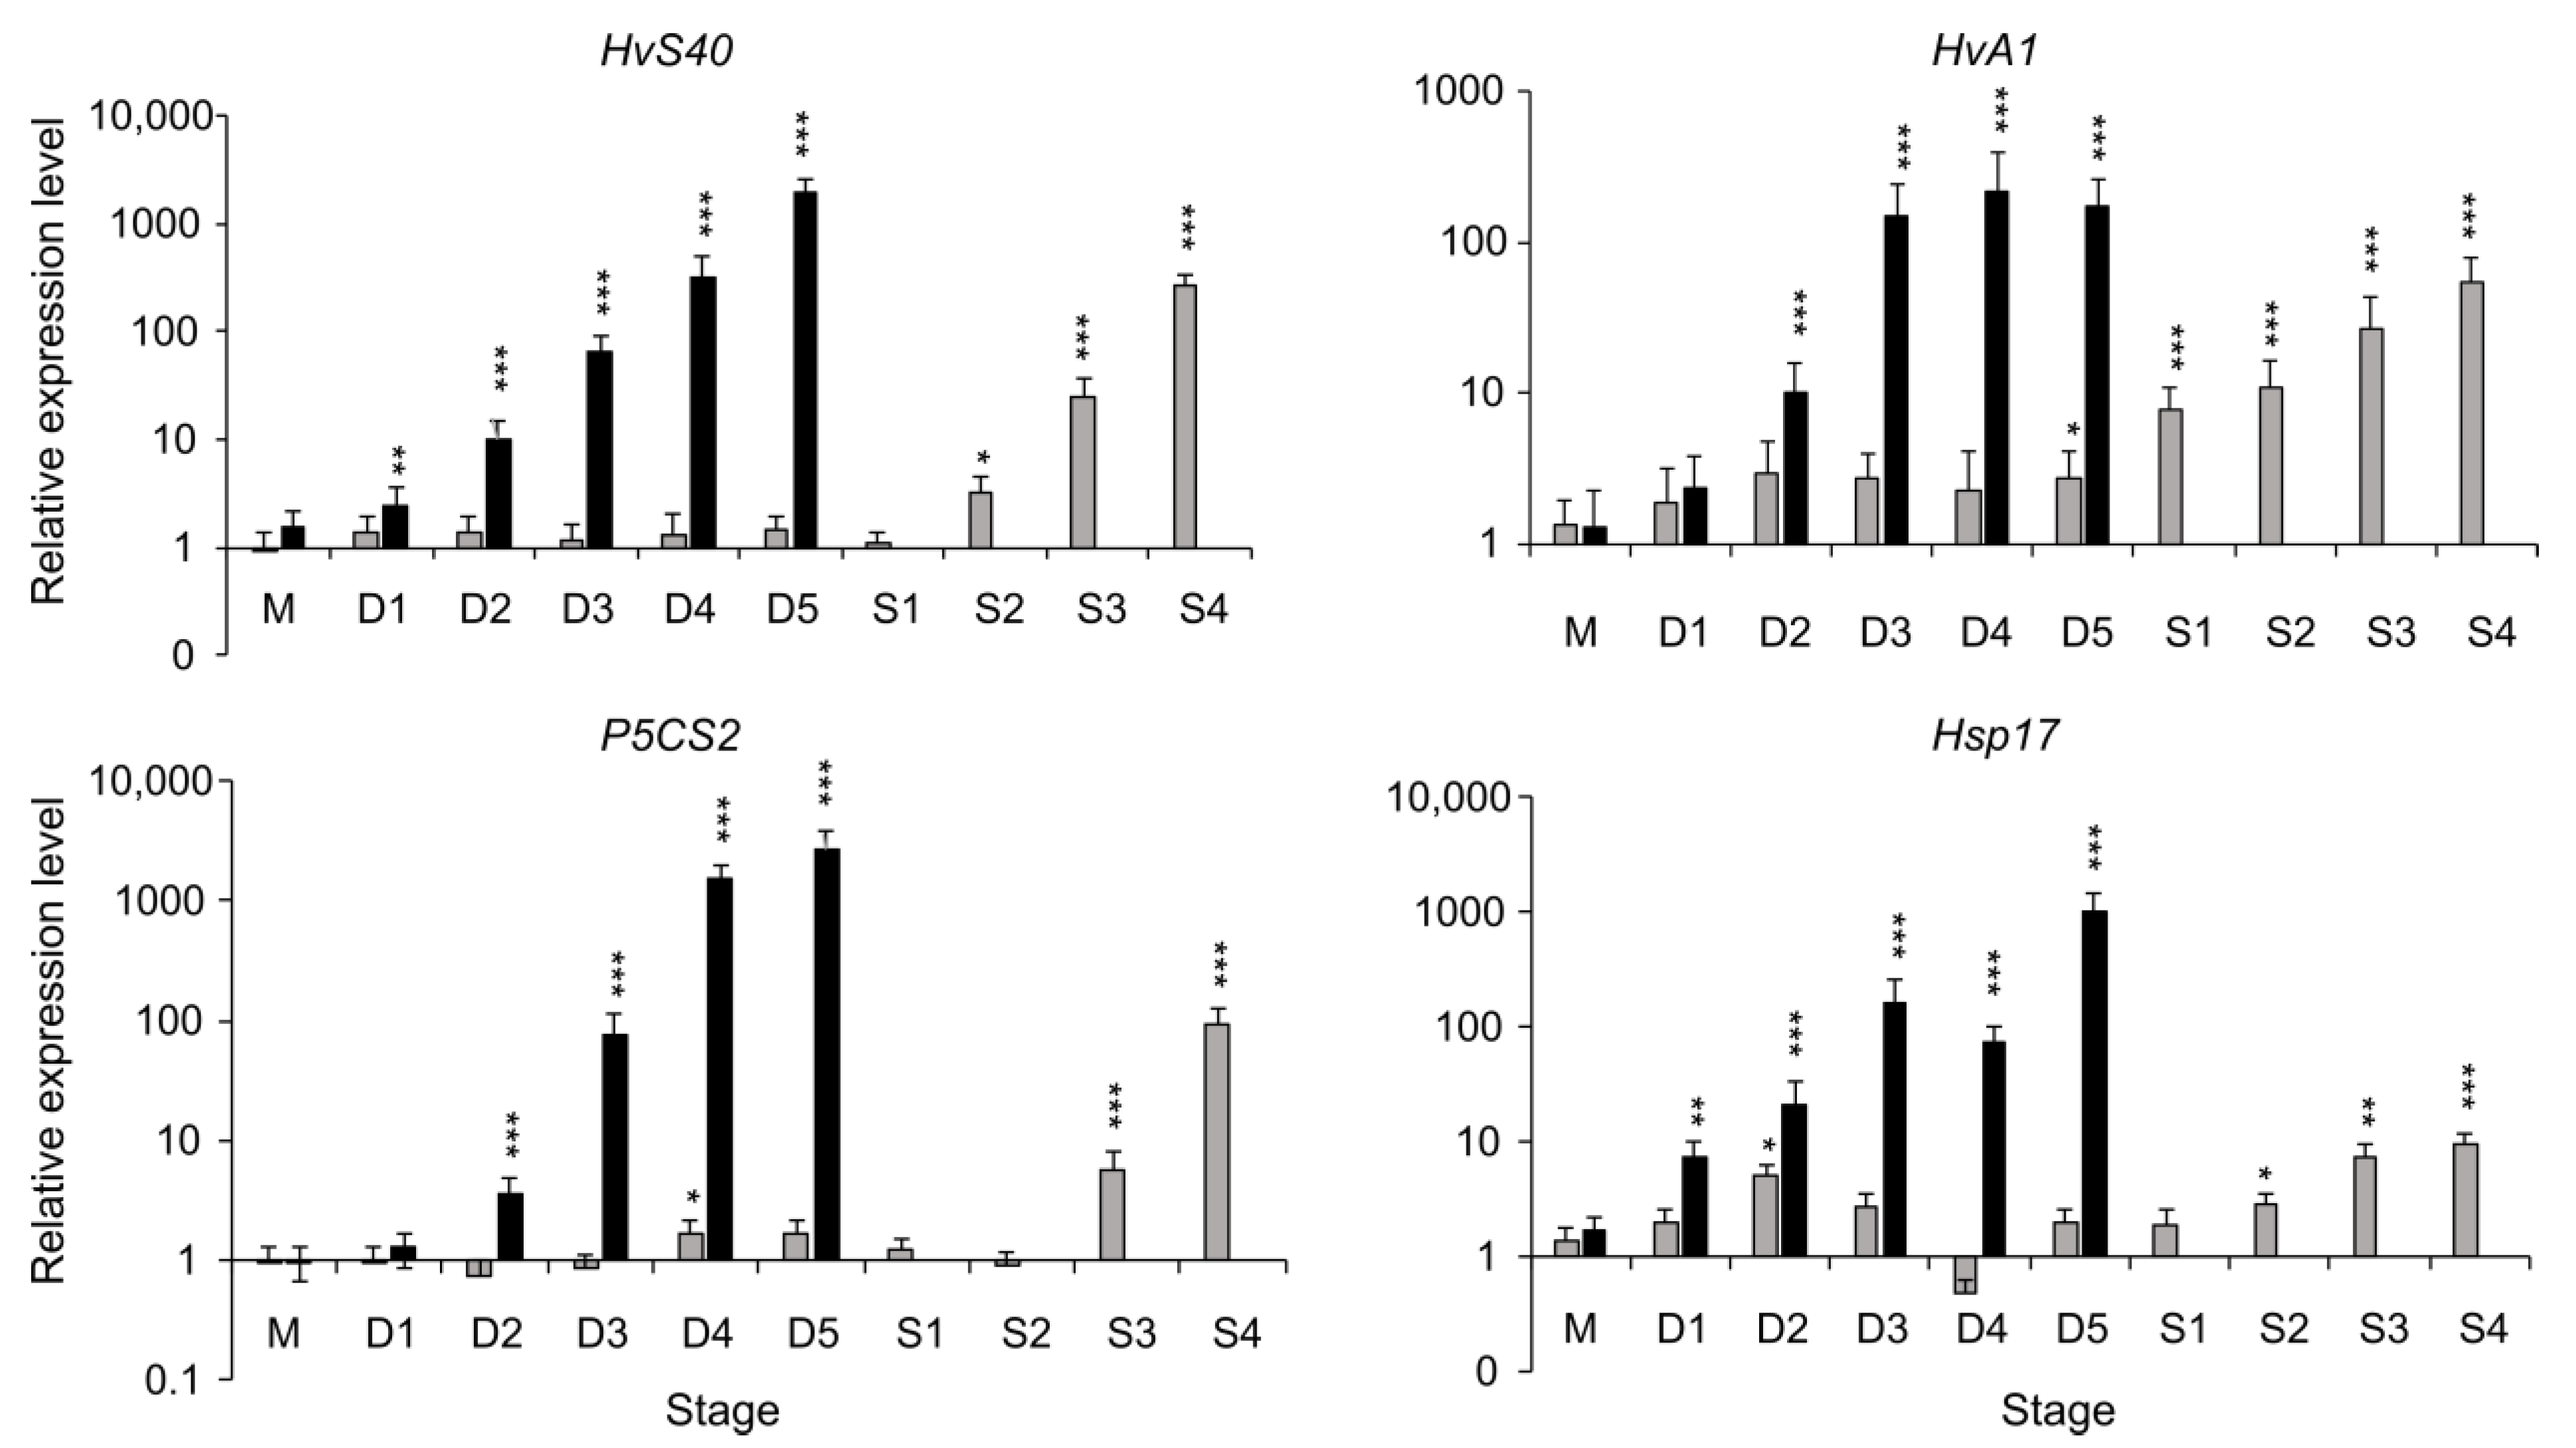
2.2. Expression of Stress- and Senescence-Related Marker Genes
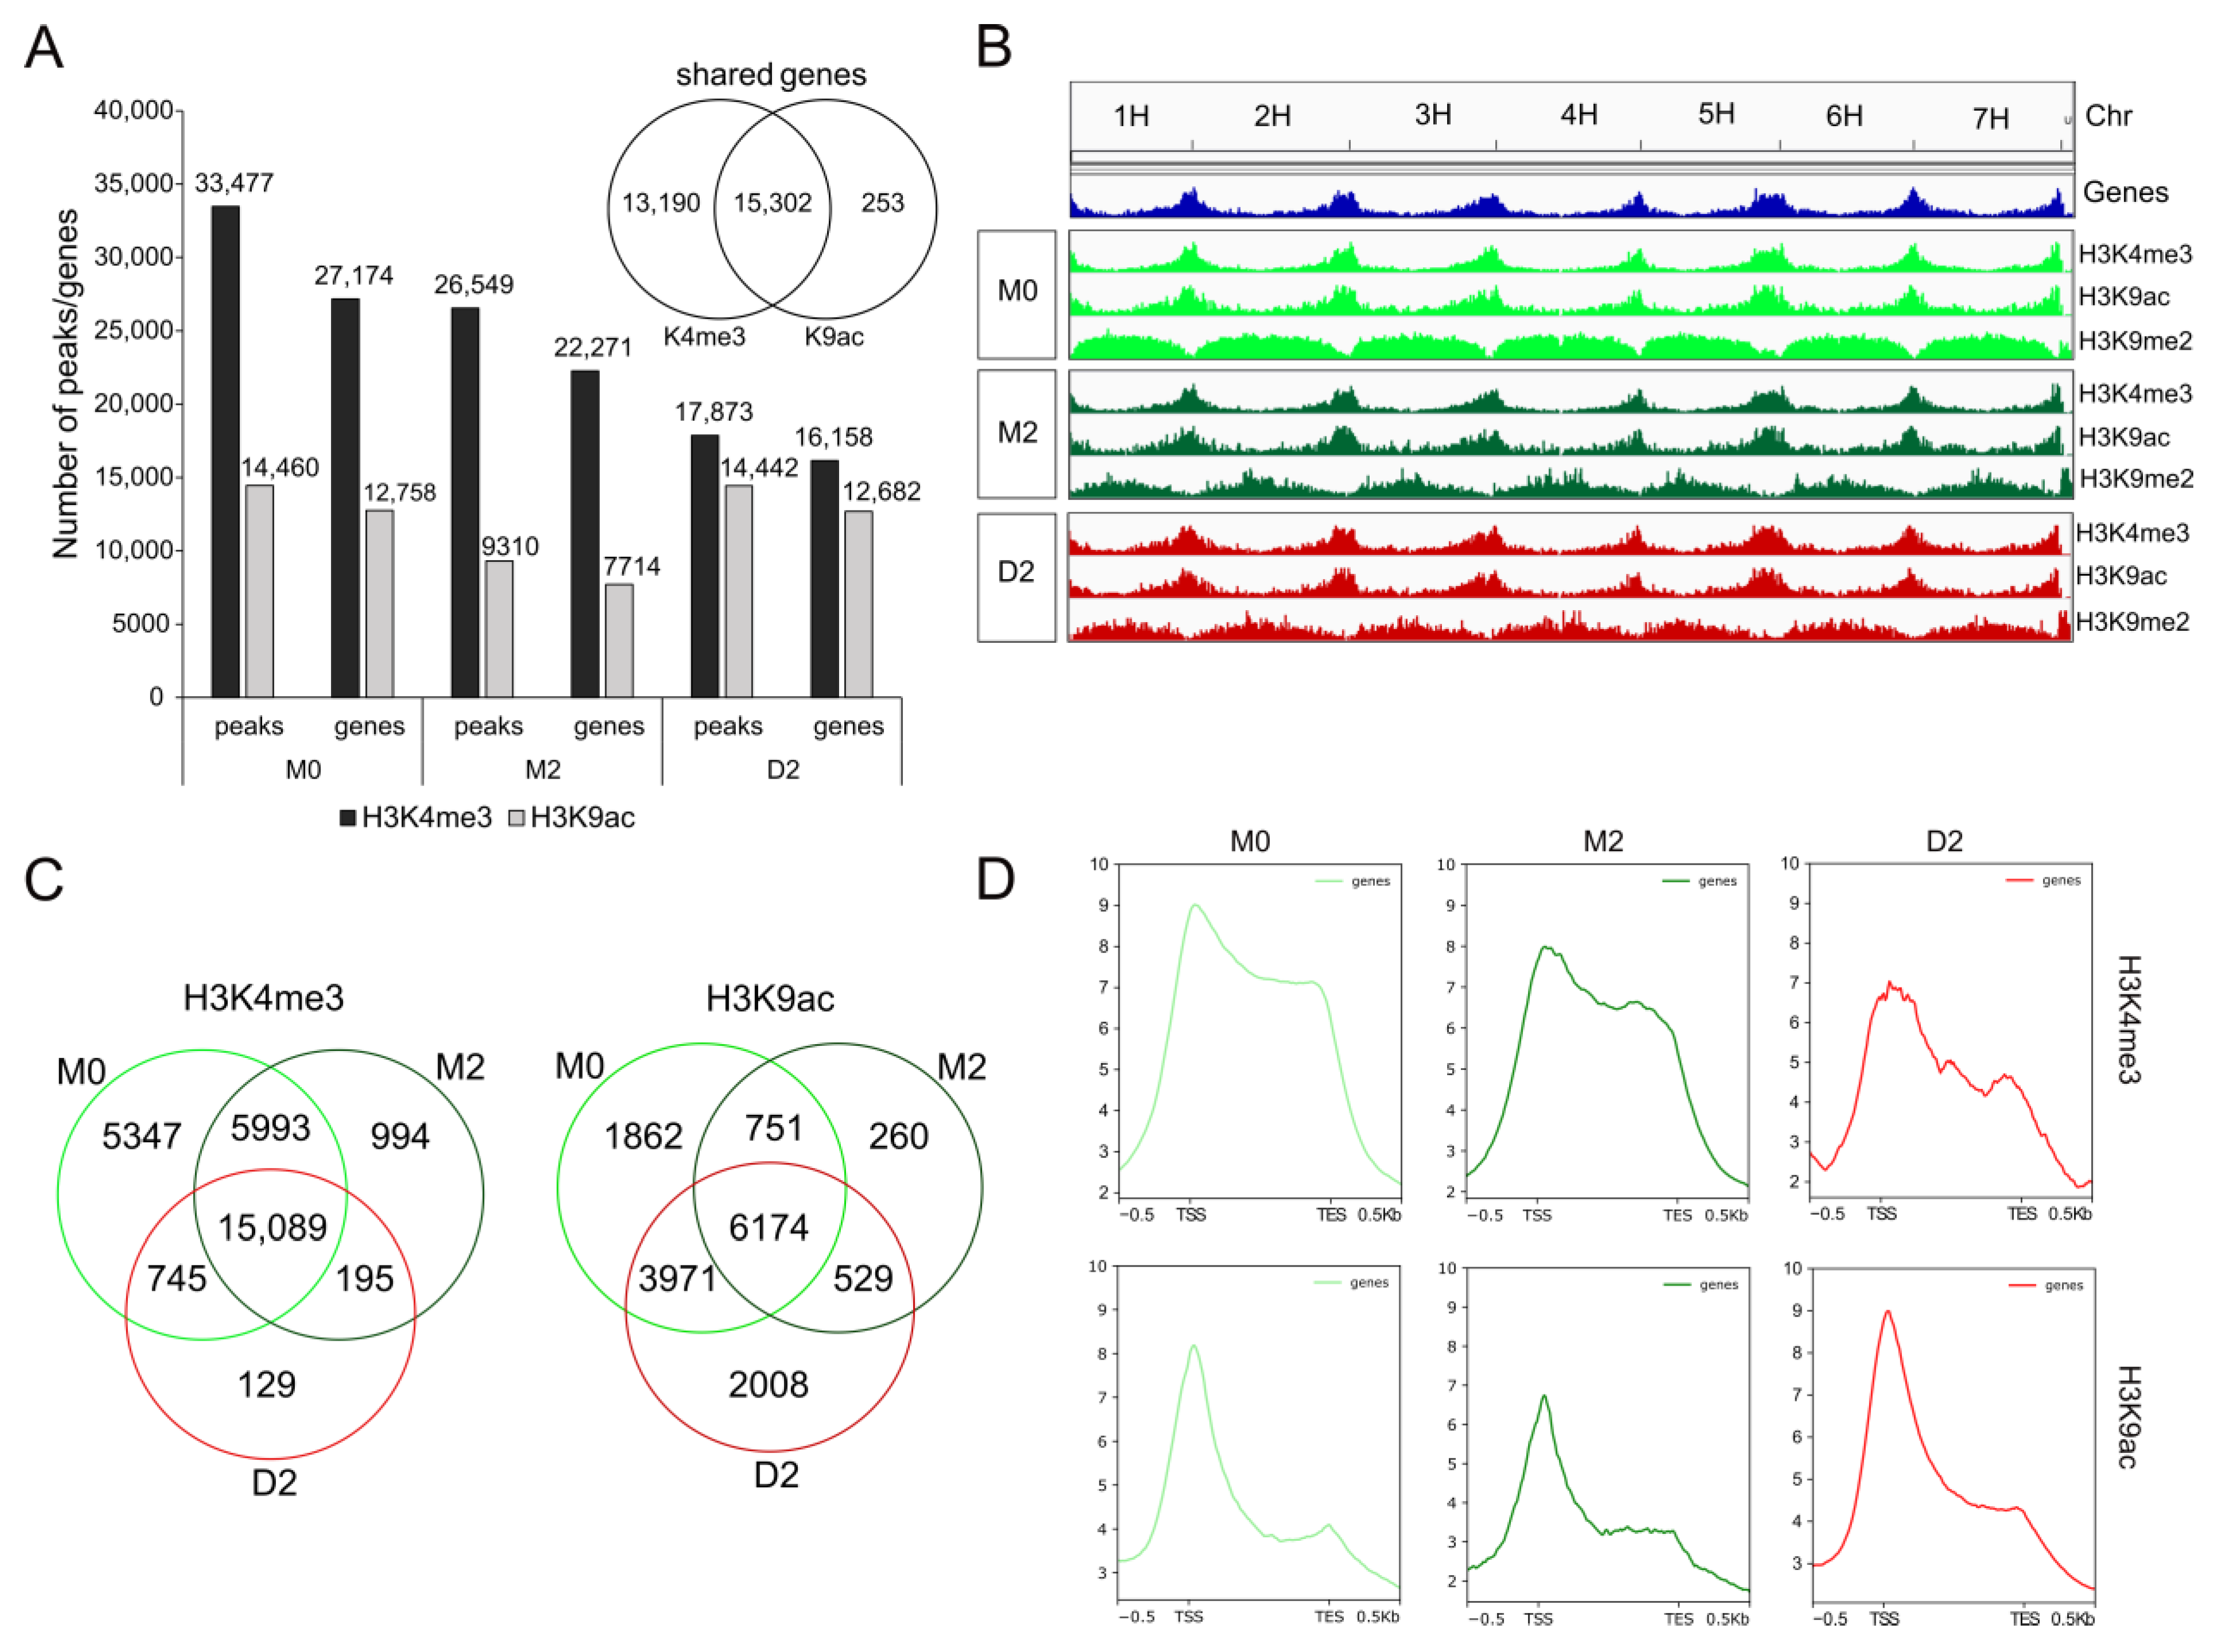
2.3. Drought Stress Specifically Alters Genome-Wide Loading with Euchromatic Marks H3K4me3 and H3K9ac
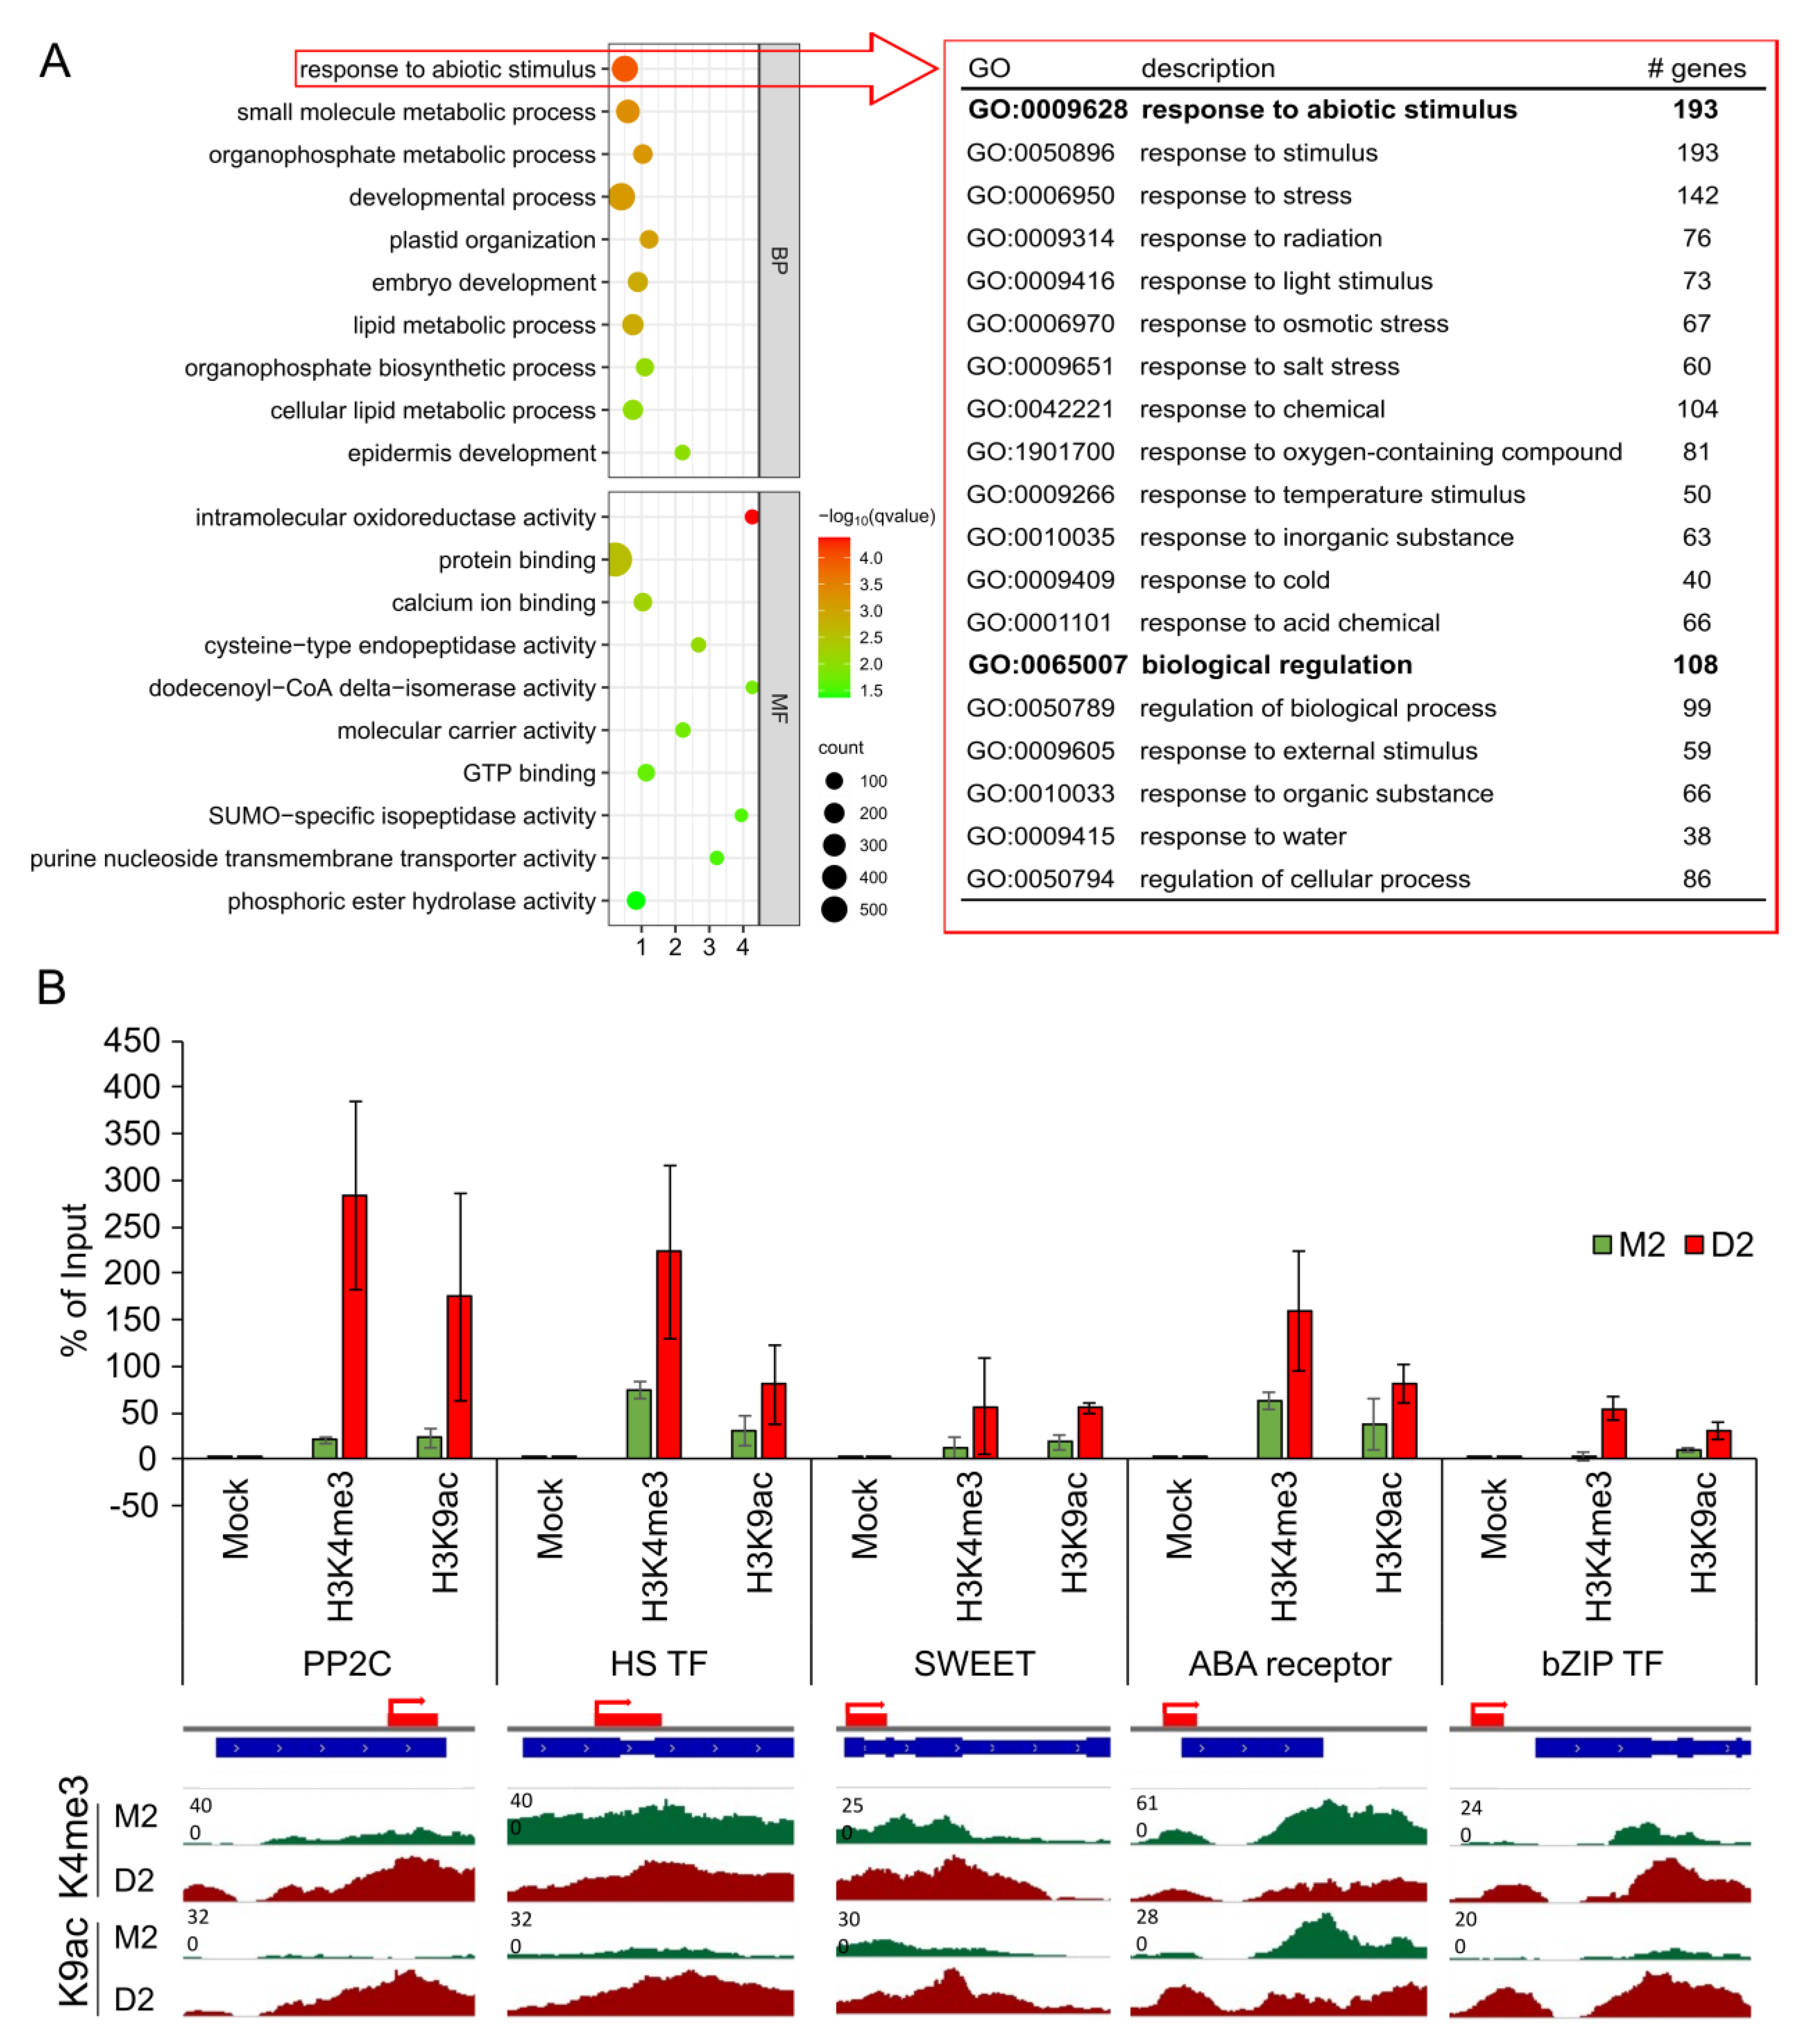
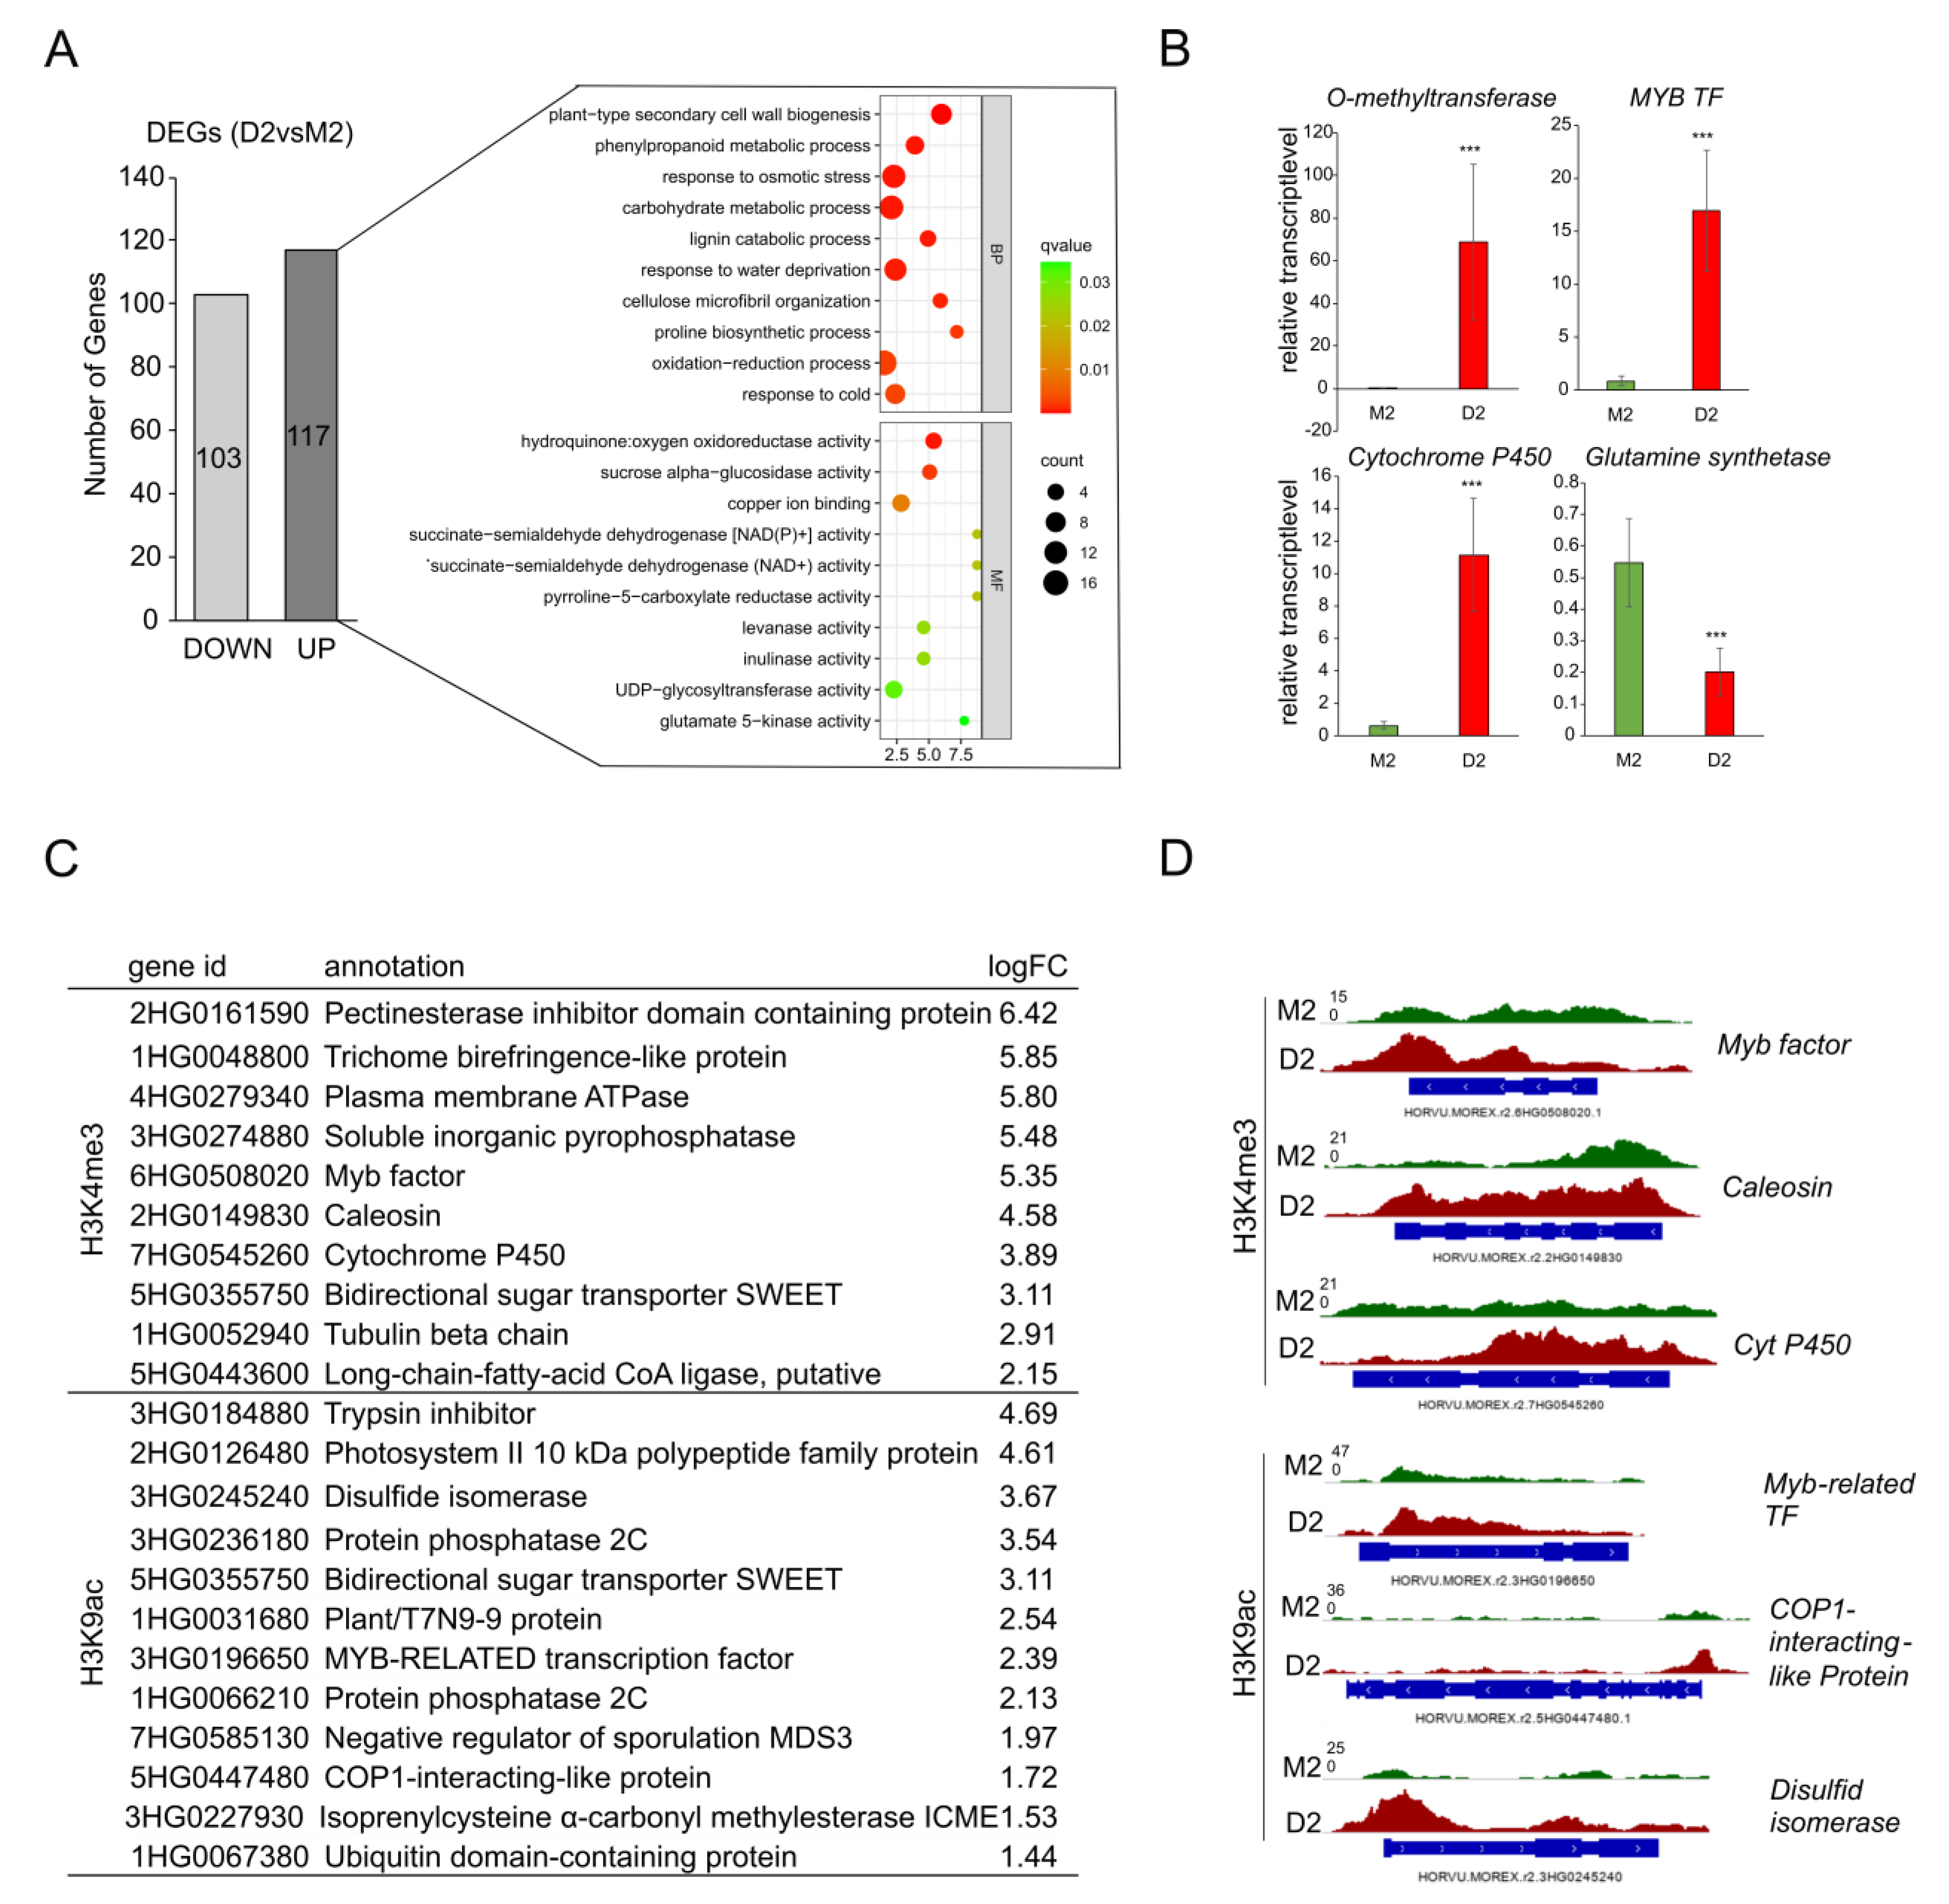
2.4. Functional Analysis of Genes Loaded with H3K9ac or H3K4me3 in Response to Drought
2.5. Identification of Genes Specifically Labeled with H3K4me3 and H3K9ac and being Upregulated during Drought Stress
3. Discussion
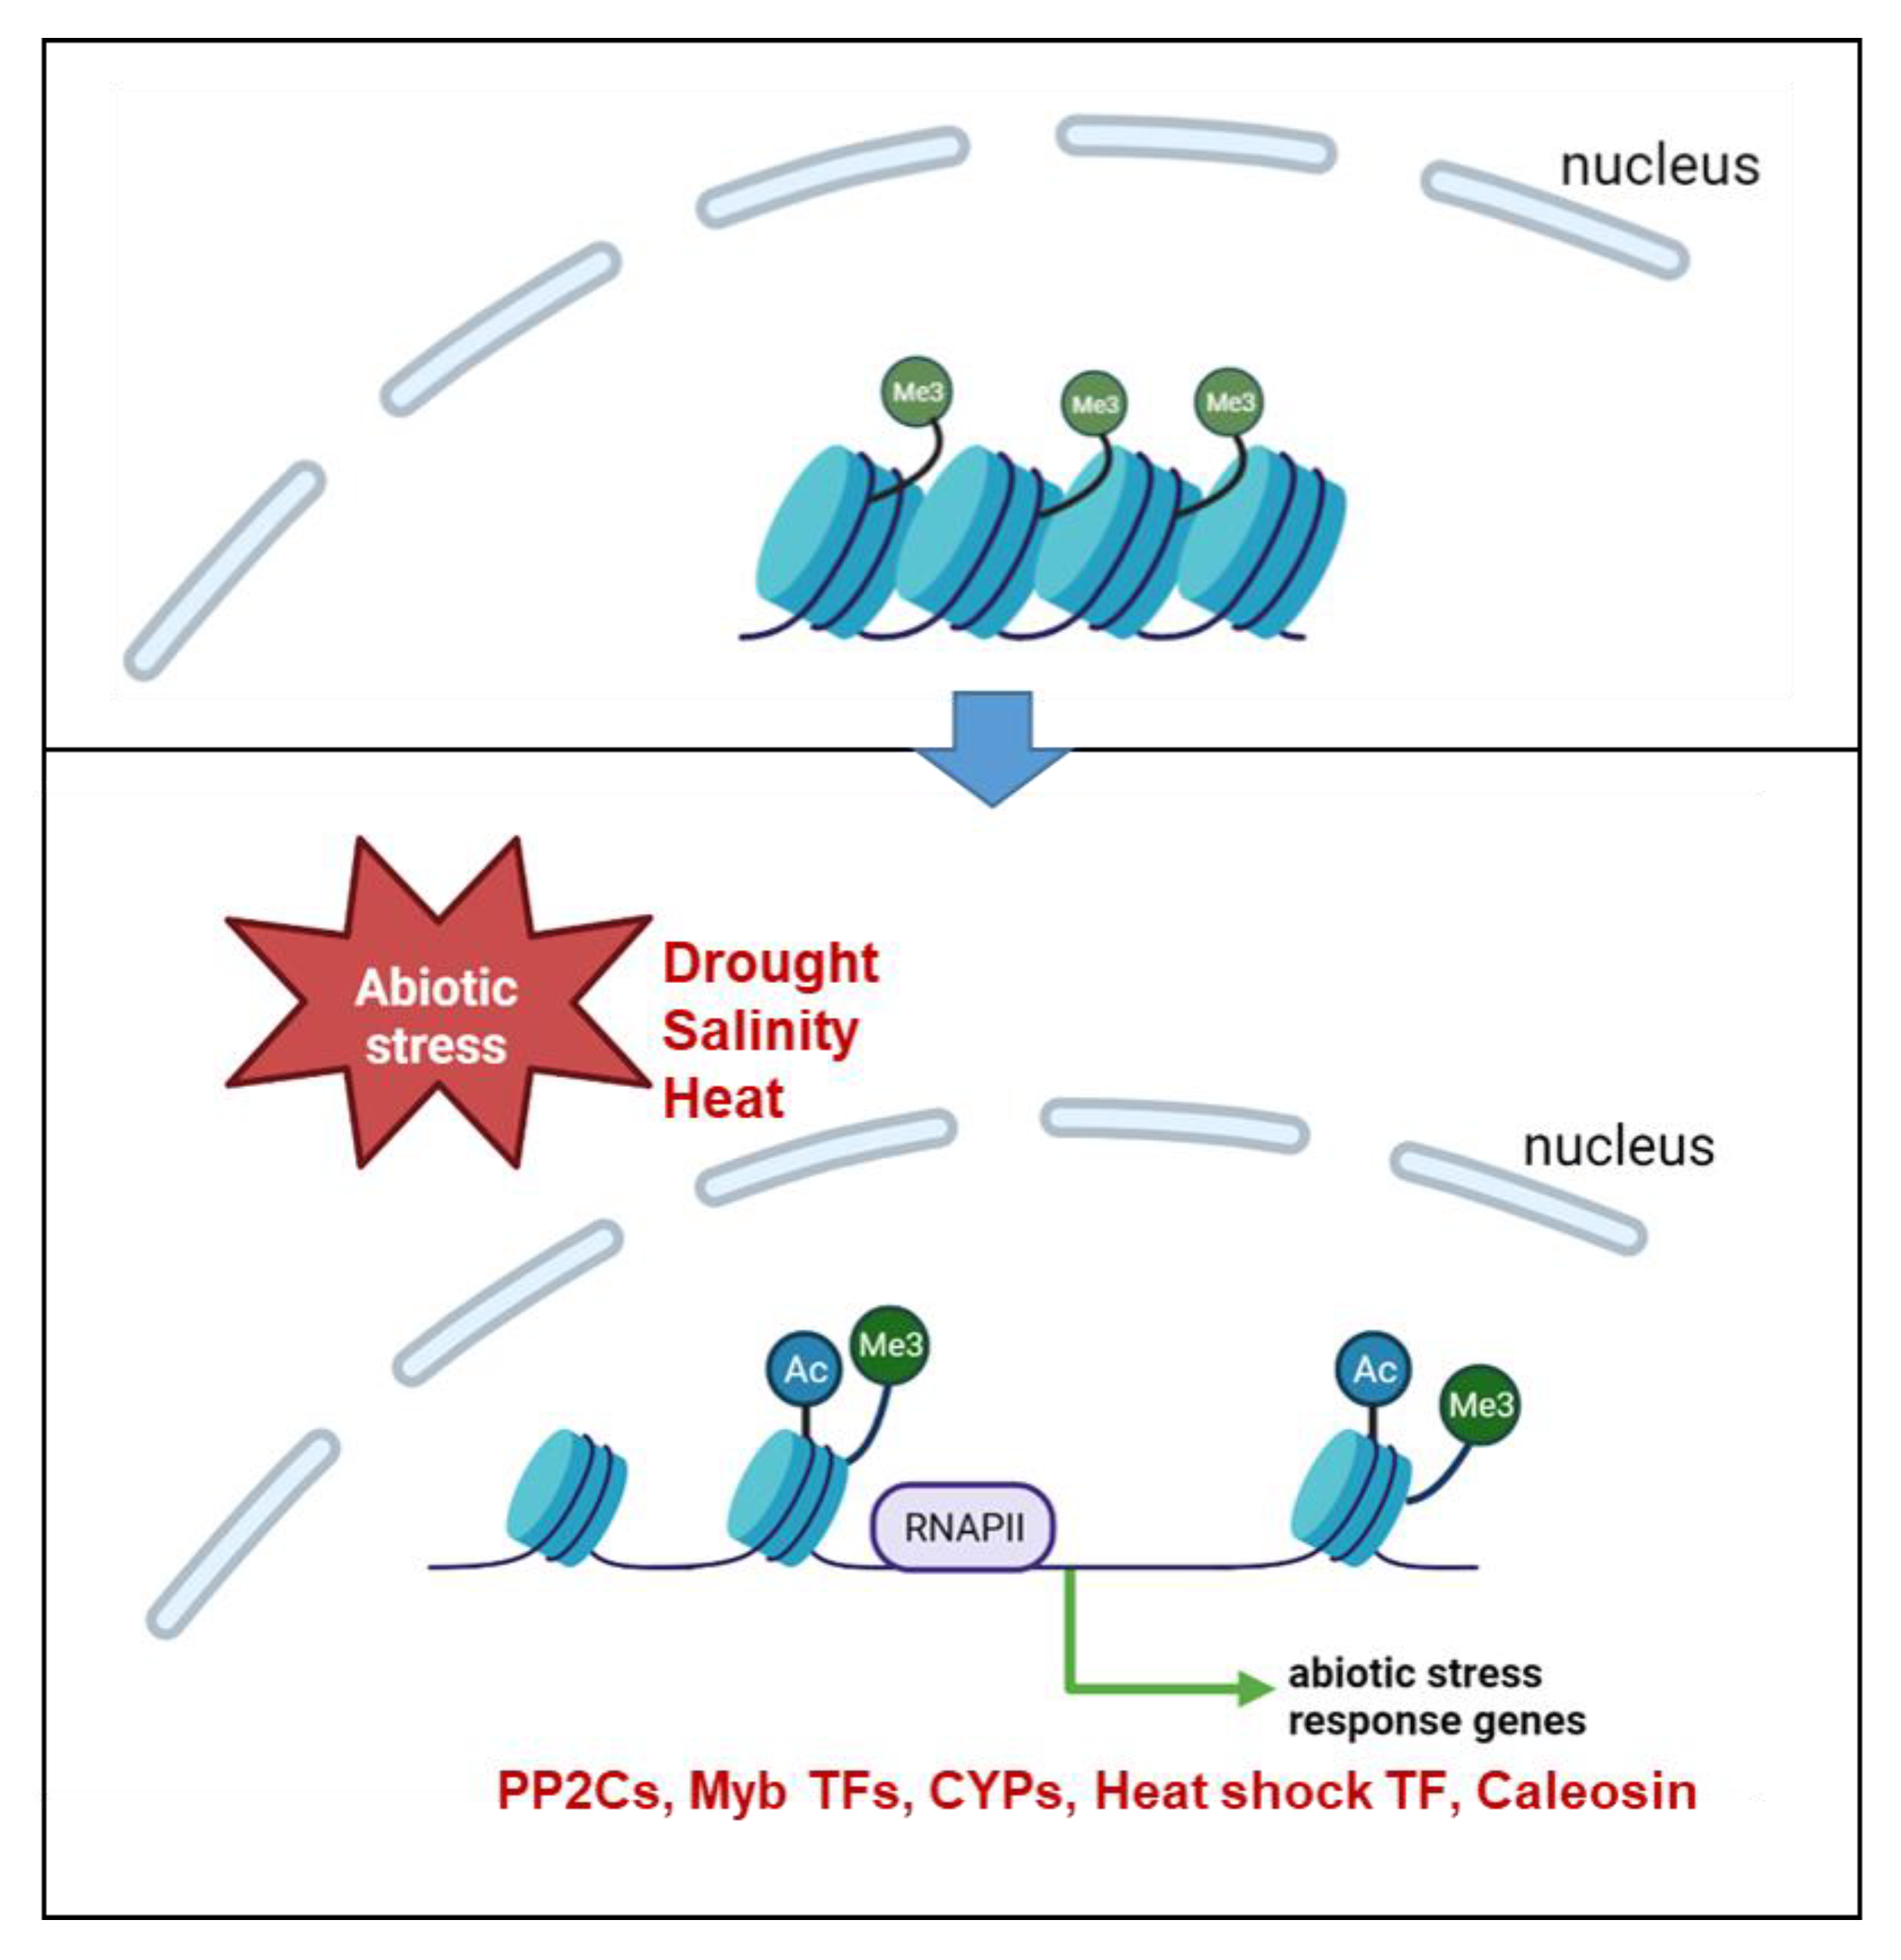
3.1. Early Response to Drought Stress Includes Global Reorientation of Histone Modifications H3K9ac and H3K4me3
3.2. Genes Loaded with Euchromatic H3K9ac and Induced at Early Drought Stress
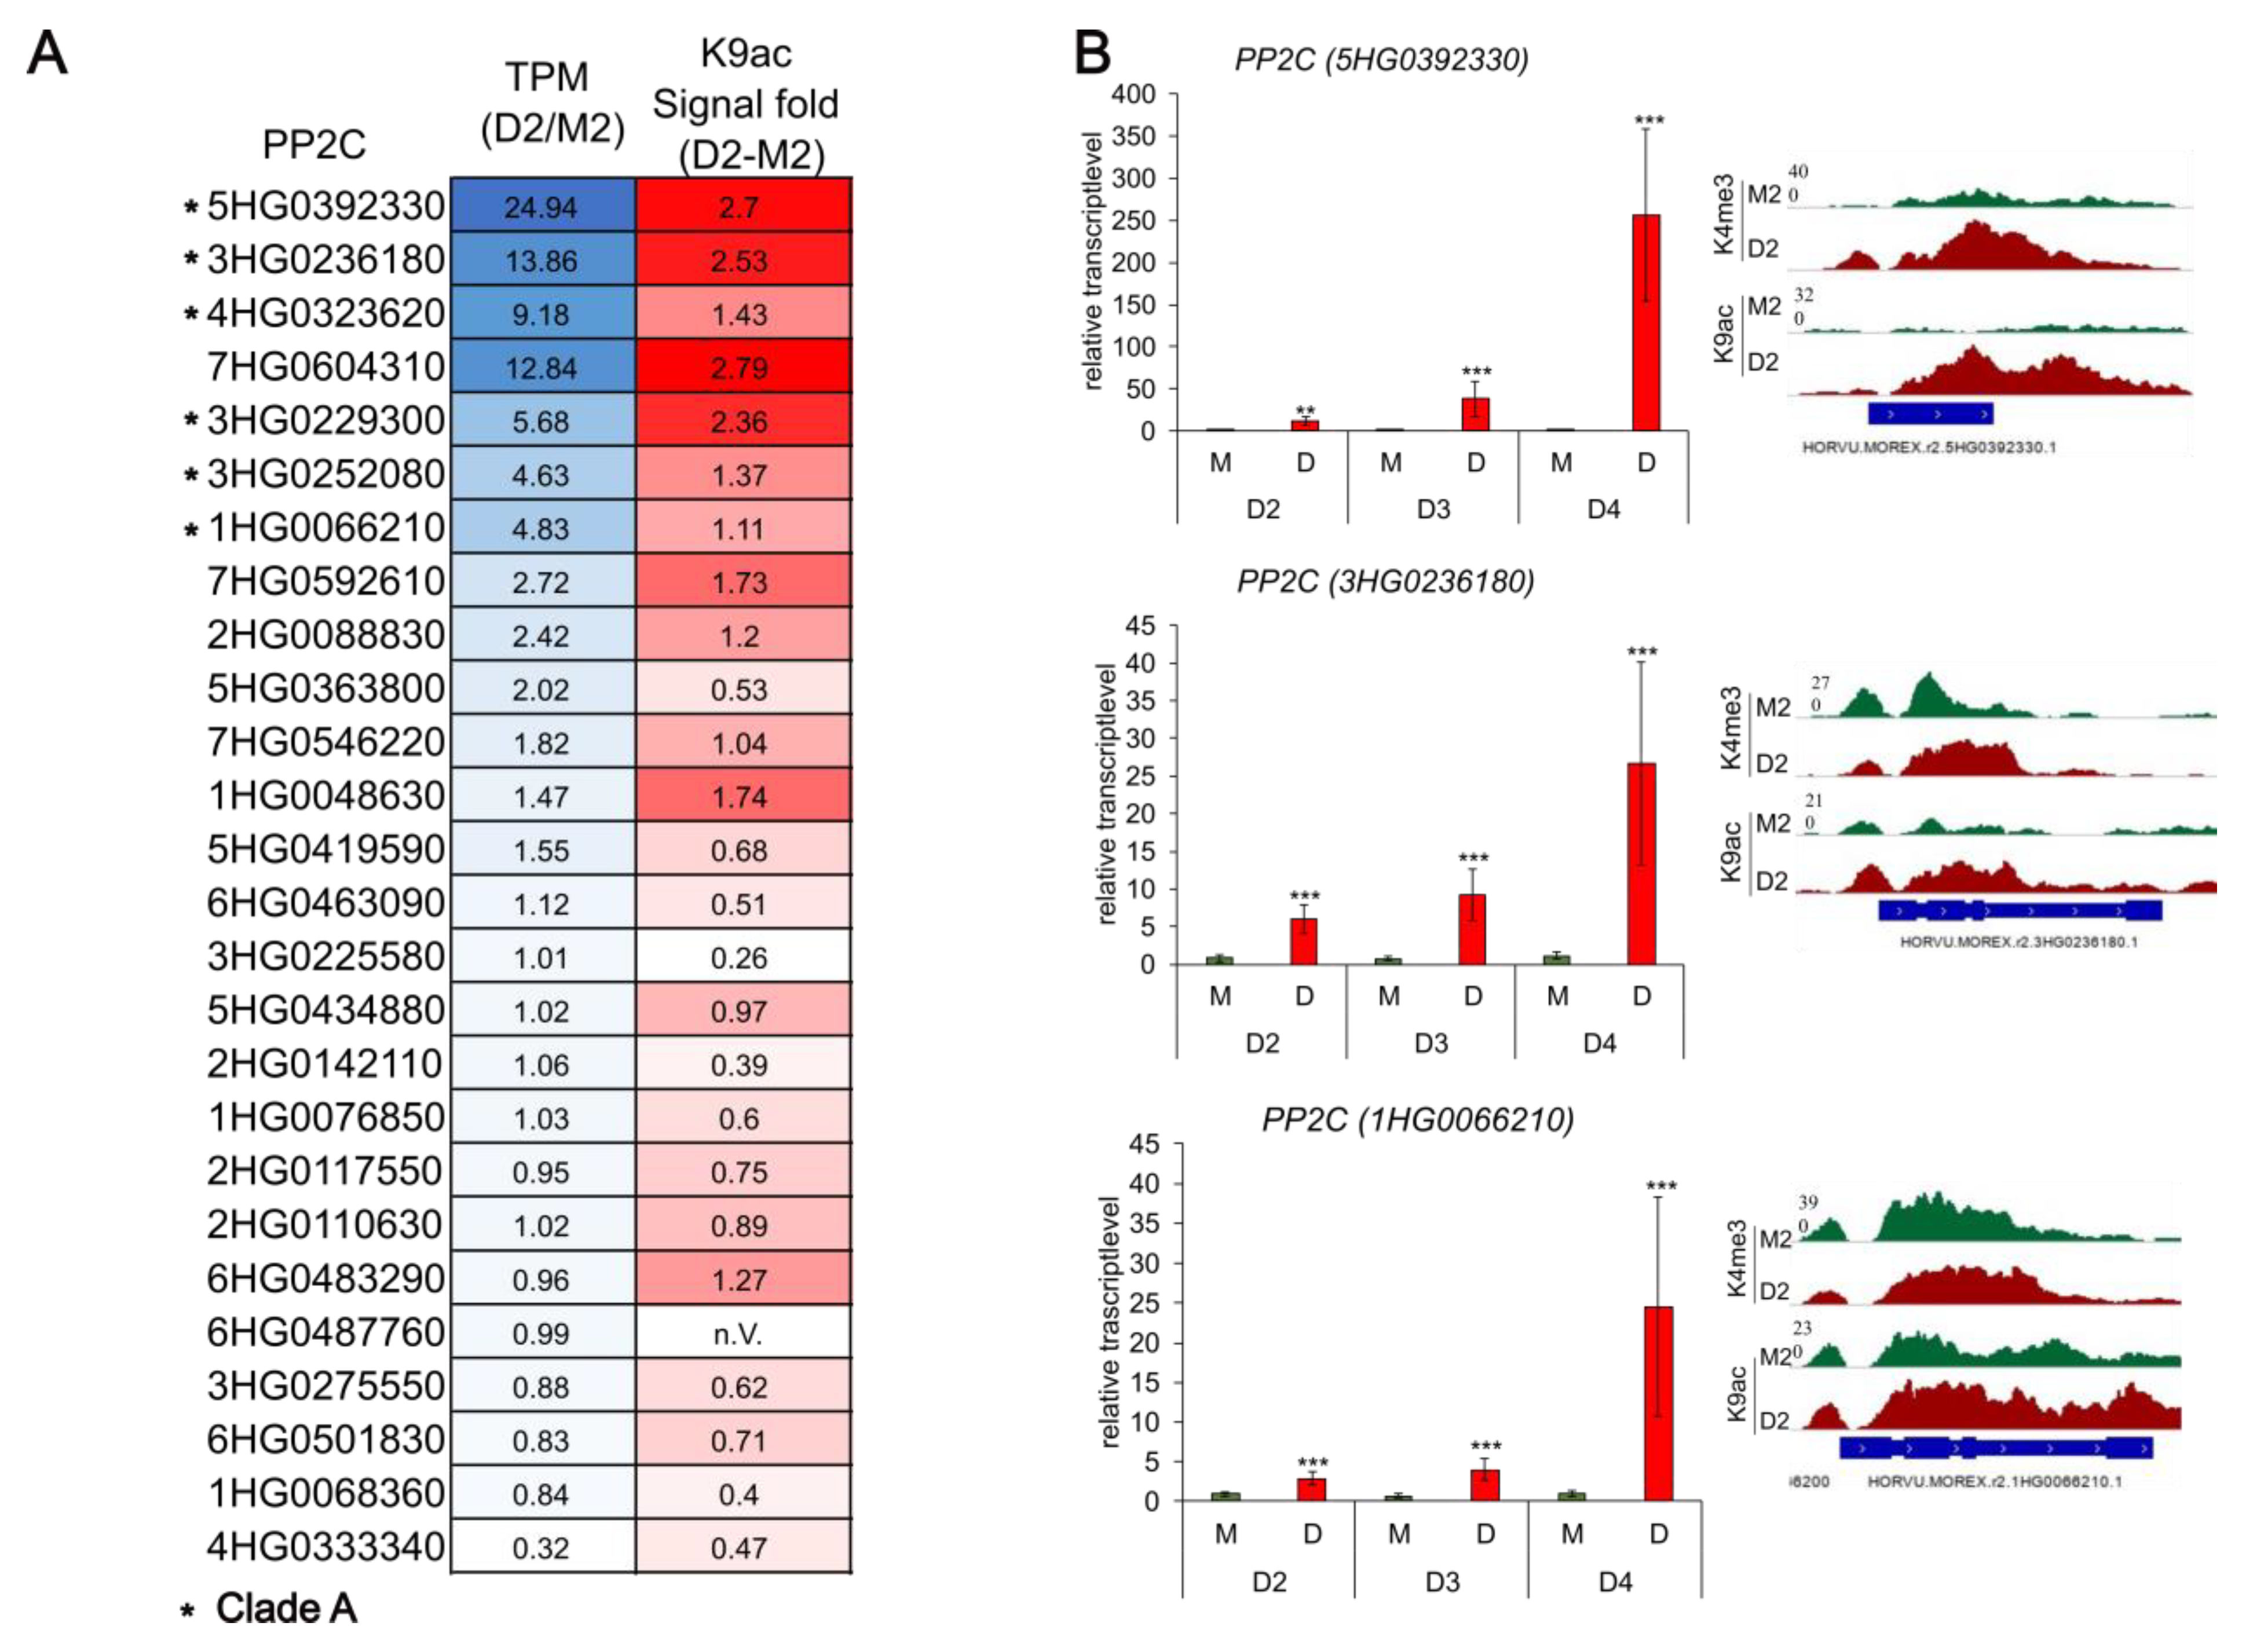
3.3. PP2Cs and Other ABA-Related Genes Are Loaded with H3K9ac in Response to Drought
4. Material and Methods
4.1. Plant Material and Growth under Drought Stress Conditions
4.2. Physiological Measurements
4.3. Gene Expression Analysis Using Quantitative Real-Time PCR (qRT-PCR)
4.4. Chromatin Immunoprecipitation (ChIP) Followed by Sequencing
4.5. RNA-Seq Analysis
4.6. GO Term Enrichment Analysis
5. Conclusions
Supplementary Materials
Author Contributions
Funding
Institutional Review Board Statement
Data Availability Statement
Acknowledgments
Conflicts of Interest
References
- Ferchichi, S.; Hessini, K.; Dell’Aversana, E.; D’Amelia, L.; Woodrow, P.; Ciarmiello, L.F.; Fuggi, A.; Carillo, P. Hordeum vulgare and Hordeum maritimum respond to extended salinity stress displaying different temporal accumulation pattern of metabolites. Funct. Plant Biol. 2018, 45, 1096–1109. [Google Scholar] [CrossRef] [PubMed]
- Turner, N.C. Turgor maintenance by osmotic adjustment: 40 years of progress. J. Exp. Bot. 2018, 69, 3223–3233. [Google Scholar] [CrossRef] [PubMed] [Green Version]
- Uga, Y.; Sugimoto, K.; Ogawa, S.; Rane, J.; Ishitani, M.; Hara, N.; Kitomi, Y.; Inukai, Y.; Ono, K.; Kanno, N.; et al. Control of root system architecture by DEEPER ROOTING 1 increases rice yield under drought conditions. Nat. Genet. 2013, 45, 1097–1102. [Google Scholar] [CrossRef] [PubMed]
- Wasson, A.P.; Richards, R.A.; Chatrath, R.; Misra, S.C.; Prasad, S.V.S.; Rebetzke, G.J.; Kirkegaard, J.A. Traits and selection strategies to improve root systems and water uptake in water-limited wheat crops. J. Exp. Bot. 2012, 63, 3485–3498. [Google Scholar] [CrossRef] [PubMed] [Green Version]
- Lynch, J.P.; Chimungu, J.G.; Brown, K.M. Root anatomical phenes associated with water acquisition from drying soil: Targets for crop improvement. J. Exp. Bot. 2014, 65, 6155–6166. [Google Scholar] [CrossRef] [PubMed] [Green Version]
- Kim, T.H.; Böhmer, M.; Hu, H.; Nishimura, N.; Schroeder, J.I. Guard cell signal transduction network: Advances in understanding abscisic acid, CO2, and Ca2+ signaling. Annu. Rev. Plant Biol. 2010, 61, 561–591. [Google Scholar] [CrossRef] [Green Version]
- Dar, N.A.; Amin, I.; Wani, W.; Wani, S.A.; Shikari, A.B.; Wani, S.H.; Masoodi, K.Z. Abscisic acid: A key regulator of abiotic stress tolerance in plants. Plant Gene 2017, 11, 106–111. [Google Scholar] [CrossRef]
- Ma, Y.; Szostkiewicz, I.; Korte, A.; Moes, D.; Yang, Y.; Christmann, A.; Grill, E. Regulators of PP2C Phosphatase Activity Function as Abscisic Acid Sensors. Science 2009, 324, 1064–1068. [Google Scholar] [CrossRef]
- Park, S.Y.; Fung, P.; Nishimura, N.; Jensen, D.R.; Fujii, H.; Zhao, Y.; Lumba, S.; Santiago, J.; Rodrigues, A.; Chow, T.F.F.; et al. Abscisic acid inhibits type 2C protein phosphatases via the PYR/PYL family of START proteins. Science 2009, 324, 1068–1069. [Google Scholar] [CrossRef] [PubMed] [Green Version]
- Cutler, S.R.; Rodriguez, P.L.; Finkelstein, R.R.; Abrams, S.R. Abscisic Acid: Emergence of a Core Signaling Network. Annu. Rev. Plant Biol. 2010, 61, 651–679. [Google Scholar] [CrossRef] [PubMed] [Green Version]
- Raghavendra, A.S.; Gonugunta, V.K.; Christmann, A.; Grill, E. ABA perception and signalling. Trends Plant Sci. 2010, 15, 395–401. [Google Scholar] [CrossRef] [PubMed]
- Lim, C.; Baek, W.; Jung, J.; Kim, J.; Lee, S. Function of ABA in Stomatal Defense against Biotic and Drought Stresses. Int. J. Mol. Sci. 2015, 16, 15251–15270. [Google Scholar] [CrossRef] [PubMed] [Green Version]
- Lee, S.C.; Lan, W.; Buchanan, B.B.; Luan, S. A protein kinase-phosphatase pair interacts with an ion channel to regulate ABA signaling in plant guard cells. Proc. Natl. Acad. Sci. USA 2009, 106, 21419–21424. [Google Scholar] [CrossRef] [PubMed]
- Geiger, D.; Scherzer, S.; Mumm, P.; Stange, A.; Marten, I.; Bauer, H.; Ache, P.; Matschi, S.; Liese, A.; Al-Rasheid, K.A.S.; et al. Activity of guard cell anion channel SLAC1 is controlled by drought-stress signaling kinase-phosphatase pair. Proc. Natl. Acad. Sci. USA 2009, 106, 21425–21430. [Google Scholar] [CrossRef]
- Mustilli, A.C.; Merlot, S.; Vavasseur, A.; Fenzi, F.; Giraudat, J. Arabidopsis OST1 protein kinase mediates the regulation of stomatal aperture by abscisic acid and acts upstream of reactive oxygen species production. Plant Cell 2002, 14, 3089–3099. [Google Scholar] [CrossRef] [PubMed] [Green Version]
- Hsu, P.K.; Dubeaux, G.; Takahashi, Y.; Schroeder, J.I. Signaling mechanisms in abscisic acid-mediated stomatal closure. Plant J. 2021, 105, 307–321. [Google Scholar] [CrossRef] [PubMed]
- Kim, J.H. Multifaceted chromatin structure and transcription changes in plant stress response. Int. J. Mol. Sci. 2021, 22, 2013. [Google Scholar] [CrossRef] [PubMed]
- Kim, J.-M.; Sasaki, T.; Ueda, M.; Sako, K.; Seki, M. Chromatin changes in response to drought, salinity, heat, and cold stresses in plants. Front. Plant Sci. 2015, 6, 114. [Google Scholar] [CrossRef] [PubMed] [Green Version]
- Kim, J.M.; To, T.K.; Ishida, J.; Matsui, A.; Kimura, H.; Seki, M. Transition of chromatin status during the process of recovery from drought stress in Arabidopsis thaliana. Plant Cell Physiol. 2012, 53, 847–856. [Google Scholar] [CrossRef]
- Kim, J.M.; To, T.K.; Ishida, J.; Morosawa, T.; Kawashima, M.; Matsui, A.; Toyoda, T.; Kimura, H.; Shinozaki, K.; Seki, M. Alterations of lysine modifications on the histone H3 N-tail under drought stress conditions in Arabidopsis thaliana. Plant Cell Physiol. 2008, 49, 1580–1588. [Google Scholar] [CrossRef] [PubMed] [Green Version]
- Luo, M.; Liu, X.; Singh, P.; Cui, Y.; Zimmerli, L.; Wu, K. Chromatin modifications and remodeling in plant abiotic stress responses. Biochim. Biophys. Acta-Gene Regul. Mech. 2012, 1819, 129–136. [Google Scholar] [CrossRef] [PubMed]
- Asensi-Fabado, M.-A.; Amtmann, A.; Perrella, G. Plant responses to abiotic stress: The chromatin context of transcriptional regulation. Biochim. Biophys. Acta-Gene Regul. Mech. 2017, 1860, 106–122. [Google Scholar] [CrossRef] [PubMed] [Green Version]
- Van Dijk, K.; Ding, Y.; Malkaram, S.; Riethoven, J.-J.M.; Liu, R.; Yang, J.; Laczko, P.; Chen, H.; Xia, Y.; Ladunga, I.; et al. Dynamic changes in genome-wide histone H3 lysine 4 methylation patterns in response to dehydration stress in Arabidopsis thaliana. BMC Plant Biol. 2010, 10, 238. [Google Scholar] [CrossRef] [PubMed] [Green Version]
- Zong, W.; Zhong, X.; You, J.; Xiong, L. Genome-wide profiling of histone H3K4-tri-methylation and gene expression in rice under drought stress. Plant Mol. Biol. 2013, 81, 175–188. [Google Scholar] [CrossRef] [PubMed]
- Forestan, C.; Farinati, S.; Zambelli, F.; Pavesi, G.; Rossi, V.; Varotto, S. Epigenetic signatures of stress adaptation and flowering regulation in response to extended drought and recovery in Zea mays. Plant Cell Environ. 2020, 43, 55–75. [Google Scholar] [CrossRef] [PubMed]
- Song, J.; Henry, H.; Tian, L. Drought-inducible changes in the histone modification H3K9ac are associated with drought-responsive gene expression in Brachypodium distachyon. Plant Biol. 2020, 22, 433–440. [Google Scholar] [CrossRef] [PubMed]
- Shinozaki, K.; Yamaguchi-Shinozaki, K. Gene networks involved in drought stress response and tolerance. J. Exp. Bot. 2007, 58, 221–227. [Google Scholar] [CrossRef] [PubMed] [Green Version]
- Kleber-Janke, T.; Krupinska, K. Isolation of cDNA clones for genes showing enhanced expression in harley leaves during dark-induced senescence as well as during senescence under field conditions. Planta 1997, 203, 332–340. [Google Scholar] [CrossRef] [PubMed]
- Krupinska, K.; Haussühl, K.; Schäfer, A.; Van der Kooij, T.A.W.; Leckband, G.; Lörz, H.; Falk, J. A novel nucleus-targeted protein is expressed in barley leaves during senescence and pathogen infection. Plant Physiol. 2002, 130, 1172–1180. [Google Scholar] [CrossRef] [PubMed] [Green Version]
- Krupinska, K.; Dähnhardt, D.; Fischer-Kilbienski, I.; Kucharewicz, W.; Scharrenberg, C.; Trösch, M.; Buck, F. Identification of WHIRLY1 as a Factor Binding to the Promoter of the Stress- and Senescence-Associated Gene HvS40. J. Plant Growth Regul. 2014, 33, 91–105. [Google Scholar] [CrossRef]
- Hong, B.; Uknes, S.J.; Ho, T. hua D. Cloning and characterization of a cDNA encoding a mRNA rapidly-induced by ABA in barley aleurone layers. Plant Mol. Biol. 1988, 11, 495–506. [Google Scholar] [CrossRef] [PubMed]
- Straub, P.F.; Shen, Q.; Ho, T.H.D. Structure and promoter analysis of an ABA- and stress-regulated barley gene, HVA1. Plant Mol. Biol. 1994, 26, 617–630. [Google Scholar] [CrossRef] [PubMed]
- Hu, C.A.; Delauney, A.J.; Verma, D.P. A bifunctional enzyme (delta 1-pyrroline-5-carboxylate synthetase) catalyzes the first two steps in proline biosynthesis in plants. Proc. Natl. Acad. Sci. USA 1992, 89, 9354–9358. [Google Scholar] [CrossRef] [PubMed]
- Strizhov, N.; Ábrahám, E.; Ökrész, L.; Blickling, S.; Zilberstein, A.; Schell, J.; Koncz, C.; Szabados, L. Differential expression of two P5CS genes controlling proline accumulation during salt-stress requires ABA and is regulated by ABA1, ABI1 and AXR2 in Arabidopsis. Plant J. 1997, 12, 557–569. [Google Scholar] [CrossRef]
- Verbruggen, N.; Hermans, C. Proline accumulation in plants: A review. Amino Acids 2008, 35, 753–759. [Google Scholar] [CrossRef] [PubMed]
- Guo, P.; Baum, M.; Grando, S.; Ceccarelli, S.; Bai, G.; Li, R.; Von Korff, M.; Varshney, R.K.; Graner, A.; Valkoun, J. Differentially expressed genes between drought-tolerant and drought-sensitive barley genotypes in response to drought stress during the reproductive stage. J. Exp. Bot. 2009, 60, 3531–3544. [Google Scholar] [CrossRef] [PubMed]
- Mascher, M.; Gundlach, H.; Himmelbach, A.; Beier, S.; Twardziok, S.O.; Wicker, T.; Radchuk, V.; Dockter, C.; Hedley, P.E.; Russell, J.; et al. A chromosome conformation capture ordered sequence of the barley genome. Nature 2017, 544, 427–433. [Google Scholar] [CrossRef] [PubMed] [Green Version]
- Mascher, M. Pseudomolecules and Annotation of the Second Version of the Reference Genome Sequence Assembly of Barley cv. Morex [Morex V2]; e!DAL—Plant Genomics and Phenomics Research Data Repository (PGP), IPK Gatersleben: Gatersleben, Germany, 2019. [Google Scholar] [CrossRef]
- He, G.; Elling, A.A.; Deng, X.W. The Epigenome and Plant Development. Annu. Rev. Plant Biol 2011, 62, 411–435. [Google Scholar] [CrossRef] [PubMed] [Green Version]
- Baker, K.; Dhillon, T.; Colas, I.; Cook, N.; Milne, I.; Milne, L.; Bayer, M.; Flavell, A.J. Chromatin state analysis of the barley epigenome reveals a higher-order structure defined by H3K27me1 and H3K27me3 abundance. Plant J. 2015, 84, 111–124. [Google Scholar] [CrossRef] [Green Version]
- Bucchini, F.; Del Cortona, A.; Kreft, Ł.; Botzki, A.; Van Bel, M.; Vandepoele, K. TRAPID 2.0: A web application for taxonomic and functional analysis of de novo transcriptomes. Nucleic Acids Res. 2021, 49, e101. [Google Scholar] [CrossRef]
- Jung, C.; Nguyen, N.H.; Cheong, J.-J. Transcriptional Regulation of Protein Phosphatase 2C Genes to Modulate Abscisic Acid Signaling. Int. J. Mol. Sci. 2020, 21, 9517. [Google Scholar] [CrossRef] [PubMed]
- Schweighofer, A.; Hirt, H.; Meskiene, I. Plant PP2C phosphatases: Emerging functions in stress signaling. Trends Plant Sci. 2004, 9, 236–243. [Google Scholar] [CrossRef]
- Bruce, T.J.A.; Matthes, M.C.; Napier, J.A.; Pickett, J.A. Stressful “memories” of plants: Evidence and possible mechanisms. Plant Sci. 2007, 173, 603–608. [Google Scholar] [CrossRef]
- Kinoshita, T.; Seki, M. Epigenetic Memory for Stress Response and Adaptation in Plants. Plant Cell Physiol. 2014, 55, 1859–1863. [Google Scholar] [CrossRef] [PubMed]
- Wu, X.-T.; Xiong, Z.-P.; Chen, K.-X.; Zhao, G.-R.; Feng, K.-R.; Li, X.-H.; Li, X.-R.; Tian, Z.; Huo, F.-L.; Wang, M.-X.; et al. Genome-Wide Identification and Transcriptional Expression Profiles of PP2C in the Barley (Hordeum vulgare L.) Pan-Genome. Genes 2022, 13, 834. [Google Scholar] [CrossRef] [PubMed]
- Liang, J.; Yi, L.; Li, L.; Zhang, H.; Zhang, Y.; Deng, G.; Long, H.; Yu, M. Identification of PP2C Genes in Tibetan Hulless Barley (Hordeum vulgare var. nudum) Under Dehydration Stress and Initiatory Expression and Functional Analysis of HvPP2C59. Plant Mol. Biol. Report. 2022, 40, 611–627. [Google Scholar] [CrossRef]
- Samarah, N.H.; Alqudah, A.M.; Amayreh, J.A.; McAndrews, G.M. The effect of late-terminal drought stress on yield components of four barley cultivars. J. Agron. Crop Sci. 2009, 195, 427–441. [Google Scholar] [CrossRef]
- Zhao, J.; Sun, H.; Dai, H.; Zhang, G.; Wu, F. Difference in response to drought stress among Tibet wild barley genotypes. Euphytica 2010, 172, 395–403. [Google Scholar] [CrossRef]
- Wehner, G.; Balko, C.; Humbeck, K.; Zyprian, E.; Ordon, F. Expression profiling of genes involved in drought stress and leaf senescence in juvenile barley. BMC Plant Biol. 2016, 16, 3. [Google Scholar] [CrossRef] [Green Version]
- Talamè, V.; Ozturk, N.Z.; Bohnert, H.J.; Tuberosa, R. Barley transcript profiles under dehydration shock and drought stress treatments: A comparative analysis. J. Exp. Bot. 2007, 58, 229–240. [Google Scholar] [CrossRef] [Green Version]
- Probst, A.V.; Mittelsten Scheid, O. Stress-induced structural changes in plant chromatin. Curr. Opin. Plant Biol. 2015, 27, 8–16. [Google Scholar] [CrossRef] [PubMed] [Green Version]
- Brusslan, J.A.; Bonora, G.; Rus-Canterbury, A.M.; Tariq, F.; Jaroszewicz, A.; Pellegrini, M. A genome-wide chronological study of gene expression and two histone modifications, H3K4me3 and H3K9ac, during developmental leaf senescence. Plant Physiol. 2015, 168, 1246–1261. [Google Scholar] [CrossRef] [Green Version]
- Yan, L.; Zhai, X.; Zhao, Z.; Fan, G. Whole-genome landscape of H3K4me3, H3K36me3 and H3K9ac and their association with gene expression during Paulownia witches’ broom disease infection and recovery processes. 3 Biotech 2020, 10, 336. [Google Scholar] [CrossRef]
- Ueda, M.; Seki, M. Histone Modifications Form Epigenetic Regulatory Networks to Regulate Abiotic Stress Response. Plant Physiol. 2020, 182, 15–26. [Google Scholar] [CrossRef] [PubMed] [Green Version]
- Fang, H.; Liu, X.; Thorn, G.; Duan, J.; Tian, L. Expression analysis of histone acetyltransferases in rice under drought stress. Biochem. Biophys. Res. Commun. 2014, 443, 400–405. [Google Scholar] [CrossRef] [Green Version]
- Temel, A.; Janack, B.; Humbeck, K. Drought Stress-Related Physiological Changes and Histone Modifications in Barley Primary Leaves at HSP17 Gene. Agronomy 2017, 7, 43. [Google Scholar] [CrossRef] [Green Version]
- Manh, M.B.; Ost, C.; Peiter, E.; Hause, B.; Krupinska, K.; Humbeck, K. WHIRLY1 Acts Upstream of ABA-Related Reprogramming of Drought-Induced Gene Expression in Barley and Affects Stress-Related Histone Modifications. Int. J. Mol. Sci. 2023, 24, 6326. [Google Scholar] [CrossRef]
- Ding, Y.; Avramova, Z.; Fromm, M. The Arabidopsis trithorax-like factor ATX1 functions in dehydration stress responses via ABA-dependent and ABA-independent pathways. Plant J. 2011, 66, 735–744. [Google Scholar] [CrossRef] [Green Version]
- Ding, Y.; Avramova, Z.; Fromma, M. Two distinct roles of Arabidopsis homolog of trithorax1 (ATX1) at promoters and within transcribed regions of ATX1-regulated genes. Plant Cell 2011, 23, 350–363. [Google Scholar] [CrossRef] [Green Version]
- Chang, Y.; Zhu, C.; Jiang, J.; Zhang, H.; Zhu, J.; Duan, C. Epigenetic regulation in plant abiotic stress responses. J. Integr. Plant Biol. 2020, 62, 563–580. [Google Scholar] [CrossRef]
- Baldoni, E.; Genga, A.; Cominelli, E. Plant MYB transcription factors: Their role in drought response mechanisms. Int. J. Mol. Sci. 2015, 16, 15811–15851. [Google Scholar] [CrossRef] [Green Version]
- Millar, A.A.; Jacobsen, J.V.; Ross, J.J.; Helliwell, C.A.; Poole, A.T.; Scofield, G.; Reid, J.B.; Gubler, F. Seed dormancy and ABA metabolism in Arabidopsis and barley: The role of ABA 8′-hydroxylase. Plant J. 2006, 45, 942–954. [Google Scholar] [CrossRef]
- Gong, Z.; Yang, S. Drought meets SWEET. Nat. Plants 2022, 8, 25–26. [Google Scholar] [CrossRef] [PubMed]
- Soon, F.F.; Ng, L.M.; Zhou, X.E.; West, G.M.; Kovach, A.; Tan, M.H.E.; Suino-Powell, K.M.; He, Y.; Xu, Y.; Chalmers, M.J.; et al. Molecular mimicry regulates ABA signaling by SnRK2 kinases and PP2C phosphatases. Science 2012, 335, 85–88. [Google Scholar] [CrossRef] [PubMed] [Green Version]
- Brownell, J.E.; Allis, C.D. Special HATs for special occasions: Linking histone acetylation to chromatin assembly and gene activation. Curr. Opin. Genet. Dev. 1996, 6, 176–184. [Google Scholar] [CrossRef] [PubMed]
- Tian, L.; Fong, M.P.; Wang, J.J.; Wei, N.E.; Jiang, H.; Doerge, R.W.; Chen, Z.J. Reversible histone acetylation and deacetylation mediate genome-wide, promoter-dependent and locus-specific changes in gene expression during plant development. Genetics 2005, 169, 337–345. [Google Scholar] [CrossRef] [Green Version]
- Zhou, J.; Wang, X.; He, K.; Charron, J.B.F.; Elling, A.A.; Deng, X.W. Genome-wide profiling of histone H3 lysine 9 acetylation and dimethylation in arabidopsis reveals correlation between multiple histone marks and gene expression. Plant Mol. Biol. 2010, 72, 585–595. [Google Scholar] [CrossRef] [PubMed]
- He, Z.; Wu, J.; Sun, X.; Dai, M. The Maize Clade A PP2C Phosphatases Play Critical Roles in Multiple Abiotic Stress Responses. Int. J. Mol. Sci. 2019, 20, 3573. [Google Scholar] [CrossRef] [Green Version]
- Xiang, Y.; Sun, X.; Gao, S.; Qin, F.; Dai, M. Deletion of an Endoplasmic Reticulum Stress Response Element in a ZmPP2C-A Gene Facilitates Drought Tolerance of Maize Seedlings. Mol. Plant 2017, 10, 456–469. [Google Scholar] [CrossRef] [Green Version]
- Singh, A.; Pandey, A.; Srivastava, A.K.; Tran, L.-S.S.P.; Pandey, G.K. Plant protein phosphatases 2C: From genomic diversity to functional multiplicity and importance in stress management. Crit. Rev. Biotechnol. 2016, 36, 1023–1035. [Google Scholar] [CrossRef]
- Fuchs, S.; Grill, E.; Meskiene, I.; Schweighofer, A. Type 2C protein phosphatases in plants. FEBS J. 2013, 280, 681–693. [Google Scholar] [CrossRef] [PubMed]
- Szostkiewicz, I.; Richter, K.; Kepka, M.; Demmel, S.; Ma, Y.; Korte, A.; Assaad, F.F.; Christmann, A.; Grill, E. Closely related receptor complexes differ in their ABA selectivity and sensitivity. Plant J. 2010, 61, 25–35. [Google Scholar] [CrossRef] [PubMed]
- Chan, Z. Expression profiling of ABA pathway transcripts indicates crosstalk between abiotic and biotic stress responses in Arabidopsis. Genomics 2012, 100, 110–115. [Google Scholar] [CrossRef] [PubMed] [Green Version]
- Seiler, C.; Harshavardhan, V.T.; Reddy, P.S.; Hensel, G.; Kumlehn, J.; Eschen-lippold, L.; Rajesh, K.; Korzun, V.; Wobus, U.; Lee, J.; et al. Abscisic acid flux alterations result in differential abscisic acid signaling responses and impact assimilation efficiency in barley under terminal drought stress. Plant Physiol. 2014, 164, 1677–1696. [Google Scholar] [CrossRef]
- Singh, A.; Jha, S.K.; Bagri, J.; Pandey, G.K. ABA inducible rice protein phosphatase 2C confers ABA insensitivity and abiotic stress tolerance in arabidopsis. PLoS ONE 2015, 10, e0125168. [Google Scholar] [CrossRef] [PubMed] [Green Version]
- Chomczynski, P.; Mackey, K. Short Technical Reports. Modification of the TRI Reagent Procedure for Isolation of RNA from Polysaccharide- and Proteoglycan-Rich Sources. Biotechniques 1995, 19, 942–945. [Google Scholar]
- Pfaffl, M.W. Relative expression software tool (REST(C)) for group-wise comparison and statistical analysis of relative expression results in real-time PCR. Nucleic Acids Res. 2002, 30, e36. [Google Scholar] [CrossRef]
- Ay, N.; Janack, B.; Fischer, A.; Reuter, G.; Humbeck, K. Alterations of histone modifications at the senescence-associated gene HvS40 in barley during senescence. Plant Mol. Biol. 2015, 89, 127–141. [Google Scholar] [CrossRef]
- Andrews, S. FastQC: A Quality Control Tool for High Throughput Sequence Data. 2010. Available online: http://www.bioinformatics.babraham.ac.uk/projects/fastqc (accessed on 1 January 2018).
- Li, H.; Durbin, R. Fast and accurate long-read alignment with Burrows-Wheeler transform. Bioinformatics 2010, 26, 589–595. [Google Scholar] [CrossRef] [Green Version]
- Li, H. Aligning sequence reads, clone sequences and assembly contigs with BWA-MEM. arXiv 2013, arXiv:1303.3997. [Google Scholar]
- Zhang, Y.; Liu, T.; Meyer, C.A.; Eeckhoute, J.; Johnson, D.S.; Bernstein, B.E.; Nusbaum, C.; Myers, R.M.; Brown, M.; Li, W.; et al. Model-based Analysis of ChIP-Seq (MACS). Genome Biol. 2008, 9, R137. [Google Scholar] [CrossRef] [PubMed] [Green Version]
- Afgan, E.; Baker, D.; Batut, B.; Van Den Beek, M.; Bouvier, D.; Ech, M.; Chilton, J.; Clements, D.; Coraor, N.; Grüning, B.A.; et al. The Galaxy platform for accessible, reproducible and collaborative biomedical analyses: 2018 update. Nucleic Acids Res. 2018, 46, W537–W544. [Google Scholar] [CrossRef] [PubMed] [Green Version]
- Kent, W.J.; Sugnet, C.W.; Furey, T.S.; Roskin, K.M.; Pringle, T.H.; Zahler, A.M.; Haussler, D. The Human Genome Browser at UCSC. Genome Res. 2002, 12, 996–1006. [Google Scholar] [CrossRef] [PubMed] [Green Version]
- Robinson, J.T.; Thorvaldsdóttir, H.; Winckler, W.; Guttman, M.; Lander, E.S.; Getz, G.; Mesirov, J.P. Integrative genomics viewer. Nat. Biotechnol. 2011, 29, 24–26. [Google Scholar] [CrossRef] [PubMed] [Green Version]
- Ramírez, F.; Dündar, F.; Diehl, S.; Grüning, B.A.; Manke, T. deepTools: A flexible platform for exploring deep-sequencing data. Nucleic Acids Res. 2014, 42, W187–W191. [Google Scholar] [CrossRef] [PubMed] [Green Version]
- Stark, R.; Brown, G. DiffBind: Differential Binding Analysis of ChIP-Seq Peak Data. 2011. Available online: http://bioconductor.org/packages/release/bioc/vignettes/DiffBind/inst/doc/DiffBind.pdf (accessed on 1 November 2022).
- Solomon, E.R.; Caldwell, K.K.; Allan, A.M. A novel method for the normalization of ChIP-qPCR data. MethodsX 2021, 8, 101504. [Google Scholar] [CrossRef] [PubMed]
- Bray, N.L.; Pimentel, H.; Melsted, P.; Pachter, L. Near-optimal probabilistic RNA-seq quantification. Nat. Biotechnol. 2016, 34, 525–527. [Google Scholar] [CrossRef]
- R Core Team. R: A Language and Environment for Statistical Computing; R Foundation for Statistical Computing: Vienna, Austria, 2014; Available online: http://www.r-project.org/ (accessed on 1 February 2018).
- Robinson, M.D.; McCarthy, D.J.; Smyth, G.K. edgeR: A Bioconductor package for differential expression analysis of digital gene expression data. Bioinformatics 2010, 26, 139–140. [Google Scholar] [CrossRef] [PubMed] [Green Version]
- Ritchie, M.E.; Phipson, B.; Wu, D.; Hu, Y.; Law, C.W.; Shi, W.; Smyth, G.K. limma powers differential expression analyses for RNA-sequencing and microarray studies. Nucleic Acids Res. 2015, 43, e47. [Google Scholar] [CrossRef] [Green Version]


Disclaimer/Publisher’s Note: The statements, opinions and data contained in all publications are solely those of the individual author(s) and contributor(s) and not of MDPI and/or the editor(s). MDPI and/or the editor(s) disclaim responsibility for any injury to people or property resulting from any ideas, methods, instructions or products referred to in the content. |
© 2023 by the authors. Licensee MDPI, Basel, Switzerland. This article is an open access article distributed under the terms and conditions of the Creative Commons Attribution (CC BY) license (https://creativecommons.org/licenses/by/4.0/).
Share and Cite
Ost, C.; Cao, H.X.; Nguyen, T.L.; Himmelbach, A.; Mascher, M.; Stein, N.; Humbeck, K. Drought-Stress-Related Reprogramming of Gene Expression in Barley Involves Differential Histone Modifications at ABA-Related Genes. Int. J. Mol. Sci. 2023, 24, 12065. https://doi.org/10.3390/ijms241512065
Ost C, Cao HX, Nguyen TL, Himmelbach A, Mascher M, Stein N, Humbeck K. Drought-Stress-Related Reprogramming of Gene Expression in Barley Involves Differential Histone Modifications at ABA-Related Genes. International Journal of Molecular Sciences. 2023; 24(15):12065. https://doi.org/10.3390/ijms241512065
Chicago/Turabian StyleOst, Charlotte, Hieu Xuan Cao, Thuy Linh Nguyen, Axel Himmelbach, Martin Mascher, Nils Stein, and Klaus Humbeck. 2023. "Drought-Stress-Related Reprogramming of Gene Expression in Barley Involves Differential Histone Modifications at ABA-Related Genes" International Journal of Molecular Sciences 24, no. 15: 12065. https://doi.org/10.3390/ijms241512065