

Structural Insights into the Giardia lamblia Target of Rapamycin Homolog: A Bioinformatics Approach
 , , and
Abstract
:1. Introduction
2. Results and Discussion
2.1. GTOR, a TOR-like Protein Encoded by G. lamblia
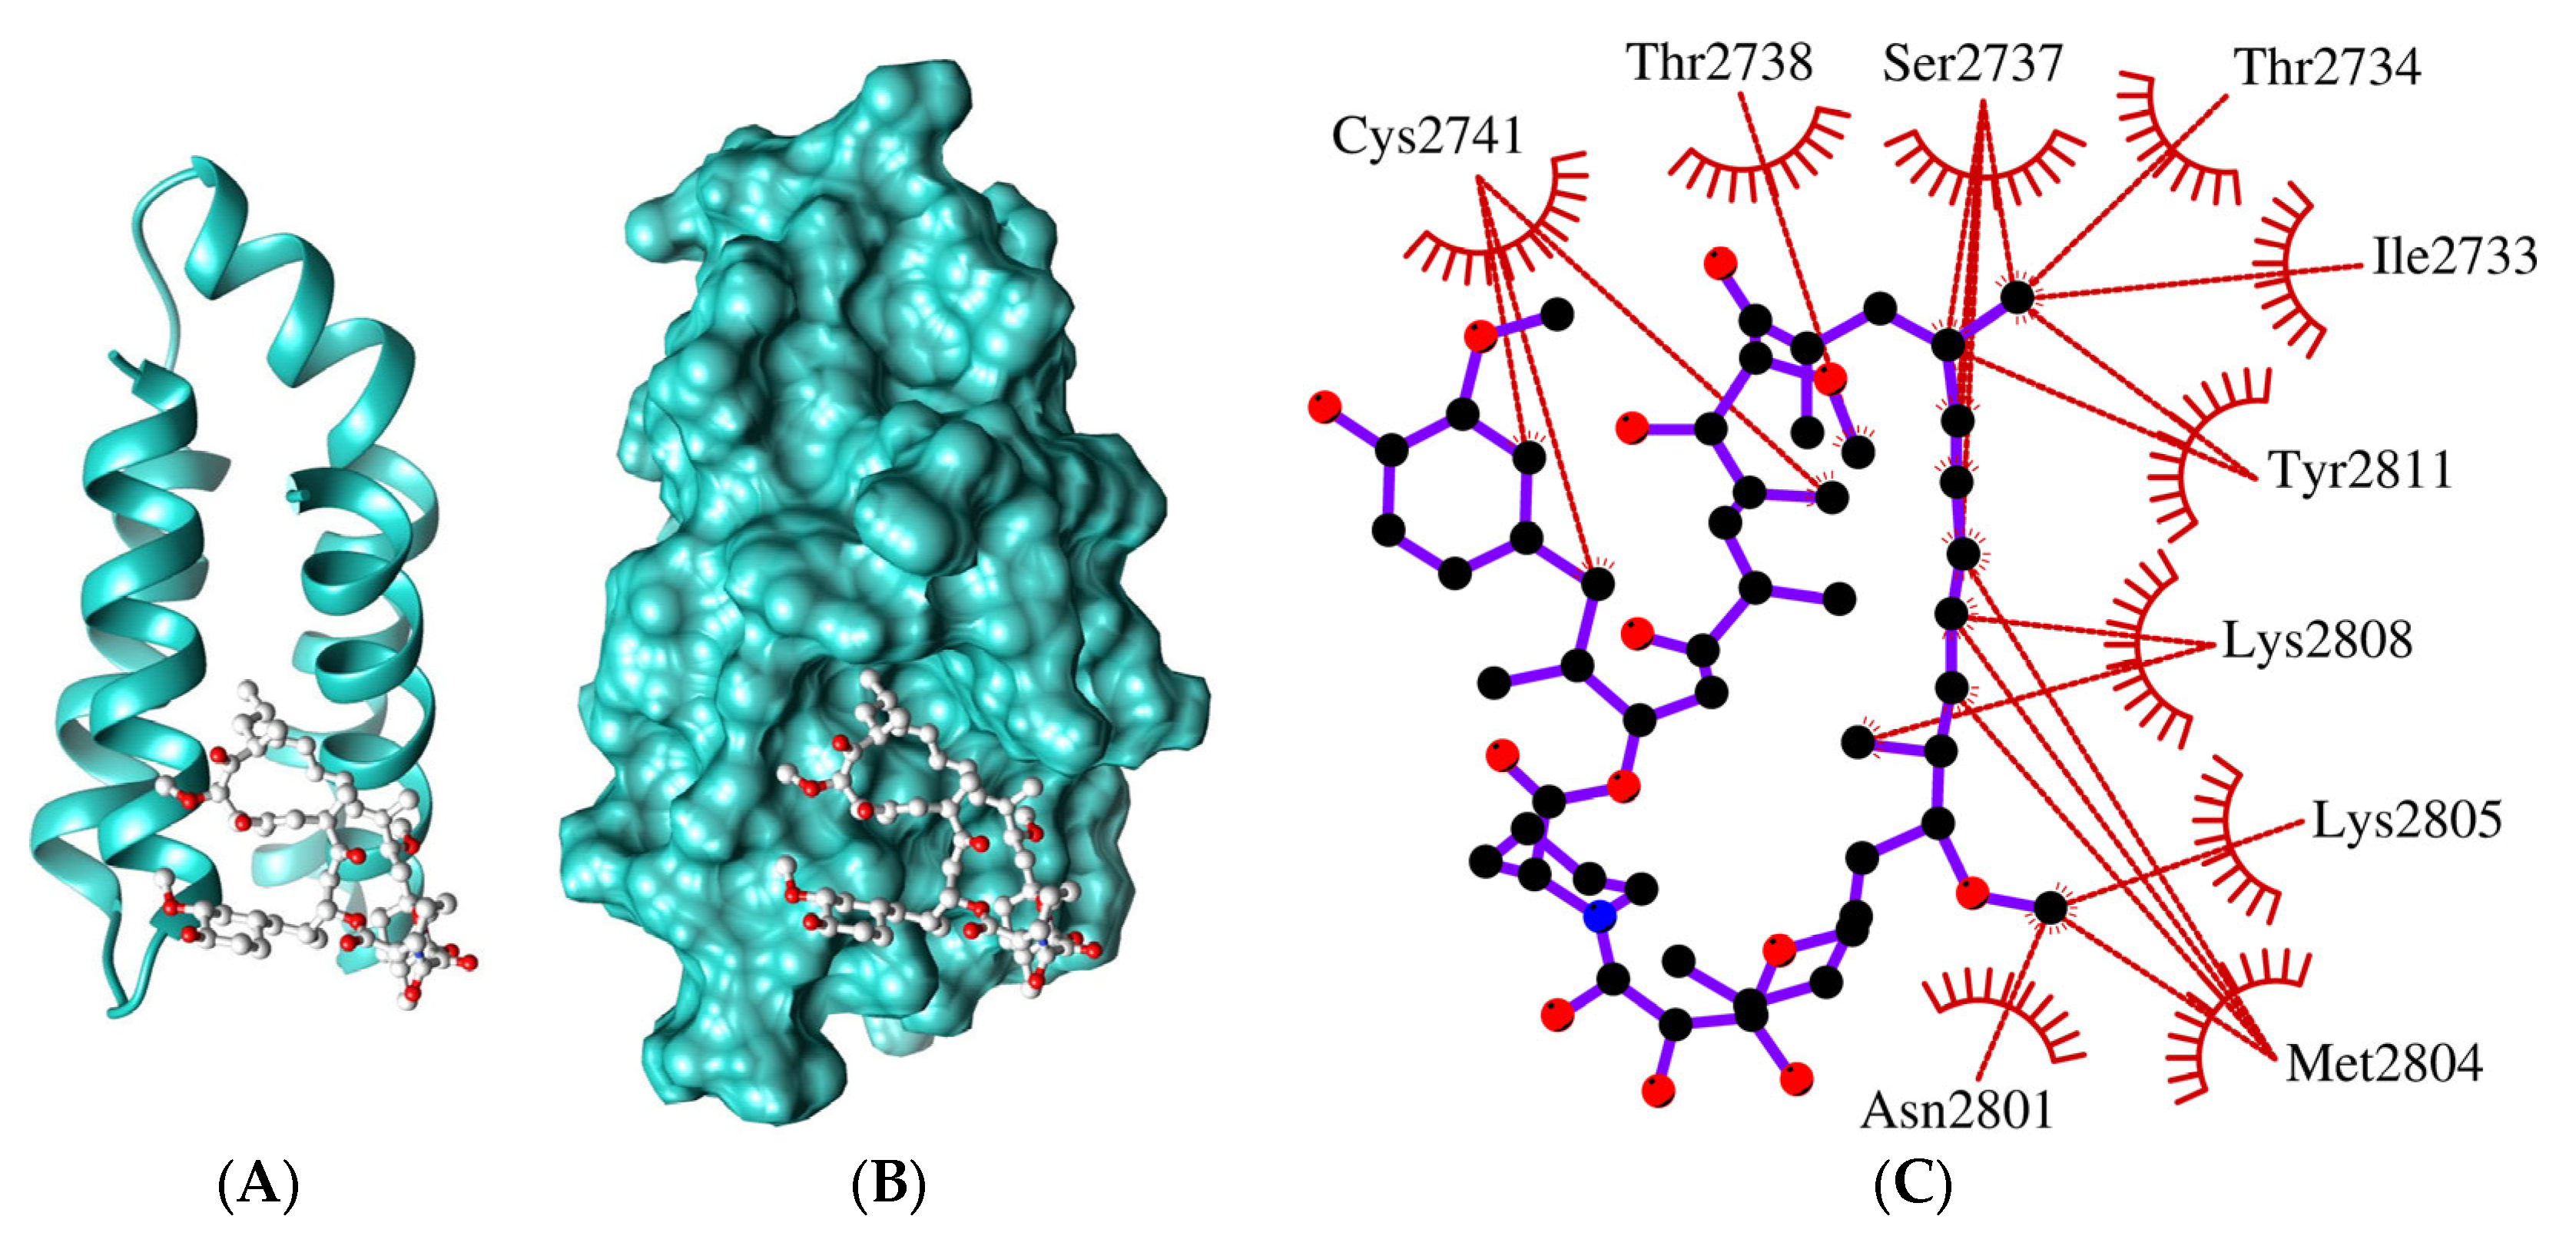
2.2. The FRB Domain of GTOR Has Relevant Features
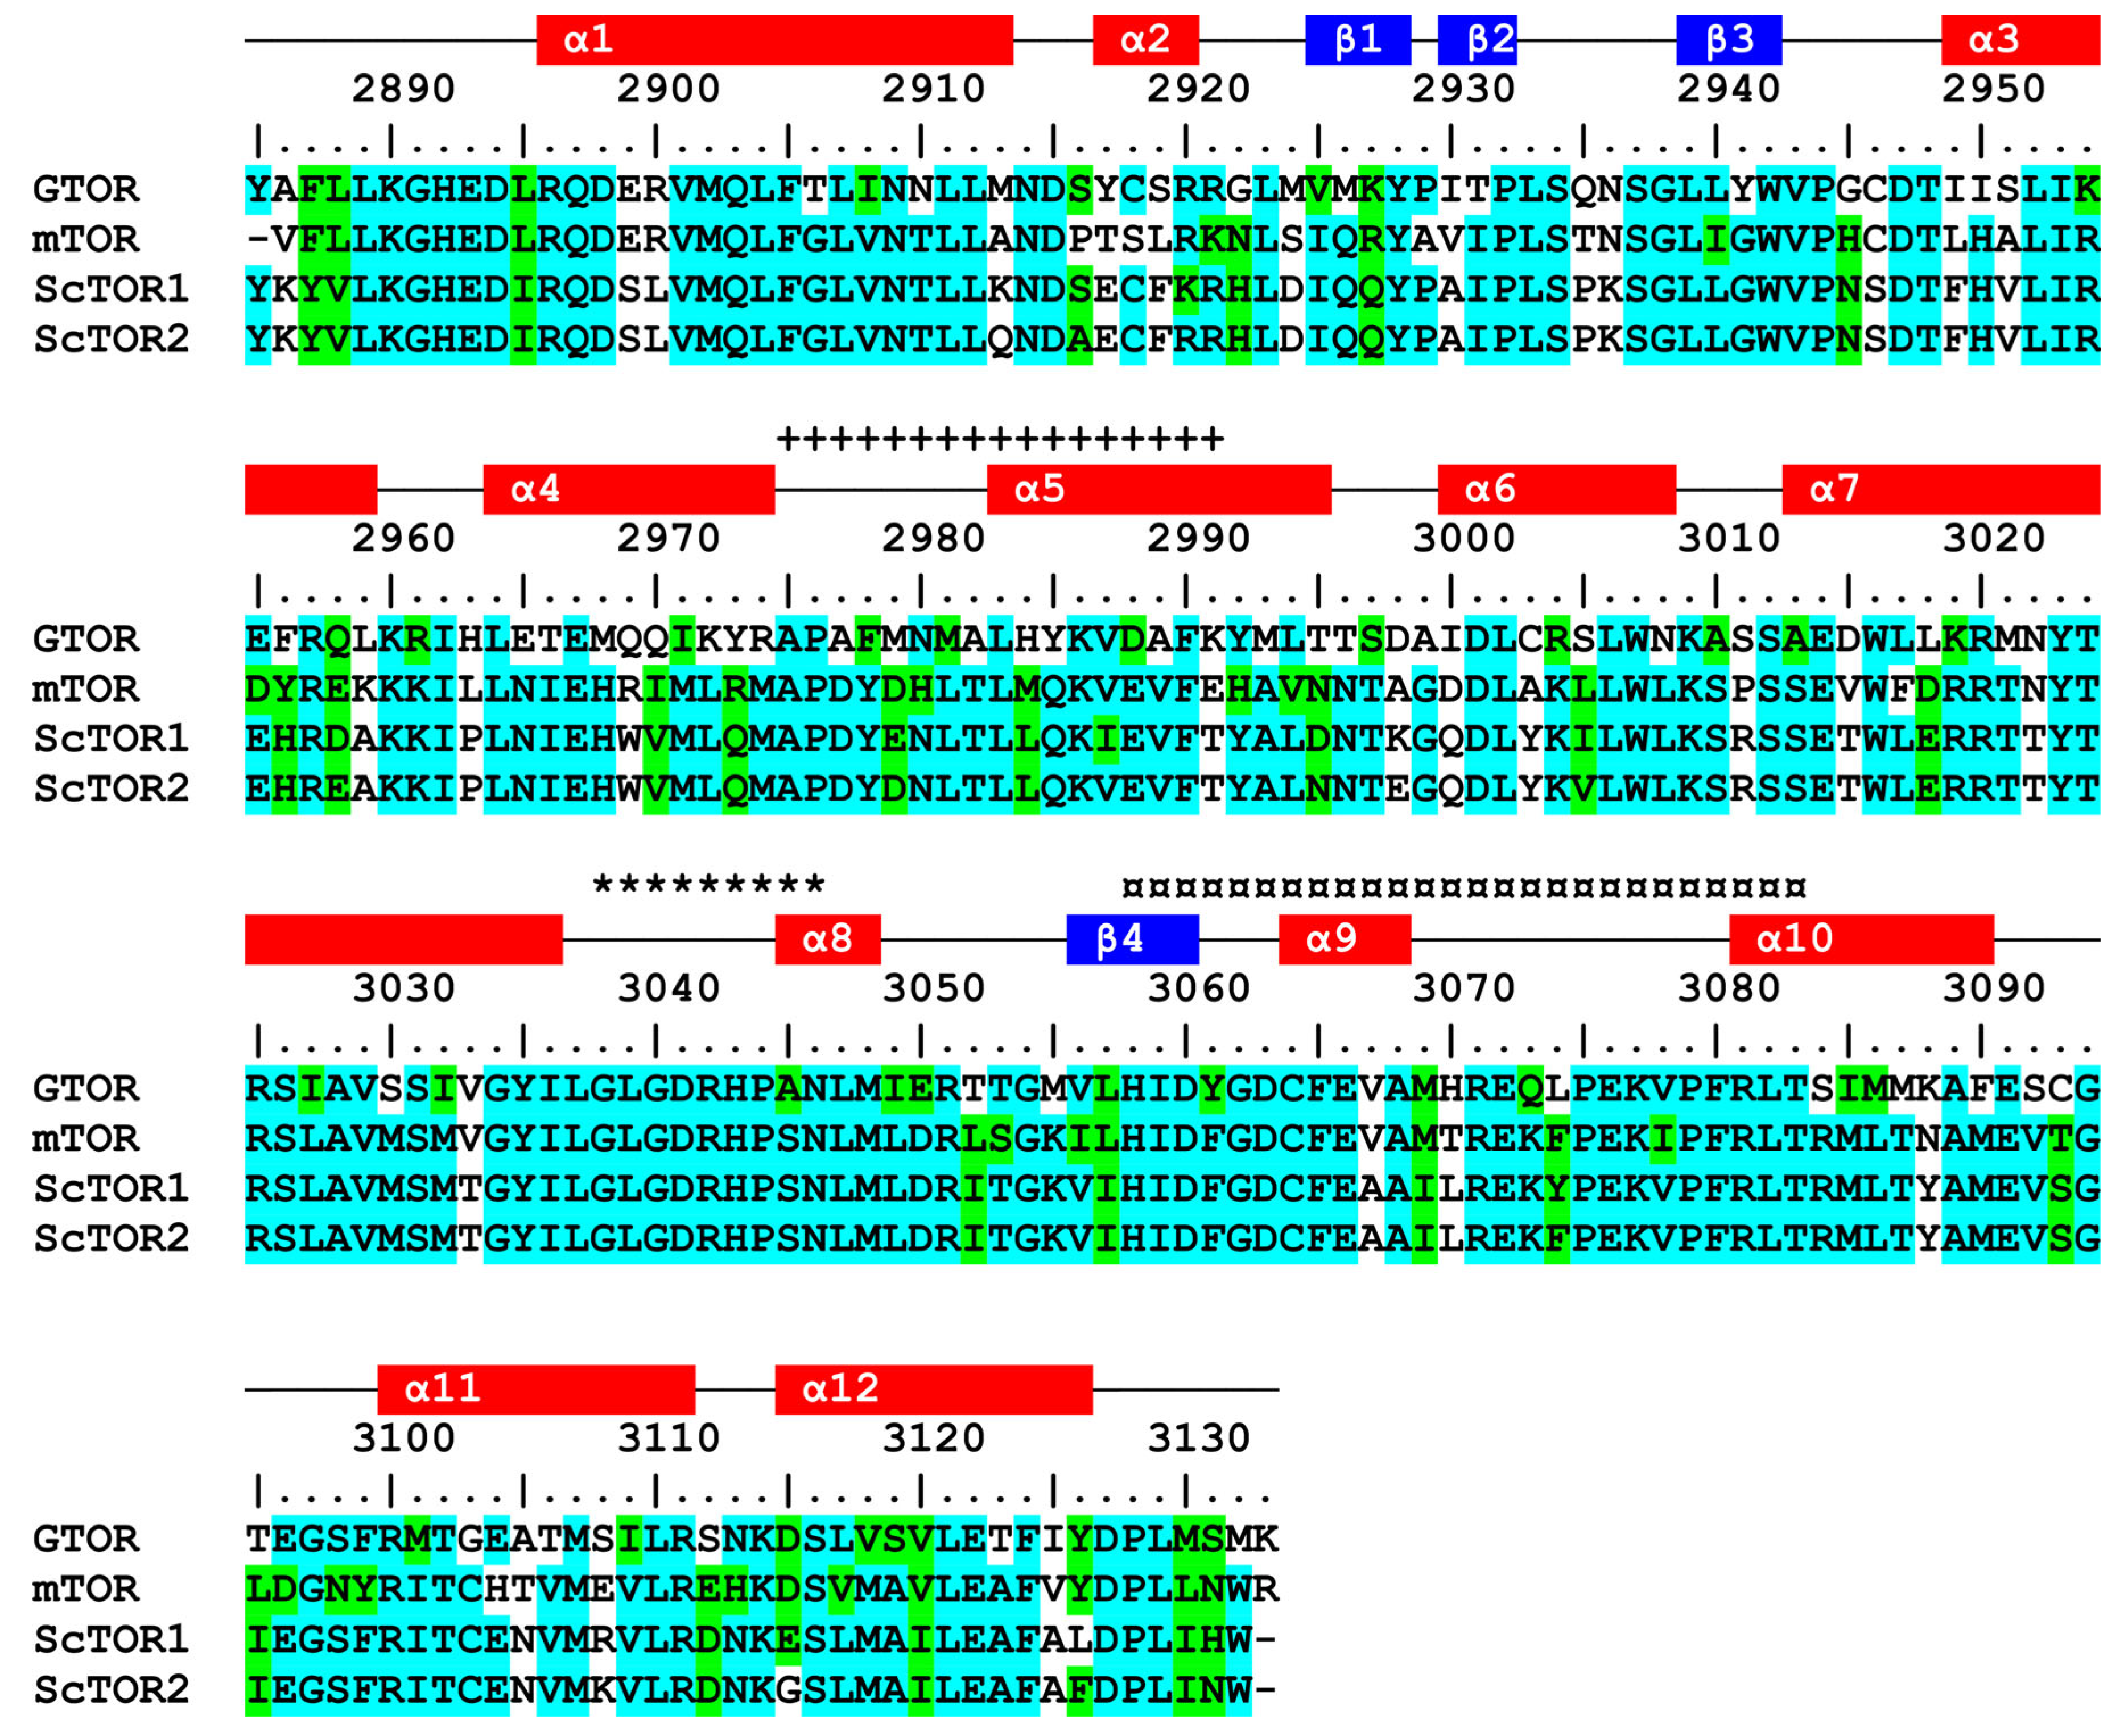
2.3. GTOR Contains a Conserved PIKKc Domain
2.4. GTOR Participates in PPI Networks
2.5. TORC1 and TORC2 in G. lamblia: In Silico Identification
2.6. Final Remark: Is GTOR a Promising Drug Target?
3. Materials and Methods
3.1. Primary and Secondary Structure Analysis
3.2. General Approach for the Modeling and Validation of 3D Protein Structures
3.3. Homology-Based Modeling of the FRB and PIKKc Domains
3.4. Bioinformatic Analysis of the Rapamycin Binding Site
3.5. In Silico Prediction of Protein–Protein Interactions
Author Contributions
Funding
Institutional Review Board Statement
Informed Consent Statement
Data Availability Statement
Conflicts of Interest
References
- Inoki, K.; Ouyang, H.; Li, Y.; Guan, K.-L. Signaling by Target of Rapamycin Proteins in Cell Growth Control. Microbiol. Mol. Biol. Rev. 2005, 69, 79–100. [Google Scholar] [CrossRef] [PubMed] [Green Version]
- Laplante, M.; Sabatini, D.M. MTOR Signaling in Growth Control and Disease. Cell 2012, 149, 274–293. [Google Scholar] [CrossRef] [Green Version]
- Loewith, R.; Hall, M.N. Target of Rapamycin (TOR) in Nutrient Signaling and Growth Control. Genetics 2011, 189, 1177–1201. [Google Scholar] [CrossRef] [Green Version]
- Chiu, M.I.; Katz, H.; Berlin, V. RAPT1, a Mammalian Homolog of Yeast Tor, Interacts with the FKBP12/Rapamycin Complex. Proc. Natl. Acad. Sci. USA 1994, 91, 12574–12578. [Google Scholar] [CrossRef]
- Choi, J.; Chen, J.; Schreiber, S.L.; Clardy, J. Structure of the FKBP12-Rapamycin Complex Interacting with Binding Domain of Human FRAP. Science 1996, 273, 239–242. [Google Scholar] [CrossRef]
- Banaszynski, L.A.; Liu, C.W.; Wandless, T.J. Characterization of the FKBP·Rapamycin·FRB Ternary Complex. J. Am. Chem. Soc. 2005, 127, 4715–4721. [Google Scholar] [CrossRef] [PubMed]
- Zaza, G.; Granata, S.; Caletti, C.; Signorini, L.; Stallone, G.; Lupo, A. MTOR Inhibition Role in Cellular Mechanisms. Transplantation 2018, 102, S3–S16. [Google Scholar] [CrossRef] [PubMed]
- Ryan, U.; Hijjawi, N.; Feng, Y.; Xiao, L. Giardia: An under-Reported Foodborne Parasite. Int. J. Parasitol. 2019, 49, 1–11. [Google Scholar] [CrossRef]
- Hajare, S.T.; Chekol, Y.; Chauhan, N.M. Assessment of Prevalence of Giardia lamblia Infection and Its Associated Factors among Government Elementary School Children from Sidama Zone, SNNPR, Ethiopia. PLoS ONE 2022, 17, e0264812. [Google Scholar] [CrossRef]
- Rumsey, P.; Waseem, M. Giardia lamblia Enteritis. In StatPearls; StatPearls Publishing: Treasure Island, FL, USA, 2022. [Google Scholar]
- Waldram, A.; Vivancos, R.; Hartley, C.; Lamden, K. Prevalence of Giardia Infection in Households of Giardia Cases and Risk Factors for Household Transmission. BMC Infect. Dis. 2017, 17, 486. [Google Scholar] [CrossRef] [Green Version]
- Savioli, L.; Smith, H.; Thompson, A. Giardia and Cryptosporidium Join the ‘Neglected Diseases Initiative’. Trends Parasitol. 2006, 22, 203–208. [Google Scholar] [CrossRef]
- Solaymani-Mohammadi, S.; Genkinger, J.M.; Loffredo, C.A.; Singer, S.M. A Meta-Analysis of the Effectiveness of Albendazole Compared with Metronidazole as Treatments for Infections with Giardia duodenalis. PLoS Negl. Trop. Dis. 2010, 4, e682. [Google Scholar] [CrossRef] [PubMed] [Green Version]
- Granados, C.E.; Reveiz, L.; Uribe, L.G.; Criollo, C.P. Drugs for Treating Giardiasis. Cochrane Database Syst. Rev. 2012. [Google Scholar] [CrossRef]
- Lalle, M.; Hanevik, K. Treatment-Refractory Giardiasis: Challenges and Solutions. Infect. Drug Resist. 2018, 11, 1921–1933. [Google Scholar] [CrossRef] [PubMed] [Green Version]
- Fantinatti, M.; Lopes-Oliveira, L.A.P.; Cascais-Figueredo, T.; Austriaco-Teixeira, P.; Verissimo, E.; Bello, A.R.; Da-Cruz, A.M. Recirculation of Giardia lamblia Assemblage A After Metronidazole Treatment in an Area With Assemblages A, B, and E Sympatric Circulation. Front. Microbiol. 2020, 11, 571104. [Google Scholar] [CrossRef]
- Upcroft, P.; Upcroft, J.A. Drug Targets and Mechanisms of Resistance in the Anaerobic Protozoa. Clin. Microbiol. Rev. 2001, 14, 150–164. [Google Scholar] [CrossRef] [PubMed] [Green Version]
- Lynch, S.V.; Wiener-Kronish, J.P. Novel Strategies to Combat Bacterial Virulence: Curr. Opin. Crit. Care 2008, 14, 593–599. [Google Scholar] [CrossRef] [Green Version]
- De Rycker, M.; Wyllie, S.; Horn, D.; Read, K.D.; Gilbert, I.H. Author Correction: Anti-Trypanosomatid Drug Discovery: Progress and Challenges. Nat. Rev. Microbiol. 2022, 20, 702. [Google Scholar] [CrossRef] [PubMed]
- Maegawa, K.; Takii, R.; Ushimaru, T.; Kozaki, A. Evolutionary Conservation of TORC1 Components, TOR, Raptor, and LST8, between Rice and Yeast. Mol. Genet. Genom. 2015, 290, 2019–2030. [Google Scholar] [CrossRef] [Green Version]
- Liu, W.; Xie, Y.; Ma, J.; Luo, X.; Nie, P.; Zuo, Z.; Lahrmann, U.; Zhao, Q.; Zheng, Y.; Zhao, Y.; et al. IBS: An Illustrator for the Presentation and Visualization of Biological Sequences. Bioinformatics 2015, 31, 3359–3361. [Google Scholar] [CrossRef] [Green Version]
- Chen, J.; Zheng, X.F.; Brown, E.J.; Schreiber, S.L. Identification of an 11-KDa FKBP12-Rapamycin-Binding Domain within the 289-KDa FKBP12-Rapamycin-Associated Protein and Characterization of a Critical Serine Residue. Proc. Natl. Acad. Sci. USA 1995, 92, 4947–4951. [Google Scholar] [CrossRef]
- Yang, H.; Rudge, D.G.; Koos, J.D.; Vaidialingam, B.; Yang, H.J.; Pavletich, N.P. MTOR Kinase Structure, Mechanism and Regulation. Nature 2013, 497, 217–223. [Google Scholar] [CrossRef] [Green Version]
- Veverka, V.; Crabbe, T.; Bird, I.; Lennie, G.; Muskett, F.W.; Taylor, R.J.; Carr, M.D. Structural Characterization of the Interaction of MTOR with Phosphatidic Acid and a Novel Class of Inhibitor: Compelling Evidence for a Central Role of the FRB Domain in Small Molecule-Mediated Regulation of MTOR. Oncogene 2008, 27, 585–595. [Google Scholar] [CrossRef] [Green Version]
- Feldman, M.E.; Shokat, K.M. New Inhibitors of the PI3K-Akt-MTOR Pathway: Insights into MTOR Signaling from a New Generation of Tor Kinase Domain Inhibitors (TORKinibs). In Phosphoinositide 3-Kinase in Health and Disease; Rommel, C., Vanhaesebroeck, B., Vogt, P.K., Eds.; Current Topics in Microbiology and Immunology; Springer: Berlin/Heidelberg, Germany, 2010; Volume 347, pp. 241–262. ISBN 978-3-642-14815-6. [Google Scholar]
- Waldner, M.; Fantus, D.; Solari, M.; Thomson, A.W. New Perspectives on MTOR Inhibitors (Rapamycin, Rapalogs and TORKinibs) in Transplantation: MTOR Complex Inhibition in Transplantation. Br. J. Clin. Pharmacol. 2016, 82, 1158–1170. [Google Scholar] [CrossRef] [PubMed] [Green Version]
- Ali, E.S.; Mitra, K.; Akter, S.; Ramproshad, S.; Mondal, B.; Khan, I.N.; Islam, M.T.; Sharifi-Rad, J.; Calina, D.; Cho, W.C. Recent Advances and Limitations of MTOR Inhibitors in the Treatment of Cancer. Cancer Cell Int. 2022, 22, 284. [Google Scholar] [CrossRef] [PubMed]
- Peng, Y.; Wang, Y.; Zhou, C.; Mei, W.; Zeng, C. PI3K/Akt/MTOR Pathway and Its Role in Cancer Therapeutics: Are We Making Headway? Front. Oncol. 2022, 12, 819128. [Google Scholar] [CrossRef] [PubMed]
- Wu, X.; Xu, Y.; Liang, Q.; Yang, X.; Huang, J.; Wang, J.; Zhang, H.; Shi, J. Recent Advances in Dual PI3K/MTOR Inhibitors for Tumour Treatment. Front. Pharmacol. 2022, 13, 875372. [Google Scholar] [CrossRef] [PubMed]
- Bell, A.; Monaghan, P.; Page, A.P. Peptidyl-Prolyl Cis–Trans Isomerases (Immunophilins) and Their Roles in Parasite Biochemistry, Host–Parasite Interaction and Antiparasitic Drug Action. Int. J. Parasitol. 2006, 36, 261–276. [Google Scholar] [CrossRef] [Green Version]
- Dunyak, B.M.; Gestwicki, J.E. Peptidyl-Proline Isomerases (PPIases): Targets for Natural Products and Natural Product-Inspired Compounds: Miniperspective. J. Med. Chem. 2016, 59, 9622–9644. [Google Scholar] [CrossRef] [PubMed] [Green Version]
- Saxton, R.A.; Sabatini, D.M. MTOR Signaling in Growth, Metabolism, and Disease. Cell 2017, 168, 960–976. [Google Scholar] [CrossRef] [Green Version]
- Proud, C.G. MTOR Signalling in Health and Disease. Biochem. Soc. Trans. 2011, 39, 431–436. [Google Scholar] [CrossRef]
- Eltschinger, S.; Loewith, R. TOR Complexes and the Maintenance of Cellular Homeostasis. Trends Cell Biol. 2016, 26, 148–159. [Google Scholar] [CrossRef]
- Gonzalez, S.; Rallis, C. The TOR Signaling Pathway in Spatial and Temporal Control of Cell Size and Growth. Front. Cell Dev. Biol. 2017, 5, 61. [Google Scholar] [CrossRef] [PubMed] [Green Version]
- Conciatori, F.; Ciuffreda, L.; Bazzichetto, C.; Falcone, I.; Pilotto, S.; Bria, E.; Cognetti, F.; Milella, M. MTOR Cross-Talk in Cancer and Potential for Combination Therapy. Cancers 2018, 10, 23. [Google Scholar] [CrossRef]
- Tafur, L.; Kefauver, J.; Loewith, R. Structural Insights into TOR Signaling. Genes 2020, 11, 885. [Google Scholar] [CrossRef]
- Zou, Z.; Tao, T.; Li, H.; Zhu, X. MTOR Signaling Pathway and MTOR Inhibitors in Cancer: Progress and Challenges. Cell Biosci. 2020, 10, 31. [Google Scholar] [CrossRef] [Green Version]
- Mao, B.; Zhang, Q.; Ma, L.; Zhao, D.-S.; Zhao, P.; Yan, P. Overview of Research into MTOR Inhibitors. Molecules 2022, 27, 5295. [Google Scholar] [CrossRef] [PubMed]
- Yu, J.J.; Goncharova, E.A. MTOR Signaling Network in Cell Biology and Human Disease. Int. J. Mol. Sci. 2022, 23, 16142. [Google Scholar] [CrossRef]
- Wu, J.-H.; Tung, S.-Y.; Ho, C.-C.; Su, L.-H.; Gan, S.-W.; Liao, J.-Y.; Cho, C.-C.; Lin, B.-C.; Chiu, P.-W.; Pan, Y.-J.; et al. A Myeloid Leukemia Factor Homolog Involved in Encystation-Induced Protein Metabolism in Giardia lamblia. Biochim. Biophys. Acta BBA—Gen. Subj. 2021, 1865, 129859. [Google Scholar] [CrossRef] [PubMed]
- The UniProt Consortium; Bateman, A.; Martin, M.-J.; Orchard, S.; Magrane, M.; Agivetova, R.; Ahmad, S.; Alpi, E.; Bowler-Barnett, E.H.; Britto, R.; et al. UniProt: The Universal Protein Knowledgebase in 2021. Nucleic Acids Res. 2021, 49, D480–D489. [Google Scholar] [CrossRef]
- Duvaud, S.; Gabella, C.; Lisacek, F.; Stockinger, H.; Ioannidis, V.; Durinx, C. Expasy, the Swiss Bioinformatics Resource Portal, as Designed by Its Users. Nucleic Acids Res. 2021, 49, W216–W227. [Google Scholar] [CrossRef] [PubMed]
- Sigrist, C.J.A. PROSITE: A Documented Database Using Patterns and Profiles as Motif Descriptors. Brief. Bioinform. 2002, 3, 265–274. [Google Scholar] [CrossRef] [PubMed]
- De Castro, E.; Sigrist, C.J.A.; Gattiker, A.; Bulliard, V.; Langendijk-Genevaux, P.S.; Gasteiger, E.; Bairoch, A.; Hulo, N. ScanProsite: Detection of PROSITE Signature Matches and ProRule-Associated Functional and Structural Residues in Proteins. Nucleic Acids Res. 2006, 34, W362–W365. [Google Scholar] [CrossRef]
- Sigrist, C.J.A.; de Castro, E.; Cerutti, L.; Cuche, B.A.; Hulo, N.; Bridge, A.; Bougueleret, L.; Xenarios, I. New and Continuing Developments at PROSITE. Nucleic Acids Res. 2012, 41, D344–D347. [Google Scholar] [CrossRef] [Green Version]
- Andrade, M.A.; Ponting, C.P.; Gibson, T.J.; Bork, P. Homology-Based Method for Identification of Protein Repeats Using Statistical Significance Estimates. J. Mol. Biol. 2000, 298, 521–537. [Google Scholar] [CrossRef]
- Marchler-Bauer, A.; Bryant, S.H. CD-Search: Protein Domain Annotations on the Fly. Nucleic Acids Res. 2004, 32, W327–W331. [Google Scholar] [CrossRef] [PubMed]
- Lu, S.; Wang, J.; Chitsaz, F.; Derbyshire, M.K.; Geer, R.C.; Gonzales, N.R.; Gwadz, M.; Hurwitz, D.I.; Marchler, G.H.; Song, J.S.; et al. CDD/SPARCLE: The Conserved Domain Database in 2020. Nucleic Acids Res. 2020, 48, D265–D268. [Google Scholar] [CrossRef] [Green Version]
- Mistry, J.; Chuguransky, S.; Williams, L.; Qureshi, M.; Salazar, G.A.; Sonnhammer, E.L.L.; Tosatto, S.C.E.; Paladin, L.; Raj, S.; Richardson, L.J.; et al. Pfam: The Protein Families Database in 2021. Nucleic Acids Res. 2021, 49, D412–D419. [Google Scholar] [CrossRef] [PubMed]
- Sievers, F.; Wilm, A.; Dineen, D.; Gibson, T.J.; Karplus, K.; Li, W.; Lopez, R.; McWilliam, H.; Remmert, M.; Söding, J.; et al. Fast, Scalable Generation of High-quality Protein Multiple Sequence Alignments Using Clustal Omega. Mol. Syst. Biol. 2011, 7, 539. [Google Scholar] [CrossRef]
- Zimmermann, L.; Stephens, A.; Nam, S.-Z.; Rau, D.; Kübler, J.; Lozajic, M.; Gabler, F.; Söding, J.; Lupas, A.N.; Alva, V. A Completely Reimplemented MPI Bioinformatics Toolkit with a New HHpred Server at Its Core. J. Mol. Biol. 2018, 430, 2237–2243. [Google Scholar] [CrossRef]
- Yang, J.; Yan, R.; Roy, A.; Xu, D.; Poisson, J.; Zhang, Y. The I-TASSER Suite: Protein Structure and Function Prediction. Nat. Methods 2015, 12, 7–8. [Google Scholar] [CrossRef] [PubMed] [Green Version]
- Yang, J.; Zhang, Y. I-TASSER Server: New Development for Protein Structure and Function Predictions. Nucleic Acids Res. 2015, 43, W174–W181. [Google Scholar] [CrossRef] [PubMed] [Green Version]
- McGuffin, L.J.; Adiyaman, R.; Maghrabi, A.H.A.; Shuid, A.N.; Brackenridge, D.A.; Nealon, J.O.; Philomina, L.S. IntFOLD: An Integrated Web Resource for High Performance Protein Structure and Function Prediction. Nucleic Acids Res. 2019, 47, W408–W413. [Google Scholar] [CrossRef]
- Yang, Z.; Lasker, K.; Schneidman-Duhovny, D.; Webb, B.; Huang, C.C.; Pettersen, E.F.; Goddard, T.D.; Meng, E.C.; Sali, A.; Ferrin, T.E. UCSF Chimera, MODELLER, and IMP: An Integrated Modeling System. J. Struct. Biol. 2012, 179, 269–278. [Google Scholar] [CrossRef] [PubMed] [Green Version]
- Webb, B.; Sali, A. Protein Structure Modeling with MODELLER. In Functional Genomics; Kaufmann, M., Klinger, C., Savelsbergh, A., Eds.; Methods in Molecular Biology; Humana Press: New York, NY, USA, 2014; Volume 1654, pp. 39–54. [Google Scholar] [CrossRef]
- Jumper, J.; Evans, R.; Pritzel, A.; Green, T.; Figurnov, M.; Ronneberger, O.; Tunyasuvunakool, K.; Bates, R.; Žídek, A.; Potapenko, A.; et al. Highly Accurate Protein Structure Prediction with AlphaFold. Nature 2021, 596, 583–589. [Google Scholar] [CrossRef]
- Guo, H.-B.; Perminov, A.; Bekele, S.; Kedziora, G.; Farajollahi, S.; Varaljay, V.; Hinkle, K.; Molinero, V.; Meister, K.; Hung, C.; et al. AlphaFold2 Models Indicate That Protein Sequence Determines Both Structure and Dynamics. Sci. Rep. 2022, 12, 10696. [Google Scholar] [CrossRef]
- Wlodawer, A. Stereochemistry and Validation of Macromolecular Structures. In Protein Crystallography; Wlodawer, A., Dauter, Z., Jaskolski, M., Eds.; Methods in Molecular Biology; Springer: New York, NY, USA, 2017; Volume 1607, pp. 595–610. ISBN 978-1-4939-6998-2. [Google Scholar]
- Kleywegt, G.J.; Jones, T.A. Phi/Psi-Chology: Ramachandran Revisited. Structure 1996, 4, 1395–1400. [Google Scholar] [CrossRef] [Green Version]
- Davis, I.W.; Leaver-Fay, A.; Chen, V.B.; Block, J.N.; Kapral, G.J.; Wang, X.; Murray, L.W.; Arendall, W.B.; Snoeyink, J.; Richardson, J.S.; et al. MolProbity: All-Atom Contacts and Structure Validation for Proteins and Nucleic Acids. Nucleic Acids Res. 2007, 35, W375–W383. [Google Scholar] [CrossRef] [Green Version]
- Xu, D.; Zhang, Y. Improving the Physical Realism and Structural Accuracy of Protein Models by a Two-Step Atomic-Level Energy Minimization. Biophys. J. 2011, 101, 2525–2534. [Google Scholar] [CrossRef] [Green Version]
- Zhang, J.; Liang, Y.; Zhang, Y. Atomic-Level Protein Structure Refinement Using Fragment-Guided Molecular Dynamics Conformation Sampling. Structure 2011, 19, 1784–1795. [Google Scholar] [CrossRef] [Green Version]
- Laskowski, R.A.; MacArthur, M.W.; Moss, D.S.; Thornton, J.M. PROCHECK: A Program to Check the Stereochemical Quality of Protein Structures. J. Appl. Crystallogr. 1993, 26, 283–291. [Google Scholar] [CrossRef]
- Lüthy, R.; Bowie, J.U.; Eisenberg, D. Assessment of Protein Models with Three-Dimensional Profiles. Nature 1992, 356, 83–85. [Google Scholar] [CrossRef] [PubMed]
- Colovos, C.; Yeates, T.O. Verification of Protein Structures: Patterns of Nonbonded Atomic Interactions. Protein Sci. 1993, 2, 1511–1519. [Google Scholar] [CrossRef] [PubMed] [Green Version]
- Wiederstein, M.; Sippl, M.J. ProSA-Web: Interactive Web Service for the Recognition of Errors in Three-Dimensional Structures of Proteins. Nucleic Acids Res. 2007, 35, W407–W410. [Google Scholar] [CrossRef] [PubMed] [Green Version]
- Chen, V.B.; Arendall, W.B.; Headd, J.J.; Keedy, D.A.; Immormino, R.M.; Kapral, G.J.; Murray, L.W.; Richardson, J.S.; Richardson, D.C. MolProbity: All-Atom Structure Validation for Macromolecular Crystallography. Acta Crystallogr. D Biol. Crystallogr. 2010, 66, 12–21. [Google Scholar] [CrossRef] [Green Version]
- Williams, C.J.; Headd, J.J.; Moriarty, N.W.; Prisant, M.G.; Videau, L.L.; Deis, L.N.; Verma, V.; Keedy, D.A.; Hintze, B.J.; Chen, V.B.; et al. MolProbity: More and Better Reference Data for Improved All-Atom Structure Validation. Protein Sci. 2018, 27, 293–315. [Google Scholar] [CrossRef]
- Pettersen, E.F.; Goddard, T.D.; Huang, C.C.; Couch, G.S.; Greenblatt, D.M.; Meng, E.C.; Ferrin, T.E. UCSF Chimera—A Visualization System for Exploratory Research and Analysis. J. Comput. Chem. 2004, 25, 1605–1612. [Google Scholar] [CrossRef] [Green Version]
- Roche, D.B.; Buenavista, M.T.; McGuffin, L.J. The FunFOLD2 Server for the Prediction of Protein–Ligand Interactions. Nucleic Acids Res. 2013, 41, W303–W307. [Google Scholar] [CrossRef]
- Yang, J.; Roy, A.; Zhang, Y. Protein–Ligand Binding Site Recognition Using Complementary Binding-Specific Substructure Comparison and Sequence Profile Alignment. Bioinformatics 2013, 29, 2588–2595. [Google Scholar] [CrossRef] [Green Version]
- Yang, J.; Roy, A.; Zhang, Y. BioLiP: A Semi-Manually Curated Database for Biologically Relevant Ligand–Protein Interactions. Nucleic Acids Res. 2012, 41, D1096–D1103. [Google Scholar] [CrossRef] [Green Version]
- Jendele, L.; Krivak, R.; Skoda, P.; Novotny, M.; Hoksza, D. PrankWeb: A Web Server for Ligand Binding Site Prediction and Visualization. Nucleic Acids Res. 2019, 47, W345–W349. [Google Scholar] [CrossRef] [PubMed] [Green Version]
- Sehnal, D.; Bittrich, S.; Deshpande, M.; Svobodová, R.; Berka, K.; Bazgier, V.; Velankar, S.; Burley, S.K.; Koča, J.; Rose, A.S. Mol* Viewer: Modern Web App for 3D Visualization and Analysis of Large Biomolecular Structures. Nucleic Acids Res. 2021, 49, W431–W437. [Google Scholar] [CrossRef] [PubMed]
- Wallace, A.C.; Laskowski, R.A.; Thornton, J.M. LIGPLOT: A Program to Generate Schematic Diagrams of Protein-Ligand Interactions. Protein Eng. Des. Sel. 1995, 8, 127–134. [Google Scholar] [CrossRef] [PubMed]
- Laskowski, R.A.; Swindells, M.B. LigPlot+: Multiple Ligand–Protein Interaction Diagrams for Drug Discovery. J. Chem. Inf. Model. 2011, 51, 2778–2786. [Google Scholar] [CrossRef]
- Adasme, M.F.; Linnemann, K.L.; Bolz, S.N.; Kaiser, F.; Salentin, S.; Haupt, V.J.; Schroeder, M. PLIP 2021: Expanding the Scope of the Protein–Ligand Interaction Profiler to DNA and RNA. Nucleic Acids Res. 2021, 49, W530–W534. [Google Scholar] [CrossRef] [PubMed]
- Von Mering, C.; Huynen, M.; Jaeggi, D.; Schmidt, S.; Bork, P.; Snel, B. STRING: A Database of Predicted Functional Associations between Proteins. Nucleic Acids Res. 2003, 31, 258–261. [Google Scholar] [CrossRef] [PubMed]
- Szklarczyk, D.; Gable, A.L.; Lyon, D.; Junge, A.; Wyder, S.; Huerta-Cepas, J.; Simonovic, M.; Doncheva, N.T.; Morris, J.H.; Bork, P.; et al. STRING V11: Protein–Protein Association Networks with Increased Coverage, Supporting Functional Discovery in Genome-Wide Experimental Datasets. Nucleic Acids Res. 2019, 47, D607–D613. [Google Scholar] [CrossRef] [Green Version]
- Shannon, P.; Markiel, A.; Ozier, O.; Baliga, N.S.; Wang, J.T.; Ramage, D.; Amin, N.; Schwikowski, B.; Ideker, T. Cytoscape: A Software Environment for Integrated Models of Biomolecular Interaction Networks. Genome Res. 2003, 13, 2498–2504. [Google Scholar] [CrossRef]
- Blum, M.; Chang, H.-Y.; Chuguransky, S.; Grego, T.; Kandasaamy, S.; Mitchell, A.; Nuka, G.; Paysan-Lafosse, T.; Qureshi, M.; Raj, S.; et al. The InterPro Protein Families and Domains Database: 20 Years On. Nucleic Acids Res. 2021, 49, D344–D354. [Google Scholar] [CrossRef]


| Complex | G. lamblia | S. cerevisiae | H. sapiens |
|---|---|---|---|
| TORC1 | GTOR | TOR1p or TOR2p | mTOR |
| RAPTOR | Kog1p | Raptor | |
| LST8 | Lst8p | mLST8 | |
| - | Tco89p | - | |
| TORC2 | GTOR | TOR2p | mTOR |
| - | Avo1p | mSIN1 | |
| - | Avo2p | - | |
| RICTOR | Avo3p | Rictor | |
| LST8 | Lst8p | mLST8 | |
| - | Bit61p | - |
Disclaimer/Publisher’s Note: The statements, opinions and data contained in all publications are solely those of the individual author(s) and contributor(s) and not of MDPI and/or the editor(s). MDPI and/or the editor(s) disclaim responsibility for any injury to people or property resulting from any ideas, methods, instructions or products referred to in the content. |
© 2023 by the authors. Licensee MDPI, Basel, Switzerland. This article is an open access article distributed under the terms and conditions of the Creative Commons Attribution (CC BY) license (https://creativecommons.org/licenses/by/4.0/).
Share and Cite
Muñoz-Muñoz, P.L.A.; Mares-Alejandre, R.E.; Meléndez-López, S.G.; Ramos-Ibarra, M.A. Structural Insights into the Giardia lamblia Target of Rapamycin Homolog: A Bioinformatics Approach. Int. J. Mol. Sci. 2023, 24, 11992. https://doi.org/10.3390/ijms241511992
Muñoz-Muñoz PLA, Mares-Alejandre RE, Meléndez-López SG, Ramos-Ibarra MA. Structural Insights into the Giardia lamblia Target of Rapamycin Homolog: A Bioinformatics Approach. International Journal of Molecular Sciences. 2023; 24(15):11992. https://doi.org/10.3390/ijms241511992
Chicago/Turabian StyleMuñoz-Muñoz, Patricia L. A., Rosa E. Mares-Alejandre, Samuel G. Meléndez-López, and Marco A. Ramos-Ibarra. 2023. "Structural Insights into the Giardia lamblia Target of Rapamycin Homolog: A Bioinformatics Approach" International Journal of Molecular Sciences 24, no. 15: 11992. https://doi.org/10.3390/ijms241511992