
Molecular Dynamics Study of the Effect of Charge and Glycosyl on Superoxide Anion Distribution near Lipid Membrane

Abstract
:1. Introduction
2. Results and Discussion
2.1. The Pathway of Transformation of ·O2− to Hydroxyl Radical
2.2. The Main Form of Superoxide Anion Radical in Aqueous Solution
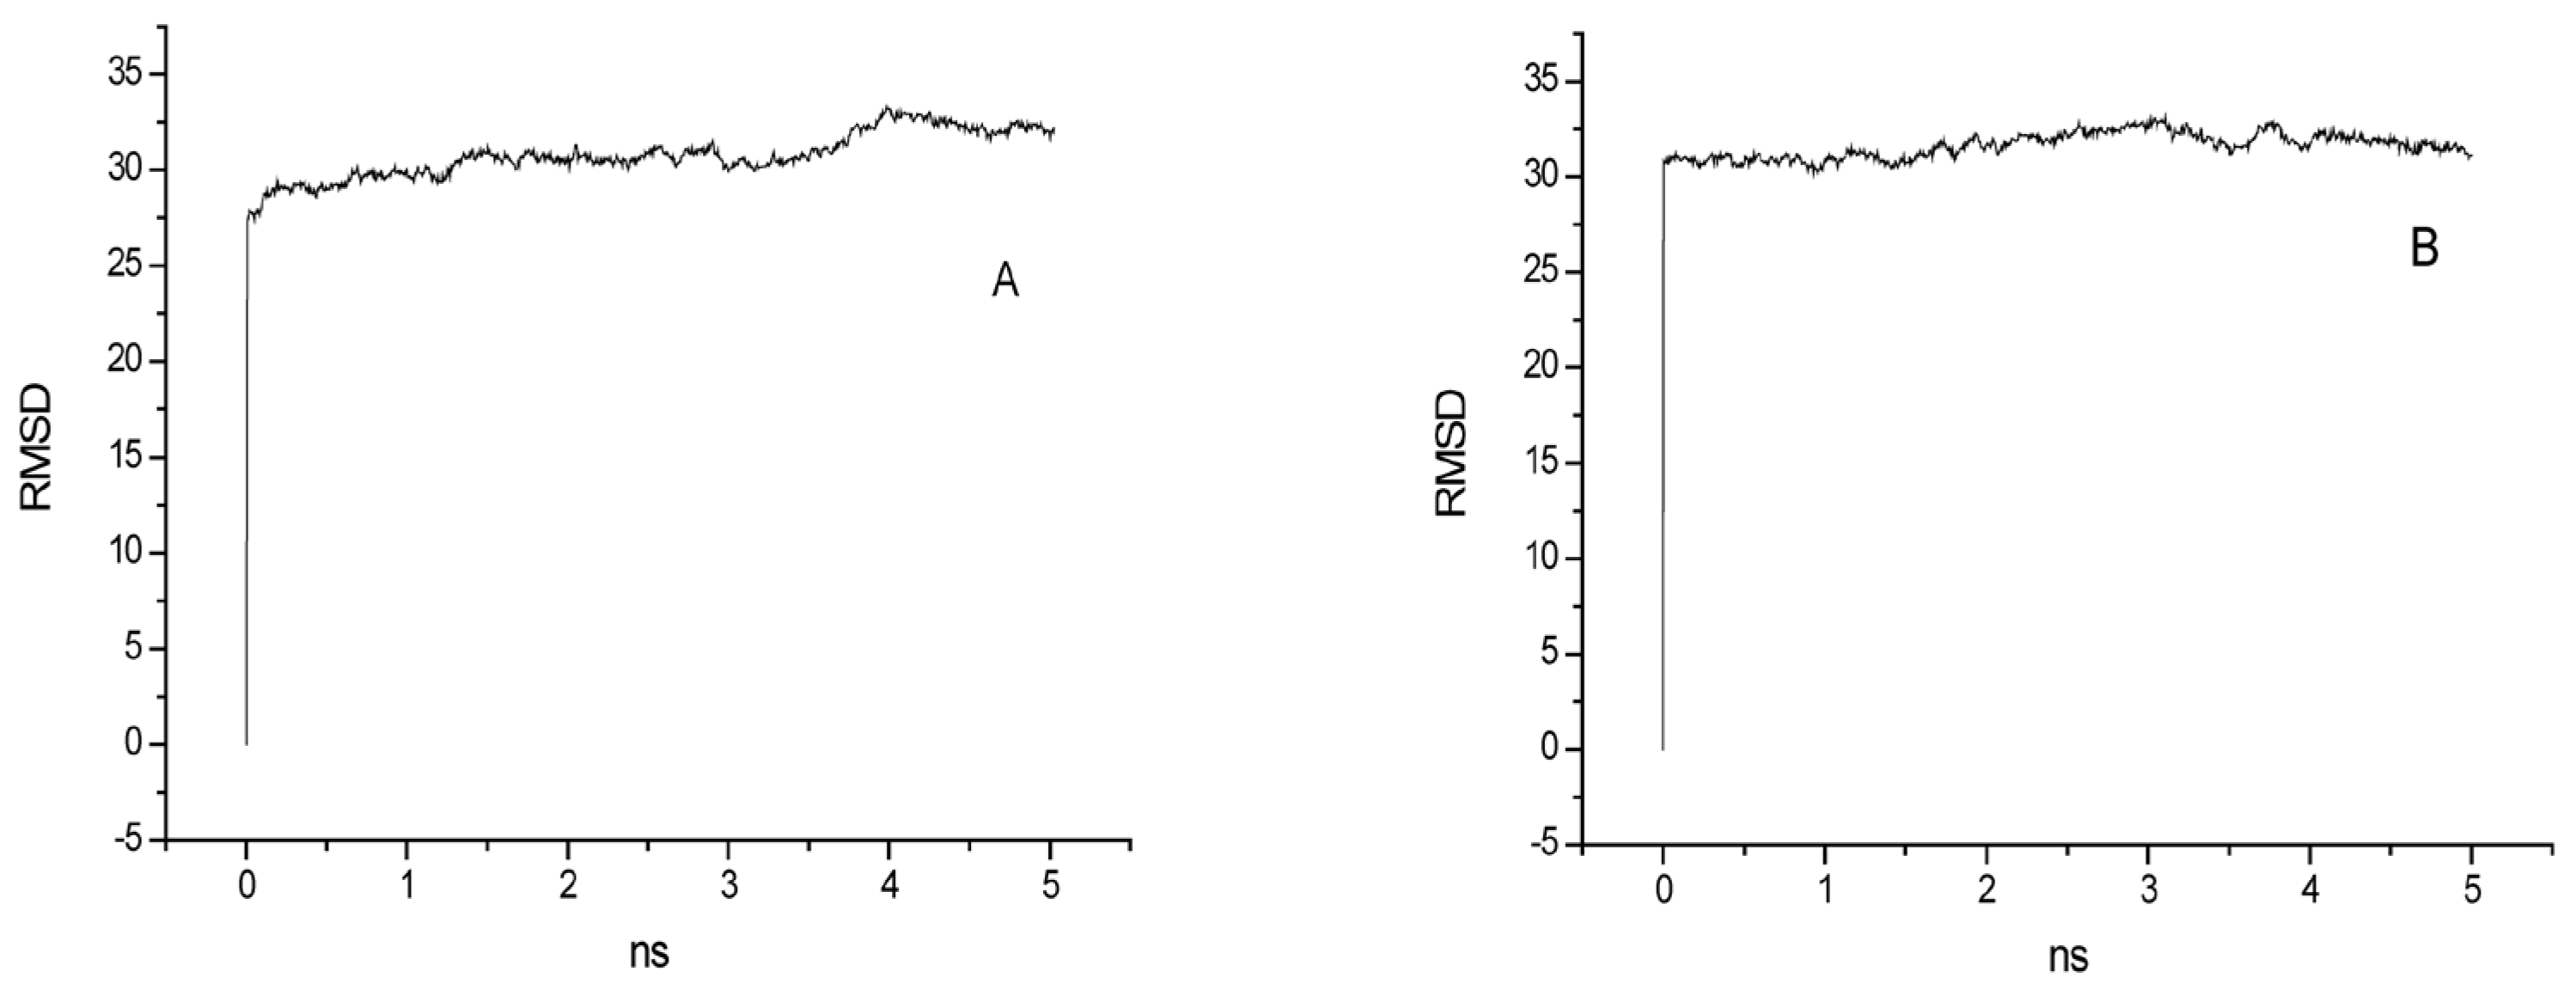
2.3. The Dynamic Equilibrium of the Systems
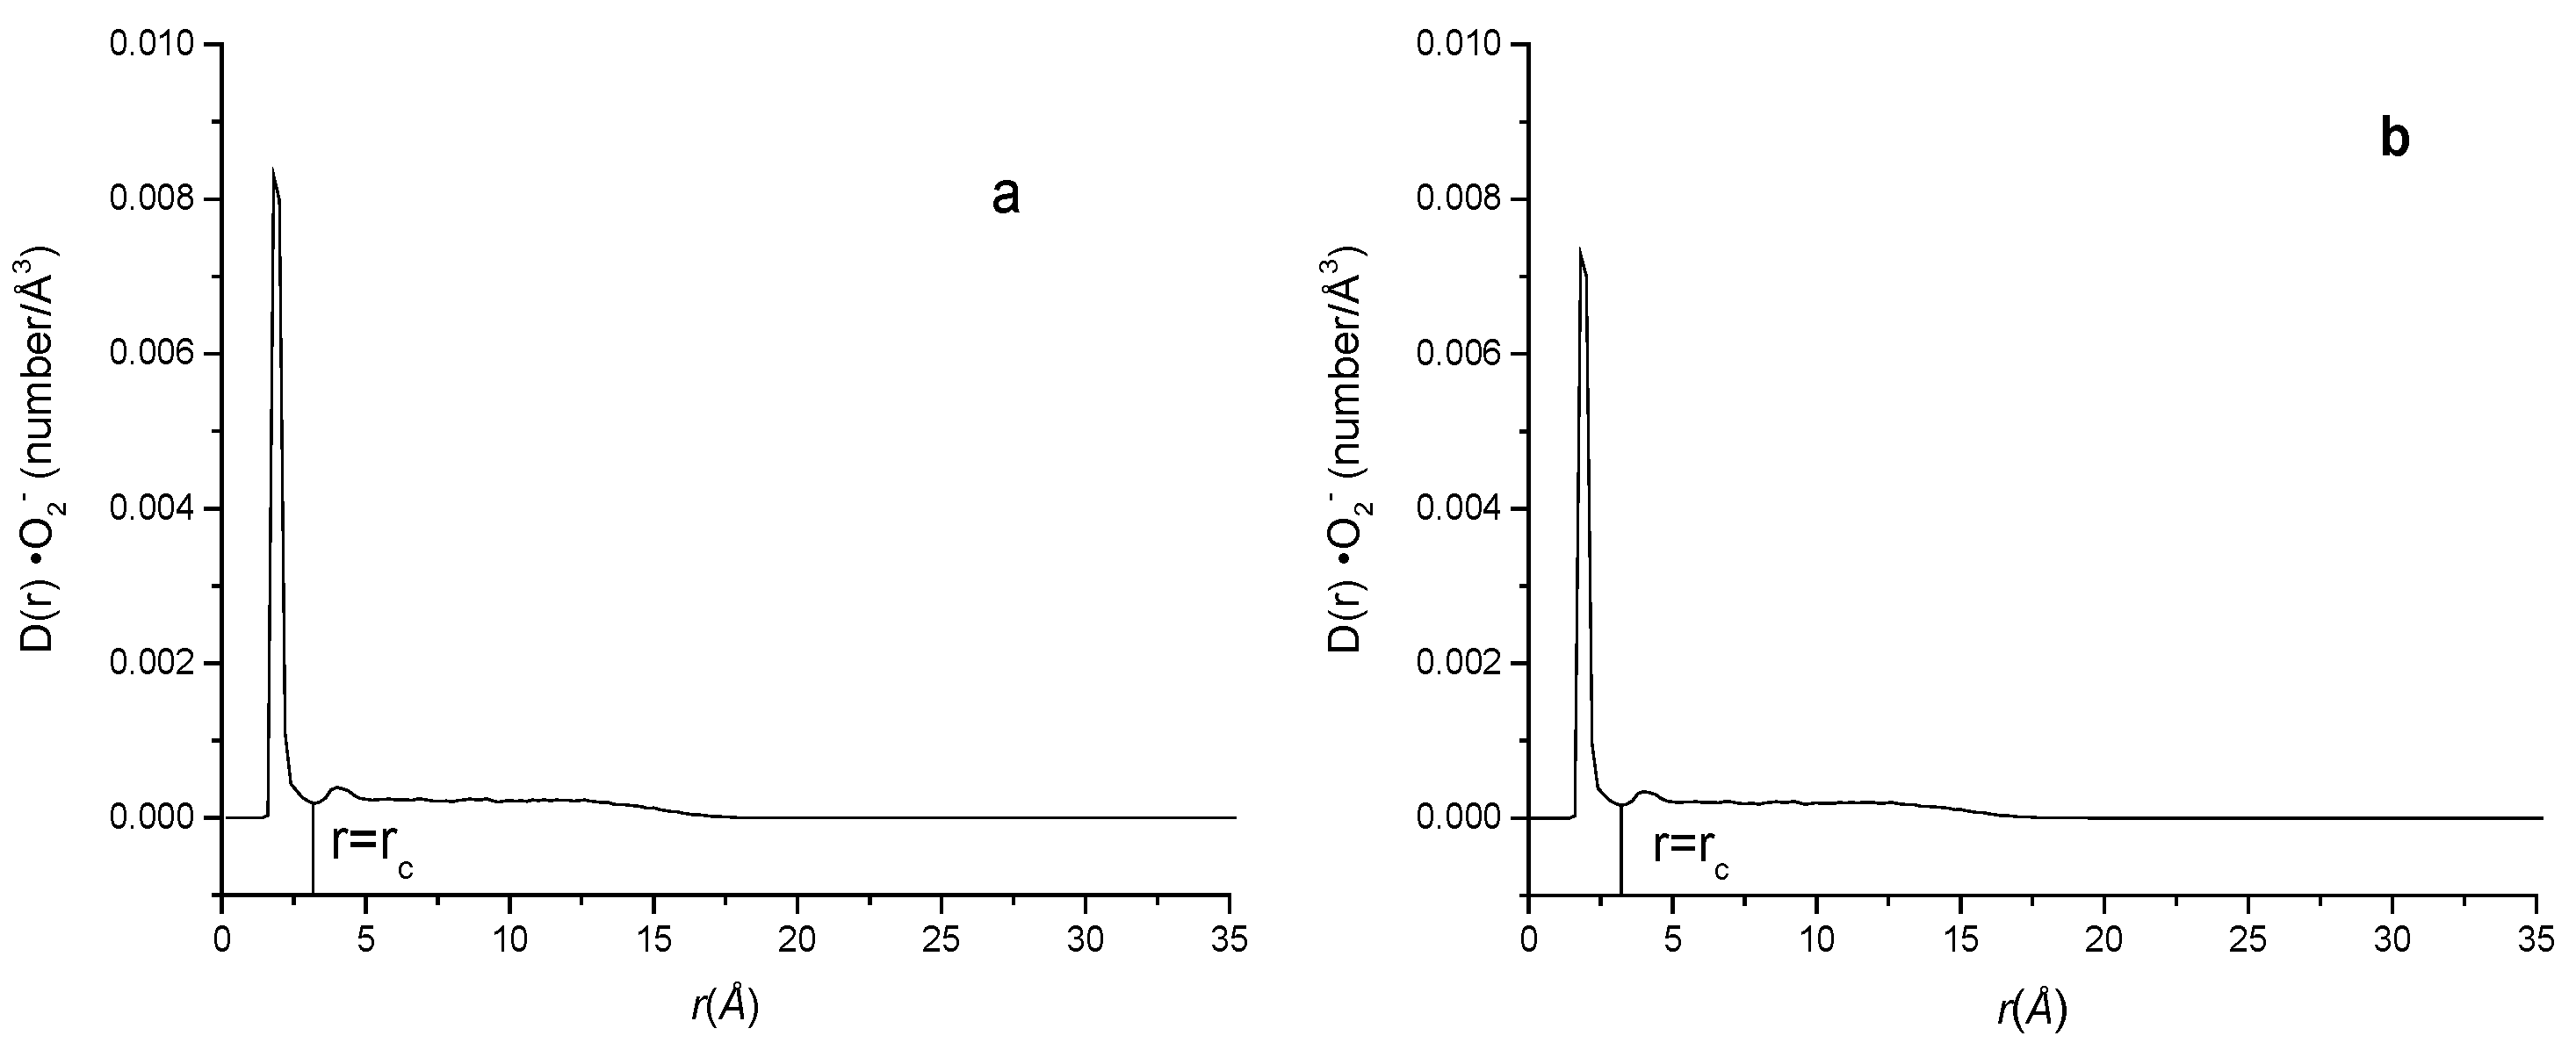
2.4. Effects of Different Charges on ·O2− Density near the Lipid Membrane Surface
2.5. Effects of Different Temperatures on ·O2− Ions Density near the Lipid Membrane
2.6. Effects of Different Electrolyte Environments on ·O2− Ions Density near the Lipid Membrane
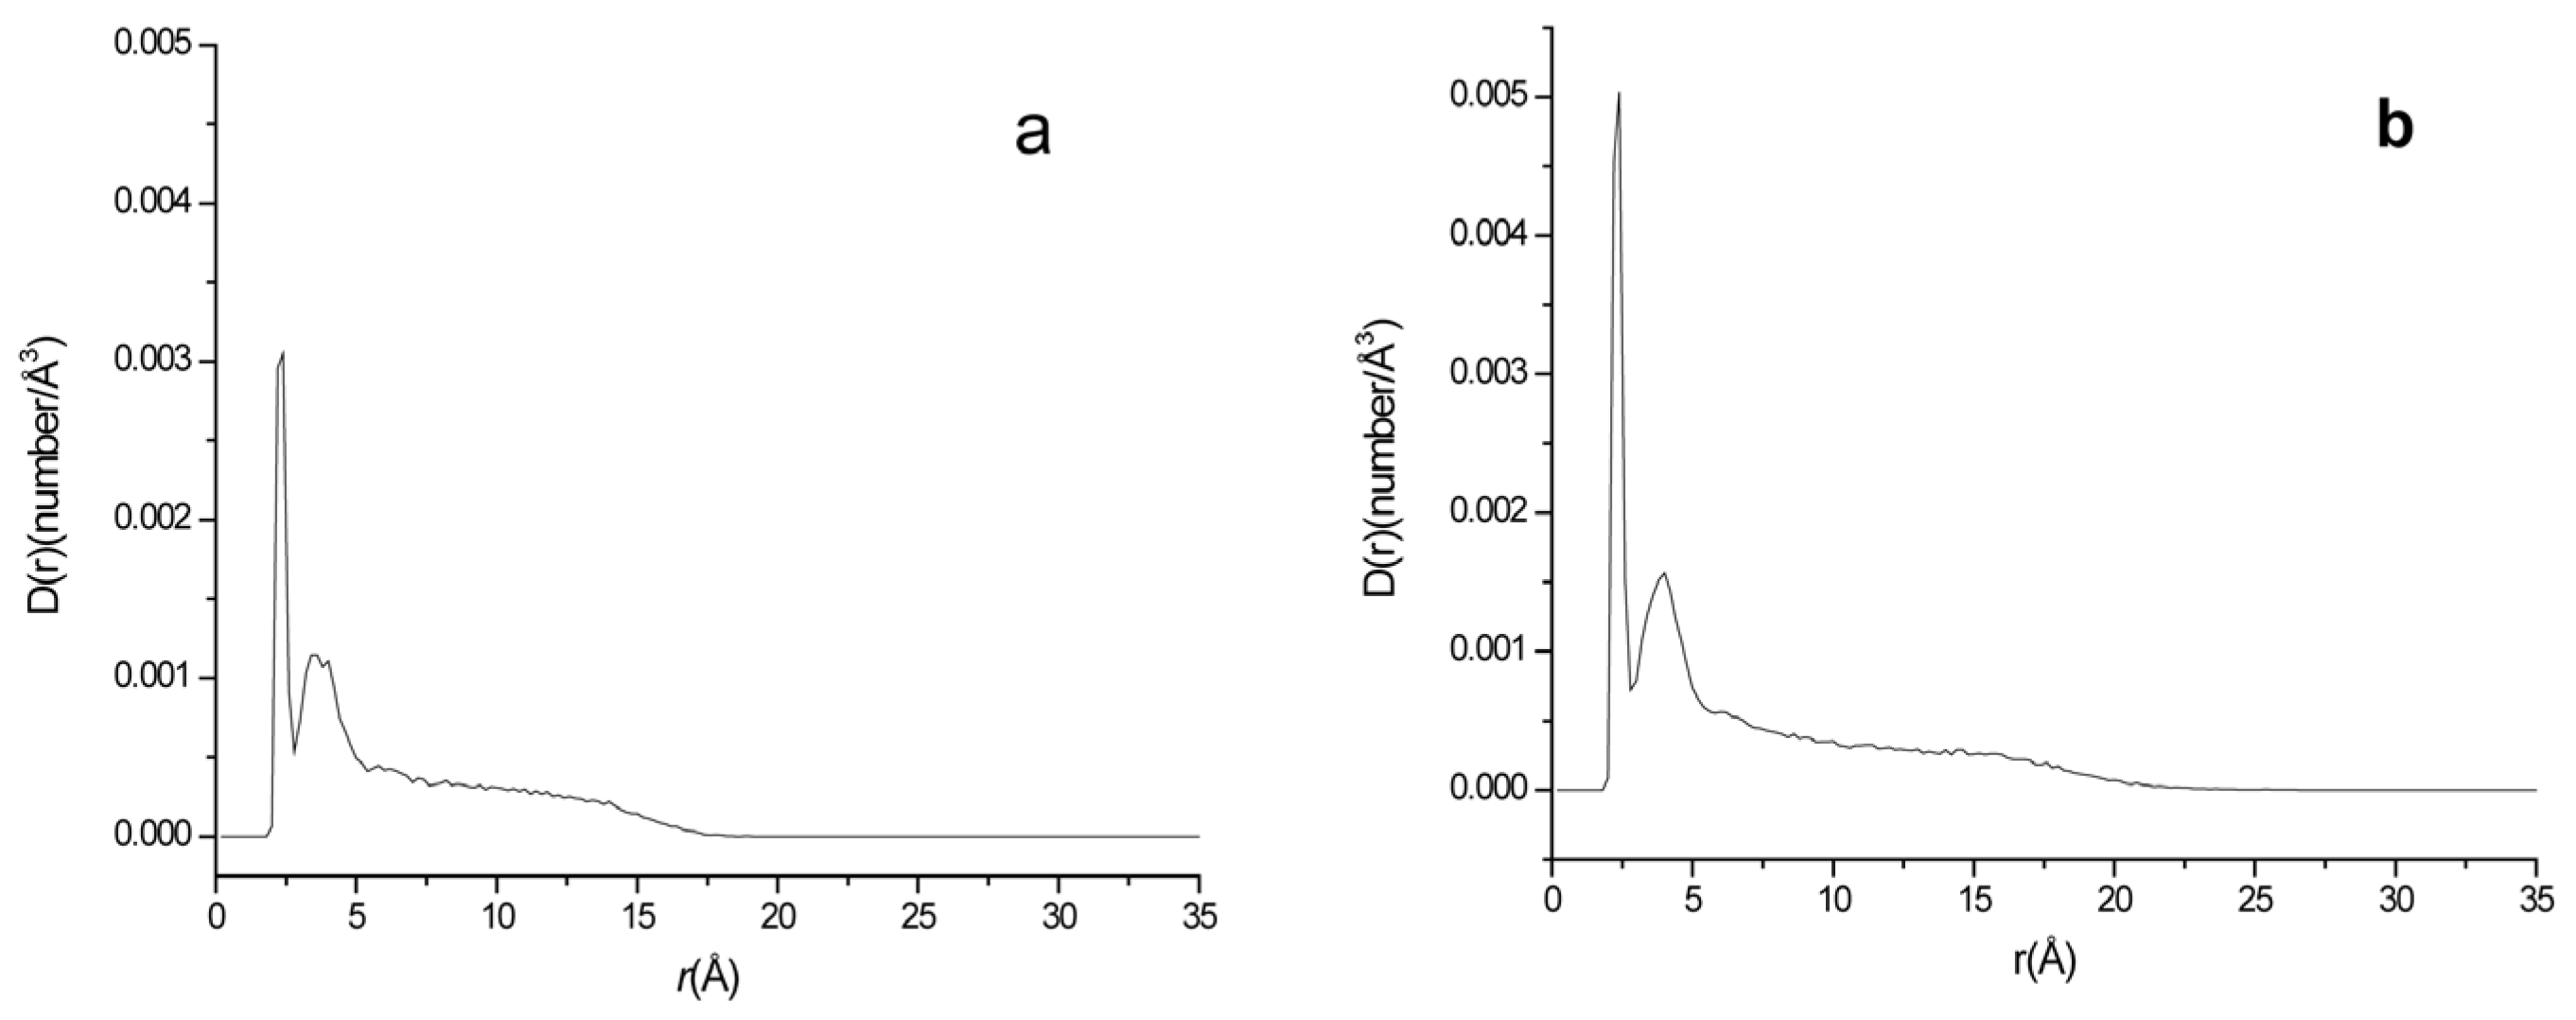
2.7. Effect of the Glycolipid on ·O2− Ions Density near the Lipid Membrane
2.8. The Distribution of Different Components and Electrostatic Potential along the Vertical Direction of the Membrane Surface
3. Materials and Methods
3.1. Model Preparation
3.2. MD Simulation
3.3. Data Processing
4. Conclusions
Author Contributions
Funding
Data Availability Statement
Conflicts of Interest
References
- Peng, J.L.; Yan, J.F.; Chen, Q.X.; Jiang, X.; Yao, G.; Lai, B. Natural mackinawite catalytic ozonation for N, N-dimethylacetamide (DMAC) degradation in aqueous solution: Kinetic, performance, biotoxicity and mechanism. Chemosphere 2018, 210, 831–842. [Google Scholar] [CrossRef] [PubMed]
- Alford, A.; Kozlovskaya, V.; Xue, B.; Gupta, N.; Higgins, W.; Pham-Hua, D.; He, L.L.; Urban, V.S.; Tse, H.M.; Kharlampieva, E. Manganoporphyrin-Polyphenol Multilayer Capsules as Radical and Reactive Oxygen Species (ROS) Scavengers. Chem. Mater. 2018, 30, 344–357. [Google Scholar] [CrossRef]
- Nam, J.S.; Kang, M.G.; Kang, J.; Park, S.Y.; Lee, S.J.C.; Kim, H.T.; Seo, J.K.; Kwon, O.H.; Lim, M.H.; Rhee, H.W.; et al. Endoplasmic Reticulum-Localized Iridium(III) Complexes as Efficient Photodynamic Therapy Agents via Protein Modifications. J. Am. Chem. Soc. 2016, 138, 10968–10977. [Google Scholar] [CrossRef] [PubMed]
- Fang, Y.Z.; Yang, S.; Wu, G.Y. Free radicals, antioxidants, and nutrition. Nutrition 2002, 18, 872–879. [Google Scholar] [CrossRef]
- Murphy, M.P. How mitochondria produce reactive oxygen species. Biochem. J. 2009, 417, 1–13. [Google Scholar] [CrossRef] [Green Version]
- del Rio, L.A.; Lopez-Huertas, E. ROS Generation in Peroxisomes and its Role in Cell Signaling. Plant Cell Physiol. 2016, 57, 1364–1376. [Google Scholar] [CrossRef]
- West, A.P.; Brodsky, I.E.; Rahner, C.; Woo, D.K.; Erdjument-Bromage, H.; Tempst, P.; Walsh, M.C.; Choi, Y.; Shadel, G.S.; Ghosh, S. TLR signalling augments macrophage bactericidal activity through mitochondrial ROS. Nature 2011, 472, 476–480. [Google Scholar] [CrossRef] [Green Version]
- Hayn, M.; Kremser, K.; Singewald, N.; Cairns, N.; Nemethova, M.; Lubec, B.; Lubec, G. Evidence against the involvement of reactive oxygen species in the pathogenesis of neuronal death in Down’s syndrome and Alzheimer’s disease. Life Sci. 1996, 59, 537–544. [Google Scholar] [CrossRef]
- Mugge, A. The role of reactive oxygen species in atherosclerosis. Z. Kardiol. 1998, 87, 851–864. [Google Scholar]
- Alfadda, A.A.; Sallam, R.M. Reactive Oxygen Species in Health and Disease. J. Biomed. Biotechnol. 2012, 2012, 936486. [Google Scholar] [CrossRef] [Green Version]
- Zhao, Y.; Zhao, B. Oxidative stress and the pathogenesis of Alzheimer’s disease. Oxid. Med. Cell Longev. 2013, 2013, 316523. [Google Scholar] [CrossRef] [Green Version]
- Poznyak, A.V.; Nikiforov, N.G.; Markin, A.M.; Kashirskikh, D.A.; Myasoedova, V.A.; Gerasimova, E.V.; Orekhov, A.N. Overview of OxLDL and its impact on cardiovascular health: Focus on atherosclerosis. Front. Pharmacol. 2021, 11, 2248. [Google Scholar] [CrossRef]
- Myasoedova, V.A.; Zhang, D.; Wetzker, R.; Grechko, A.V.; Orekhov, A.N. Impact of connexins on atherogenesis: A brief review. J. Integr. Med. 2018, 7, 12–19. [Google Scholar] [CrossRef]
- Waris, G.; Ahsan, H. Reactive oxygen species: Role in the development of cancer and various chronic conditions. J. Carcinog. 2006, 5, 14. [Google Scholar] [CrossRef]
- Davalli, P.; Marverti, G.; Lauriola, A.; D’Arca, D. Targeting Oxidatively Induced DNA Damage Response in Cancer: Opportunities for Novel Cancer Therapies. Oxid. Med. Cell Longev. 2018, 2018, 2389523. [Google Scholar] [CrossRef] [PubMed] [Green Version]
- Boaz, M.; Matas, Z.; Biro, A.; Katzir, Z.; Green, M.; Fainaru, M.; Smetana, S. Serum malondialdehyde and prevalent cardiovascular disease in hemodialysis. Kidney Int. 1999, 56, 1078–1083. [Google Scholar] [CrossRef] [Green Version]
- Salzman, R.; Pacal, L.; Tomandl, J.; Kankova, K.; Tothova, E.; Gal, B.; Kostrica, R.; Salzman, P. Elevated Malondialdehyde Correlates with the Extent of Primary Tumor and Predicts Poor Prognosis of Oropharyngeal Cancer. Anticancer Res. 2009, 29, 4227–4231. [Google Scholar] [PubMed]
- Vaca, C.E.; Wilhelm, J.; Harms-Ringdahl, M. Interaction of lipid peroxidation products with DNA. A review. Mutat. Res. Rev. Genet. Toxicol. 1988, 195, 137–149. [Google Scholar] [CrossRef]
- Cordeiro, R.M. Reactive oxygen species at phospholipid bilayers: Distribution, mobility and permeation. Biochim. Et Biophys. Acta Biomembr. 2014, 1838, 438–444. [Google Scholar] [CrossRef] [Green Version]
- Cordeiro, R.M. Reactive Oxygen and Nitrogen Species at Phospholipid Bilayers: Peroxynitrous Acid and Its Homolysis Products. J. Phys. Chem. B 2018, 122, 8211–8219. [Google Scholar] [CrossRef] [PubMed]
- Yadav, D.K.; Kumar, S.; Choi, E.H.; Sharma, P.; Misra, S.; Kim, M.H. Insight Into the Molecular Dynamic Simulation Studies of Reactive Oxygen Species in Native Skin Membrane. Front. Pharmacol. 2018, 9, 644. [Google Scholar] [CrossRef] [Green Version]
- Martínez, M.C.; Andriantsitohaina, R. Reactive nitrogen species: Molecular mechanisms and potential significance in health and disease. Antioxid. Redox. Signal. 2009, 11, 669–702. [Google Scholar] [CrossRef]
- Gulcin, I.; Dastan, A. Synthesis of dimeric phenol derivatives and determination of in vitro antioxidant and radical scavenging activities. J. Enzym. Inhib. Med. Chem. 2007, 22, 685–695. [Google Scholar] [CrossRef] [PubMed]
- Pietta, P.G. Flavonoids as antioxidants. J. Nat. Prod. 2000, 63, 1035–1042. [Google Scholar] [CrossRef] [PubMed]
- Liu, F.; Ooi, V.E.; Chang, S.T. Free radical scavenging activities of mushroom polysaccharide extracts. Life Sci. 1997, 60, 763–771. [Google Scholar] [CrossRef] [PubMed]
- Hassoun, E.A.; Li, F.; Abushaban, A.; Stohs, S.J. Production of superoxide anion, lipid peroxidation and DNA damage in the hepatic and brain tissues of rats after subchronic exposure to mixtures of TCDD and its congeners. J. Appl. Toxicol. 2001, 21, 211–219. [Google Scholar] [CrossRef]
- Casini, A.; Ceni, E.; Salzano, R.; Biondi, P.; Parola, M.; Galli, A.; Foschi, M.; Caligiuri, A.; Pinzani, M.; Surrenti, C. Neutrophil-derived superoxide anion induces lipid peroxidation and stimulates collagen synthesis in human hepatic stellate cells: Role of nitric oxide. Hepatology 1997, 25, 361–367. [Google Scholar] [CrossRef]
- Chan, W.K.; Faustman, C.; Yin, M.; Decker, E.A. Lipid oxidation induced by oxymyoglobin and metmyoglobin with involvement of H2O2 and superoxide anion. Meat Sci. 1997, 46, 181–190. [Google Scholar] [CrossRef] [PubMed]
- Sotomatsu, A.; Tanaka, M.; Hirai, S. Synthetic melanin and ferric ions promote superoxide anion-mediated lipid peroxidation. FEBS Lett. 1994, 342, 105–108. [Google Scholar] [CrossRef] [PubMed] [Green Version]
- Han, D.; Williams, E.; Cadenas, E. Mitochondrial respiratory chain-dependent generation of superoxide anion and its release into the intermembrane space. Biochem. J. 2001, 353, 411–416. [Google Scholar] [CrossRef]
- Hwang, J.; Kleinhenz, D.J.; Lassègue, B.; Griendling, K.K.; Hart, C.M. Peroxisome proliferator-activated receptor-gamma ligands regulate endothelial membrane superoxide production. Am. J. Physiol. Cell Physiol. 2005, 288, C899. [Google Scholar] [CrossRef] [Green Version]
- Salvador, A.; Sousa, J.; Pinto, R.E. Hydroperoxyl, superoxide and pH gradients in the mitochondrial matrix: A theoretical assessment. Free Radic. Biol. Med. 2001, 31, 1208–1215. [Google Scholar] [CrossRef]
- Takahashi, T.; Harada, R.; Shigeta, Y. Distribution of Counter Ions in Negatively-charged Lipid/Water/Air Interface: Molecular Dynamics Study. Chem. Lett. 2020, 49, 361–363. [Google Scholar] [CrossRef]
- Rodriguez, J.R.; García, A.E. Concentration dependence of NaCl ion distributions around DPPC lipid bilayers. Interdiscip. Sci. Comput. Life Sci. 2011, 3, 272–282. [Google Scholar] [CrossRef] [PubMed] [Green Version]
- Magrassi, L.; Leto, K.; Rossi, F. Lifespan of neurons is uncoupled from organismal lifespan. Proc. Natl. Acad. Sci. USA 2013, 110, 4374–4379. [Google Scholar] [CrossRef] [Green Version]
- MacLean, M.; Harris, N.; Piper, P.W. Chronological lifespan of stationary phase yeast cells; a model for investigating the factors that might influence the ageing of postmitotic tissues in higher organisms. Yeast 2001, 18, 499–509. [Google Scholar] [CrossRef] [PubMed]
- Ledeen, R.W. Ganglioside structures and distribution: Are they localized at the nerve ending? J. Supramol. Struct. 1978, 8, 1–17. [Google Scholar] [CrossRef]
- Varani, I.; Terzaghi, A.; Donati, L.; Marazzi, M.; Masserini, M. Effect of some exogenous glycosphingolipids on human keratinocytes in culture. J. Appl. Cosmetol. 1992, 10, 13–16. [Google Scholar]
- Phaniendra, A.; Jestadi, D.B.; Periyasamy, L. Free radicals: Properties, sources, targets, and their implication in various diseases. Indian J. Clin. Biochem. 2015, 30, 11–26. [Google Scholar] [CrossRef] [Green Version]
- Kehrer, J.P. The Haber-Weiss reaction and mechanisms of toxicity. Toxicology 2000, 149, 43–50. [Google Scholar] [CrossRef] [PubMed]
- Candeias, L.P.; Patel, K.B.; Stratford, M.R.; Wardman, P. Free hydroxyl radicals are formed on reaction between the neutrophil-derived species superoxide anion and hypochlorous acid. FEBS Lett. 1993, 333, 151–153. [Google Scholar] [CrossRef] [PubMed] [Green Version]
- Kettle, A.J.; Winterbourn, C.C. Myeloperoxidase: A key regulator of neutrophil oxidant production. Redox Rep. 1997, 3, 3–15. [Google Scholar] [CrossRef] [PubMed] [Green Version]
- Hampton, M.B.; Kettle, A.J.; Winterbourn, C.C. Involvement of superoxide and myeloperoxidase in oxygen-dependent killing of Staphylococcus aureus by neutrophils. Infect. Immunol. 1996, 64, 3512–3517. [Google Scholar] [CrossRef] [Green Version]
- Bauer, G. HOCl-dependent singlet oxygen and hydroxyl radical generation modulate and induce apoptosis of malignant cells. Anticancer Res. 2013, 33, 3589–3602. [Google Scholar] [PubMed]
- Merényi, G.; Lind, J. Free radical formation in the peroxynitrous acid (ONOOH)/peroxynitrite (ONOO-) system. Chem. Res. Toxicol. 1998, 11, 243–246. [Google Scholar] [CrossRef]
- Gebicki, J.M.; Bielski, B. Comparison of the capacities of the perhydroxyl and the superoxide radicals to initiate chain oxidation of linoleic acid. J. Am. Chem. Soc. 1981, 103, 7020–7022. [Google Scholar] [CrossRef]
- Grey, A.D.N.J.D. HO2*: The forgotten radical. DNA Cell Biol. 2002, 21, 251–257. [Google Scholar] [CrossRef]
- Porasso, R.D.; Cascales, J.J.L. Study of the effect of Na+ and Ca2+ ion concentration on the structure of an asymmetric DPPC/DPPC+ DPPS lipid bilayer by molecular dynamics simulation. Colloids Surf. B Biointerfaces 2009, 73, 42–50. [Google Scholar] [CrossRef]
- Cordomí, A.; Edholm, O.; Perez, J.J. Effect of Ions on a Dipalmitoyl Phosphatidylcholine Bilayer. A Molecular Dynamics Simulation Study. J. Phys. Chem. B 2008, 112, 1397–1408. [Google Scholar] [CrossRef]
- Pandit, S.A.; Bostick, D.; Berkowitz, M.L. Molecular Dynamics Simulation of a Dipalmitoylphosphatidylcholine Bilayer with NaCl. Biophys. J. 2003, 84, 3743–3750. [Google Scholar] [CrossRef] [Green Version]
- Böckmann, R.A.; Hac, A.; Heimburg, T.; Grubmüller, H. Effect of sodium chloride on a lipid bilayer. Biophys. J. 2003, 85, 1647–1655. [Google Scholar] [CrossRef] [Green Version]
- Ganesan, S.J.; Xu, H.; Matysiak, S. Influence of Monovalent Cation Size on Nanodomain Formation in Anionic-Zwitterionic Mixed Bilayers. J. Phys. Chem. B 2017, 121, 787–799. [Google Scholar] [CrossRef] [PubMed]
- Klasczyk, B.; Knecht, V.; Lipowsky, R.; Dimova, R. Interactions of alkali metal chlorides with phosphatidylcholine vesicles. Langmuir 2010, 26, 18951–18958. [Google Scholar] [CrossRef] [PubMed]
- Redondo-Morata, L.; Giannotti, M.I.; Sanz, F. Structural impact of cations on lipid bilayer models: Nanomechanical properties by AFM-force spectroscopy. Mol. Membr. Biol. 2014, 31, 17–28. [Google Scholar] [CrossRef] [PubMed]
- Magalhaes, M.A.; Glogauer, M. Pivotal Advance: Phospholipids determine net membrane surface charge resulting in differential localization of active Rac1 and Rac2. J. Leukoc. Biol. 2010, 87, 545–555. [Google Scholar] [CrossRef] [PubMed] [Green Version]
- Pandit, S.A.; Berkowitz, M.L. Molecular dynamics simulation of dipalmitoylphosphatidylserine bilayer with Na+ counterions. Biophys. J. 2002, 82, 1818–1827. [Google Scholar] [CrossRef] [Green Version]
- Abraham, M.J.; Murtola, T.; Schulz, R.; Páll, S.; Smith, J.C.; Hess, B.; Lindahl, E. GROMACS: High performance molecular simulations through multi-level parallelism from laptops to supercomputers. SoftwareX 2015, 1, 19–25. [Google Scholar] [CrossRef] [Green Version]
- Gowers, R.J.; Linke, M.; Barnoud, J.; Reddy, T. MDAnalysis: A Python package for the rapid analysis of molecular dynamics simulations. In Proceedings of the 15th Python in Science Conference, Austin, TX, USA, 11–17 July 2016. [Google Scholar]
- Jo, S.; Kim, T.; Iyer, V.G.; Im, W. CHARMM-GUI: A web-based graphical user interface for CHARMM. J. Comput. Chem. 2008, 29, 1859–1865. [Google Scholar] [CrossRef]
- Case, D.; Babin, V.; Berryman, J.; Betz, R.; Cai, Q.; Cerutti, D.; Cheatham, T., III; Darden, T.; Duke, R.; Gohlke, H. The FF14SB force field. Amber 2014, 14, 29–31. [Google Scholar]
- Martínez, L.; Andrade, R.A.; Birgin, E.G.; Martínez, J. PACKMOL: A package for building initial configurations for molecular dynamics simulations. J. Comput. Chem. 2010, 30, 2157–2164. [Google Scholar] [CrossRef]
- Frisch, M.J.; Trucks, G.W.; Schlegel, H.B.; Scuseria, G.E.; Robb, M.A.; Cheeseman, J.R.; Scalmani, G.; Barone, V.; Mennucci, B.; Petersson, G.A.; et al. Gaussian 09; Gaussian, Inc.: Wallingford, CT, USA, 2009. [Google Scholar]
- Melcr, J.; Ferreira, T.M.; Jungwirth, P.; Ollila, O.H.S. Improved cation binding to lipid bilayers with negatively charged POPS by effective inclusion of electronic polarization. J. Chem. Theory Comput. 2019, 16, 738–748. [Google Scholar] [CrossRef] [PubMed]
- Maier , J.A.; Martinez , C.; Kasavajhala , K.; Wickstrom , L.; Hauser , K.E.; Simmerling , C. ff14SB: Improving the Accuracy of Protein Side Chain and Backbone Parameters from ff99SB. J. Chem. Theory Comput. JCTC 2015, 11, 3695–3713. [Google Scholar]
- Jorgensen, W.L.; Chandrasekhar, J.; Madura, J.D.; Impey, R.W.; Klein, M.L. Comparison of simple potential functions for simulating liquid water. J. Chem. Phys 1998, 79, 926–935. [Google Scholar] [CrossRef]
- Li, P.; Merz, K.M. Taking into Account the Ion-Induced Dipole Interaction in the Nonbonded Model of Ions. J. Chem. Theory Comput. 2014, 10, 289–297. [Google Scholar] [CrossRef] [Green Version]
- Lv, G.; Zhang, H.; Wang, Z.; Wang, N.; Sun, X.; Zhang, C.; Li, M. Understanding the properties of methanesulfinic acid at the air-water interface. Sci. Total Environ. 2019, 668, 524–530. [Google Scholar] [CrossRef]
- Zhang, F.S. Structure and dynamics properties of liquid ethylene glycol from molecular dynamics simulations. Chem. Phys. Lett. 2019, 718, 12–21. [Google Scholar] [CrossRef]
- Wang, J.; Wolf, R.M.; Caldwell, J.W.; Kollman, P.A.; Case, D.A. Development and Testing of a General Amber Force Field. J. Comput. Chem. 2004, 25, 1157–1174. [Google Scholar] [CrossRef]
- Silva, A.; Vranken, W.F. ACPYPE-Antechamber python parser interface. BMC Res. Notes 2012, 5, 367. [Google Scholar]
- Panagiotopoulos, A.Z. Direct determination of phase coexistence properties of fluids by Monte Carlo simulation in a new ensemble. Mol. Phys. 1987, 61, 813–826. [Google Scholar] [CrossRef]
- Parrinello, M. Crystal Structure and Pair Potentials: A Molecular-Dynamics Study. Phys. Rev. Lett. 1980, 45, 1196–1199. [Google Scholar] [CrossRef]
- Parrinello, M.; Rahman, A. Polymorphic transitions in single crystals: A new molecular dynamics method. J. Appl. Phys. 1998, 52, 7182–7190. [Google Scholar] [CrossRef]
- Hess, B.; Bekker, H.; And, H.; Fraaije, J. LINCS: A linear constraint solver for molecular simulations. J. Comput. Chem. 1997, 18, 1463–1472. [Google Scholar] [CrossRef]
- Shityakov, S.; Dandekar, T. Molecular Dynamics Simulation of POPC and POPE Lipid Membrane Bilayers Enforced by an Intercalated Single-Wall Carbon Nanotube. Nano 2011, 6, 19–29. [Google Scholar] [CrossRef]
- Dassault Systèmes. Biovia, Discovery Studio Modeling Environment; Dassault Systèmes Biovia: San Diego, CA, USA, 2016. [Google Scholar]


| System | POPE | POPG | ·O2− | K+ | Na+ | Cl− | T(K) | GM1 | GD1a |
|---|---|---|---|---|---|---|---|---|---|
| A | √ | - | 80 | 80 | - | - | 310 | - | - |
| B | √ | √ | 80 | 134 | - | - | 310 | - | - |
| C | √ | √ | 80 | 134 | - | - | 330 | - | - |
| D | √ | - | 80 | - | 80 | - | 310 | - | - |
| E | √ | √ | 80 | - | 134 | - | 310 | - | - |
| F | √ | - | 80 | 101 | - | 21 | 310 | - | - |
| G | √ | √ | 80 | 155 | - | 21 | 310 | - | - |
| H | √ | √ | 80 | 140 | - | - | 310 | √ | √ |
| System | R (%) | |||
|---|---|---|---|---|
| ·O2− | K+ | Na+ | Cl− | |
| A | 56.89 | 21.97 | - | - |
| B | 35.26 | 23.83 | - | - |
| C | 34.68 | 29.45 | - | - |
| D | 51.61 | - | 41.18 | - |
| E | 42.31 | - | 32.95 | - |
| F | 50.79 | 16.46 | - | 18.16 |
| G | 39.09 | 25.16 | - | 21.39 |
| H | 12.32 | 20.14 | - | - |
| System | P | N | ·O2− | Na+/K+ | Cl− |
|---|---|---|---|---|---|
| D | 39.4 | 40.0 | 43.2 | 42.0 | - |
| E | 34.4 | 37.4 | 40.6 | 39.0 | - |
| F | 35.6 | 37.4 | 42 | 44.2 | 44.8 |
| G | 35.2 | 36.6 | 41 | 42 | 48.8 |
| H | 41.4 | 43.0 | 41.4 | 48.6 | - |
| System | D | E | F | G | H |
|---|---|---|---|---|---|
| Rph | 9.87 | 3.65 | 2.92 | 2.0 | 1.91 |
| System | Maximum Positive Potential (×10−2 V) | Maximum Negative Potential (×10−2 V) | Distance between the Positive Potential Peaks (Å) | Distance between the Negative Potential Peaks (Å) |
|---|---|---|---|---|
| A | 28.7 | −35.9 | 46.68 | 35.76 |
| B | 17.2 | −41.1 | 45.92 | 33.85 |
| H | 9.5 | −51.1 | 51.85 | 41.35 |
Disclaimer/Publisher’s Note: The statements, opinions and data contained in all publications are solely those of the individual author(s) and contributor(s) and not of MDPI and/or the editor(s). MDPI and/or the editor(s) disclaim responsibility for any injury to people or property resulting from any ideas, methods, instructions or products referred to in the content. |
© 2023 by the authors. Licensee MDPI, Basel, Switzerland. This article is an open access article distributed under the terms and conditions of the Creative Commons Attribution (CC BY) license (https://creativecommons.org/licenses/by/4.0/).
Share and Cite
Meng, X.; Liu, H.; Zhao, N.; Yang, Y.; Zhao, K.; Dai, Y. Molecular Dynamics Study of the Effect of Charge and Glycosyl on Superoxide Anion Distribution near Lipid Membrane. Int. J. Mol. Sci. 2023, 24, 10926. https://doi.org/10.3390/ijms241310926
Meng X, Liu H, Zhao N, Yang Y, Zhao K, Dai Y. Molecular Dynamics Study of the Effect of Charge and Glycosyl on Superoxide Anion Distribution near Lipid Membrane. International Journal of Molecular Sciences. 2023; 24(13):10926. https://doi.org/10.3390/ijms241310926
Chicago/Turabian StyleMeng, Xuan, Huiyu Liu, Ning Zhao, Yajun Yang, Kai Zhao, and Yujie Dai. 2023. "Molecular Dynamics Study of the Effect of Charge and Glycosyl on Superoxide Anion Distribution near Lipid Membrane" International Journal of Molecular Sciences 24, no. 13: 10926. https://doi.org/10.3390/ijms241310926