Article

Genome-Wide Identification and Expression Analysis of AS2 Genes in Brassica rapa Reveal Their Potential Roles in Abiotic Stress

College of Horticulture Science and Engineering, Shandong Agricultural University, Tai’an 271000, China
*
Authors to whom correspondence should be addressed.
These authors contributed equally to this work.
Int. J. Mol. Sci. 2023, 24(13), 10534; https://doi.org/10.3390/ijms241310534
Submission received: 14 May 2023 / Revised: 13 June 2023 / Accepted: 19 June 2023 / Published: 23 June 2023
(This article belongs to the Special Issue Regulatory Mechanism and Network of Abiotic Stress-Response in Plants)

Abstract

:
The ASYMMETRIC LEAVES2/LATERAL ORGAN BOUNDARIES (AS2/LOB) gene family plays a pivotal role in plant growth, induction of phytohormones, and the abiotic stress response. However, the AS2 gene family in Brassica rapa has yet to be investigated. In this study, we identified 62 AS2 genes in the B. rapa genome, which were classified into six subfamilies and distributed across 10 chromosomes. Sequence analysis of BrAS2 promotors showed that there are several typical cis-elements involved in abiotic stress tolerance and stress-related hormone response. Tissue-specific expression analysis showed that BrAS2-47 exhibited ubiquitous expression in all tissues, indicating it may be involved in many biological processes. Gene expression analysis showed that the expressions of BrAS2-47 and BrAS2-10 were significantly downregulated under cold stress, heat stress, drought stress, and salt stress, while BrAS2-58 expression was significantly upregulated under heat stress. RT-qPCR also confirmed that the expression of BrAS2-47 and BrAS2-10 was significantly downregulated under cold stress, drought stress, and salt stress, and in addition BrAS2-56 and BrAS2-4 also changed significantly under the three stresses. In addition, protein–protein interaction (PPI) network analysis revealed that the Arabidopsis thaliana genes AT5G67420 (homologous gene of BrAS2-47 and BrAS2-10) and AT3G49940 (homologous gene of BrAS2-58) can interact with NIN-like protein 7 (NLP7), which has been previously reported to play a role in resistance to adverse environments. In summary, our findings suggest that among the BrAS2 gene family, BrAS2-47 and BrAS2-10 have the most potential for the regulation of abiotic stress tolerance. These results will facilitate future functional investigations of BrAS2 genes in B. rapa.

1. Introduction

The ASYMMETRIC LEAVES2/LATERAL ORGAN BOUNDARIES (AS2/LOB) gene family, equivalent to the LBD gene family, is a plant-specific transcription factor family that was first discovered in Arabidopsis thaliana in 2002 through enhancer trap insertion and that has since received considerable attention [1,2]. Members of the AS2/LOB gene family govern the development and morphology of plant leaves and play a pivotal role in the development of lateral organs, such as the leaves, petals, and fruits. Members of the AS2 gene family interact with other transcription factors to regulate gene expression in plants, thereby affecting plant development and morphology [1]. The AS2 gene family is highly conserved, encoding three conserved domains: the CX2CX6CX3C motif (LOB domain), which is composed of four conserved cysteine residues, conserved glycine residues, and the LX6LX3LX6L leucine-like zipper motif. The AS2 gene family has been identified in many plants. Among them, there are 43 members in A. thaliana, 24 members in Hordeum vulgare, 57 members in Medicago truncatula, 50 members in Vitis vinifera, 43 members in Solanum tuberosum, and 18 members in Glycine max [1,3,4,5,6,7].
The prominent contribution of the AS2 gene family to the plant defense response against abiotic stress has been studied. A low expression of StLBD1-5 promoted resistance to drought conditions in S. tuberosum [6]. Overexpressing PheLBD29 in Moso bamboo enhanced drought stress tolerance in transgenic plants [8]. Additionally, the LBD15 loss-of-function mutant in A. thaliana decreased sensitivity to abscisic acid (ABA) and increased sensitivity to water-deficit stress [9]. Overexpressing MtLBD1 (an ABA and salt-response transcription factor) in M. truncatula showed that ABA mediates the response to salt stress [10]. ZmLBD5 was shown to be a negative regulator of drought tolerance in Zea mays, based on the phenotype of CRISPR/Cas9 knockout LBD5 seedlings under drought stress. Modulating ABA biosynthesis is a potentially useful target for growth response to water deficit [11]. Investigating AtHB12 mutant (which mediates the growth response to water deficit) and LBD14 RNAi plants demonstrated that ABA mediates the inhibition of the formation of lateral roots via a non-auxin-dependent pathway in response to abiotic stress [12]. In Solanum lycopersicum, studies on the SlLBD40 knockout system indicated that it is a negative regulator of drought tolerance through the jasmonic acid (JA) signal transduction pathway [13]. Furthermore, AS2 genes are involved in modulating pathogen and pest resistance [14]. In A. thaliana and Physcomitrella patens, LBD20 and PpLBD27 are related to disease susceptibility and pathogens [15,16]. Moreover, low temperature, NaCl, drought, and other abiotic stresses promote the production of secondary metabolites, so plants can adapt to their environment, and there may be a “bridge” between the transcription factor, the biosynthetic gene, and the secondary metabolite mechanisms by which LBD genes control secondary metabolism [17,18,19,20]. In A. thaliana, AtLBD37, AtLBD38, and AtLBD39 genes act as repressors of anthocyanin synthesis and as N availability signals [21,22]. In Oryza sativa, OsLBD37 has been linked to nitrogen metabolism and exhibits responses to various environmental stresses [21,23]. In Camellia sinensis, overexpression of CsLBD39 revealed that it may be involved as a negative regulator of nitrate signal transduction in tea plants [24].
AS2 also plays essential roles in growth and development, as it is expressed in the adaxial section of leaf primordia and young flower organs, where it participates with AS1 and JAGGED (JAG) to impose limitations on the boundary cells in flower organs [25,26]. AS2 encodes a nucleoprotein with a plant-specific AS2/LOB domain that inhibits KNOX expression, which is necessary for the differentiation of the primordia [27,28,29,30]. Expression of the homeobox KNOX gene in A. thaliana must be retained in the shoot meristem for it to remain active. Genetic analysis has shown that AS1 and AS2 genes play a crucial role in sepal and petal primordia, where they inhibit boundary-specific genes, to promote the proper development of organs [31,32]. Similarly, studies in Brassica campestris have shown that BcAS2 forms a complex with BcAS1-1/2, to establish the paraxial abaxial polarity of the lateral organs [33]. Overall, the function of AS2 is crucial in ensuring proper plant development and organ differentiation.
Brassica rapa (Chinese cabbage) is a widely grown vegetable in Asia that is often exposed to various stresses during growth. However, no study has examined the AS2 genes in B. rapa, until now. In this study, the BrAS2 genes were identified at the whole-genome level, and the physicochemical properties, structures of the genes and proteins, and expression profiles were analyzed. This study provides basic information that will aid future functional studies on BrAS2s.

2. Results

2.1. Genome-Wide Identification and Physicochemical Characterization of the Brassica rapa AS2 Genes

To identify and understand the characteristics of the AS2 gene family in B. rapa, we used bioinformatics methods to analyze the B. rapa genome, ultimately resulting in the discovery of 62 members within the BrAS2 gene family through homology matching with the B. rapa genomic database (Table 1). These genes were renamed BrAS2-1 to BrAS2-62 and were further categorized into six distinct subfamilies. The physicochemical properties of the BrAS2 genes were analyzed and are listed in Table 1. The amino acid (aa) length of the BrAS2 proteins ranged from 107 to 394 aa; the molecular weight was 44,228.21, while the minimum was 11,876.75, and the PI values ranged from 4.5 to 10.63.

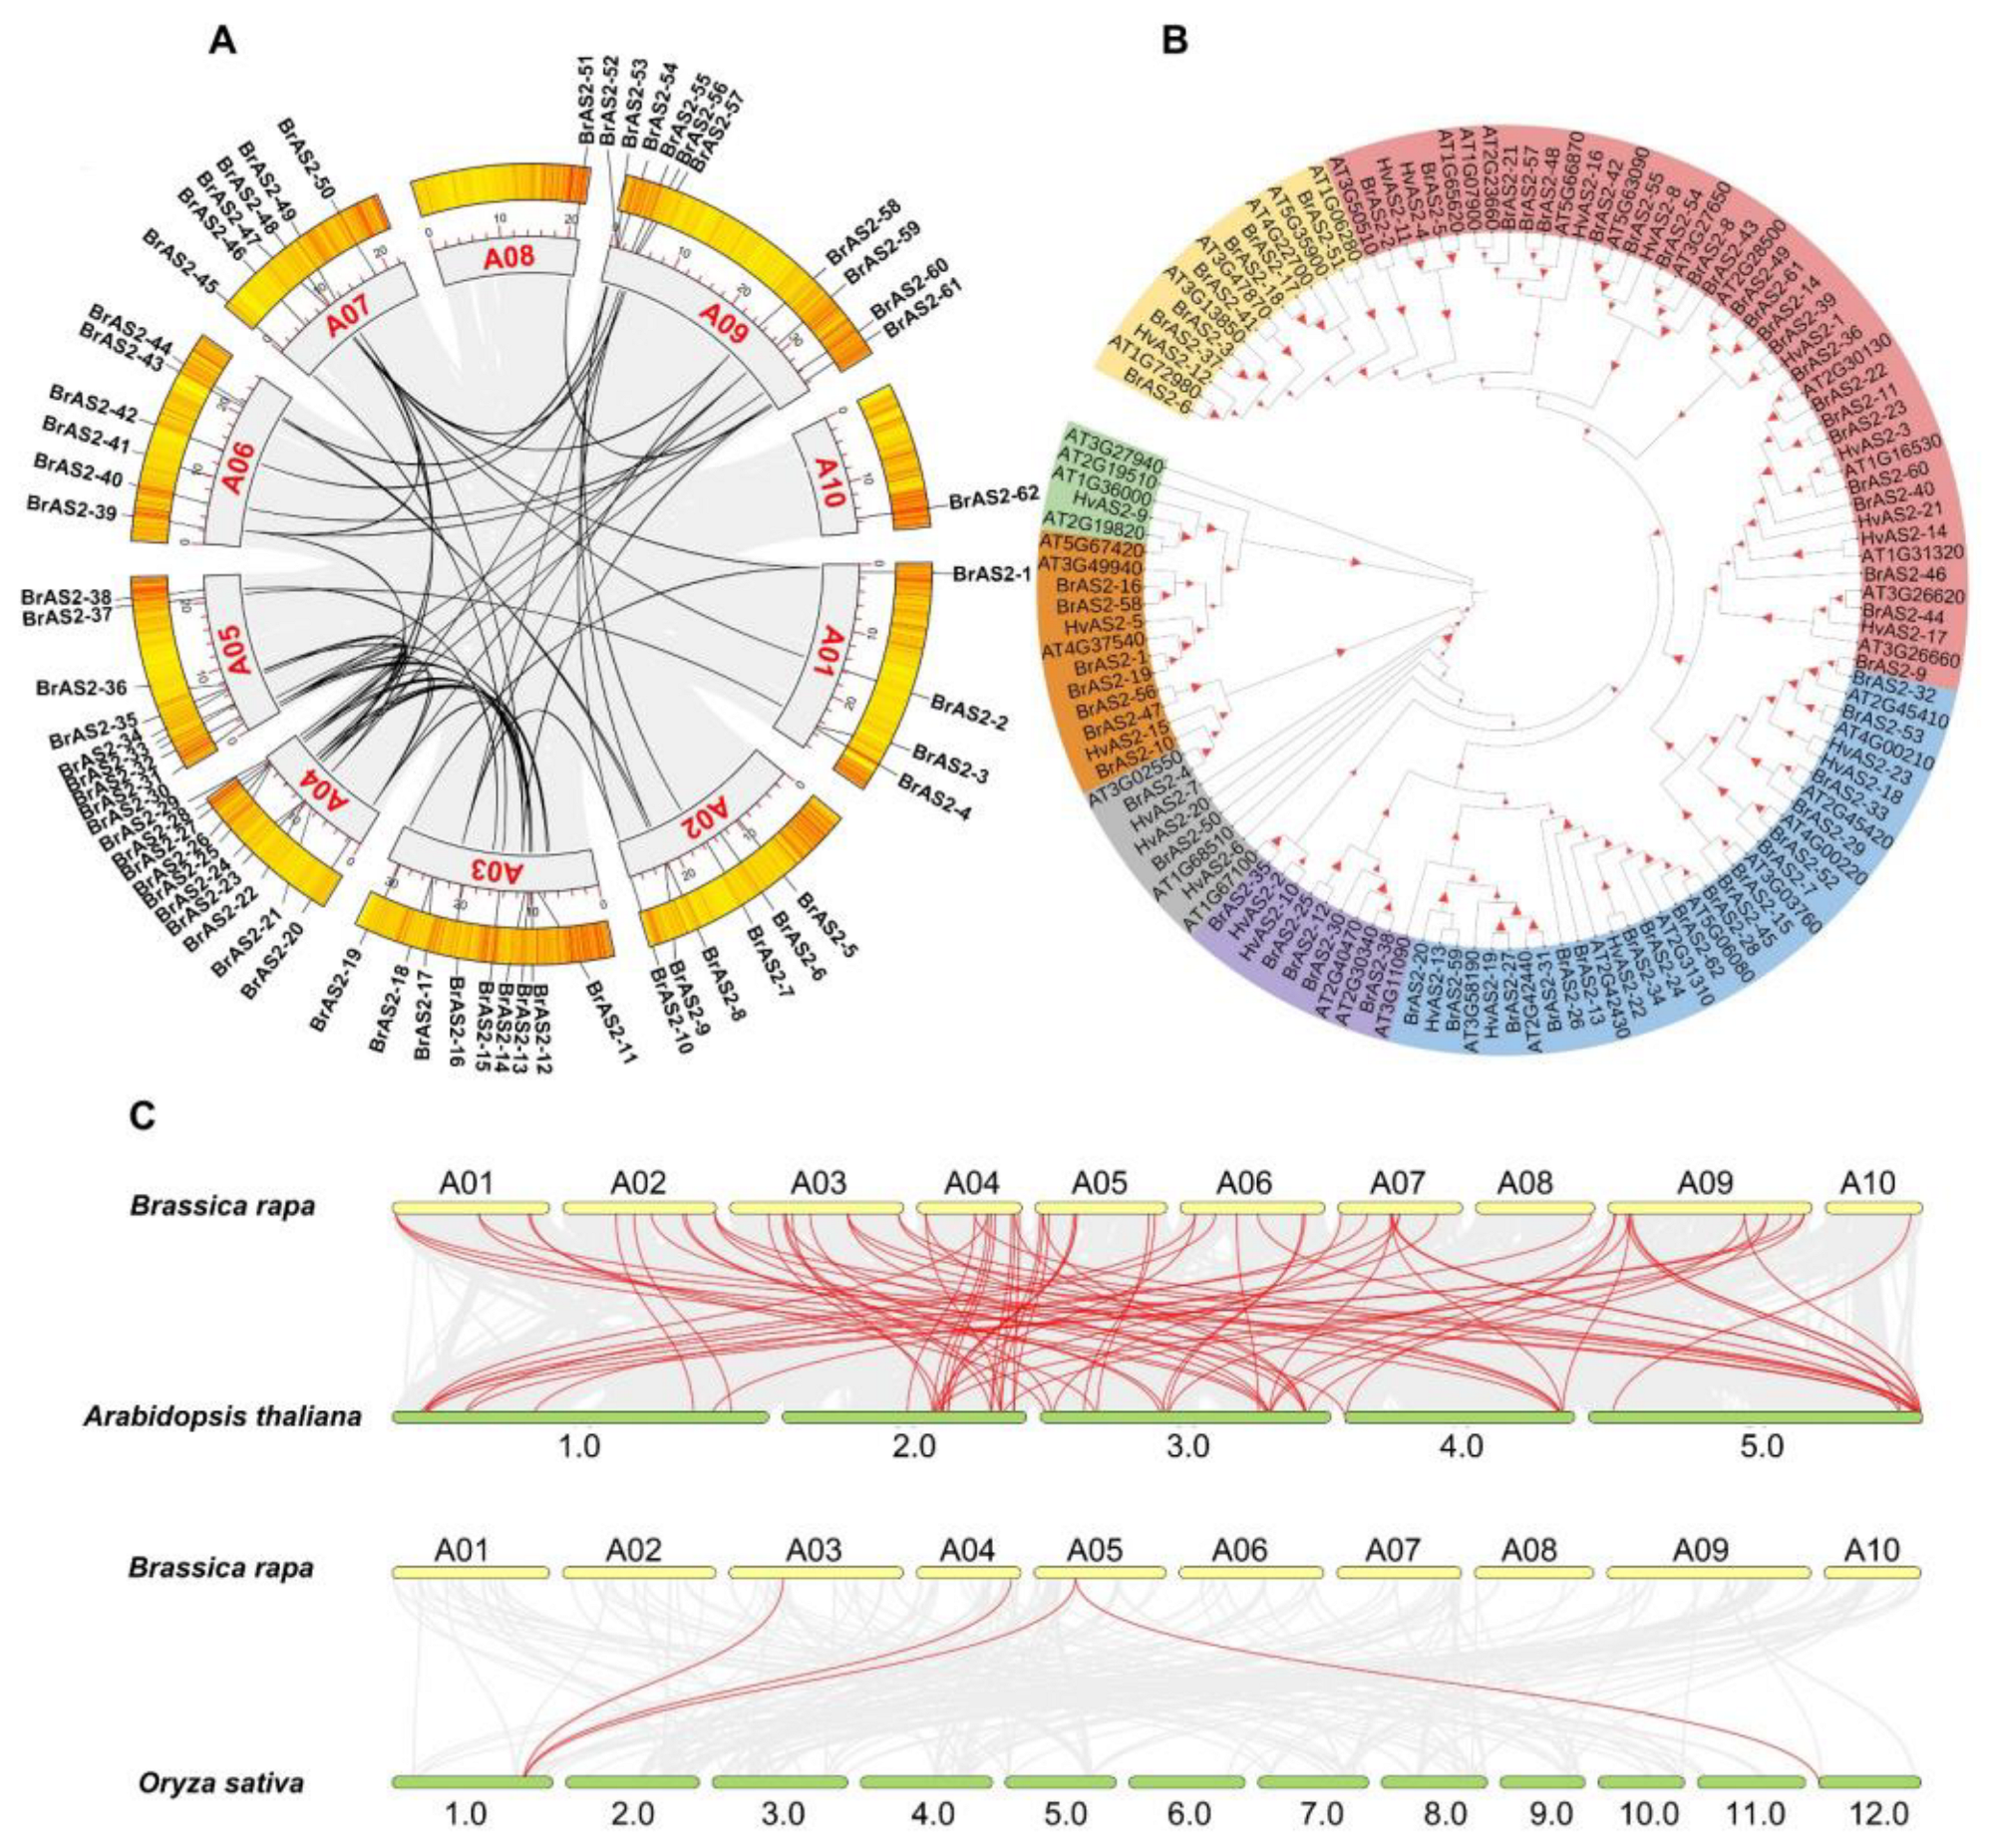
2.2. Phylogenetic Relationships and Synteny Analysis

According to the gff3 genome annotations, 62 BrAS2s were mapped to the B. rapa chromosomes. The BrAS2 genes were extensively dispersed across the 10 chromosomes, as depicted in Figure 1A. Chromosomes 4 and 9 contained the highest density of genes, encompassing 10 genes that constituted 16.1% of all BrAS2 genes, while chromosome 8 harbored only one gene, accounting for 1.61% of all BrAS2 genes. The subclasses were widely and sporadically distributed across the 10 chromosomes, without any particular concentration on a specific chromosome. Additionally, to elucidate the phylogenetic relationships between the BrAS2 genes, we conducted an intraspecific collinearity analysis and found that 5 tandem duplications and 28 chromosome segmental duplications existed in the BrAS2 genes, as shown in Figure 1A and Table S1. The number of segmental duplications was 5.6 times the number of tandem duplications; thus, it is possible that the BrAS2 genes could have expanded in the B. rapa genome through this mechanism. We analyzed the selection of gene pairs in BrAS2 using the Ka/Ks ratio. Ka was much less than Ks (Ka/Ks < 1) for nearly all segmentally duplicated gene pairs, indicating that the replicated gene pairs had undergone strong purifying selection; the Ka/Ks ratio was highest for BrAS2-9/BrAS2-44 (0.47), as shown in Table S1, which confirmed the amplification of the AS2 genes in two modes during evolution, namely fragment replication and tandem replication. To understand the kinship and evolutionary characteristics among the BrAS2 family members, evolutionary trees of the AS2 gene in B. rapa, A. thaliana, and H. vulgare were constructed based on sequence similarity, as described in Figure 1B. We compared the aa sequences of the AS2 proteins in A. thaliana, B. rapa, and H. vulgare, and constructed a phylogenetic tree of the AS2 gene family among A. thaliana, B. rapa, and H. vulgare, using the neighbor-joining algorithm. We classified the BrAS2 genes into six subgroups of Ia, Ib, Ic, Id, IIa, and IIb, which contained 23, 5, 18, 7, 7, and 2 genes, respectively. Synteny analysis is a critical analytical strategy in comparative genomics used to assess the molecular evolutionary relationships between species [34]. We conducted a collinear analysis between B. rapa and A. thaliana, as well as between B. rapa and O. sativa, as shown in Figure 1C. The findings revealed that B. rapa and A. thaliana exhibited greater homology than B. rapa and O. sativa, suggesting that the genes may have similar biological functions, providing a direction to explore the functions of BrAS2 genes.

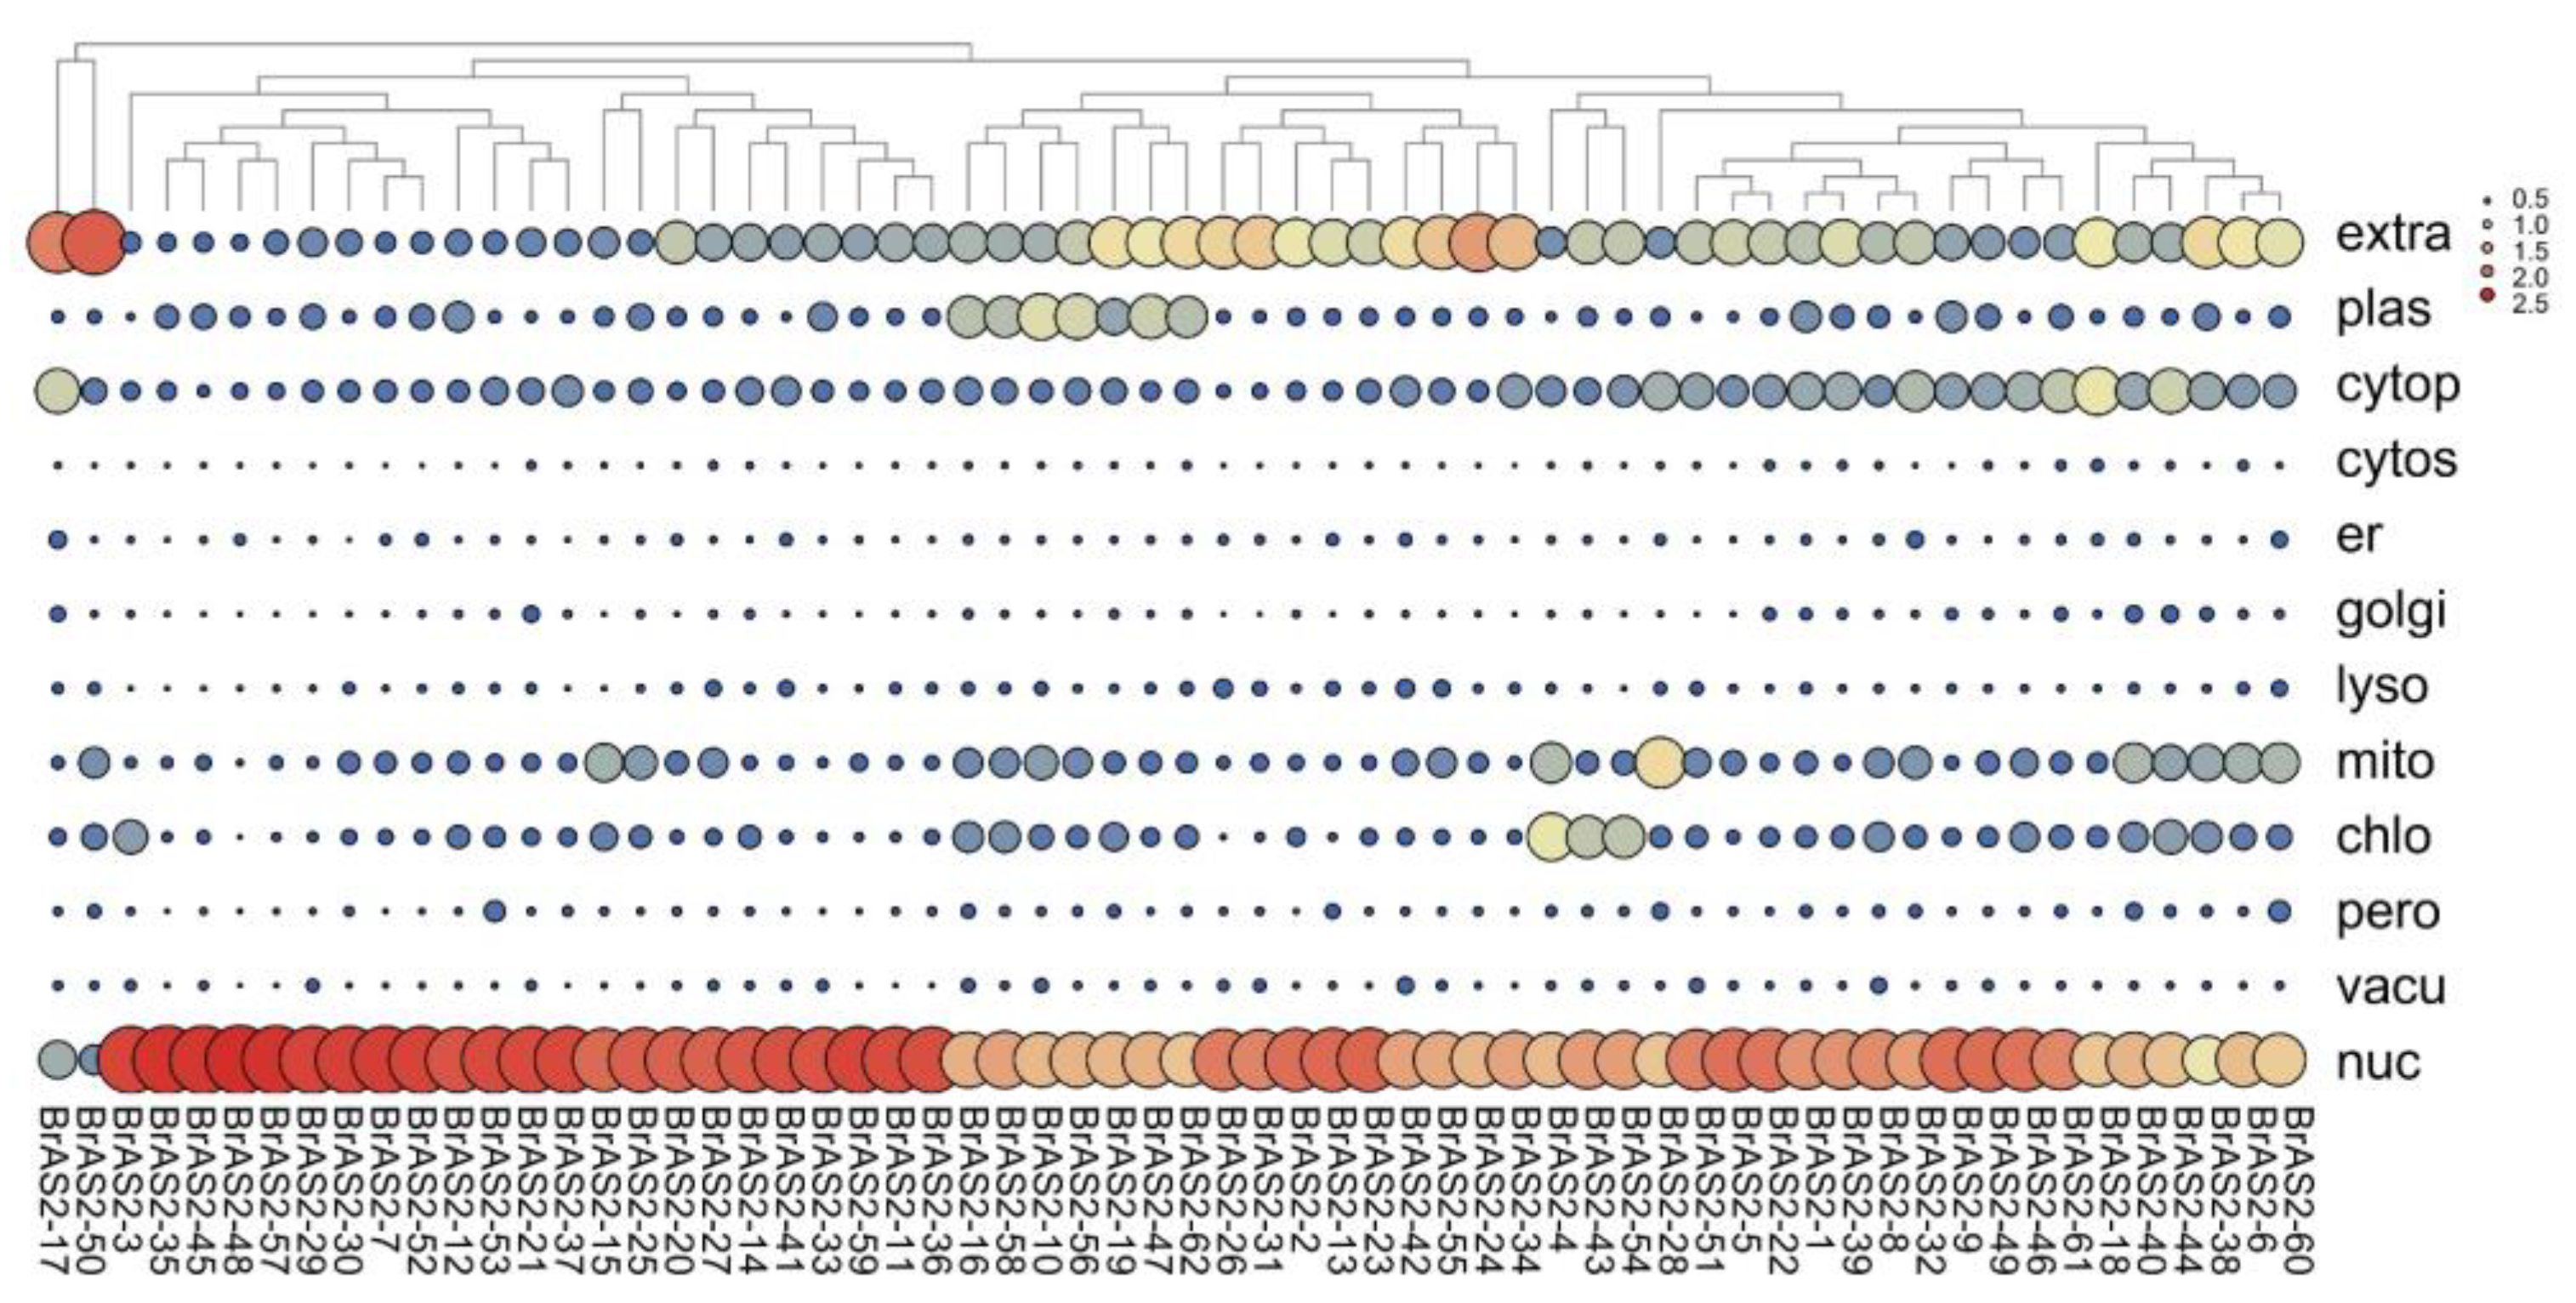
2.3. Subcellular Localization Analysis

To determine the subcellular localization of the 62 BrAS2 genes and lay a foundation for comprehending the mechanics of gene function, we employed the PSORT online tool for subcellular localization analysis, as shown in Figure 2. Our findings revealed that the majority of the BrAS2 genes were distributed in the nucleus, while BrAS2-17, BrAS2-38, BrAS2-50, and BrAS2-24 were situated extracellularly. As plant-specific transcription factors, the AS2 gene family may serve as a pivotal player within the nucleus.

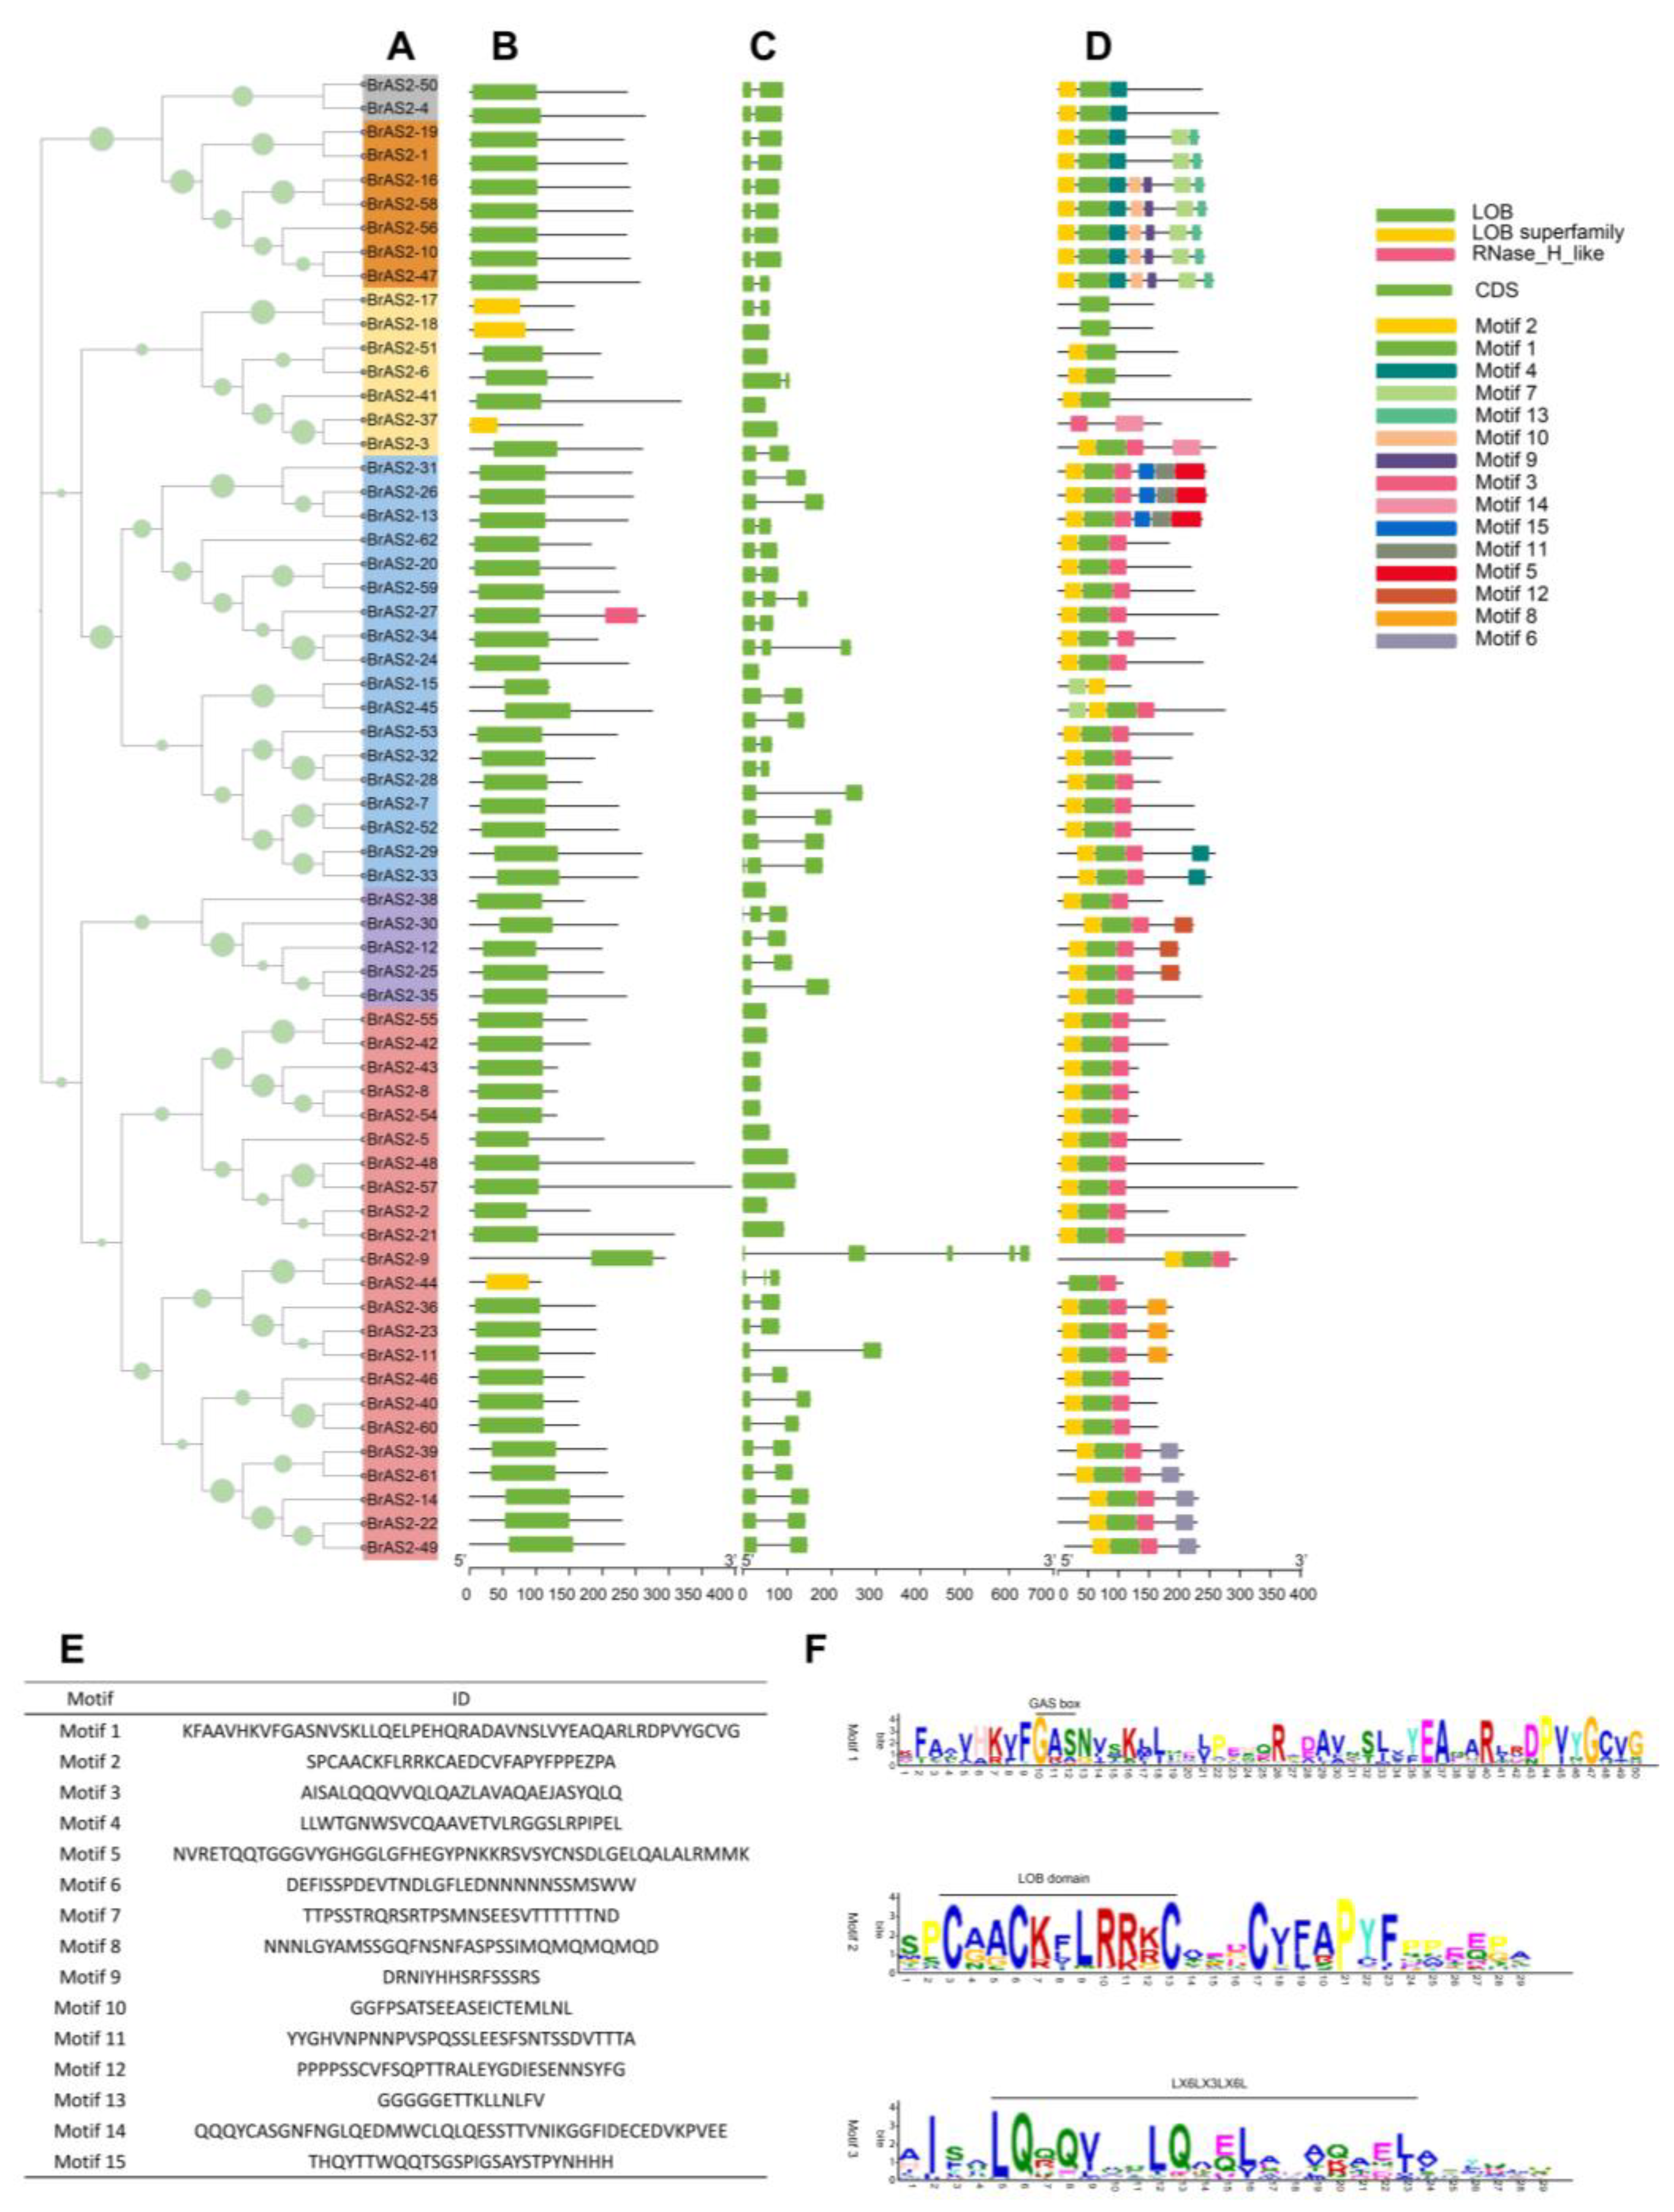
2.4. Gene Structure and Conserved Motif Analysis

To analyze the similarities and differences in the BrAS2 genes at the nucleic acid and protein levels and to speculate on the structural, functional, and evolutionary relationships among these genes, we visualized the conserved domains and scrutinized the exon-intron architecture of the BrAS2 genes. The phylogenetic tree of the 62 BrAS2 genes was divided into six branches, as shown in Figure 3A. Genetic structure analysis revealed that the number of exons in the BrAS2 genes ranged from 1 to 5, as depicted in Figure 3C. We predicted 15 conserved BrAS2 gene motifs, as described in Figure 3D. The results of the conserved motifs analysis of the BrAS2 proteins showed that motif1 and motif2 were highly conserved, with 96.8% and 93.5% of the genes containing these two motifs, respectively. In addition, motif 3 contained a leucine zipper-like structure, as revealed in Figure 3E, which facilitates specific binding with target proteins and promotes protein interactions. More intriguingly, further comparative analysis of the motifs revealed that motif7 and motif13 could contribute to the functional diversity of the BrAS2 gene family, as they were specifically harbored in all members of the IIa subfamily, and the expression levels of many of their members varied under different treatments. The number, type, and arrangement of the BrAS2 gene motifs located on the same branch were similar, and the functional differences in BrAS2 genes may be due to differences in the distribution of the conserved motifs. These findings agreed with our gene structural analysis and confirmed the subfamily division of the BrAS2 genes.

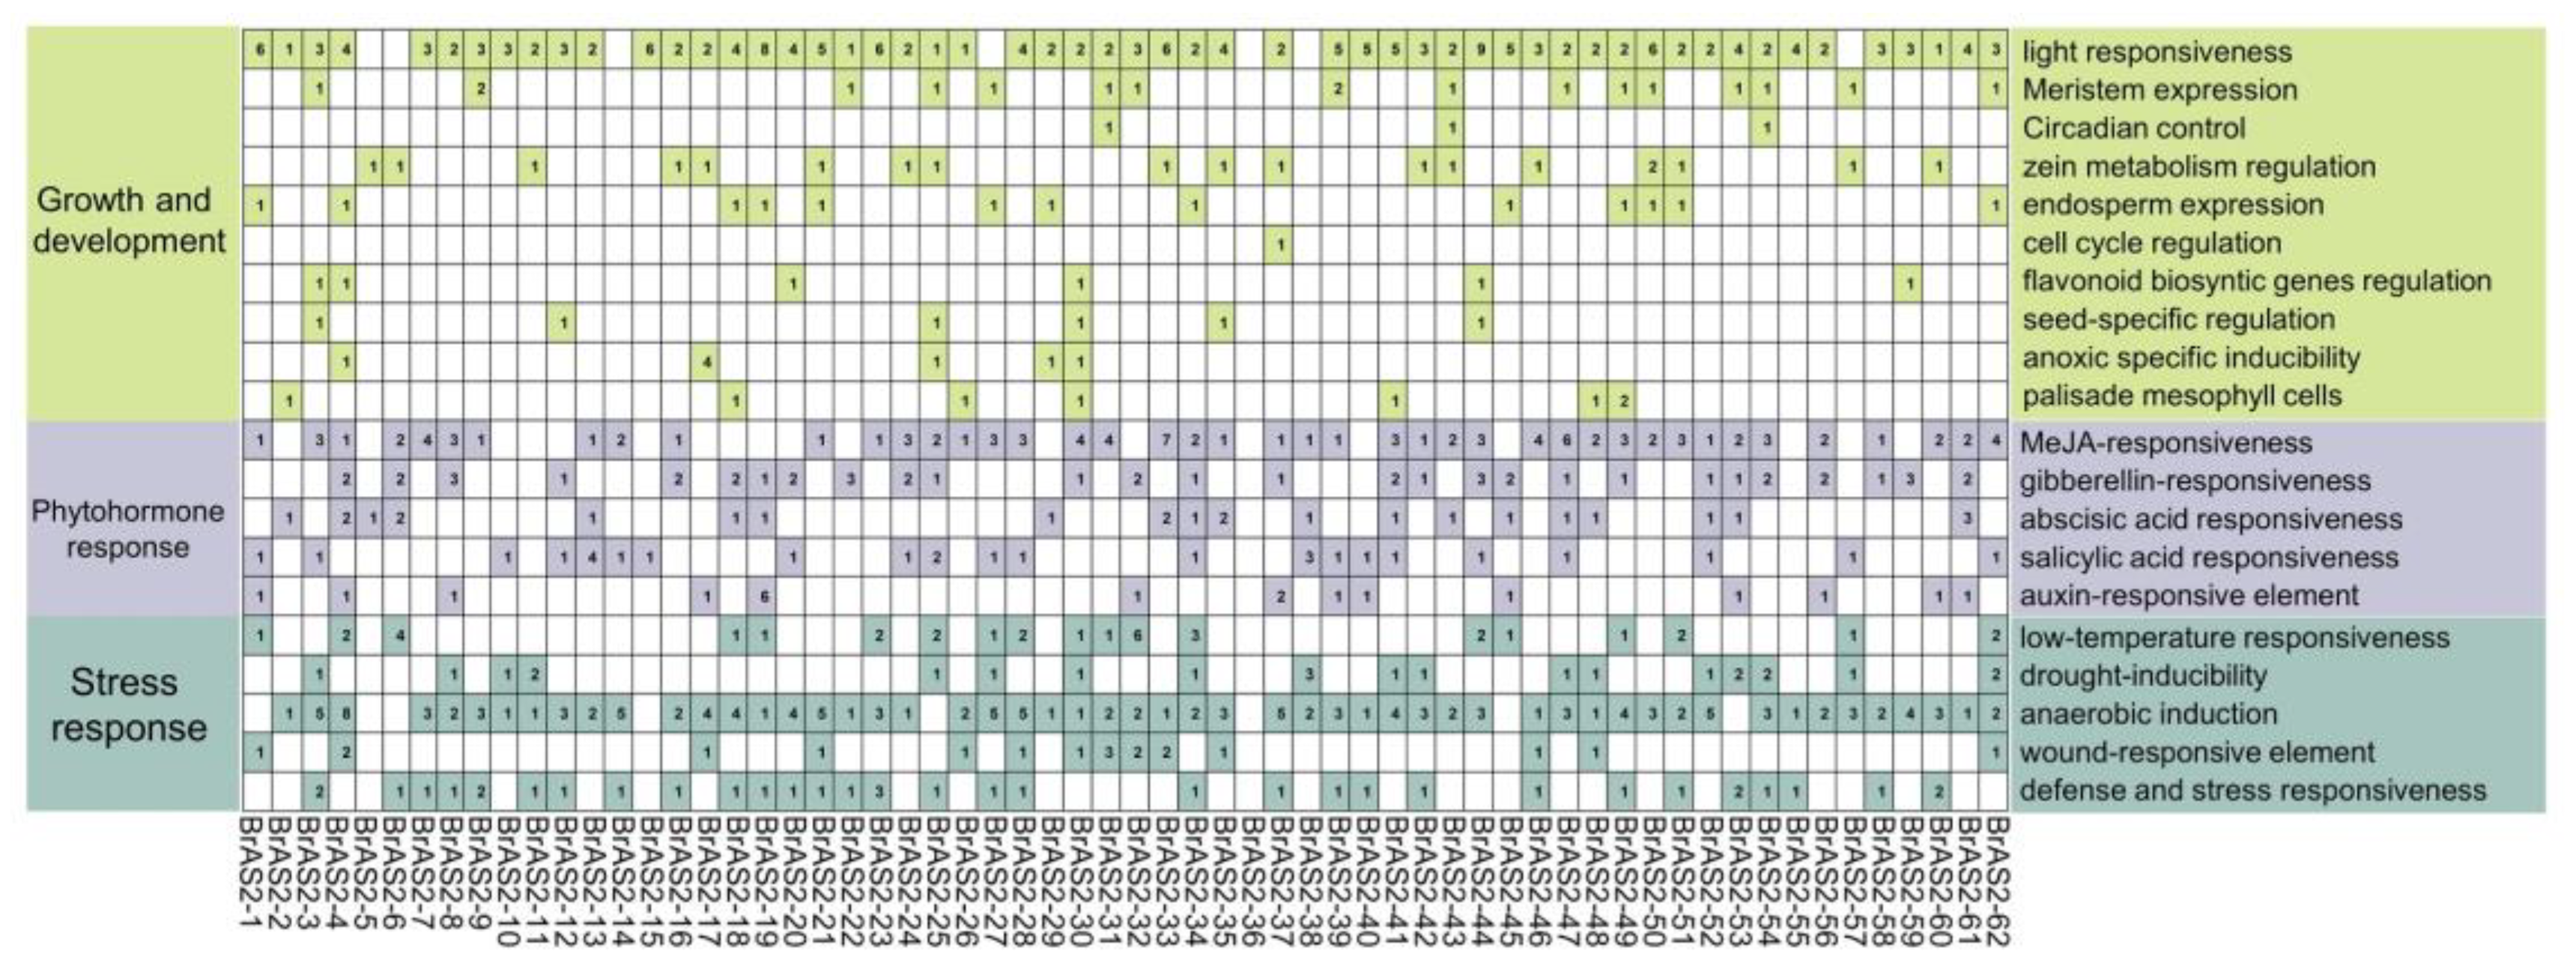
2.5. cis-Element Analysis
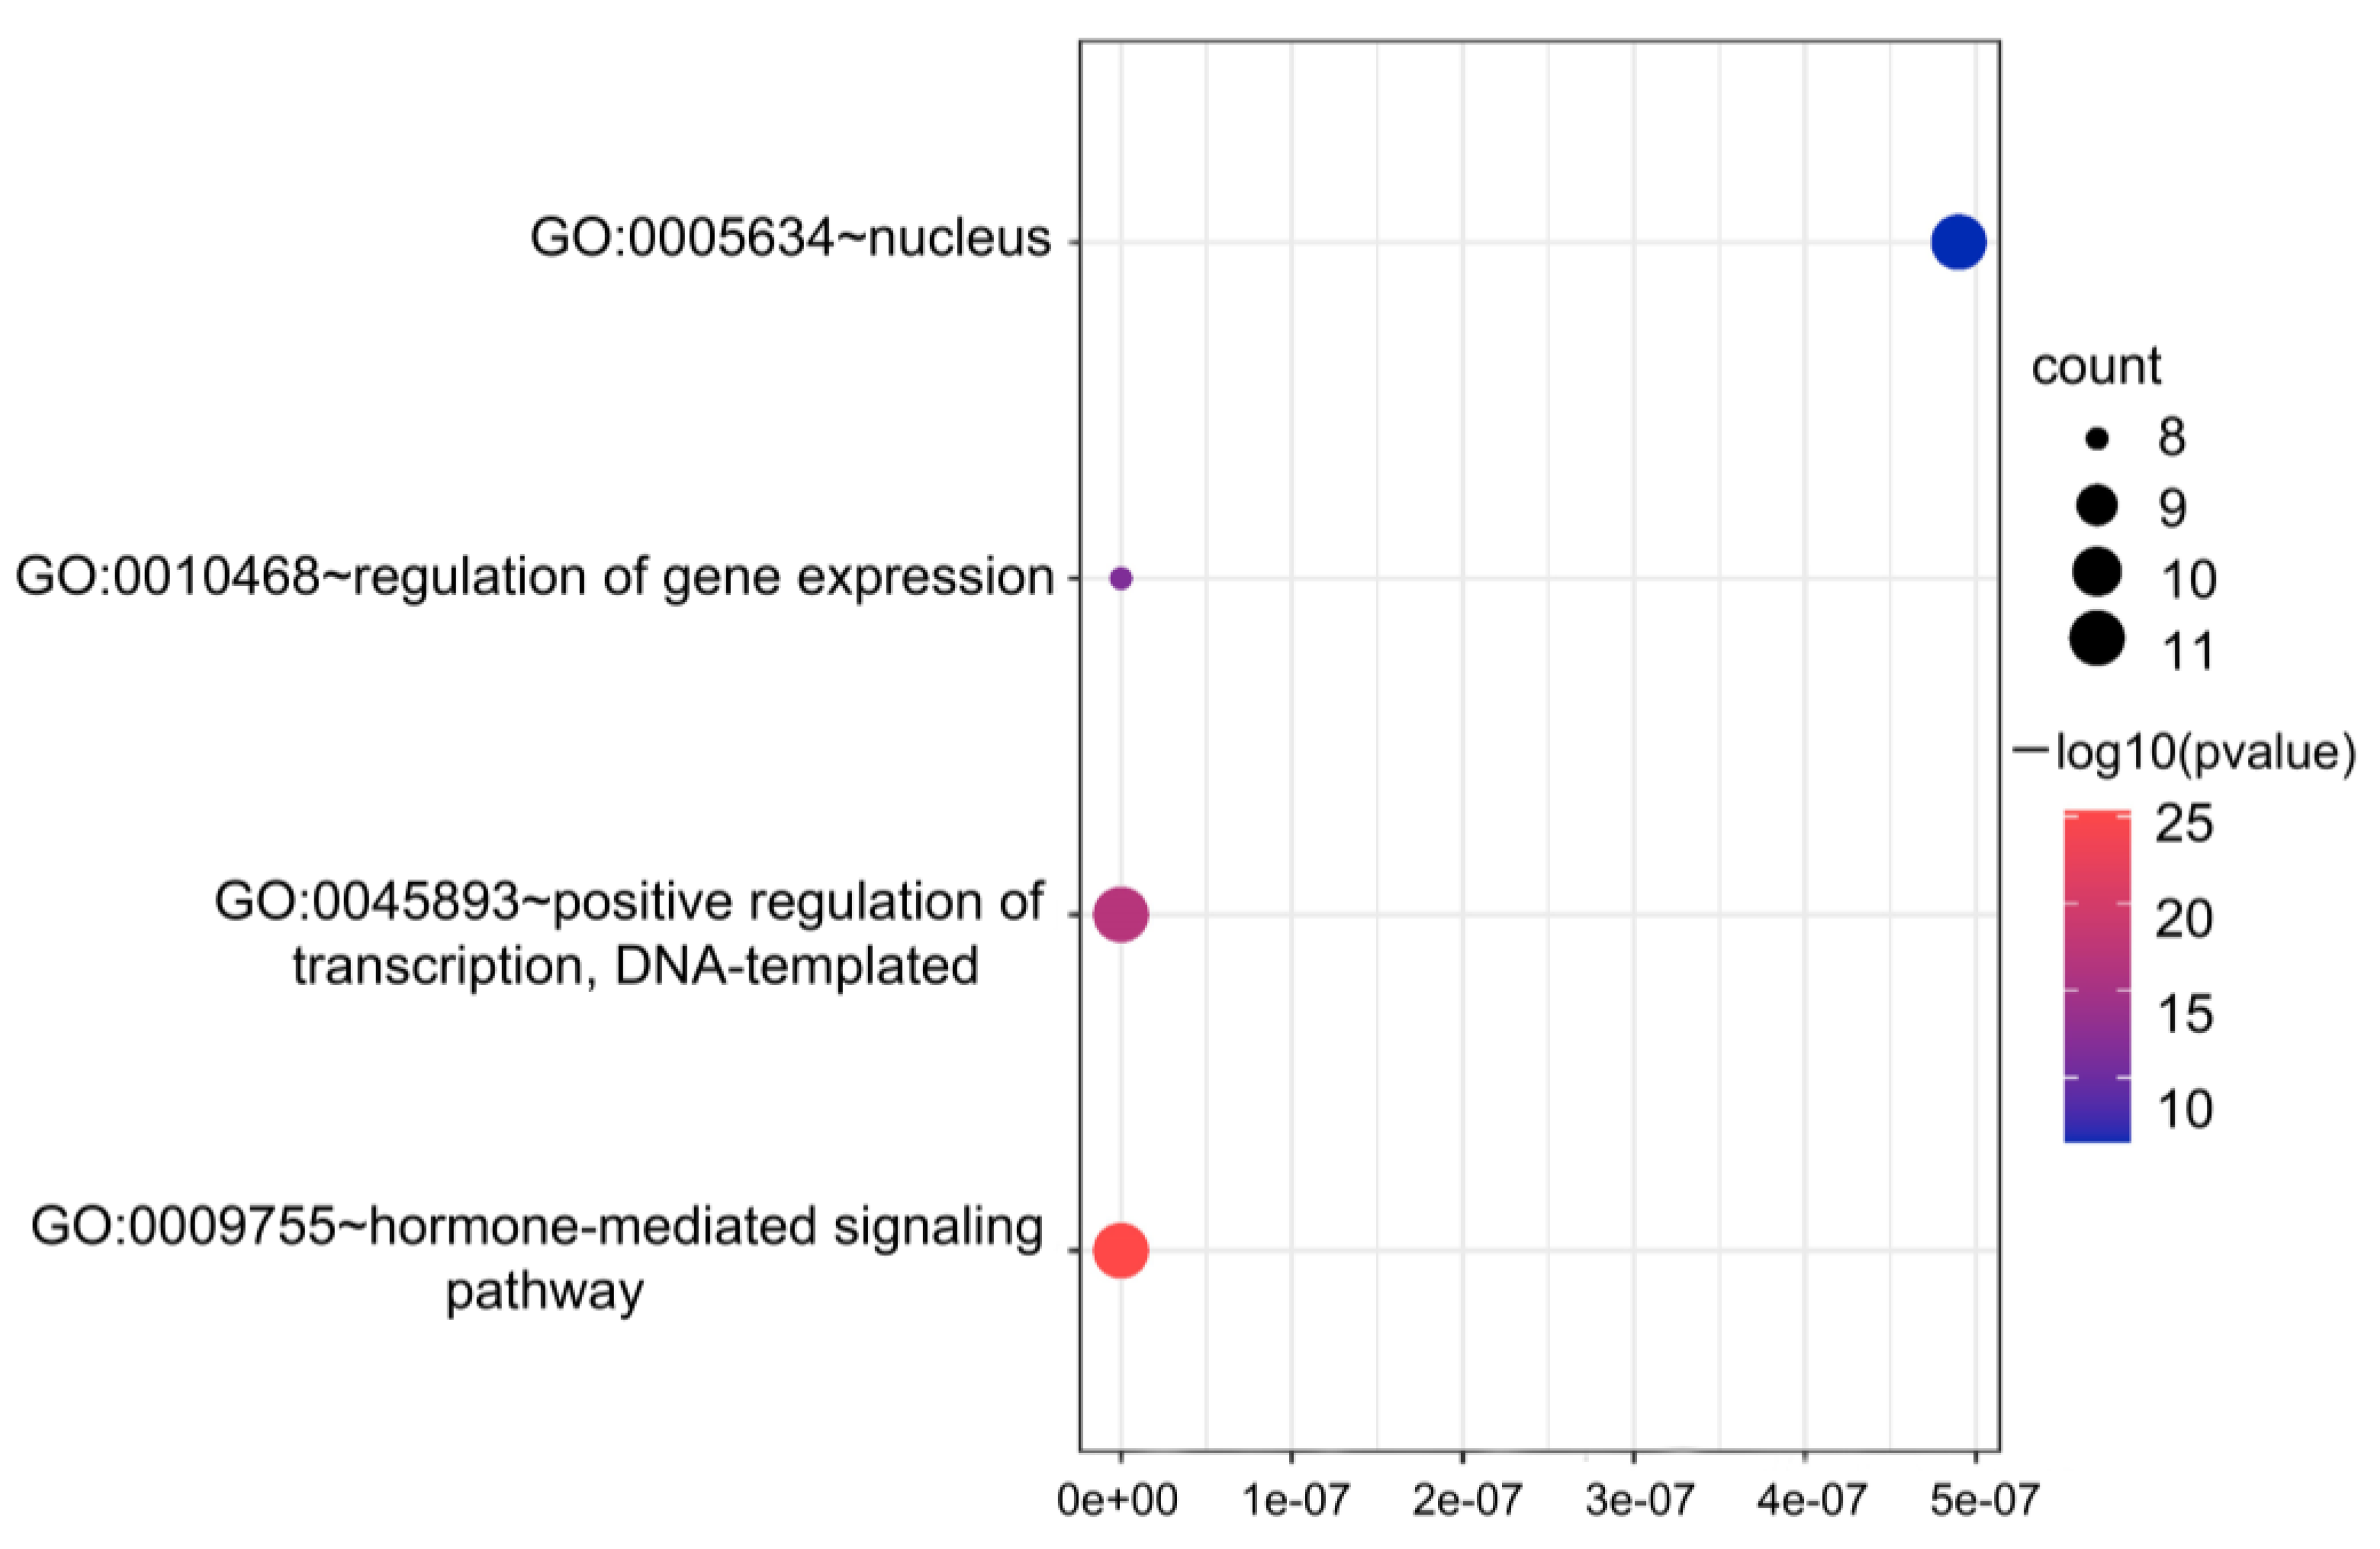
To understand the mechanisms by which BrAS2 genes mediate the responses to abiotic stress, the 2000-bp upstream region of the BrAS2 coding sequences was utilized to predict the cis-elements. Among the 62 BrAS2 genes, 746 cis-acting elements were revealed, comprising 20 distinct types, as described in Figure 4, and encompassing the growth and developmental response, phytohormone response, and the stress response. All of the BrAS2 genes contained cis-elements, except BrAS2-36, with BrAS2-4 containing the largest (up to 25). In addition, these cis-elements included hormone-related elements, such as the methyl jasmonic acid (MeJA) response element and the salicylic acid response element, and stress response elements, such as cold stress, drought-induced, mechanical injury, and anaerobic-induced response elements. These sequence motifs may act as cis-elements, putatively participating in hormone-mediated regulation of the promoters. Notably, the light response element proved to be the most prevalent among these elements, appearing in 89% of genes, accounting for 24.1% (180) of the total. Additionally, anaerobic induction elements were discovered in 87% (54) of the genes, comprising 19.6% of the total, while MeJA response elements were identified in 69% (43) of the genes, accounting for 45% of the total number of hormone-responsive elements. These statistics indicate that BrAS2 genes may play a vital role in abiotic stress and hormone responses.

2.6. GO Analysis

Annotating and conducting an enrichment analysis on the BrAS2 genes allowed correlation with actual biological processes and specific signaling pathways. Therefore, a functional analysis was conducted using GO annotation and enrichment terms, including molecular functions (MF), cellular components (CC), and biological processes (BP). Unfortunately, the MF family was not enriched, as shown in Figure 5 and Table S2. However, the GO-CC enrichment results identified one enriched term, specifically the nucleus (GO:0005634). The GO-BP enrichment results revealed three enriched terms of positive regulation of DNA templated transfer (GO:0045893), regulation of gene expression (GO:0010468), and hormone-mediated signaling pathways (GO:0009755). Remarkably, 11 BrAS2s genes were enriched in the hormone-mediated signaling pathways with a low p-value and high confidence. Additionally, 11 genes were enriched in the regulation of translation and DNA templated transfer, 11 genes were enriched in the nucleus, and 8 genes were enriched in the regulation of gene expression.

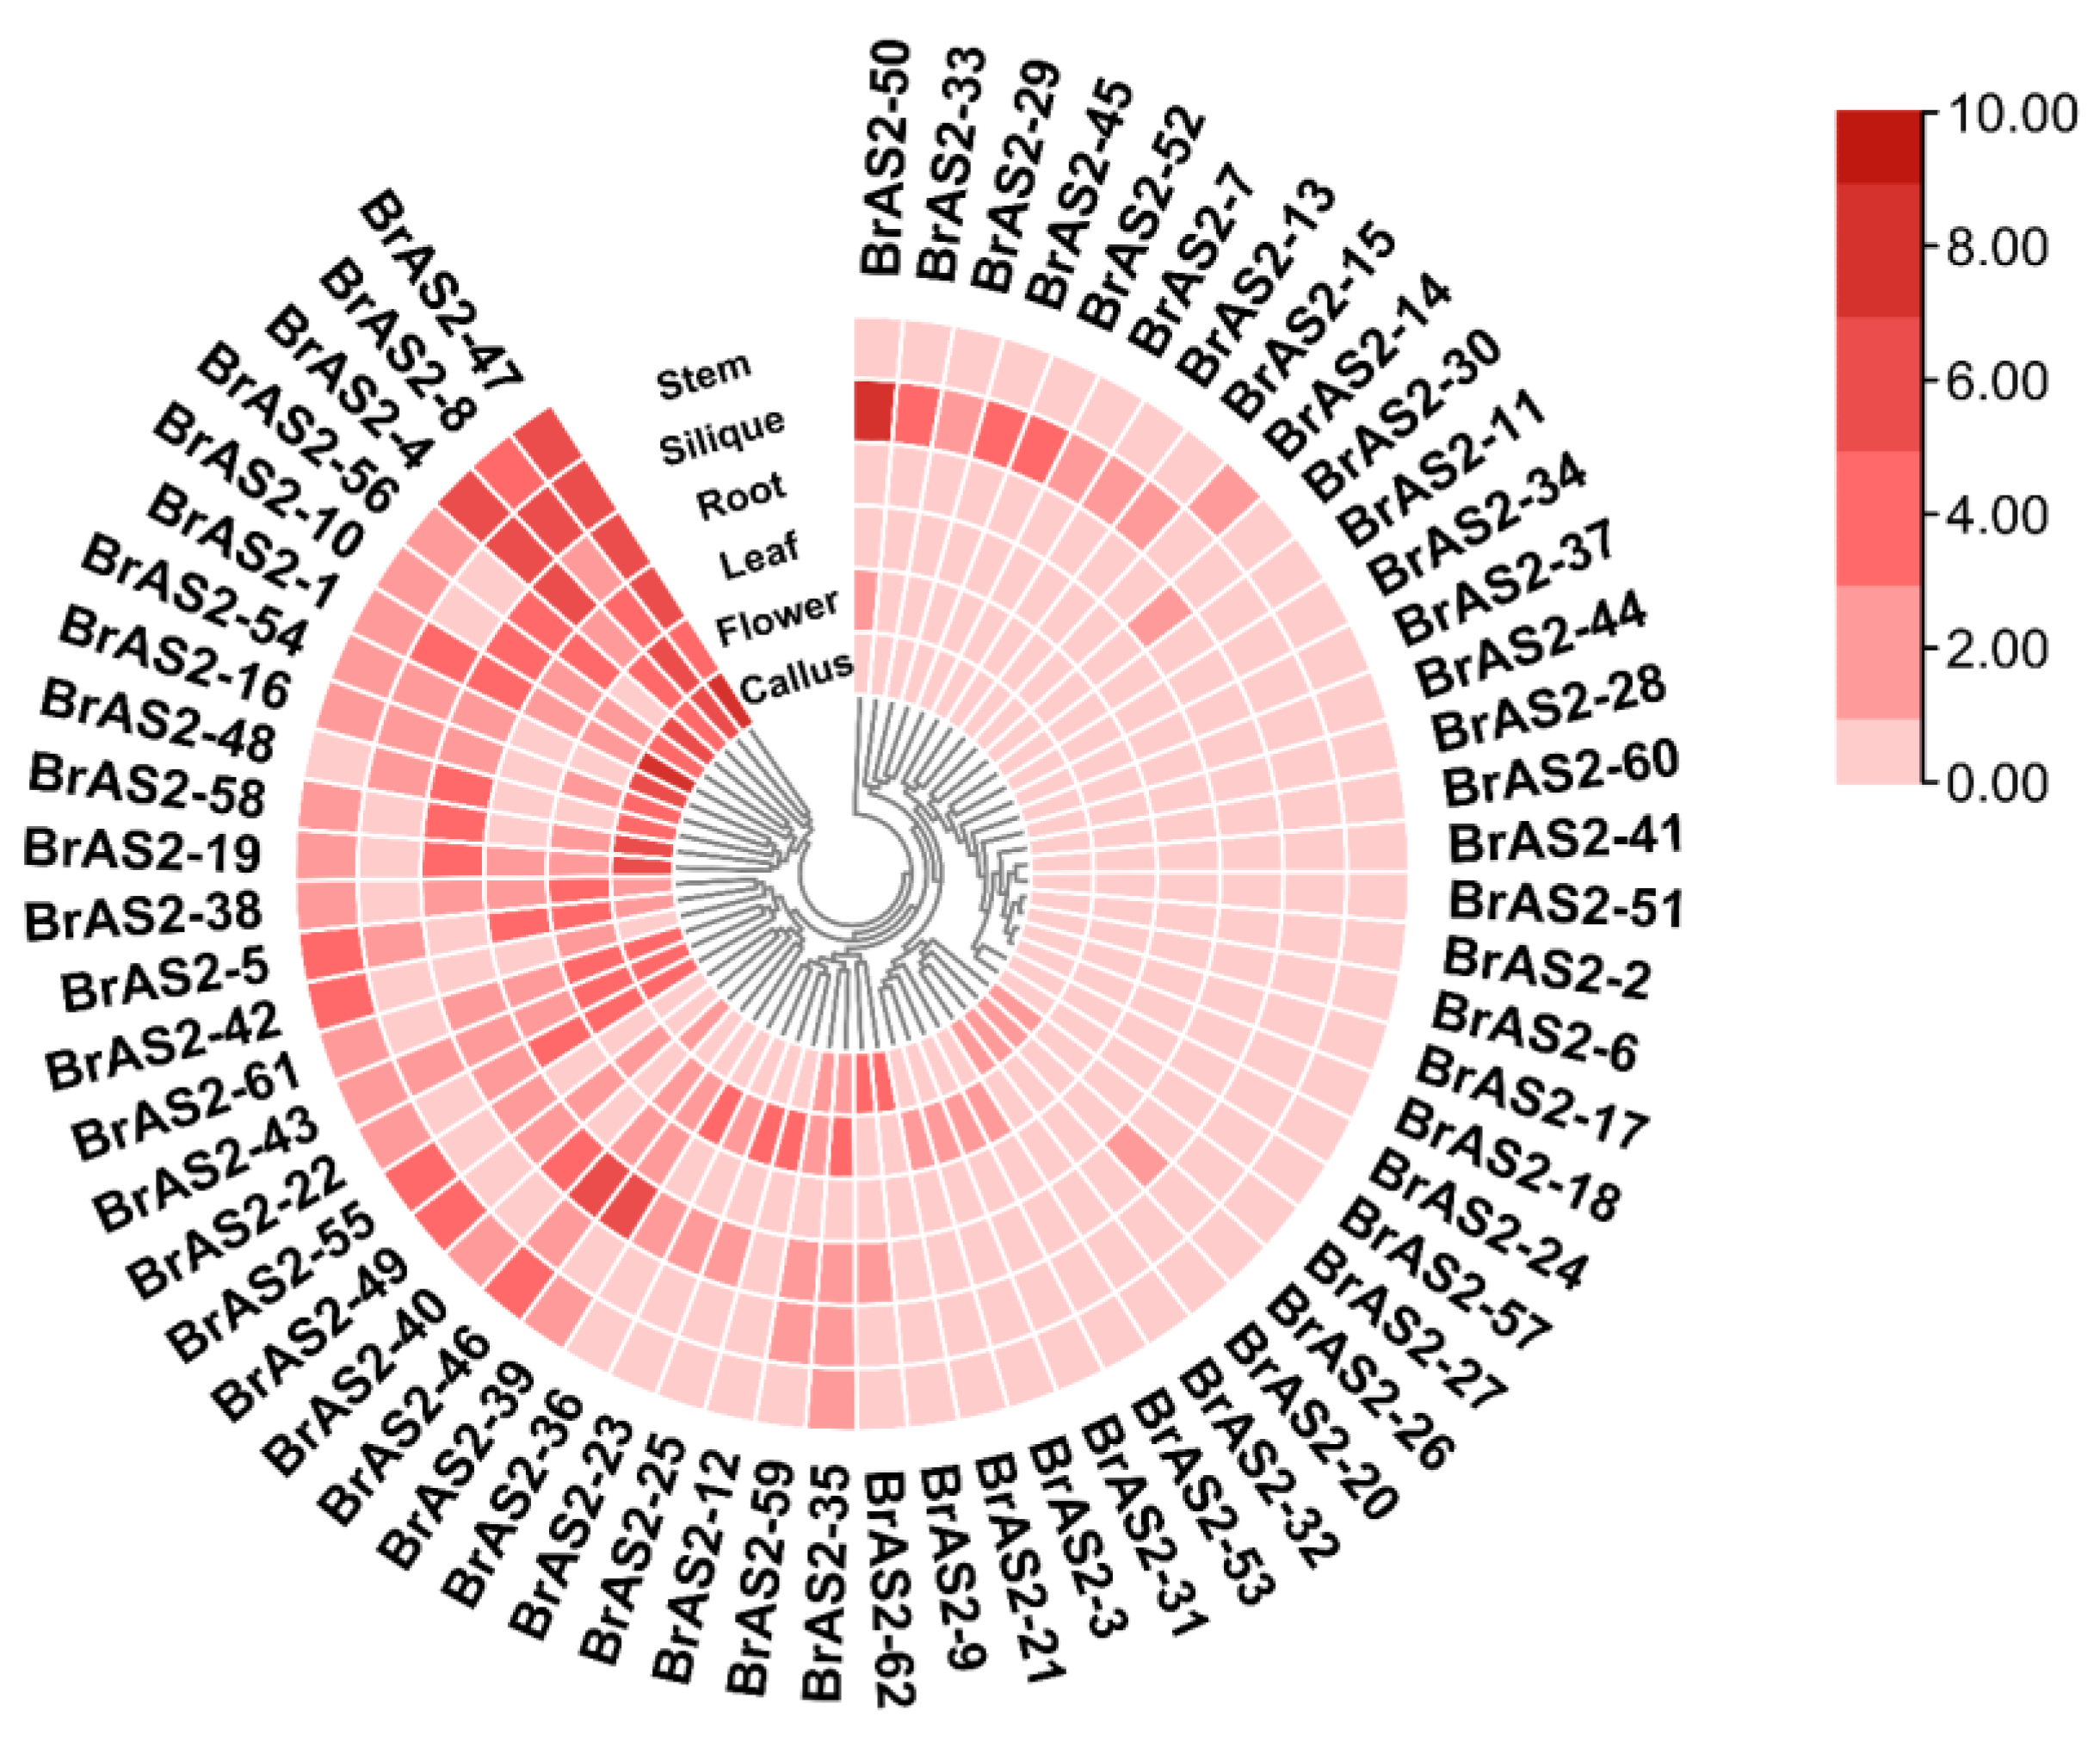
2.7. Tissue-Specific Expression Analysis

To investigate the spatial expression characteristics and potential functions of BrAS2 genes, we examined transcriptome data from various tissues, as shown in Figure 6 and Table S3. Our findings revealed that BrAS2-47 exhibited a high expression level in all tissues, indicating its involvement in a wide array of developmental and regulatory processes. In contrast, AS2-50 was exclusively expressed in siliques, suggesting its potential role in fruit development. BrAS2-4, BrAS2-46, BrAS2-10, and BrAS2-39 exhibited high expression levels in roots, suggesting their potential functionality in responding to abiotic stresses, such as salt and drought. BrAS2-8 and BrAS2-43 displayed high expression levels in flowers, which may be related to their developmental process. Our results suggested that BrAS2 genes not only regulate meristem development but also participate in the development of rhizomes and leaves, environmental responses, and sexual reproduction (as evidenced by the highly expressed genes in flowers).

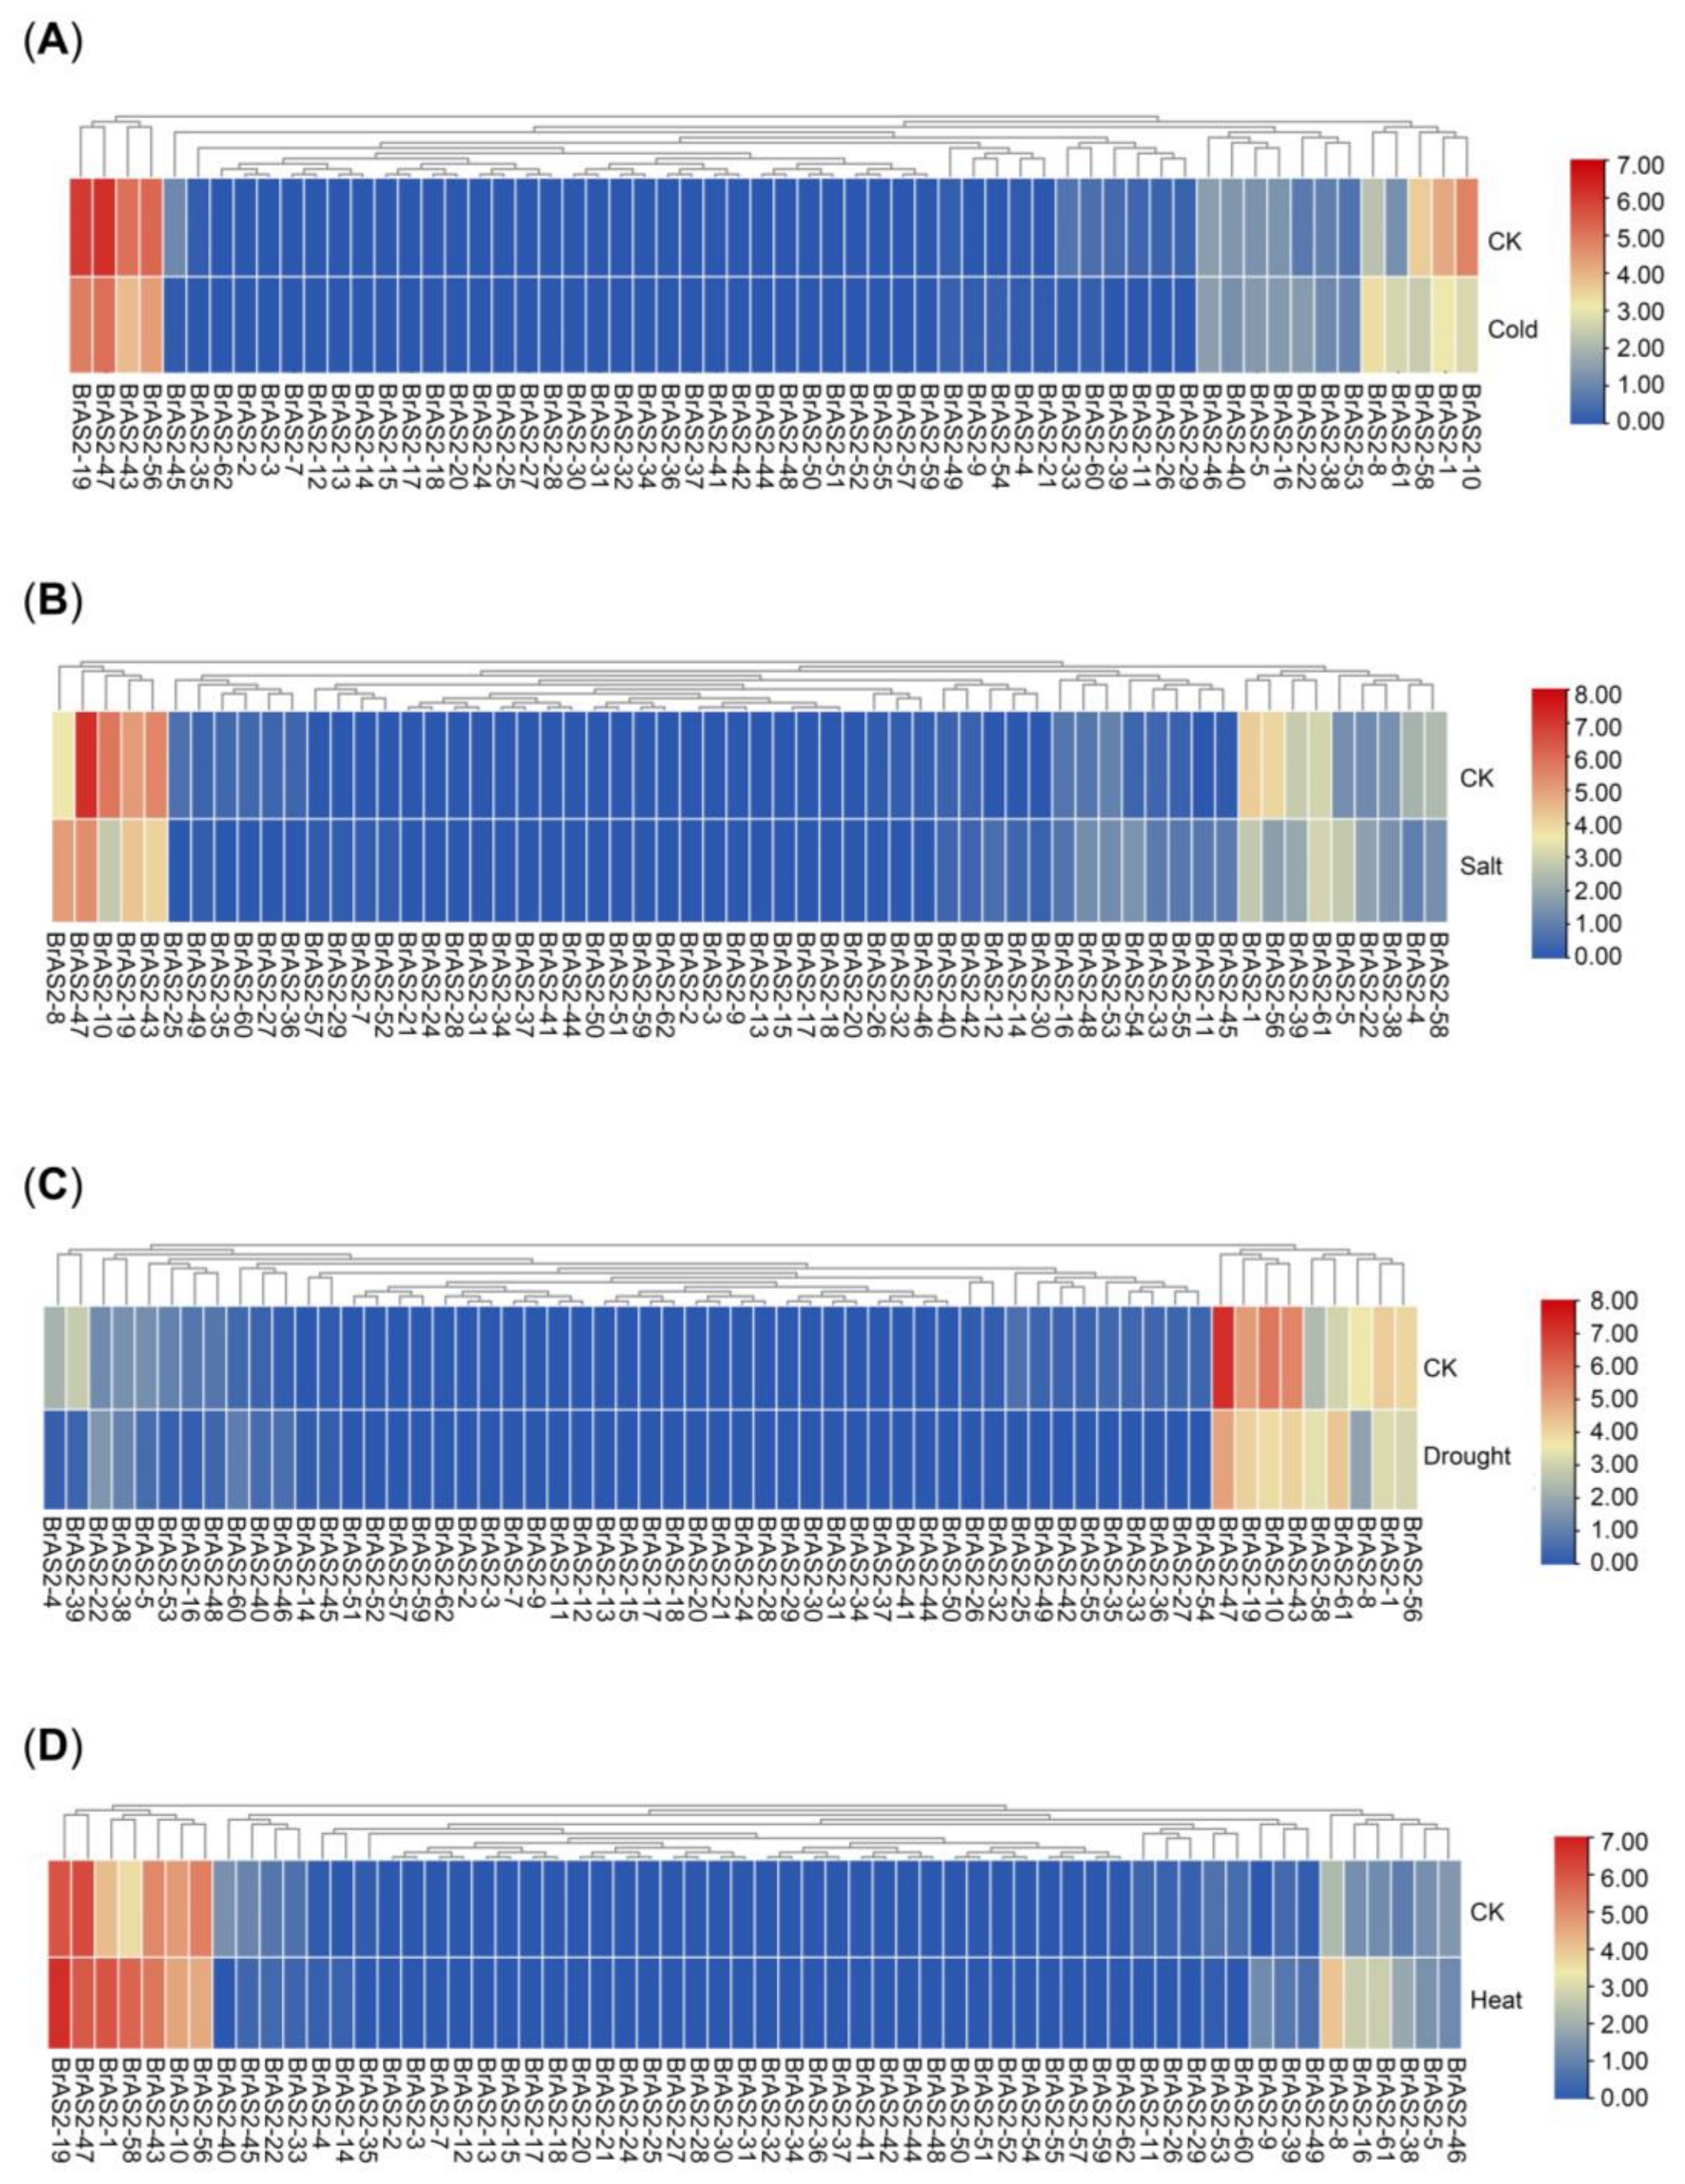
2.8. Expression Patterns in Response to Abiotic Stress Analysis

Based on a transcriptome data analysis of B. rapa subjected to cold, salt, drought, and heat treatments, as depicted in Figure 7A–D and Table S4, the expression levels of BrAS2-47 and BrAS2-10 decreased significantly under cold, salt, and drought treatments. Furthermore, the expression level of BrAS2-56 decreased remarkably under salt stress, while that of BrAS2-58 increased significantly under heat stress. Collectively, these findings strongly suggest that these genes play a role in counteracting abiotic stress.

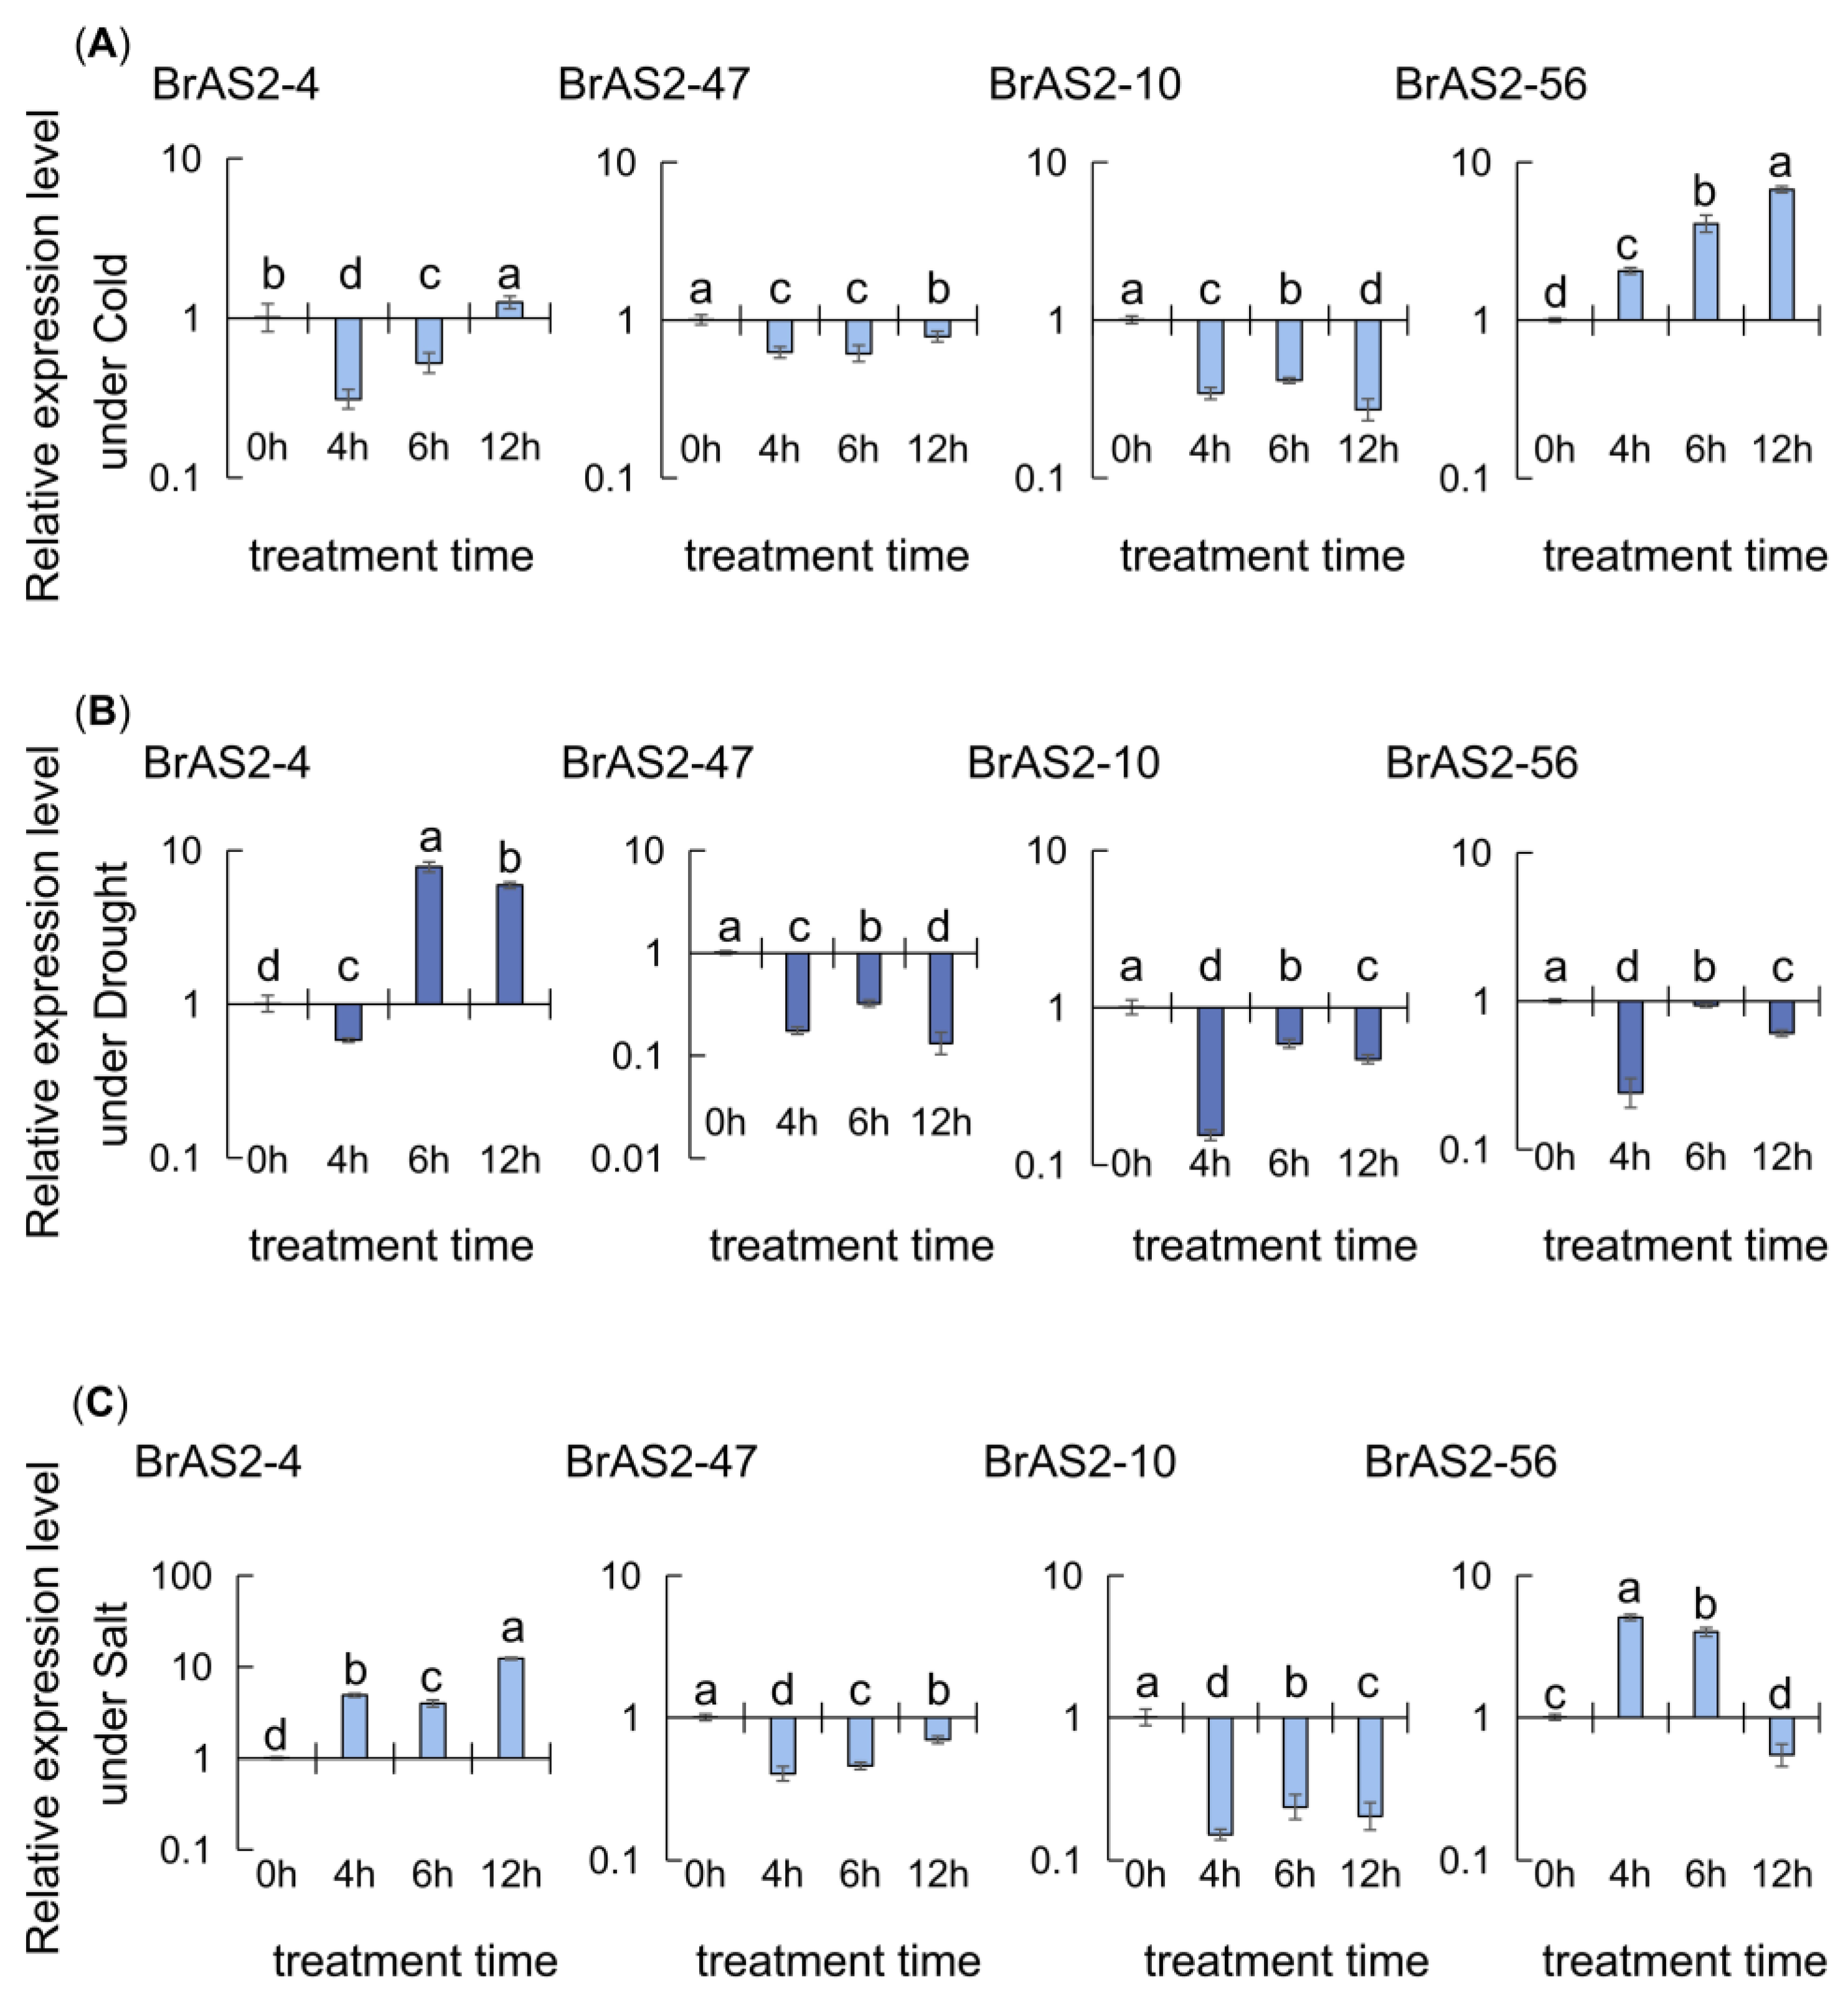
2.9. RT-qPCR Analysis

For further screening of key genes in the BrAS2 gene family in response to stress, we selected the most potentially functional genes from the RNA-seq analysis for RT-qPCR examination. During the cold treatment, as depicted in Figure 8A, the relative expression levels of BrAS2-47 and BrAS2-10 were consistently downregulated at all time points, while the expression of BrAS2-56 increased gradually, peaking at 12 h. BrAS2-4 expression was initially downregulated, reaching its lowest point after 4 h, and then continuously increased until 12 h. Under the drought treatment, as shown in Figure 8B, BrAS2-47 and BrAS2-10 exhibited identical trends, while the expression patterns of BrAS2-56 and BrAS2-4 decreased from 0 to 4 h and from 6 to 12 h. The expression level of BrAS2-56 was lower at 6 h than at 0 h, while the opposite was true for BrAS2-4. During the salt treatment, as revealed in Figure 8C, BrAS2-47 and BrAS2-10 demonstrated similar trends, while the expression of BrAS2-56 increased significantly, peaking at 4 h, and then decreased until 12 h. The BrAS2-4 expression initially increased, then decreased, and then increased again, reaching its maximum at 12 h. Interestingly, among these four genes, BrAS2-47 and BrAS2-10 were downregulated in relative expression under all three stresses.

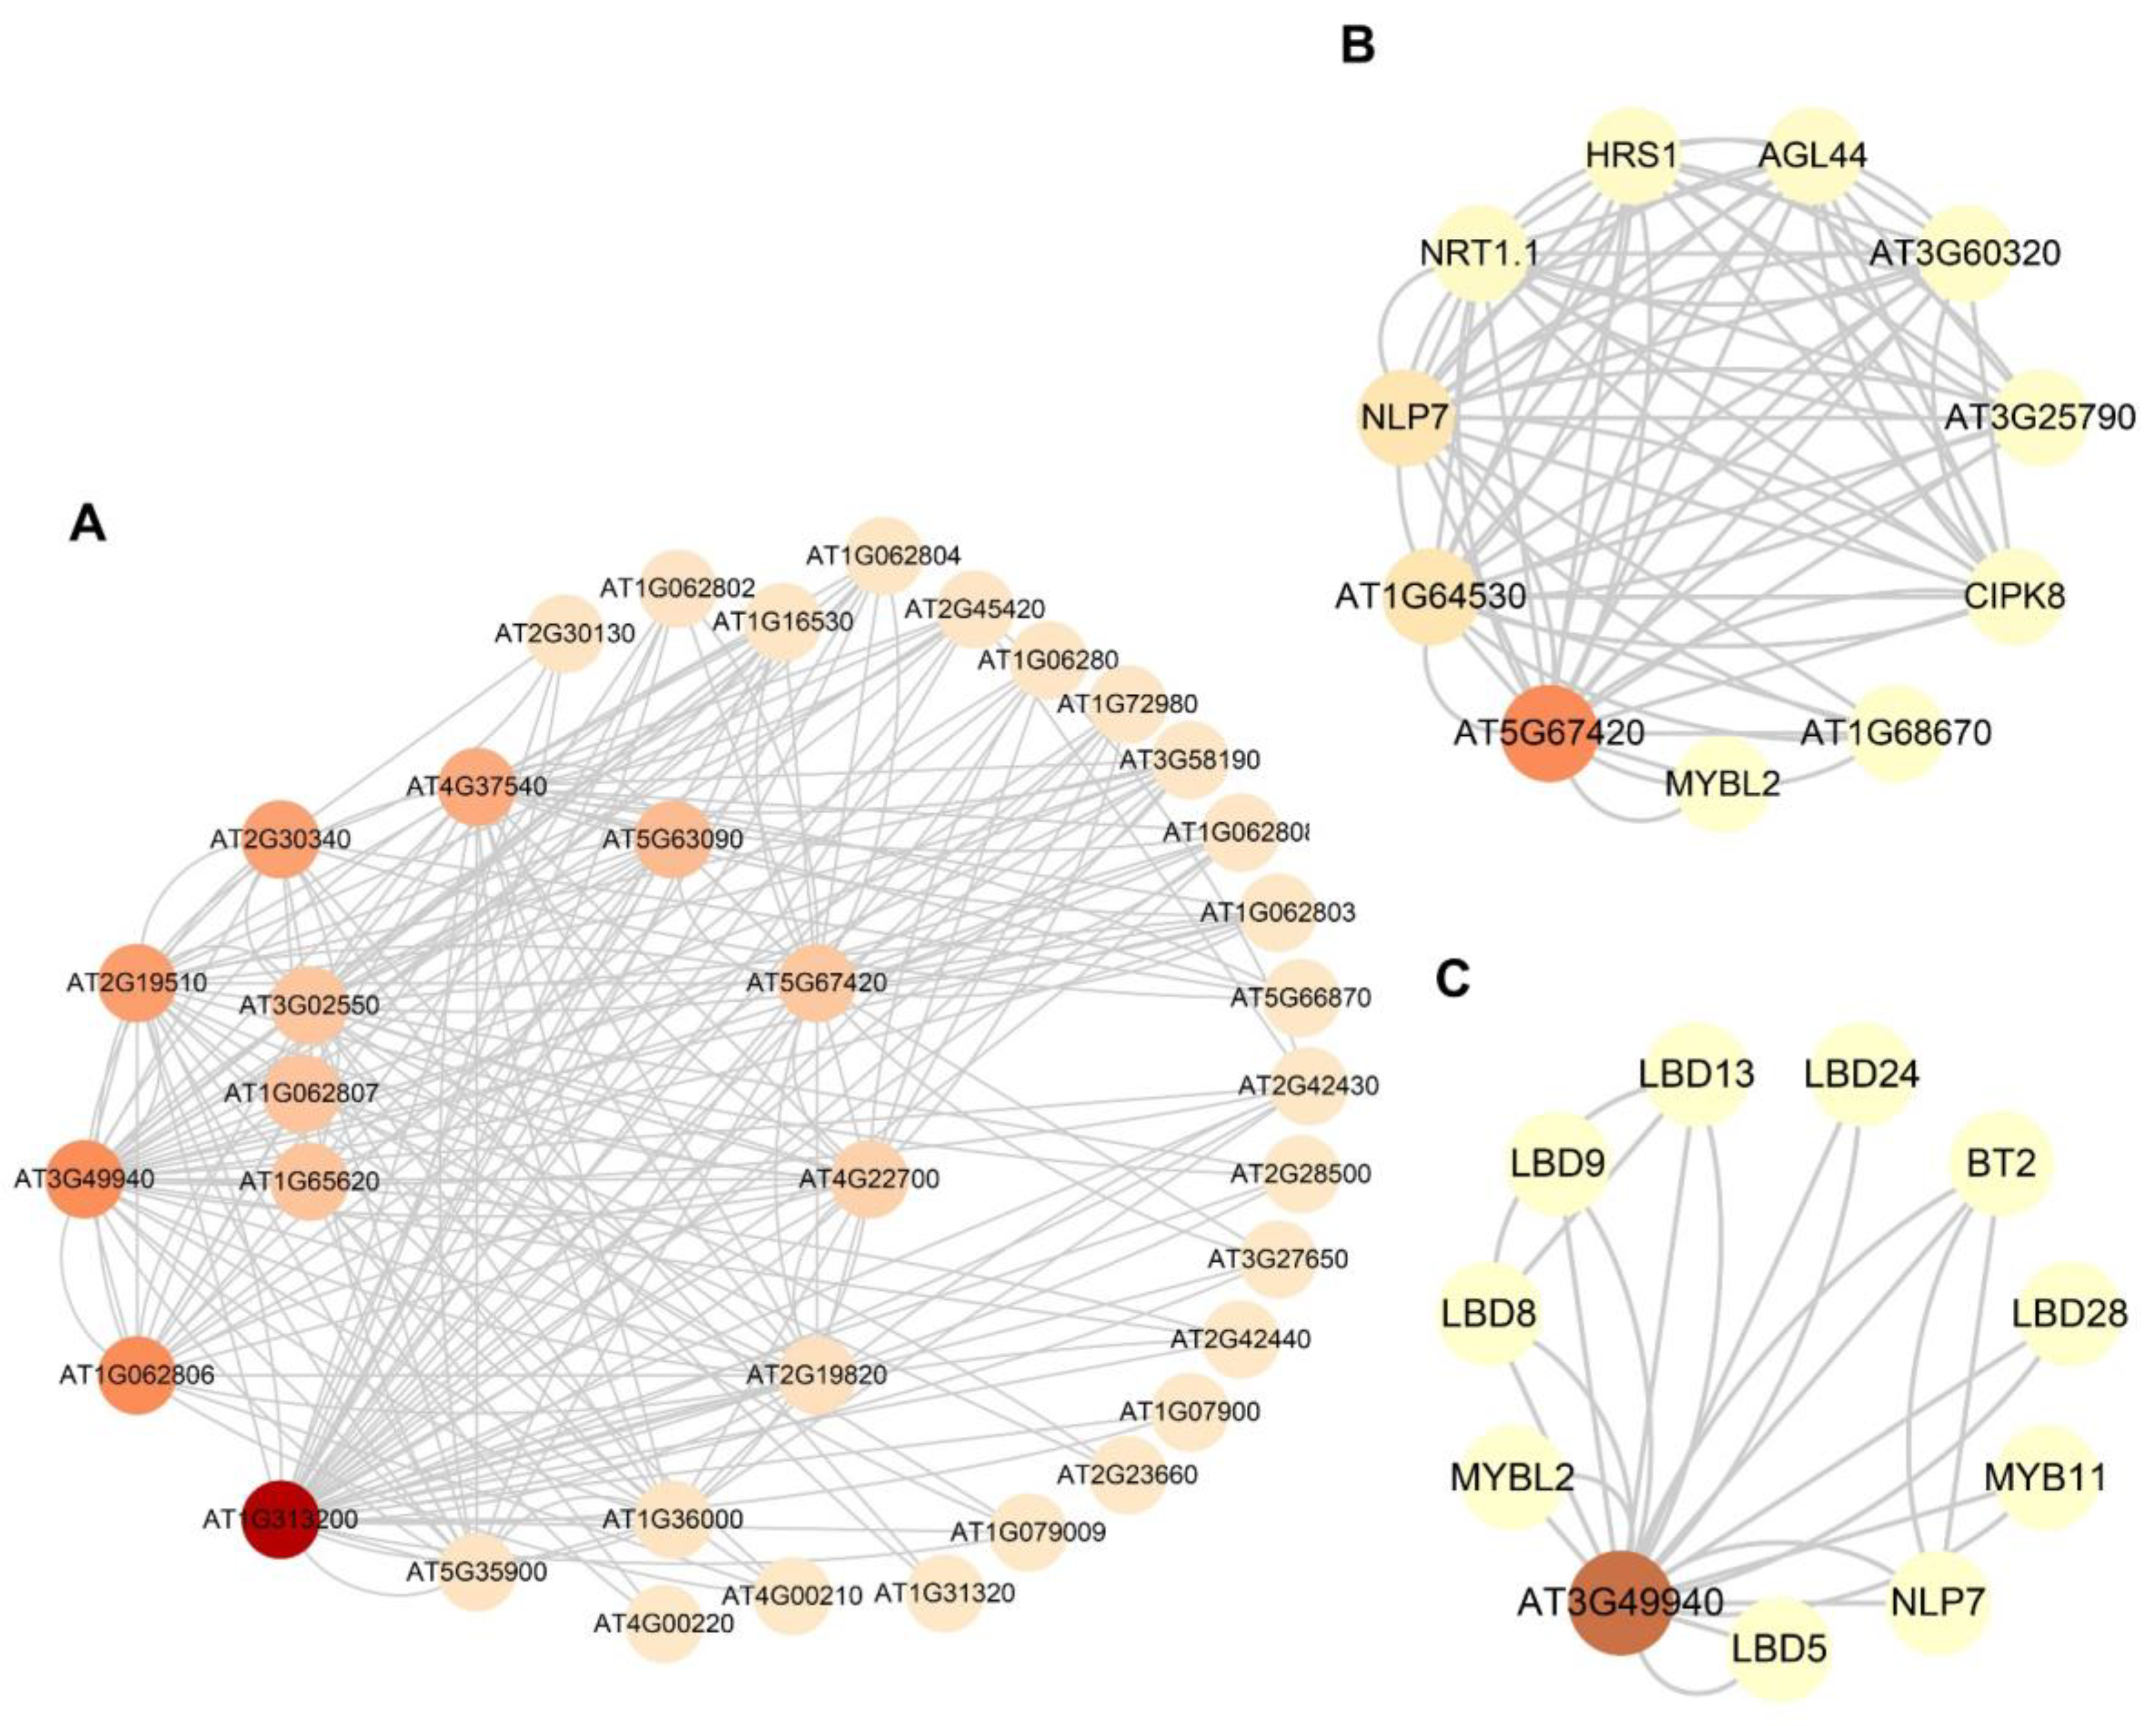
2.10. Prediction of Protein–Protein Interaction Network Analysis

Proteins are integral to life and interact with their surroundings to facilitate a plethora of biological processes [35]. The closeness of the evolutionary relationship between B. rapa and A. thaliana allows us to predict the function of corresponding homologous genes in B. rapa through protein–protein interaction (PPI) analysis of the AS2 gene in A. thaliana, as the AtAS2 gene family has been thoroughly studied; thus, the function of the BrAS2 family was further established. Drawing upon the resources and algorithms integrated into the string database, we constructed a visual representation of the predicted AtAS2 gene PPI network, as depicted in Figure 9A and Table S5. Previous analyses revealed that AT5G67420 (homologous with BrAS2-47 and BrAS2-10) plays a pivotal role in regulating anthocyanin and nitrogen metabolism [21]. In addition, AT5G67420 interacts with NIN-like protein 7 (NLP7), MYBL2, Hypersensitivity to low pi-elicited primary root shortening 1 (HRS1), and Calcium-Dependent Protein Kinase 28 (CPK28); as shown in Figure 9B, all of these have been demonstrated to be associated with the growth and development of plants, as well as their responses to abiotic stress [36,37,38,39,40,41]. AT3G49940 (homologous with BrAS2-58) impedes anthocyanin synthesis and affects the extra nitrogen response [21], as revealed in Figure 9C, and in addition to interacting with NLP7, it also communicates with the BTB/POZ and TAZ domain-containing protein 2 (BT2) [42,43]. These findings further underscore the critical and multifaceted functions of BrAS2 genes.

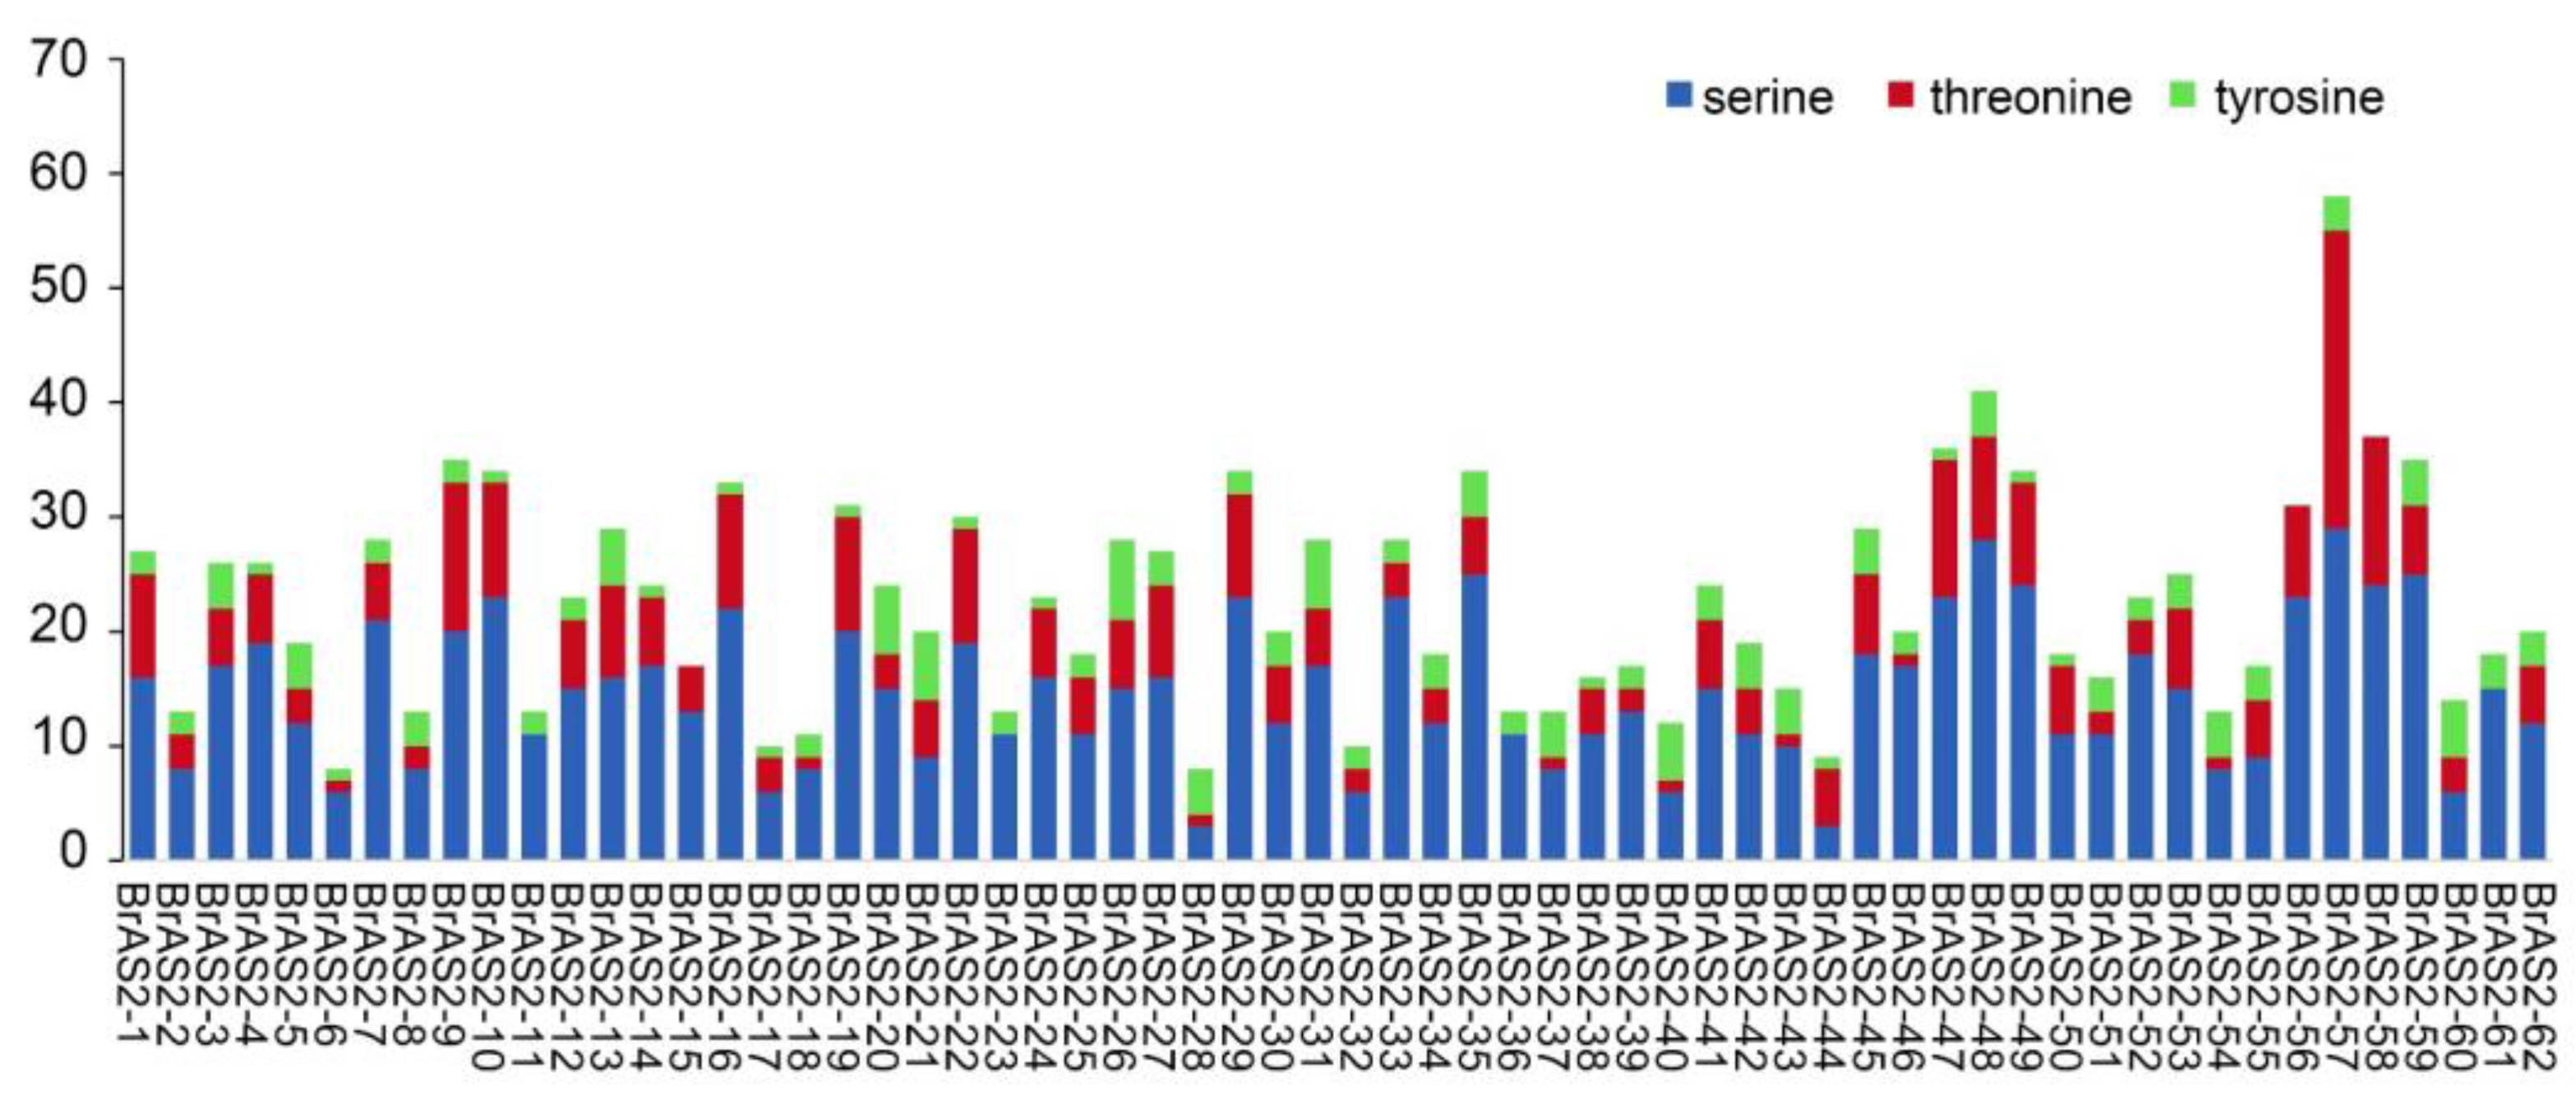
2.11. Phosphorylation Site Analysis

Protein kinases play crucial roles in regulating cellular processes by catalyzing the transfer of phosphate groups to specific amino acid residues in target proteins [44]. To identify these processes, known as protein phosphorylation in BrAS2s, we conducted a phosphorylation site analysis, as shown in Figure 10. All 62 members of the BrAS2 gene family contain phosphorylation sites. We uncovered 1406 phosphorylation sites, with serine residues accounting for 65.1%, threonine residues accounting for 23.3%, and tyrosine residues accounting for 11.6%. Upon further investigation, about 89% of BrAS2 genes simultaneously contained phospho-serine, phospho-tyrosine, and phospho-tryptophan sites. Interestingly, a significantly higher prevalence of phospho-serine sites was detected in nearly 97% of the BrAS2 genes. Research has indicated that phosphorylated serine residues play crucial roles in cellular signal transduction, metabolic regulation, and apoptosis [45]. This finding suggests the potential biological function of this gene family.

3. Discussion

The AS2 gene family is a plant-specific transcription factor family that plays an essential role in growth, the stress response, and hormone induction in many plants. However, there have been no relevant reports on BrAS2 genes. Here, we identified 62 AS2 genes in B. rapa and analyzed their physicochemical properties and protein structures, as well as their expression patterns in response to different abiotic stresses. Our results improve the understanding of BrAS2 genes and the role they play in the response to abiotic stress in plants.
We considered the evolution of the BrAS2 family genes. We revealed that the BrAS2 gene duplicated 28 chromosomal segments, as a 5.6 times tandem duplication, indicating that segment duplication may be the key factor for expansion of the BrAS2 gene in the B. rapa genome. In addition, the Ka/Ks ratio of duplicated gene pairs in BrAS2s was significantly less than 1, indicating that BrAS2 genes underwent purifying selection. Previous studies have revealed that Brassicaceae underwent three whole genome replication events [46], resulting in the acquisition of highly intricate gene families. The number of BrAS2 genes (N = 62) superseded that of AtAS2 genes (N = 35), which was attributed to the unique whole-genome tripling event (WGT) in Brassica [47,48]. Furthermore, one AtAS2 gene was mapped to as many as five BrAS2 genes, reflecting the WGT event in Brassica. In addition, a collinearity analysis of the BrAS2 genes with AtAS2 genes and OsAS2 genes indicated that the number of collinearity gene pairs between the BrAS2 genes and the AtAS2 genes was more than 16-times higher than that of the BrAS2 genes and the OsAS2 genes. This points to a closer evolutionary relationship between the BrAS2 genes and the AtAS2 genes compared to the BrAS2 genes and the OsAS2 genes. Therefore, we inferred the function of the BrAS2 genes based on the function of the AtAS2 genes.
A whole-genome replication event can cause the diversification of structures and functional domains. The AS2 gene family has been categorized into two types based on the structure of the LOB domain [1,2]. Class I LBD genes feature a completely conserved CX2CX6CX3C zinc finger-like domain (motif2) and an LX6LX3LX6L leucine zipper (motif3), while class II LBD genes only contain a conserved zinc finger-like domain [1]. These protein domains play a pivotal role in various aspects of plant growth and development, as well as in defending against external stresses. Class I LBD genes primarily participate in development, namely the formation of lateral organs, such as leaves and flowers [14,49], as well as the transduction cascade of auxin signals [14,50,51], which leads to the building of lateral roots. In contrast, class II genes are engaged in metabolism, particularly as suppressors of anthocyanin synthesis and N availability signals in plants [52,53].
Mature proteins are transported inside specific organelles to perform stable biological functions. Among the subcellular localization results, most of the BrAS2 proteins were predicted to be located in the nucleus and a GO analysis of the BrAS2 genes showed that the BP of enrichment was mainly related to hormone-mediated signaling and positive regulation of transcription. In addition, several cis-elements were related to environmental stress. We speculate that BrAS2 genes regulate the transcription of relevant genes and adapt to the environment by sensing environmental stress through hormone signaling pathways.
Related studies have shown that MeJA improves drought tolerance in O. sativa [54]. In this study, among the cis-elements associated with the hormone responses, the largest proportion was MeJA-responsiveness, at 45%. In addition, salt stress response mechanisms were also regulated by MeJA [55]. For instance, MeJA antagonizes the adverse effects of osmotic stress by regulating inorganic penetrating ions or organic penetrants to suppress the absorption of toxic ions [56]. Furthermore, MeJA participates in the resistance to cold stress. MeJA plays a crucial role in the S. lycopersicum response to cold stress by promoting ABA biosynthesis [57]. Interestingly, studies reported that an exogenous application of MeJA improves heat tolerance in Lolium perenne by mediating the expression of genes in different pathways, such as chlorophyll biosynthesis and degradation, antioxidant enzyme systems, the HSF-HSP network, and JA biosynthesis [58]. In combination with the BrAS2 gene expression transcriptome data under drought, salt, and cold stress, the expression levels of BrAS2-10 and BrAS2-47 were significantly downregulated, while BrAS2-58 expression was significantly upregulated under heat stress. BrAS2-47 predicted more MeJA-responsive cis-elements, so there was a higher possibility that it was involved in the regulatory role of the MeJA response to stress.
Protein phosphorylation is a fundamental and ubiquitous signal transduction mechanism that plays a pivotal role in the response to various abiotic stresses [59]. Protein phosphorylation predominantly occurs on threonine, serine, and tyrosine residues [60]. By investigating the phosphorylation sites of the BrAS2 family of proteins, we revealed 1406 phosphorylation sites, with serine residues accounting for 65.1%. We inferred that the biological function of this gene family was likely determined by the phosphorylation of serine residues, and serine plays a pivotal role in cellular signal transduction, metabolic regulation, and more, providing evidence for the functionality of the BrAS2 gene family [45]. In terms of tissue-specific expression, BrAS2-47 exhibits high expression levels across all tissues, while BrAS2-4, BrAS2-10, BrAS2-56, and BrAS2-58 demonstrate high expression levels in roots. BrAS2-8, on the other hand, displays high gene expression in leaves. We postulated that these genes might play a crucial role in mitigating environmental stresses.
The perception of adverse environmental conditions triggers a stress-specific signaling cascade. This complex process requires the interaction of second messengers, including Ca2+, reactive oxygen species (ROS), nitric oxide, and phospholipids, as well as post-translational modification of proteins [59]. In plants, signal transduction in response to abiotic stresses is characterized by ROS signal transduction, calcium signal transduction, and protein phosphorylation [61]. We analyzed the expression profiles of BrAS2 gene family genes under different stresses. According to the transcriptome analysis, as revealed in Figure 7, BrAS2-4 was significantly downregulated under the salt and drought treatments, while BrAS2-10 was downregulated under the low-temperature, salt, and drought treatments. BrAS2-47 was downregulated to varying degrees under the different stress treatments, and BrAS2-56 was downregulated under the salt treatment. In contrast, BrAS2-58 expression was significantly upregulated under the high-temperature treatment. We used RT-qPCR to further validate the transcriptome results. The RT-qPCR analysis revealed that the expression levels of BrAS2-47 and BrAS2-10 were substantially downregulated under cold stress, whereas that of BrAS2-56 was upregulated initially and then downregulated. Furthermore, the expression levels of BrAS2-47, BrAS2-10, and BrAS2-56 were downregulated under drought stress, while the expression of BrAS2-4 was initially decreased, followed by an increase, and then another decline. Under the salt stresses, BrAS2-47 and BrAS2-10 exhibited a similar trend to the other treatments, whereas BrAS2-4 increased and BrAS2-56 initially rose and then declined. We inferred from these results that BrAS2-47 and BrAS2-10 were responsive to cold, drought, and salt stress, and contained promoters, such as drought-inducibility and anaerobic induction. BrAS2-58 was specifically induced by heat and contained elements related to defense and stress responsiveness. Interestingly, hormone response elements, such as MeJA, salicylic acid, and gibberellin responsiveness elements, were also widely distributed among these three genes. Furthermore, the expression levels of the homologous genes in A. thaliana varied greatly under the different stress treatments, and both genes positively responded to ABA stress, as revealed in Table S6, which further supports the proposed function of these three genes. Therefore, our preliminary hypothesis was that these three genes play a vital role in the abiotic stress response through hormone signaling pathways: BrAS2-10 and BrAS2-47 responded to salt, cold, and drought stress through negative regulation, while BrAS2-58 was responsive to heat stress through positive regulation.
We discovered that these two genes interacted with NLP7 and MYBL2 through our prediction of the PPI network between AT5G67420 (homologous genes BrAS2-47 and BrAS2-10) and AT3G49940 (homologous gene BrAS2-58). Upon detection of nitrate, the PB1 domains of the NLP transcription factors orchestrated gene expression from chromosomal DNA via homo- and hetero-oligomerization in the presence of nitrate, culminating in the modulation of gene expression to promote nitrate uptake and utilization, thereby conferring resilience against abiotic stresses such as drought and salinity [36,37]. MYBL2 inhibits the biosynthesis of anthocyanins in A. thaliana through mediation by ABA [38]. In addition, AT5G67420 also interacts with HRS1 and CPK28. The pivotal role of HRS1 proteins in coordinating nitrogen and phosphorus absorption and utilization in response to abiotic stress has been demonstrated [40]. CPK28 was phosphorylated and promoted nuclear translocation of the NLP7 protein, thus specifying the transcriptional reprogramming of cold-responsive gene sets in response to Ca2+ [41]. Additionally, AT5G67420 was confirmed to regulate anthocyanin and nitrogen metabolism, thereby further supporting this conclusion [21]. We speculated that AT5G67420 interacted with the NLP7, MYBL1, CPK28, and HRS1, thereby affecting the resistance to salt, drought, and low-temperature stress. In addition to its interaction with NLP7 and MYBL1, AT3G49940 interacted with BT2 and MYB11. The functional deletion mutant analysis of BT2 verified that both BT2 transcription factors functioned in an ABA-dependent manner, to regulate germination and development during sugar signal transduction [43]. Furthermore, MYB11 produced flavonol glycoside 2, which reduces the proliferation activity of meristem cells and delays development in response to heat stress [43]. We speculate that AT3G49940 could enhance the yield of Chinese cabbage in light of the current climate and environmental changes by interacting with NLP7, MYBL1, BT2, and MYB11.

4. Materials and Methods

4.1. Identification of AS2 Family Gene Members in B. rapa

Whole-genome sequences, gff3 genome annotation data, and AS2 aa sequences of B. rapa, A. thaliana, and H. vulgare were downloaded from EnsemblPlant (http://plants.ensembl.org/, accessed on 1 June 2023). The BrAS2 genes were screened from the B. rapa genome using the BLASTP program with AtAS2 aa sequences as input to predict the BrAS2 genes. The online tool NCBI Batch CD Search was used to analyze the aa sequence of the AS2 genes protein in B. rapa, and remove the protein sequence that did not contain the AS2 domain.

4.2. Chromosomal Localization and Collinearity Analysis

The location of the BrAS2 genes on the chromosomes was extracted from the B. rapa gff3 genome annotation information using TBtools (v1.120) [62]. The MCScanX plug-in in TBtools (v1.120) was used to analyze the relationships among duplicate genes within B. rapa and inter-specific collinearity, and the Circos plug-in was used to visualize the results.

4.3. Subcellular Localization Analysis

The isoelectric points and molecular weights of the aa sequences of all B. rapa AS2 proteins were predicted using the ExPASy technologies server (http://www.expasy.org/, accessed on 1 June 2023) [63], and the subcellular distribution was analyzed using PSORT.

4.4. Phylogenetic Tree Construction, Conserved Motifs, and Gene Structural Analysis

The aa sequences of BrAS2s, AtAS2s, and HvAS2s were aligned using the MUSCLE algorithm in MEGA X [64], and an unrooted phylogenetic tree was constructed using the maximum likelihood method in MEGA X with 1000 bootstrap replicates. The aa sequences of the BrAS2 genes were uploaded to the MEME online website (http://meme-suite.org/, accessed on 1 June 2023), and the number of motifs was set to 15 to analyze the conserved BrAS2 gene motifs. The gene structure, motifs, and conserved domains were visualized using TBtools (v1.120) [62].

4.5. Cis-Element and Gene Ontology Analyses

The upstream 2000-bp sequence of each BrAS2s was analyzed using the online PlantCARE database (http://bioinformatics.psb.ugent.be/webtools/plantcare/html/, accessed on 1 June 2023) [65], with default parameters. The BrAS2 gene structure and conserved motifs were visualized using TBtools (v1.120). A gene ontology (GO) analysis of the BrAS2 genes was conducted with default parameters at the DAVID website (http://david.ncifcrf.gov, accessed on 1 June 2023) [66].

4.6. Plant Material, Stress Treatments, and Total RNA Extraction

B. rapa with stable self-incompatibility was used for the stress treatments. Plump seeds were seeded in MS Modified Medium (with vitamins, Sucrose, Agar) (PM10121-307, Coolaber, Beijing, China) and cultivated in a plant incubator. Seedlings with six leaves and similar growth status were subjected to the stress treatments. The seedlings were placed in a hydroponic system with 150 mM NaCl to simulate salt stress and in 15% PEG6000 to simulate drought conditions. The plants were exposed to 4 °C for the cold stress treatment, and exposed 16 h 45 °C/8 h 35 °C for the heat stress treatment. We used unstressed B. rapa seedlings with the same growth period and under the same growth conditions as a control (CK). The duration of all stress treatments was 4, 6, and 12 h. Three biological replicates were run for each treatment group, and the samples were stored at −80 °C. Total RNA was extracted using a FastPure® Cell/Tissue Total RNA Isolation Kit V2 (Vazyme Biotech Co., Ltd., Nanjing, China).

4.7. Expression Patterns Analysis

The transcriptome sequences in different B. rapa tissues from NCBI GEO with Accession number GSE43245 were downloaded, and the data were normalized using the TPM method. The transcriptome sequences of A. thaliana under various abiotic stress treatments were downloaded, as shown in Table S6. Gene expression profile heatmaps were prepared using TBtools (v1.120) [62].
The samples from the treatments were subjected to transcriptome sequencing on the Illumina NovaSeq 6000 platform by BioMarker Technologies (Beijing, China), and three biological replicates were collected for each sample. The number of mapped reads and transcript lengths in the samples were normalized after sequencing. The abundance of the transcripts was measured using fragments per kilobase of transcript per million fragments mapped.

4.8. RT-qPCR Analysis

RNA samples were reverse-transcribed using TransScript® Uni All-in-One First-Strand cDNA Synthesis SuperMix for the RT-qPCR analysis. RT-qPCR was performed on a qTOWER3 qPCR machine using TransStart® Green qPCR SuperMix (TransGen Biotech, Beijing, China), and BrACTIN2 was used as the reference gene. The primer sequences are shown in Table S7.

4.9. Statistical Analysis

The relative expression levels of each gene were analyzed using the 2−ΔΔCt method, and the analysis of significant differences (a, b, c, d) was conducted through the implementation of single-factor ANOVA test on IBM SPSS Statistics 25, in order to compare the obtained means (with a = 0.05).

4.10. Protein–Protein Interaction Networks and Phosphorylation Site Analysis

The STRING online website was used to predict the PPI relationships with default parameters, and Cytoscape v3.9.1 was used to construct the interaction network [67]. The BrAS2 gene phosphorylation sites were analyzed using the online Netphos 2.0 software Server, and Excel 2016 was used to prepare the visual representations.

5. Conclusions

In this study, 62 BrAS2s genes were identified from the B. rapa genome. After a comprehensive analysis of the sequence features, the expression profiles, and the protein interactive relationships, we determined that BrAS2-10 and BrAS2-47 had the greatest potential in regulating cold, salt, and drought tolerance, and BrAS2-58 was involved in the B. rapa high-temperature response.

Supplementary Materials

The supporting information can be downloaded at: https://www.mdpi.com/article/10.3390/ijms241310534/s1.

Author Contributions

J.H. and Q.D. planned the project and designed the experiments; Q.J. and X.W. performed the bioinformatics analysis and experiments with the help of X.Z., Z.J. and Y.C.; Q.J. and X.W. analyzed the data and wrote the manuscript. J.H. and Q.D. revised the manuscript. All authors have read and agreed to the published version of the manuscript.

Funding

This research was funded by Shandong Provincial Natural Science Foundation (ZR2022MC021) and the Key Program of Shandong Province Science Foundation (ZR2020KC017).

Data Availability Statement

All the data that support the findings of this study are available in the paper and its supplementary material published online.

Acknowledgments

We are grateful to Zhilong Bao’s lab for help with RT-qPCR experiments.

Conflicts of Interest

The authors declare no conflict of interest.

References

  1. Shuai, B.; Reynaga-Peña, C.G.; Springer, P.S. The Lateral Organ Boundaries Gene Defines a Novel, Plant-Specific Gene Family. Plant Physiol. 2002, 129, 747–761. [Google Scholar] [CrossRef] [PubMed] [Green Version]
  2. Iwakawa, H.; Ueno, Y.; Semiarti, E.; Onouchi, H.; Kojima, S.; Tsukaya, H.; Hasebe, M.; Soma, T.; Ikezaki, M.; Machida, C.; et al. The ASYMMETRIC LEAVES2 Gene of Arabidopsis Thaliana, Required for Formation of a Symmetric Flat Leaf Lamina, Encodes a Member of a Novel Family of Proteins Characterized by Cysteine Repeats and a Leucine Zipper. Plant Cell Physiol. 2002, 43, 467–478. [Google Scholar] [CrossRef] [PubMed] [Green Version]
  3. Guo, B.-J.; Wang, J.; Lin, S.; Tian, Z.; Zhou, K.; Luan, H.-Y.; Lyu, C.; Zhang, X.-Z.; Xu, R.-G. A Genome-Wide Analysis of the ASYMMETRIC LEAVES2/LATERAL ORGAN BOUNDARIES (AS2/LOB) Gene Family in Barley (Hordeum vulgare L.). J. Zhejiang Univ. Sci. B 2016, 17, 763–774. [Google Scholar] [CrossRef] [Green Version]
  4. Yang, T.; Fang, G.Y.; He, H.; Chen, J. Genome-Wide Identification, Evolutionary Analysis and Expression Profiles of LATERAL ORGAN BOUNDARIES DOMAIN Gene Family in Lotus Japonicus and Medicago Truncatula. PLoS ONE 2016, 11, e0161901. [Google Scholar] [CrossRef] [Green Version]
  5. Grimplet, J.; Pimentel, D.; Agudelo-Romero, P.; Martinez-Zapater, J.M.; Fortes, A.M. The LATERAL ORGAN BOUNDARIES Domain Gene Family in Grapevine: Genome-Wide Characterization and Expression Analyses during Developmental Processes and Stress Responses. Sci. Rep. 2017, 7, 15968. [Google Scholar] [CrossRef] [PubMed] [Green Version]
  6. Liu, H.; Cao, M.; Chen, X.; Ye, M.; Zhao, P.; Nan, Y.; Li, W.; Zhang, C.; Kong, L.; Kong, N.; et al. Genome-Wide Analysis of the Lateral Organ Boundaries Domain (LBD) Gene Family in Solanum Tuberosum. Int. J. Mol. Sci. 2019, 20, 5360. [Google Scholar] [CrossRef] [Green Version]
  7. Yang, H.; Shi, G.; Du, H.; Wang, H.; Zhang, Z.; Hu, D.; Wang, J.; Huang, F.; Yu, D. Genome-Wide Analysis of Soybean LATERAL ORGAN BOUNDARIES Domain-Containing Genes: A Functional Investigation of GmLBD12. Plant Genome 2017, 10. [Google Scholar] [CrossRef] [Green Version]
  8. Huang, B.; Huang, Z.; Ma, R.; Ramakrishnan, M.; Chen, J.; Zhang, Z.; Yrjälä, K. Genome-wide identification and expression analysis of LBD transcription factor genes in Moso bamboo (Phyllostachys edulis). BMC Plant Biol. 2021, 21, 296. [Google Scholar] [CrossRef]
  9. Guo, Z.; Xu, H.; Lei, Q.; Du, J.; Li, C.; Wang, C.; Yang, Y.; Yang, Y.; Sun, X. The Arabidopsis transcription factor LBD15 mediates ABA signaling and tolerance of water-deficit stress by regulating ABI4 expression. Plant J. 2020, 104, 510–521. [Google Scholar] [CrossRef]
  10. Ariel, F.D.; Diet, A.; Crespi, M.; Chan, R.L. The LOB-like Transcription Factor Mt LBD1 Controls Medicago Truncatula Root Architecture under Salt Stress. Plant Signal Behav. 2010, 5, 1666–1668. [Google Scholar] [CrossRef] [Green Version]
  11. Feng, X.; Xiong, J.; Zhang, W.; Guan, H.; Zheng, D.; Xiong, H.; Jia, L.; Hu, Y.; Zhou, H.; Wen, Y.; et al. ZmLBD5, a class-II LBD gene, negatively regulates drought tolerance by impairing abscisic acid synthesis. Plant J. 2022, 112, 1364–1376. [Google Scholar] [CrossRef] [PubMed]
  12. Jeon, E.; Kang, N.Y.; Cho, C.; Seo, P.J.; Suh, M.C.; Kim, J. LBD14/ASL17 Positively Regulates Lateral Root Formation and is Involved in ABA Response for Root Architecture in Arabidopsis. Plant Cell Physiol. 2017, 58, 2190–2201. [Google Scholar] [CrossRef] [Green Version]
  13. Liu, L.; Zhang, J.; Xu, J.; Li, Y.; Guo, L.; Wang, Z.; Zhang, X.; Zhao, B.; Guo, Y.-D.; Zhang, N. CRISPR/Cas9 targeted mutagenesis of SlLBD40, a lateral organ boundaries domain transcription factor, enhances drought tolerance in tomato. Plant Sci. 2020, 301, 110683. [Google Scholar] [CrossRef]
  14. Zhang, Y.; Li, Z.; Ma, B.; Hou, Q.; Wan, X. Phylogeny and Functions of LOB Domain Proteins in Plants. Int. J. Mol. Sci. 2020, 21, 2278. [Google Scholar] [CrossRef] [Green Version]
  15. Thatcher, L.F.; Powell, J.J.; Aitken, E.A.B.; Kazan, K.; Manners, J.M. The lateral organ boundaries domain transcription factor LBD20 functions in Fusarium wilt Susceptibility and jasmonate signaling in Arabidopsis. Plant Physiol. 2012, 160, 407–418. [Google Scholar] [CrossRef] [PubMed] [Green Version]
  16. Huang, X.; Yan, H.; Liu, Y.; Yi, Y. Genome-Wide Analysis of LATERAL ORGAN BOUNDARIES DOMAIN-in Physcomitrella Patens and Stress Responses. Genes Genom. 2020, 42, 651–662. [Google Scholar] [CrossRef] [PubMed]
  17. Azuma, A.; Yakushiji, H.; Koshita, Y.; Kobayashi, S. Flavonoid biosynthesis-related genes in grape skin are differentially regulated by temperature and light conditions. Planta 2012, 236, 1067–1080. [Google Scholar] [CrossRef] [PubMed]
  18. Petropoulos, S.A.; Levizou, E.; Ntatsi, G.; Fernandes, Â.; Petrotos, K.; Akoumianakis, K.; Barros, L.; Ferreira, I.C. Salinity effect on nutritional value, chemical composition and bioactive compounds content of Cichorium spinosum L. Food Chem. 2017, 214, 129–136. [Google Scholar] [CrossRef] [Green Version]
  19. Sarker, U.; Oba, S. Drought stress enhances nutritional and bioactive compounds, phenolic acids and antioxidant capacity of Amaranthus leafy vegetable. BMC Plant Biol. 2018, 18, 258. [Google Scholar] [CrossRef] [Green Version]
  20. Gharibi, S.; Tabatabaei, B.E.S.; Saeidi, G.; Talebi, M.; Matkowski, A. The effect of drought stress on polyphenolic compounds and expression of flavonoid biosynthesis related genes in Achillea pachycephala Rech. f. Phytochemistry 2019, 162, 90–98. [Google Scholar] [CrossRef]
  21. Rubin, G.; Tohge, T.; Matsuda, F.; Saito, K.; Scheible, W.R. Members of the LBD Family of Transcription Factors Repress Anthocyanin Synthesis and Affect Additional Nitrogen Responses in Arabidopsis. Plant Cell 2009, 21, 3567–3584. [Google Scholar] [CrossRef] [PubMed] [Green Version]
  22. Albinsky, D.; Kusano, M.; Higuchi, M.; Hayashi, N.; Kobayashi, M.; Fukushima, A.; Mori, M.; Ichikawa, T.; Matsui, K.; Kuroda, H.; et al. Metabolomic Screening Applied to Rice FOX Arabidopsis, Lines Leads to the Identification of a Gene-Changing Nitrogen Metabolism. Mol. Plant 2010, 3, 125–142. [Google Scholar] [CrossRef]
  23. Li, C.; Zhu, S.; Zhang, H.; Chen, L.; Cai, M.; Wang, J.; Chai, J.; Wu, F.; Cheng, Z.; Guo, X.; et al. OsLBD37 and OsLBD38, two class II type LBD proteins, are involved in the regulation of heading date by controlling the expression of Ehd1 in rice. Biochem. Biophys. Res. Commun. 2017, 486, 720–725. [Google Scholar] [CrossRef] [PubMed]
  24. Zhang, X.; He, Y.; He, W.; Su, H.; Wang, Y.; Hong, G.; Xu, P. Structural and functional insights into the LBD family involved in abiotic stress and flavonoid synthases in Camellia sinensis. Sci. Rep. 2019, 9, 15651. [Google Scholar] [CrossRef] [PubMed] [Green Version]
  25. Iwakawa, H.; Iwasaki, M.; Kojima, S.; Ueno, Y.; Soma, T.; Tanaka, H.; Semiarti, E.; Machida, Y.; Machida, C. Expression of the ASYMMETRIC LEAVES2 Gene in the Adaxial Domain of Arabidopsis Leaves Represses Cell Proliferation in This Domain and Is Critical for the Development of Properly Expanded Leaves. Plant J. 2007, 51, 173–184. [Google Scholar] [CrossRef]
  26. Wang, Z.; Wang, Y.; Kohalmi, S.E.; Amyot, L.; Hannoufa, A. SQUAMOSA PROMOTER BINDING PROTEIN-LIKE 2 controls floral organ development and plant fertility by activating ASYMMETRIC LEAVES 2 in Arabidopsis thaliana. Plant Mol. Biol. 2016, 92, 661–674. [Google Scholar] [CrossRef]
  27. Borghi, L.; Bureau, M.; Simon, R. Arabidopsis JAGGED LATERAL ORGANS Is Expressed in Boundaries and Coordinates KNOX and PIN Activity. Plant Cell 2007, 19, 1795–1808. [Google Scholar] [CrossRef] [Green Version]
  28. Ori, N.; Eshed, Y.; Chuck, G.; Bowman, J.L.; Hake, S. Mechanisms That Control Knox Gene Expression in the Arabidopsis Shoot. Development 2000, 127, 5523–5532. [Google Scholar] [CrossRef]
  29. Semiarti, E.; Ueno, Y.; Tsukaya, H.; Iwakawa, H.; Machida, C.; Machida, Y. The ASYMMETRIC LEAVES2 Gene of Arabidopsis Thaliana Regulates Formation of a Symmetric Lamina, Establishment of Venation and Repression of Meristem-Related Homeobox Genes in Leaves. Development 2001, 128, 1771–1783. [Google Scholar] [CrossRef]
  30. Byrne, M.E.; Simorowski, J.; Martienssen, R.A. ASYMMETRIC LEAVES1 Reveals Knox Gene Redundancy in Arabidopsis. Development 2002, 129, 1957–1965. [Google Scholar] [CrossRef]
  31. Guo, M.; Thomas, J.; Collins, G.; Timmermans, M.C.P. Direct Repression of KNOX Loci by the ASYMMETRIC LEAVES1 Complex of Arabidopsis. Plant Cell 2008, 20, 48–58. [Google Scholar] [CrossRef] [PubMed] [Green Version]
  32. Xu, B.; Li, Z.; Zhu, Y.; Wang, H.; Ma, H.; Dong, A.; Huang, H. Arabidopsis Genes AS1, AS2, and JAG Negatively Regulate Boundary-Specifying Genes to Promote Sepal and Petal Development. Plant Physiol. 2008, 146, 566–575. [Google Scholar] [CrossRef] [PubMed] [Green Version]
  33. Lin, Y.; Hou, H.; Zhang, Y.; Hou, X. Overexpression of a Pak Choi Gene, BcAS2, Causes Leaf Curvature in Arabidopsis Thaliana. Genes 2021, 12, 102. [Google Scholar] [CrossRef] [PubMed]
  34. Zhao, T.; Schranz, M.E. Network approaches for plant phylogenomic synteny analysis. Curr. Opin. Plant Biol. 2017, 36, 129–134. [Google Scholar] [CrossRef]
  35. Alberts, B. The Cell as a Collection of Protein Machines: Preparing the next Generation of Molecular Biologists. Cell 1998, 92, 291–294. [Google Scholar] [CrossRef] [Green Version]
  36. Konishi, M.; Yanagisawa, S. The Role of Protein-Protein Interactions Mediated by the PB1 Domain of NLP Transcription Factors in Nitrate-Inducible Gene Expression. BMC Plant Biol. 2019, 19, 90. [Google Scholar] [CrossRef] [Green Version]
  37. Konishi, M.; Okitsu, T.; Yanagisawa, S. Nitrate-Responsive NIN-like Protein Transcription Factors Perform Unique and Redundant Roles in Arabidopsis. J. Exp. Bot. 2021, 72, 5735–5750. [Google Scholar] [CrossRef]
  38. Xie, Y.; Tan, H.; Ma, Z.; Huang, J. DELLA Proteins Promote Anthocyanin Biosynthesis via Sequestering MYBL2 and JAZ Suppressors of the MYB/bHLH/WD40 Complex in Arabidopsis thaliana. Mol. Plant 2016, 9, 711–721. [Google Scholar] [CrossRef] [Green Version]
  39. Wu, C.; Feng, J.; Wang, R.; Liu, H.; Yang, H.; Rodriguez, P.L.; Qin, H.; Liu, X.; Wang, D. HRS1 acts as a negative regulator of abscisic acid signaling to promote timely germination of Arabidopsis seeds. PLoS ONE 2012, 7, e35764. [Google Scholar] [CrossRef] [Green Version]
  40. Li, Q.; Zhou, L.; Li, Y.; Zhang, D.; Gao, Y. Plant NIGT1/HRS1/HHO Transcription Factors: Key Regulators with Multiple Roles in Plant Growth, Development, and Stress Responses. Int. J. Mol. Sci. 2021, 22, 8685. [Google Scholar] [CrossRef]
  41. Ding, Y.; Yang, H.; Wu, S.; Fu, D.; Li, M.; Gong, Z.; Yang, S. CPK28-NLP7 Module Integrates Cold-Induced Ca2+ Signal and Transcriptional Reprogramming in Arabidopsis. Sci. Adv. 2022, 8, eabn7901. [Google Scholar] [CrossRef]
  42. Mandadi, K.K.; Misra, A.; Ren, S.; McKnight, T.D. BT2, a BTB protein, mediates multiple responses to nutrients, stresses, and hormones in Arabidopsis. Plant Physiol. 2009, 150, 1930–1939. [Google Scholar] [CrossRef] [PubMed] [Green Version]
  43. Stracke, R.; Jahns, O.; Keck, M.; Tohge, T.; Niehaus, K.; Fernie, A.R.; Weisshaar, B. Analysis of PRODUCTION OF FLAVONOL GLYCOSIDES-Dependent Flavonol Glycoside Accumulation in Arabidopsis Thaliana Plants Reveals MYB11-, MYB12- and MYB111- Independent Flavonol Glycoside Accumulation. New Phytol. 2010, 188, 985–1000. [Google Scholar] [CrossRef] [PubMed]
  44. Humphrey, S.J.; James, D.E.; Mann, M. Protein Phosphorylation: A Major Switch Mechanism for Metabolic Regulation. Trends Endocrinol. Metab. 2015, 26, 676–687. [Google Scholar] [CrossRef] [PubMed]
  45. Yaffe, M.B.; Smerdon, S.J. The use of in vitro peptide-library screens in the analysis of phosphoserine/threonine-binding domain structure and function. Annu. Rev. Biophys. Biomol. Struct. 2004, 33, 225–244. [Google Scholar] [CrossRef] [PubMed]
  46. Wang, X.; Kole, C. The Brassica rapa Genome; Springer: Berlin/Heidelberg, Germany, 2015. [Google Scholar]
  47. The Brassica rapa Genome Sequencing Project Consortium; Wang, X.; Wang, H.; Wang, J.; Sun, R.; Wu, J.; Liu, S.; Bai, Y.; Mun, J.-H.; Bancroft, I.; et al. The genome of the mesopolyploid crop species Brassica rapa. Nat. Genet. 2011, 43, 1035–1039. [Google Scholar] [CrossRef] [Green Version]
  48. Cheng, F.; Mandáková, T.; Wu, J.; Xie, Q.; Lysak, M.A.; Wang, X. Deciphering the diploid ancestral genome of the mesohexaploid Brassica rapa. Plant Cell 2013, 25, 1541–1554. [Google Scholar] [CrossRef] [PubMed] [Green Version]
  49. Xu, C.; Luo, F.; Hochholdinger, F. LOB Domain Proteins: Beyond Lateral Organ Boundaries. Trends Plant Sci. 2016, 21, 159–167. [Google Scholar] [CrossRef]
  50. Feng, Z.; Zhu, J.; Du, X.; Cui, X. Effects of three auxin-inducible LBD members on lateral root formation in Arabidopsis thaliana. Planta 2012, 236, 1227–1237. [Google Scholar] [CrossRef]
  51. Lee, H.W.; Cho, C.; Kim, J. Lateral Organ Boundaries Domain16 and 18 Act Downstream of the AUXIN1 and LIKE-AUXIN3 Auxin Influx Carriers to Control Lateral Root Development in Arabidopsis. Plant Physiol. 2015, 168, 1792–1806. [Google Scholar] [CrossRef] [Green Version]
  52. Scheible, W.-R.; Morcuende, R.; Czechowski, T.; Fritz, C.; Osuna, D.; Palacios-Rojas, N.; Schindelasch, D.; Thimm, O.; Udvardi, M.; Stitt, M. Genome-Wide Reprogramming of Primary and Secondary Metabolism, Protein Synthesis, Cellular Growth Processes, and the Regulatory Infrastructure of Arabidopsis in Response to Nitrogen. Plant Physiol. 2004, 136, 2483–2499. [Google Scholar] [CrossRef] [Green Version]
  53. Matsumura, Y.; Iwakawa, H.; Machida, Y.; Machida, C. Characterization of genes in the ASYMMETRIC LEA VES2/LATERAL ORGAN BOUNDARIES (AS2/LOB) family in Arabidopsis thaliana, and functional and molecular comparisons between AS2 and other family members. Plant J. 2009, 58, 525–537. [Google Scholar] [CrossRef] [PubMed] [Green Version]
  54. Fu, J.; Wu, H.; Ma, S.; Xiang, D.; Liu, R.; Xiong, L. OsJAZ1 Attenuates Drought Resistance by Regulating JA and ABA Signaling in Rice. Front. Plant Sci. 2017, 8, 2108. [Google Scholar] [CrossRef] [PubMed] [Green Version]
  55. Kraus, E.C.; Stout, M.J. Seed treatment using methyl jasmonate induces resistance to rice water weevil but reduces plant growth in rice. PLoS ONE 2019, 14, e0222800. [Google Scholar] [CrossRef] [Green Version]
  56. Yu, X.; Zhang, W.; Zhang, Y.; Zhang, X.; Lang, D.; Zhang, X. The roles of methyl jasmonate to stress in plants. Funct. Plant Biol. 2019, 46, 197–212. [Google Scholar] [CrossRef]
  57. Ding, F.; Wang, X.; Li, Z.; Wang, M. Jasmonate Positively Regulates Cold Tolerance by Promoting ABA Biosynthesis in Tomato. Plants 2022, 12, 60. [Google Scholar] [CrossRef] [PubMed]
  58. Nie, G.; Zhou, J.; Jiang, Y.; He, J.; Wang, Y.; Liao, Z.; Appiah, C.; Li, D.; Feng, G.; Huang, L.; et al. Transcriptome characterization of candidate genes for heat tolerance in perennial ryegrass after exogenous methyl Jasmonate application. BMC Plant Biol. 2022, 22, 68. [Google Scholar] [CrossRef] [PubMed]
  59. Zhang, H.; Zhu, J.; Gong, Z.; Zhu, J.-K. Abiotic Stress Responses in Plants. Nat. Rev. Genet. 2022, 23, 104–119. [Google Scholar] [CrossRef]
  60. Deutscher, J.; Saier, M.H., Jr. Ser/Thr/Tyr protein phosphorylation in bacteria—For long time neglected, now well established. J. Mol. Microbiol. Biotechnol. 2005, 9, 125–131. [Google Scholar] [CrossRef]
  61. Mittler, R.; Zandalinas, S.I.; Fichman, Y.; Van Breusegem, F. Reactive Oxygen Species Signalling in Plant Stress Responses. Nat. Rev. Mol. Cell Biol. 2022, 23, 663–679. [Google Scholar] [CrossRef]
  62. Chen, C.; Chen, H.; Zhang, Y.; Thomas, H.R.; Frank, M.H.; He, Y.; Xia, R. TBtools: An Integrative Toolkit Developed for Interactive Analyses of Big Biological Data. Mol. Plant 2020, 13, 1194–1202. [Google Scholar] [CrossRef] [PubMed]
  63. Artimo, P.; Jonnalagedda, M.; Arnold, K.; Baratin, D.; Csardi, G.; de Castro, E.; Duvaud, S.; Flegel, V.; Fortier, A.; Gasteiger, E.; et al. ExPASy: SIB Bioinformatics Resource Portal. Nucleic Acids Res. 2012, 40, W597–W603. [Google Scholar] [CrossRef] [PubMed]
  64. Kumar, S.; Stecher, G.; Li, M.; Knyaz, C.; Tamura, K. MEGA X: Molecular Evolutionary Genetics Analysis across Computing Platforms. Mol. Biol. Evol. 2018, 35, 1547–1549. [Google Scholar] [CrossRef] [PubMed]
  65. Rombauts, S.; Déhais, P.; Van Montagu, M.; Rouzé, P. PlantCARE, a Plant Cis-Acting Regulatory Element Database. Nucleic Acids Res. 1999, 27, 295–296. [Google Scholar] [CrossRef] [Green Version]
  66. Dennis, G.; Sherman, B.T.; Hosack, D.A.; Yang, J.; Gao, W.; Lane, H.C.; Lempicki, R.A. DAVID: Database for Annotation, Visualization, and Integrated Discovery. Genome Biol. 2003, 4, R60. [Google Scholar] [CrossRef] [Green Version]
  67. Shannon, P.; Markiel, A.; Ozier, O.; Baliga, N.S.; Wang, J.T.; Ramage, D.; Amin, N.; Schwikowski, B.; Ideker, T. Cytoscape: A Software Environment for Integrated Models of Biomolecular Interaction Networks. Genome Res. 2003, 13, 2498–2504. [Google Scholar] [CrossRef]
Figure 1. (A) Chromosome location and replication of AS2 Gene Family members in Brassica rapa. (B) The phylogenic tree of B. rapa, Arabidopsis thaliana, and Hordeum vulgare. The clustering analysis was based on 1000 replications to increase the credibility of the bootstrap value. Red characters represent Class Ia; purple characters represent Class Ib; blue characters represent Class Ic; yellow characters represent Class Id; green charactes represent Class Ie; brown characters represent Class IIa; and grey characters represent Class IIb. (C) Collinearity among AS2 Gene Family between B. rapa and A. thaliana, B. rapa and Oryza sativa. The red line represents the homologous genes between B. rapa and A. thaliana, and between B. rapa and O. sativa.
Ijms 24 10534 g001
Figure 2. The prediction of subcellular localization for AS2 genes in B. rapa. The color and the size of the circle indicated the values of the reliable index of the prediction results. TMHMM2.0 predicted that BrAS2-24 had a transmembrane structure of 173–191 amino acids.
Ijms 24 10534 g002
Figure 3. (A) Phylogenetic relationships of the BrAS2 gene family. (B) The distribution of the conserved domain. (C) The gene structure. (D) The distribution of the conserved motif. (E) The sequences of 15 Motifs in the BrAS2 gene family. (F) Three symbolic conserved motif logos.
Ijms 24 10534 g003
Figure 4. cis-elements of 2000 bp sequences upstream of BrAS2 genes. The statistics of cis-elements for each BrAS2 gene. Green, purple, and teal signify the presence of a specific motif, with numbers denoting the quantity. Conversely, white denotes the absence of a unique motif. The various hues flanking the squares indicate distinct biological processes.
Ijms 24 10534 g004
Figure 5. GO enrichment analysis of BrAS2s. The size of the dot bubble represents the number, and the color represents the p-value of genes for that GO term.
Ijms 24 10534 g005
Figure 6. Tissue-specific expression of BrAS2 genes. The transcriptome sequences in different B. rapa tissues from NCBI GEO with the accession number GSE43245 were downloaded, and the data were normalized using the TPM method. The heatmap shows the BrAS2 gene expression level across six tissues, including the stem, silique, root, leaf, flower, and callus. In this figure, a continuous gradient of a single red color represents the different gene expression levels in different tissues, with deeper shades of red indicating higher expression levels and, conversely, lighter shades indicating lower expression levels.
Ijms 24 10534 g006
Figure 7. Heatmaps of the expression profile of BrAS2 under several different abiotic stresses. (A) Under cold. (B) Under salt. (C) Under drought. (D) Under heat. We used unstressed B. rapa seedlings at the same growth period and under the same growth conditions as CK.
Ijms 24 10534 g007
Figure 8. Expression profiles of 4 BrAS2 genes under abiotic stress were analyzed using RT-qPCR. (A) Under cold. (B) Under drought. (C) Under salt. The above experiments were performed using 0 h as the control (CK), and the treatment time was set to 4, 6, and 12 h. Each group was subjected to three biological replicates, and error bars indicate standard errors. All values were logarithmized. Letters above data bars indicate the statistical significance (the means are arranged in descending order, with the letter “a” after the highest mean, a = 0.05).
Ijms 24 10534 g008
Figure 9. (A) Protein–protein interaction networks of AS2 protein in A. thaliana. (B) AT5G67420 (BrAS2-47 and BrAS2-10 homologous gene) PPIs. (C) AT3G49940 (BrAS2-58 homologous gene) PPIs. Each node represents a protein, and the lines between nodes represent the interactions between proteins. Node size and fill color shade are positively correlated with degree centrality.
Ijms 24 10534 g009
Figure 10. Distribution of predicted phosphorylation sites in the amino acid sequence of BrAS2s.
Ijms 24 10534 g010
Table 1. Information on the AS2 family in Brassica rapa.
Gene NameGene IDChromosome DistributionClassificationProtein Length (aa)MW (Da)PIA. thaliana ID
BrAS2-1Bra011772A01 (631422–632295)IIa23726,167.738.14AT4G37540
BrAS2-2Bra030013A01 (15744550–15745095)Ia18120,472.256.28AT3G50510
BrAS2-3Bra021513A01 (24855421–24856203)Id26029,654.865.19AT3G13850
BrAS2-4Bra021433A01 (25233613–25234491)IIb26428,181.178.9AT3G02550
BrAS2-5Bra039733A02 (9622401–9623009)Ia20222,093.857.1AT1G65620
BrAS2-6Bra008062A02 (12966840–12967397)Id18521,098.418.3AT1G72980
BrAS2-7Bra008514A02 (16097898–16100589)Ic22423,732.846.53AT4G00220
BrAS2-8Bra033019A02 (21869558–21869956)Ia13214,678.526.89AT3G27650
BrAS2-9Bra032938A02 (22395463–22401919)Ia29432,145.264.78AT3G26660
BrAS2-10Bra031833A02 (27641733–27642526)IIa24125,985.188.46AT5G67420
BrAS2-11Bra022780A03 (7018824–7021941)Ia18820,973.786.21AT2G30130
BrAS2-12Bra000188A03 (9790598–9791563)Ib19921,455.458.8AT2G40470
BrAS2-13Bra000257A03 (10204676–10206488)Ic23825,950.976.88AT2G42430
BrAS2-14Bra000491A03 (11383294–11384774)Ia23125,396.574.9AT2G28500
BrAS2-15Bra001087A03 (14672898–14673260)Ic12012,555.1110.63AT3G03760
BrAS2-16Bra012913A03 (21540949–21541767)IIa24126,607.16.89AT3G49940
BrAS2-17Bra019365A03 (24669629–24670232)Id15717,587.864.73AT5G35900
BrAS2-18Bra019364A03 (24677058–24677660)Id15617,566.684.72AT5G63090
BrAS2-19Bra017831A03 (30772548–30773423)IIa23225,301.19.1AT4G37540
BrAS2-20Bra014581A04 (1568864–1569640)Ic21924,375.976.28AT3G58190
BrAS2-21Bra032153A04 (10493828–10494754)Ia30834,410.774.83AT2G23660
BrAS2-22Bra035698A04 (12731349–12732755)Ia22925,158.44.82AT2G28500
BrAS2-23Bra021612A04 (13416815–13417633)Ia19021,127.985.91AT2G30130
BrAS2-24Bra021737A04 (14176806–14179238)Ic23926,536.27.05AT2G31310
BrAS2-25Bra016992A04 (17230175–17231282)Ib20121,738.627.68AT2G40470
BrAS2-26Bra016877A04 (17780078–17781492)Ic24626,618.568.11AT2G42430
BrAS2-27Bra016876A04 (17786570–17788024)Ic26429,442.976.29AT2G42440
BrAS2-28Bra040312A04 (18539194–18539789)Ic16818,604.47.68AT2G45410
BrAS2-29Bra040311A04 (18545871–18547692)Ic25927,132.398.19AT2G45420
BrAS2-30Bra004572A05 (848386–849380)Ib22324,453.858.73AT2G40470
BrAS2-31Bra004693A05 (1378014–1379047)Ic24426,262.198.15AT2G42430
BrAS2-32Bra004908A05 (2423168–2423825)Ic18820,738.626.29AT2G45410
BrAS2-33Bra004910A05 (2431903–2433701)Ic25326,065.298.51AT2G45420
BrAS2-34Bra018260A05 (6977723–6978406)Ic19321,602.685.93AT2G31310
BrAS2-35Bra018320A05 (7426670–7428607)Ib23625,340.528.88AT2G30340
BrAS2-36Bra018335A05 (7526963–7527792)Ia18921,0796.03AT2G30130
BrAS2-37Bra027392A05 (20677617–20678129)Id17019,756.714.5AT3G13850
BrAS2-38Bra034867A05 (21803639–21804157)Ib17218,765.486.58AT3G11090
BrAS2-39Bra018675A06 (2680223–2681288)Ia20622,866.924.96AT2G28500
BrAS2-40Bra026042A06 (6372131–6373653)Ia16318,075.778.53AT1G16530
BrAS2-41Bra018102A06 (10251078–10252128)Id31836,165.125.07AT3G47870
BrAS2-42Bra038606A06 (14136819–14137364)Ia18119,910.58.29AT5G63090
BrAS2-43Bra025294A06 (22339538–22339936)Ia13214,563.437.58AT3G27650
BrAS2-44Bra025217A06 (22711432–22712256)Ia10711,876.756.57AT3G26620
BrAS2-45Bra036436A07 (499213–500551)Ic27529,136.327.27AT3G03760
BrAS2-46Bra014907A07 (5302258–5303262)Ia17218,669.097.61AT1G31320
BrAS2-47Bra012164A07 (9636805–9637668)IIa25627,868.248.4AT5G67420
BrAS2-48Bra012112A07 (9939966–9940982)Ia33837,528.626.54AT5G66870
BrAS2-49Bra011942A07 (11079984–11081436)Ia23325,579.894.88AT2G28500
BrAS2-50Bra004315A07 (17939314–17940220)IIb23725,763.18.05AT1G68510
BrAS2-51Bra030647A08 (20962015–20962608)Id19722,476.049.68AT1G06280
BrAS2-52Bra037323A09 (1067402–1069396)Ic22423,588.826.43AT4G00220
BrAS2-53Bra037322A09 (1073182–1074567)Ic22224,234.346.16AT4G00210
BrAS2-54Bra039072A09 (1261020–1261415)Ia13114,582.527.6AT3G27650
BrAS2-55Bra035860A09 (3268177–3268707)Ia17619,265.768.56AT5G63090
BrAS2-56Bra037847A09 (3873152–3873956)IIa23625,719.089.03AT5G67420
BrAS2-57Bra037142A09 (4287000–4288184)Ia39444,228.215.62AT5G66870
BrAS2-58Bra036040A09 (24873579–24874625)IIa24526,699.276.82AT3G49940
BrAS2-59Bra007385A09 (28936037–28936836)Ic22524,753.196.01AT3G58190
BrAS2-60Bra026716A09 (33360480–33361740)Ia16418,506.269.15AT1G16530
BrAS2-61Bra031599A09 (35646044–35647161)Ia20723,134.334.87AT2G28500
BrAS2-62Bra009161A10 (15474429–15475061)Ic18320,624.285.72AT5G06080
“MW” is molecular weight. “PI” is isoelectric point.
Disclaimer/Publisher’s Note: The statements, opinions and data contained in all publications are solely those of the individual author(s) and contributor(s) and not of MDPI and/or the editor(s). MDPI and/or the editor(s) disclaim responsibility for any injury to people or property resulting from any ideas, methods, instructions or products referred to in the content.

