

Antidiabetic and Immunoregulatory Activities of Extract of Phyllanthus emblica L. in NOD with Spontaneous and Cyclophosphamide-Accelerated Diabetic Mice

Abstract
:1. Introduction
2. Results
2.1. Animal Study
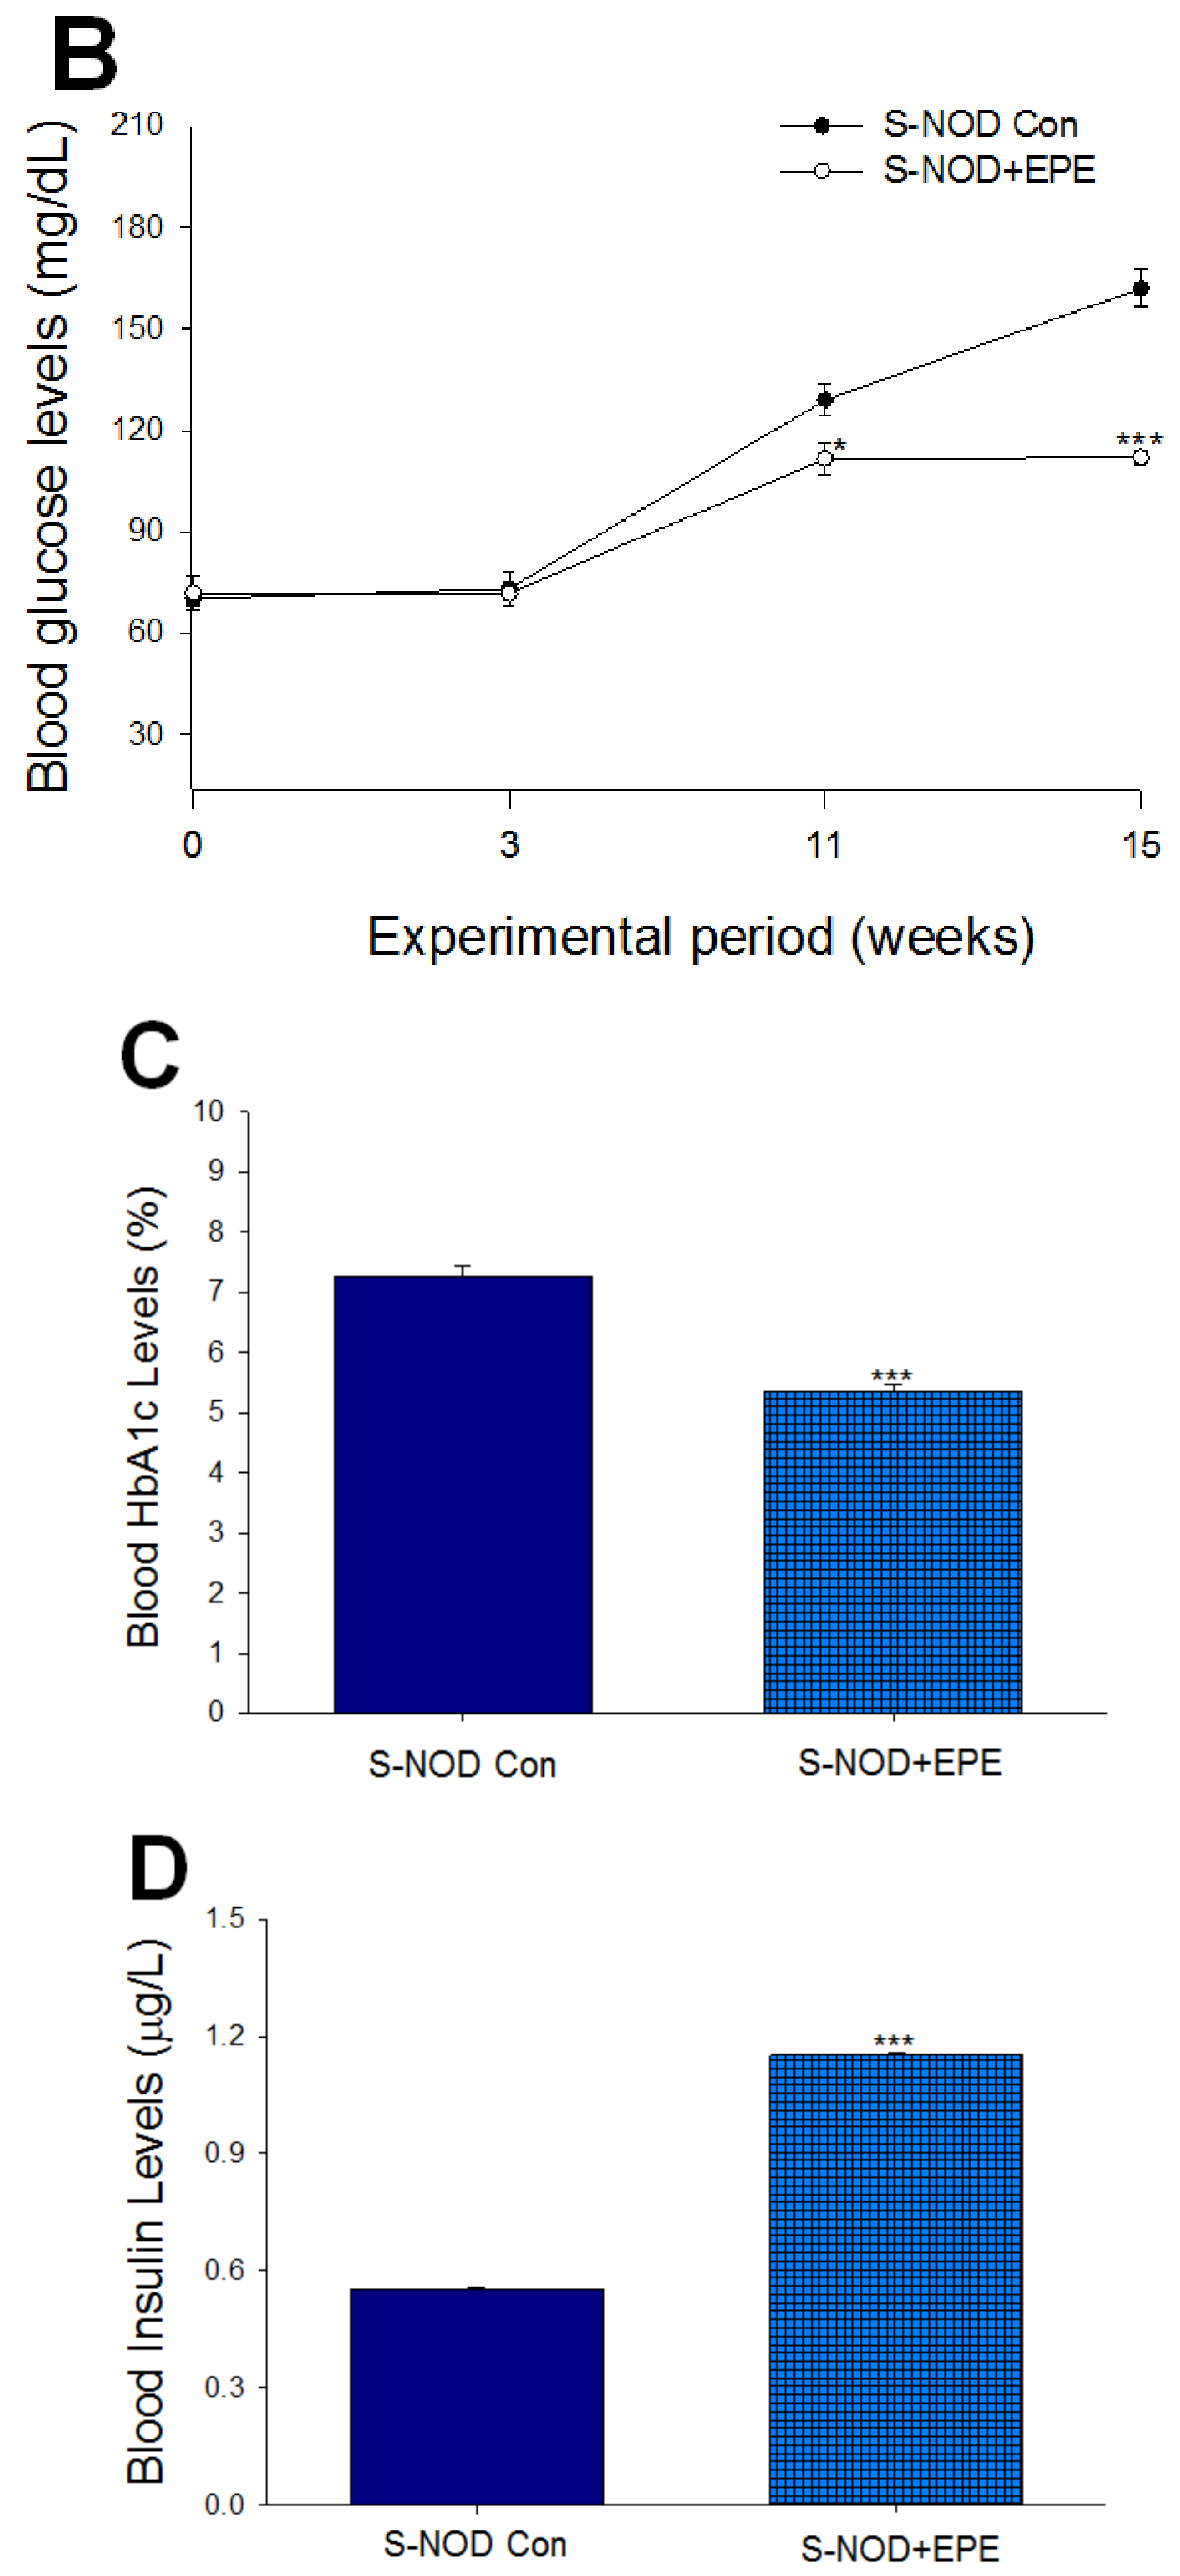
2.1.1. Part I: Effects of Ethyl Acetate Extract from Phyllanthus emblica L. (EPE) in S-NOD T1D Mice
Body Weight, Relative Tissue Weight, Blood Glucose, HbA1C, Insulin, Adiponectin, and Leptin Levels
Pro-Inflammatory Cytokines
Flow Cytometry
Target Gene Expression Levels in The Pancreas
Insulin-Expressing β Cells, IRS Score on Glucagon and Insulin, and the Pancreatic Islet Numbers
The Percentage of Bcl-2/Bax
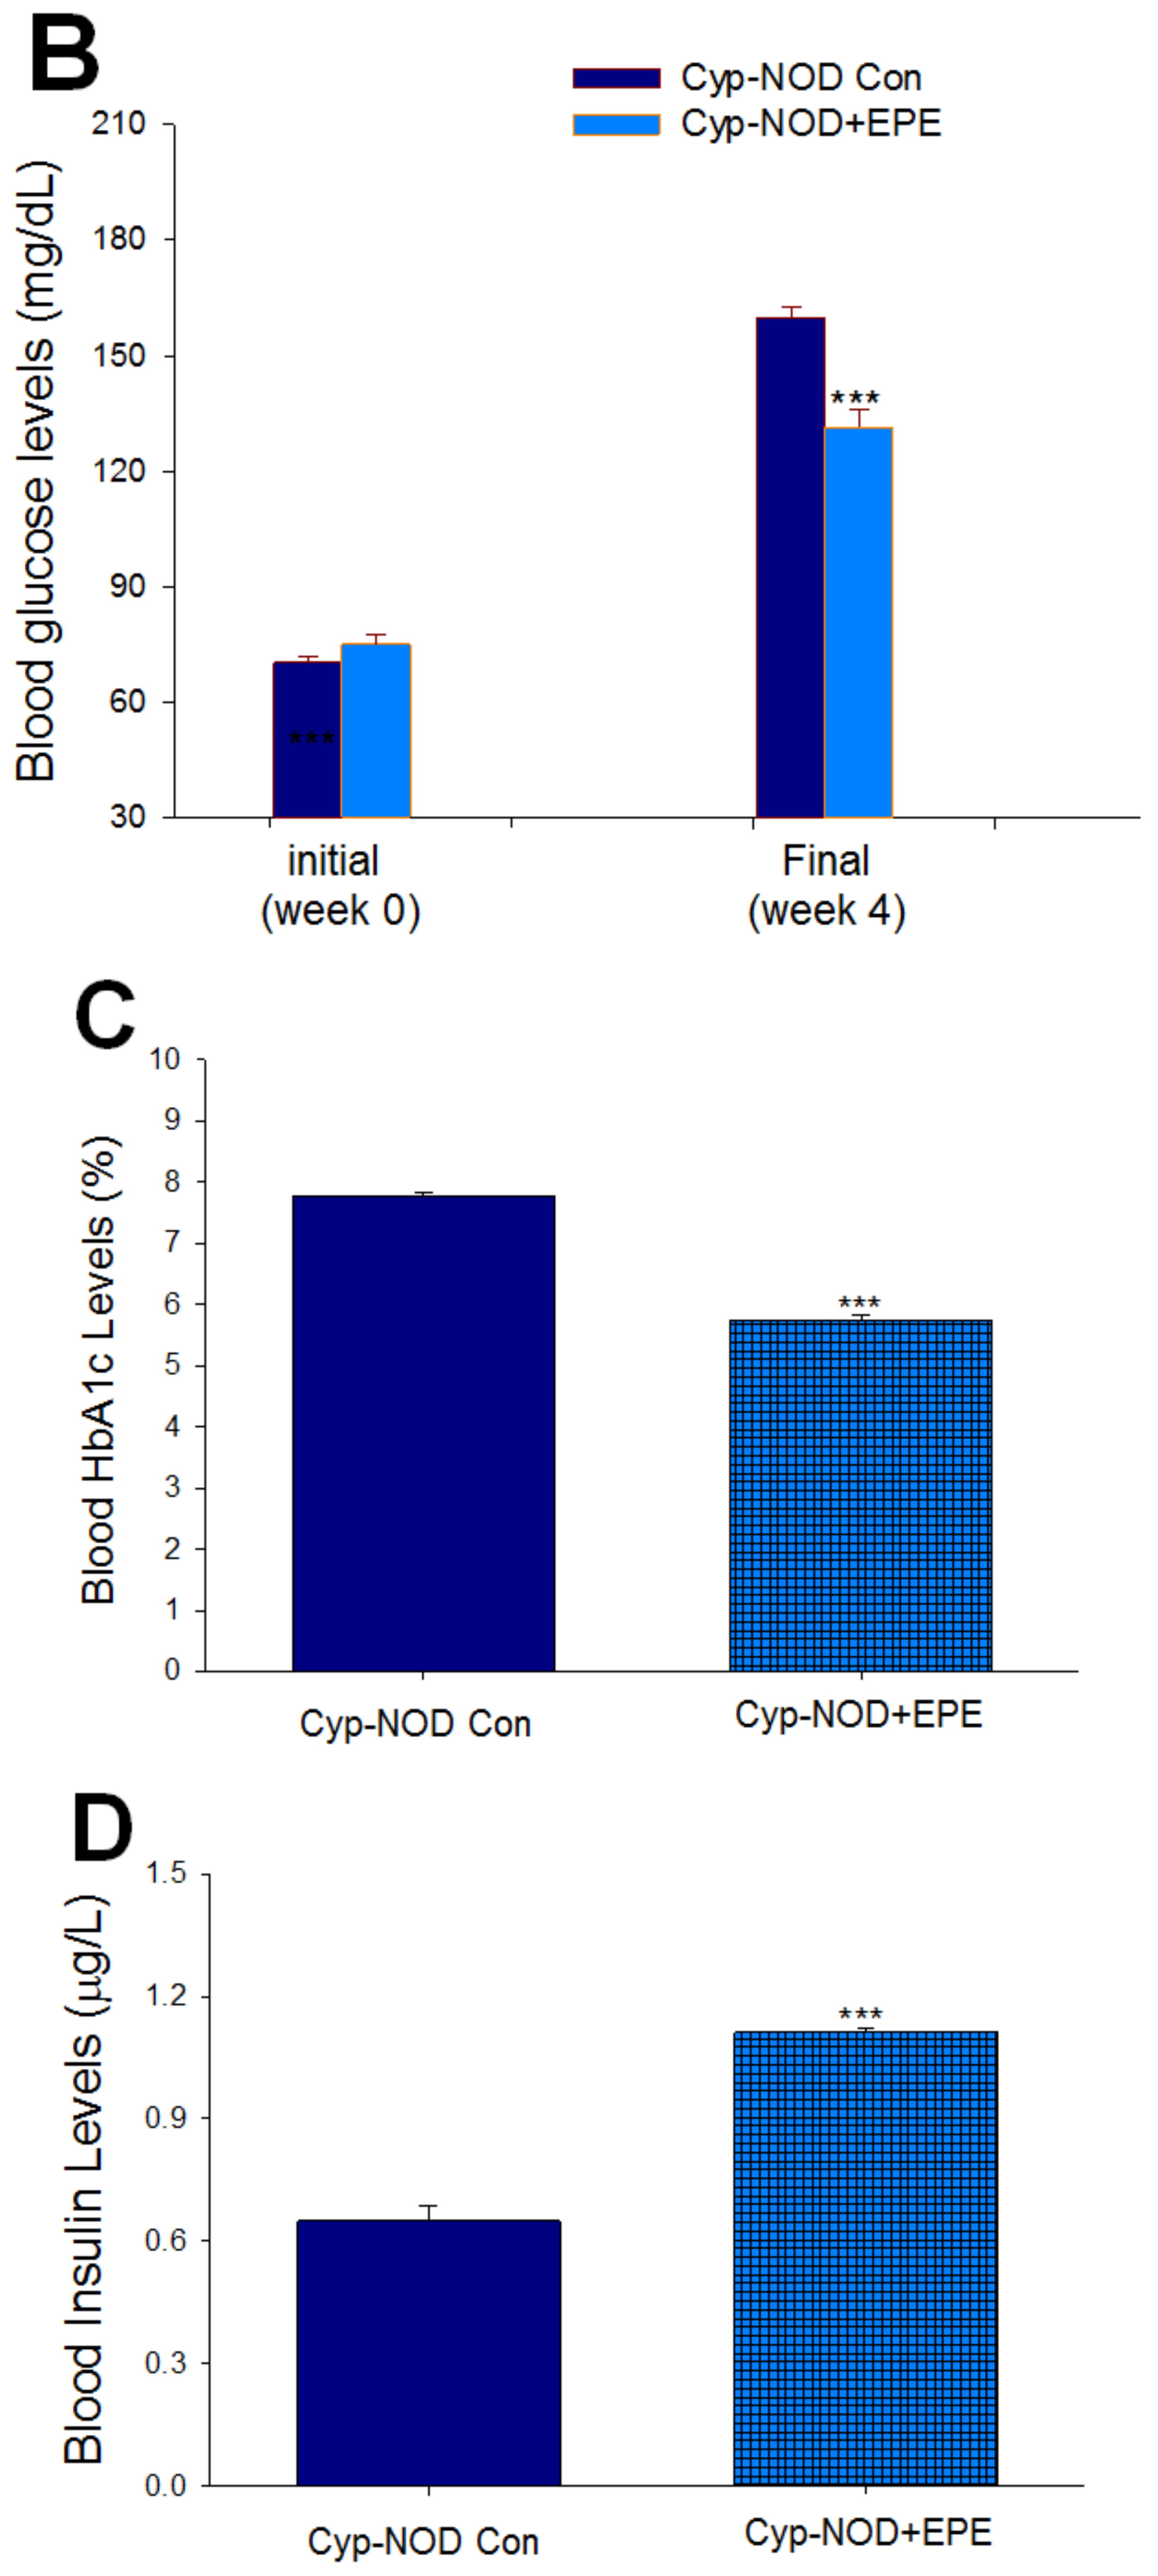
2.1.2. Part II: Effects of EPE in Cyp-Induced T1D Mice
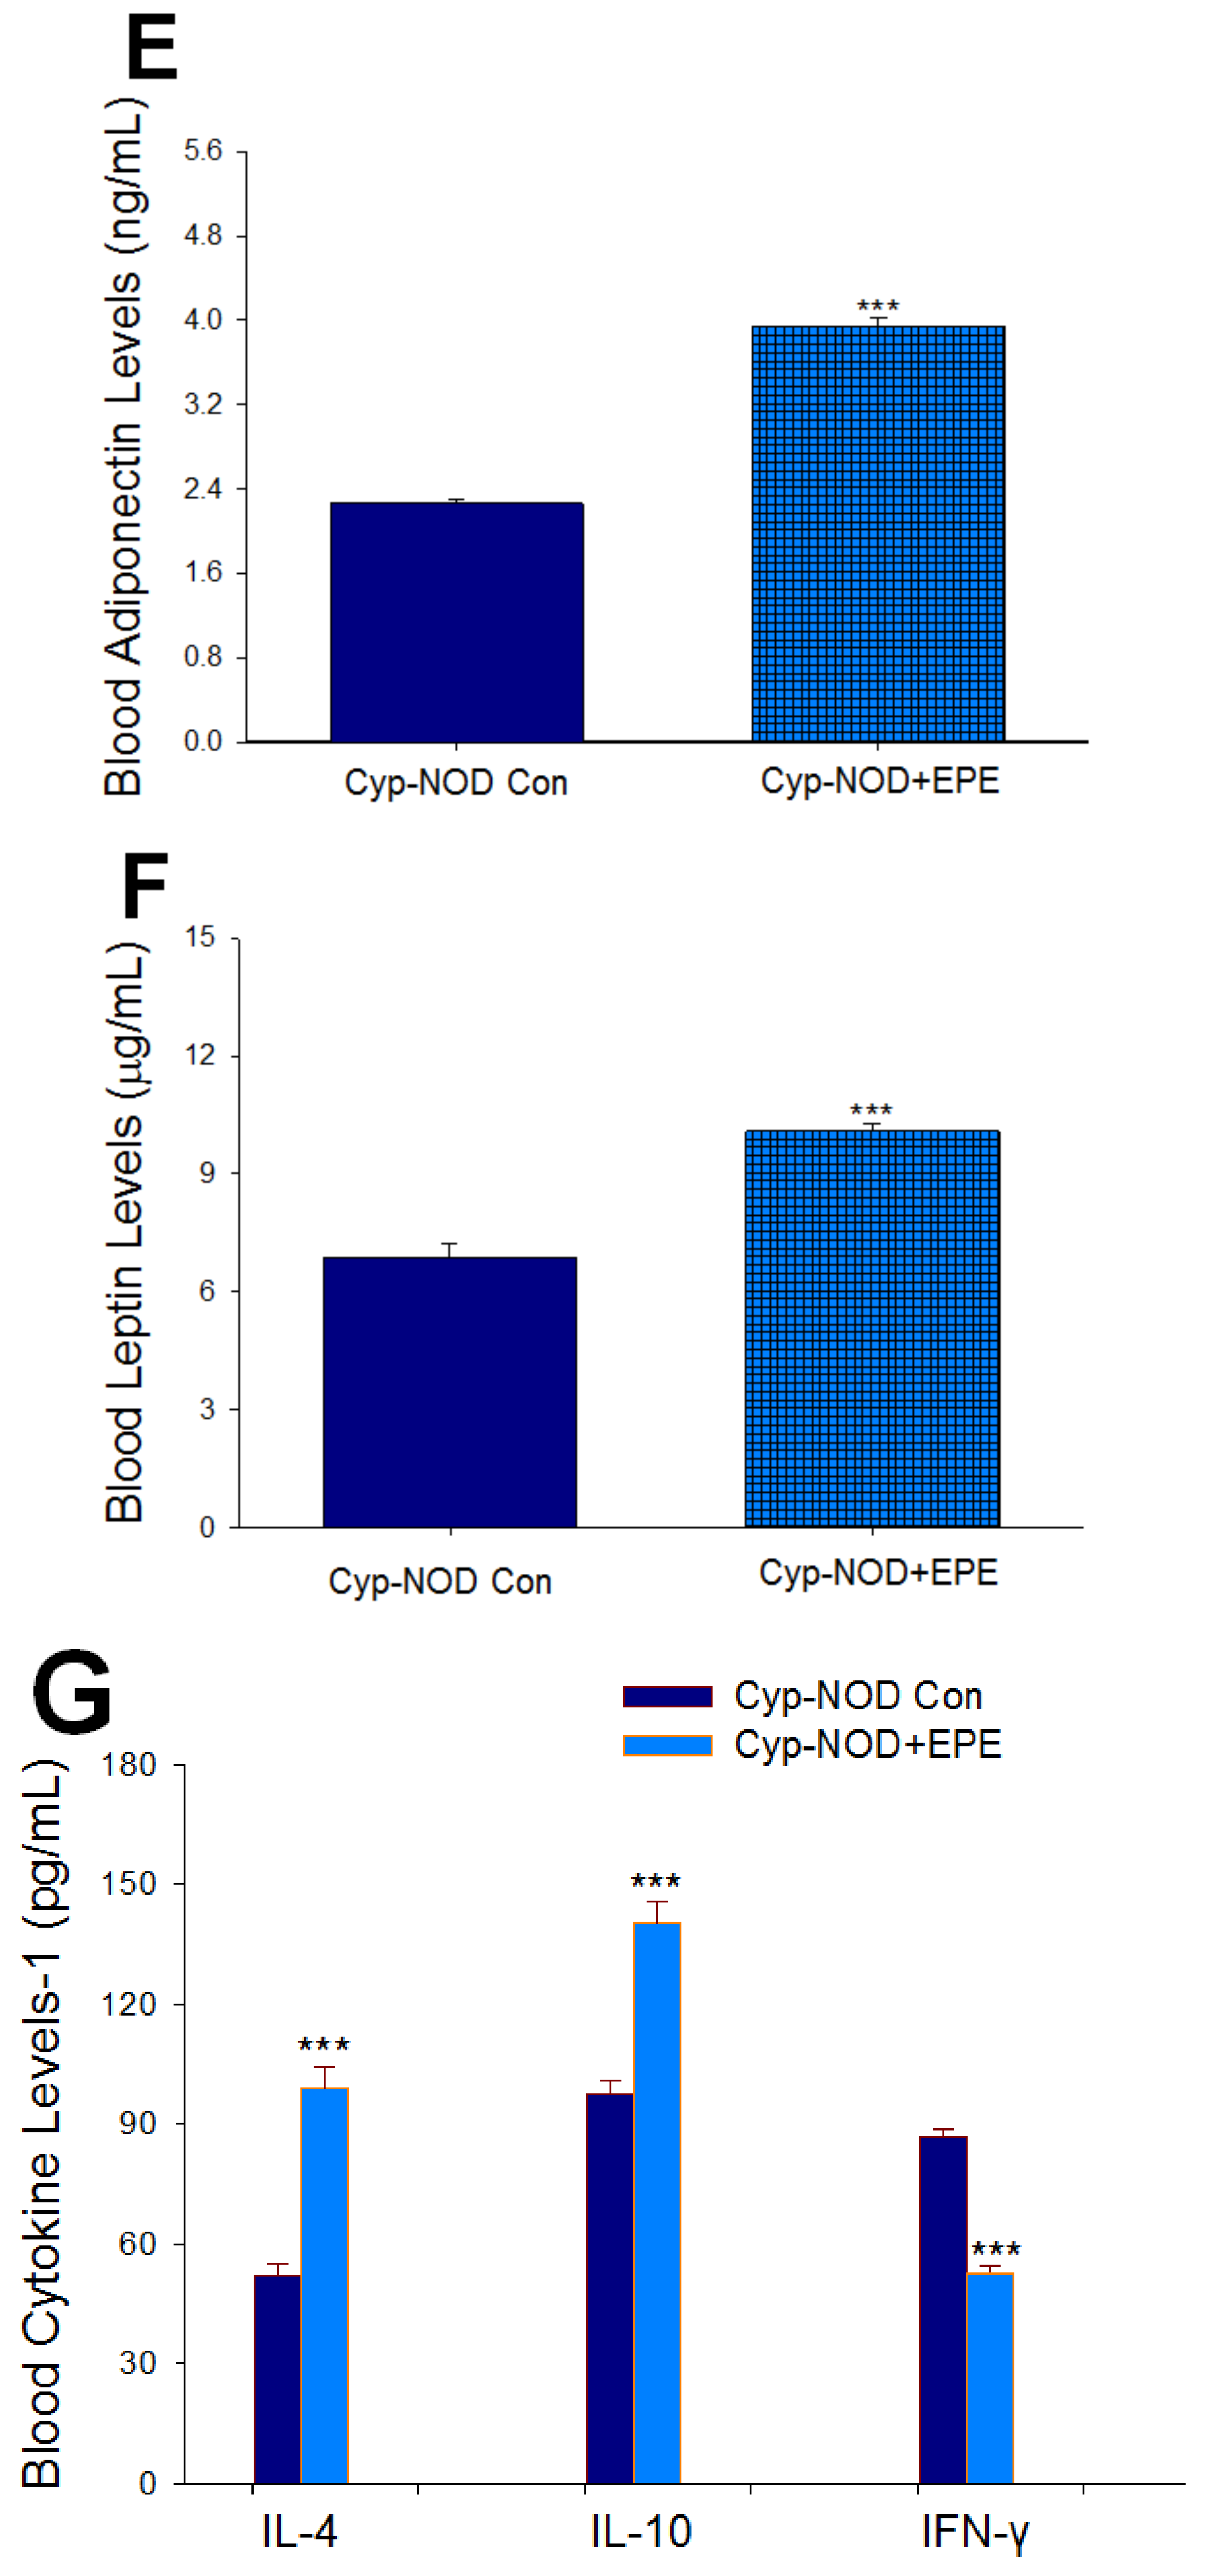
Body Weight, Relative Tissue Weight, Blood Glucose, HbA1C, Insulin, Adiponectin, and Leptin Levels
Pro-Inflammatory Cytokines
Flow Cytometry
Target Gene Expression Levels in The Pancreas
Insulin-Expressing β Cells, IRS Score on Insulin, and the Pancreatic Islet Numbers
The Percentage of Bcl-2/Bax
2.2. Preparation of Seven Fractions of EPE
2.2.1. Seven Fractions of EPE on Targeted Gene Expressions In Vitro
2.2.2. Analysis of EA-6 Fraction
3. Discussion
4. Materials and Methods
4.1. Chemicals
4.2. Fruit Materials
4.3. Preparation of Ethyl Acetate Extract from Phyllanthus emblica L. (EPE)
4.4. Animal Treatments
4.4.1. Part I: EPE or Vehicle Administered to S-NOD Mice
4.4.2. Part II: EPE or Vehicle Administered to Cyp-NOD Mice
4.4.3. Measurements of Blood Glucose, HbA1C, Insulin, Adiponectin, and Leptin Levels
4.4.4. Assessment of Pro-Inflammatory Cytokines
4.4.5. Flow Cytometry (Fluorescence Activated Cell Sorting; FACS)
4.4.6. Histological Examination and Immunohistochemical (IHC)
4.4.7. Immunofluorescence Staining (IF)
4.4.8. Western Blotting Assay
4.4.9. Preparation of Seven Fractions of EPE
4.4.10. Analysis of Seven Fractions of EPE on Targeted Gene Expressions In Vitro
4.4.11. HPLC Analysis
Fingerprint Analysis by HPLC
Determination of Phenolic Compounds
4.5. Statistical Analysis
5. Conclusions
Author Contributions
Funding
Institutional Review Board Statement
Informed Consent Statement
Data Availability Statement
Conflicts of Interest
Abbreviations
References
- Atkinson, M.A.; Maclaren, N.K. The pathogenesis of insulin dependent diabetes mellitus. N. Engl. J. Med. 1994, 331, 1428–1436. [Google Scholar] [PubMed]
- Roep, B.O.; Kallan, A.A.; De Vries, R.R. Beta-cell antigen-specific lysis of macrophages by CD4 T-cell clones from newly diagnosed IDDM patient, A putative mechanism of T-cell-mediated autoimmune islet cell destruction. Diabetes 1992, 41, 1380–1384. [Google Scholar] [CrossRef] [PubMed]
- Katz, J.D.; Benoist, C.; Mathis, D. T helper cell subsets in insulin-dependent diabetes. Science 1995, 268, 1185–1188. [Google Scholar] [CrossRef]
- Perone, M.J.; Bertera, S.; Shufesky, W.J.; Divito, S.J.; Montecalvo, A.; Mathers, A.R.; Larregina, A.T.; Pang, M.; Seth, N.; Wucherpfenning, K.W.; et al. Suppression of autoimmune diabetes by soluble galectin-1. J. Immunol. 2009, 182, 2641–2653. [Google Scholar] [CrossRef] [PubMed] [Green Version]
- Walker, L.S.K.; von Herrath, M. CD4T cell differentiation in type 1 diabetes. Clin. Exp. Immunol. 2016, 183, 16–29. [Google Scholar] [CrossRef] [Green Version]
- Park, H.; Li, Z.; Yang, X.O.; Chang, S.H.; Nurieva, R.; Wang, Y.-H.; Wang, Y.; Hood, L.; Zhu, Z.; Tian, Q.; et al. A distinct lineage of CD4T cells regulates tissue inflammation by producing interleukin 17. Nat. Immunol. 2005, 6, 1133–1141. [Google Scholar] [CrossRef] [Green Version]
- Harrington, L.E.; Hatton, R.D.; Mangan, P.R.; Turner, H.; Murphy, T.L.; Murphy, K.M.; Weaver, C.T. Interleukin 17-producing CD4+ effector T cells develop via a lineage distinct from the T helper type 1 and 2 lineages. Nat. Immunol. 2005, 6, 1123–1132. [Google Scholar] [CrossRef]
- Steinman, L. A brief history of T(H)17, the first major revision in the T(H)1/T(H)2 hypothesis of T cell-mediated tissue damage. Nat. Med. 2007, 13, 139–145. [Google Scholar] [CrossRef]
- Li, C.R.; Mueller, E.E.; Bradley, L.M. Islet antigen-specific Th17 cells can induce TNF-alpha-dependent autoimmune diabetes. J. Immunol. 2014, 192, 1425–1432. [Google Scholar] [CrossRef] [Green Version]
- Vukkadapu, S.S.; Belli, J.M.; Ishii, K.; Jegga, A.G.; Hutton, J.J.; Aronow, B.J.; Katz, J.D. Dynamic interaction between T cell-mediated beta-cell damage and beta-cell repair in the run up to autoimmune diabetes of the NOD mouse. Physiol. Genom. 2005, 21, 201–211. [Google Scholar] [CrossRef] [Green Version]
- Wong, F.S.; Wen, L. Therapy: Immunotherapy for T1DM-targeting innate immunity. Nat. Rev. Endocrinol. 2013, 9, 384–385. [Google Scholar] [CrossRef] [PubMed] [Green Version]
- Xu, Y.X. Chemical Constituents of Phyllanthus emblica L. and Technology for Extraction of Total Phenols. Ph.D. Thesis, Beijing University of Chinese Medicine, Beijing, China, 2009. [Google Scholar]
- Scartezzini, P.; Speroni, E. Review on some plants of Indian traditional medicine with antioxidant activity. J. Ethnopharmacol. 2000, 71, 23–43. [Google Scholar] [CrossRef] [PubMed]
- Tanaka, T.; Yang, C.R.; Kouno, I. Phyllanemblinins A-F, new ellagitannins from Phyllanthus emblica. J. Nat. Prod. 2001, 64, 1527–1532. [Google Scholar]
- Kumaran, A.; Karunakaran, R.J. Nitric oxide radical scavenging active components from Phyllanthus emblica L. Plant Foods Hum. Nutr. 2006, 61, 1–5. [Google Scholar] [CrossRef] [PubMed]
- Poltanov, E.A.; Shikov, A.N.; Dorman, H.; Pozharistskaya, O.N.; Makarov, V.G.; Tikhonov, V.P.; Hiltunen, R. Chemical and antioxidant evaluation of Indian gooseberry (Emblica officinalis Gaertn., syn. Phyllanthus emblica L.) supplements. Phytother. Res. 2009, 23, 1309–1315. [Google Scholar] [CrossRef]
- Babu, P.S.; Prince, P.S.M. Antihyperglycaemic and antioxidant effect of hyponidd, an ayurvedic herbomineral formulation in streptozotocin-induced diabetic rats. J. Pharm. Pharmacol. 2004, 56, 1435–1442. [Google Scholar] [CrossRef]
- Naik, G.H.; Priyadarsini, K.I.; Bhagirathi, R.G.; Mishra, B.; Mishra, K.P.; Banavalikar, M.M.; Mohan, H. In vitro antioxidant studies and free radical reactions of triphala, an ayurvedic formulation and its constituents. Phytother. Res. 2005, 19, 582–586. [Google Scholar] [CrossRef]
- Rao, T.P.; Sakaguchi, N.; Juneja, L.R.; Wada, E.; Yokozawa, T. Amla (Emblica officinalis Gaertn.) extracts reduce oxidative stress in streptozotocin-induced diabetic rats. J. Med. Food 2005, 8, 362–368. [Google Scholar] [CrossRef]
- Liu, X.; Zhao, M.; Wang, J.; Yang, B.; Jiang, Y. Antioxidant activity of methanolic extract of emblica fruit (Phyllanthus emblica L.) from six regions in China. J. Food Compos. Anal. 2008, 21, 219–228. [Google Scholar] [CrossRef]
- Nampoothiri, S.V.; Prathapan, A.; Cherian, O.L.; Raghu, K.G.; Venugopalan, V.V.; Sundaresan, A. In vitro antioxidant and inhibitory potential of Terminalia bellerica and Emblica officinalis fruits against LDL oxidation and key enzymes linked to type 2 diabetes. Food Chem. Toxicol. 2011, 49, 125–131. [Google Scholar] [CrossRef]
- Suryanarayana, P.; Saraswat, M.; Petrash, J.M.; Reddy, G.B. Emblica officinalis and its enriched tannoids delay streptozotocin-induced diabetic cataract in rats. Mol. Vis. 2007, 13, 1291–1297. [Google Scholar] [PubMed]
- Kim, H.Y.; Okubo, T.; Juneja, L.R.; Yokozawa, T. The protective role of amla (Emblica officinalis Gaertn.) against fructose-induced metabolic syndrome in a rat model. Br. J. Nutr. 2010, 103, 502–512. [Google Scholar] [CrossRef] [PubMed] [Green Version]
- Driver, J.P.; Serreze, D.V.; Chen, Y.G. Mouse models for the study of autoimmune type 1 diabetes: A NOD to similarities and differences to human disease. Semin. Immunopathol. 2011, 33, 67–87. [Google Scholar] [CrossRef] [PubMed]
- Augstein, P.; Elefanty, A.G.; Allison, J.; Harrison, L.C. Apoptosis and beta-cell destruction in pancreatic islets of NOD mice with spontaneous and cyclophosphamide-accelerated diabetes. Diabetologia 1998, 41, 1381–1388. [Google Scholar] [CrossRef]
- Huang, S.; Czech, M.P. The GLUT4 glucose transporter. Cell Metab. 2007, 5, 237–252. [Google Scholar] [CrossRef] [Green Version]
- Bryant, N.J.; Govers, R.; James, D.E. Regulated transport of the glucose transporter GLUT4. Nat. Rev. Mol. Cell Biol. 2002, 3, 267–277. [Google Scholar] [CrossRef]
- Holmes, B.; Dohm, G.L. Regulation of GLUT4 gene expression during exercise. Med. Sci. Sports Exerc. 2004, 36, 1202–1206. [Google Scholar] [CrossRef]
- Mackenzie, R.W.; Elliot, B.T. Akt/PKB activation and insulin signaling: A novel insulin signaling pathway in the treatment of type 2 diabetes. Diabetes Metab. Syndr. Obes. 2014, 7, 55–64. [Google Scholar] [CrossRef] [Green Version]
- Sriwijitkamol, A.; Coletta, D.K.; Wajcberg, E.; Balbontin, G.B.; Reyna, S.M.; Barrientes, J.; Eagan, P.A.; Jenkinson, C.P.; Cersosimo, E.; DeFronzo, R.A.; et al. Effect of acute exercise on AMPK signaling in skeletal muscle of subjects with type 2 diabetes: A time-course and dose-response study. Diabetes 2007, 56, 836–848. [Google Scholar] [CrossRef] [Green Version]
- Kasote, D.M.; Katyare, S.S.; Hegde, M.V.; Bae, H. Significance of antioxidant potential of plants and its relevance to therapeutic applications. Int. J. Biol. Sci. 2015, 11, 982–991. [Google Scholar] [CrossRef] [Green Version]
- Wang, H. Possibility of preventing type 1 diabetes mellitus. Chin. J. Endocrinol. Metab. 2001, 17, 5–6. [Google Scholar]
- O’Brien, B.A.; Harmon, B.V.; Cameron, D.P.; Allan, D.J. Nicotinamide prevents the development of diabetes in the cyclophosphamide-induced NOD mouse model by reducing beta-cell apoptosis. J. Pathol. 2000, 191, 86–92. [Google Scholar] [CrossRef]
- Leng, Y.; Gu, Z.P.; Cao, L. Apoptosis induced by droloxifene and C-myc, Bax, Bcl-2 protein expression in corpus luteum of pregnant rats. Acta Pharmacol. Sin. 2001, 22, 327–334. [Google Scholar] [PubMed]
- Sobel, D.O.; Yankelevich, B.; Goyal, D.; Nelson, D.; Mazumdaer, A. The B-subunit of cholera toxin induces immunoregulatory cells and prevents diabetes in the NOD mouse. Diabetes 1998, 47, 186–191. [Google Scholar] [CrossRef] [PubMed]
- Rabinovitch, A. Immunoregulation by cytokines in autoimmune diabetes. Adv. Exp. Med. Biol. 2003, 520, 159–193. [Google Scholar] [PubMed]
- Abbasi, F.; Amiri, P.; Sayahpour, F.A.; Pirmoradi, S.; Abolhalaj, M.; Larijani, B.; Bazzaz, J.T.; Amoli, M.M. TGF-β and IL-23 gene expression in unstimulated PBMCs of patients with diabetes. Endocrine 2012, 41, 430–434. [Google Scholar] [CrossRef]
- Eggleton, P.; Bremer, E.; Tarr, J.M.; Bruyn, M.de.; Helfrich, W.; Kendall, A.; Haigh, R.C.; Viner, N.J.; Winyard, P.G. Frequency of Th17 CD20+ cells in the peripheral blood of rheumatoid arthritis patients is higher compared to health subjects. Arthritis Res. Ther. 2011, 13, R208. [Google Scholar] [CrossRef] [Green Version]
- Li, Y.; Liu, Y.; Chu, C.Q. Th17 cells in type 1 diabetes: Role in the pathogenesis and regulation by gut microbiome. Mediat. Inflamm. 2015, 2015, 638470. [Google Scholar] [CrossRef] [Green Version]
- Kim, C.H. FOXP3 and its role in the immune system. Adv. Exp. Med. Biol. 2009, 665, 17–29. [Google Scholar]
- Honkanen, J.; Nieminen, J.K.; Gao, R.; Luopajärvl, K.; Salo, H.M.; Ilonen, J.; Knip, M.; Otonkoski, T.; Vaarala, O. IL-17 immunity in human type 1 diabetes. J. Immunol. 2010, 185, 1959–1967. [Google Scholar] [CrossRef] [Green Version]
- Marwaha, A.K.; Crome, S.Q.; Panagiotopoulos, C.; Berg, K.B.; Qin, H.; Ouyang, Q.; Xu, L.; Priatel, J.J.; Levings, M.K.; Tan, R. Cutting edge: Increased IL-17-secreting T cells in children with new-onset type 1 diabetes. J. Immunol. 2010, 185, 3814–3818. [Google Scholar] [CrossRef] [PubMed] [Green Version]
- Acosta-Rodriguez, E.V.; Napolitani, G.; Lanzavecchia, A.; Sallusto, F. Interleukins 1beta and 6 but not transforming growth factor-beta are essential for the differentiation of interleukin 17- producing human T helper cells. Nat. Immunol. 2007, 8, 942–949. [Google Scholar] [CrossRef] [PubMed]
- Wilson, N.J.; Boniface, K.; Chan, J.R.; McKenzie, B.S.; Blumenschein, W.B.; Mattson, J.D.; Basham, B.; Smith, K.; Chen, T.; Morel, F.; et al. Development, cytokine profile and function of human interleukin 17-producing helper T cells. Nat. Immunol. 2007, 8, 950–957. [Google Scholar] [CrossRef] [PubMed]
- Bradshaw, E.W.; Raddassi, K.; Elyaman, W.; Orban, T.; Gottlieb, P.A.; Kent, S.C.; Hafler, D.A. Monocytes from patients with type 1 diabetes spontaneously secret proinflammatory cytokines including Th17 cells. J. Immunol. 2009, 183, 4432–4439. [Google Scholar] [CrossRef] [PubMed] [Green Version]
- Bettelli, E.; Carrier, Y.; Gao, W.; Korn, T.; Strom, T.B.; Oukka, M.; Weiner, H.L.; Kuchroo, V.K. Reciprocal developmental pathways for the generation of pathogenic effector TH17 and regulatory T cells. Nature 2006, 441, 235–238. [Google Scholar] [CrossRef]
- Wu, X.; Motoshima, H.; Mahadev, K.; Stalker, T.J.; Scalia, R.; Goldstein, B.J. Involvement of AMP-activated protein kinase in glucose uptake stimulated by the globular domain of adiponectin in primary rat adipocytes. Diabetes 2003, 52, 1355–1363. [Google Scholar] [CrossRef] [Green Version]
- Wang, M.-Y.; Chen, L.; Clark, G.O.; Lee, Y.; Stevens, R.D.; Ilkayeva, O.R.; Wenner, B.R.; Bain, J.R.; Charron, M.J.; Newgard, C.B.; et al. Leptin therapy in insulin-deficient type 1 diabetes. Proc. Natl. Acad. Sci. USA 2010, 107, 4813–4819. [Google Scholar] [CrossRef] [Green Version]
- Minokoshi, Y.; Kahn, C.R.; Kahn, B.B. Tissue-specific ablation of the GLUT4 glucose transporter or the insulin receptor challenges assumptions about insulin action and glucose homeostasis. J. Biol. Chem. 2003, 278, 33609–33612. [Google Scholar] [CrossRef] [Green Version]
- Zhang, J.; Miao, D.; Zhu, W.F.; Xu, J.; Liu, W.Y.; Kitdamrongtham, W.; Manosroi, J.; Abe, M.; Akihisa, T.; Feng, F. Biological activities of phenolic from the fruits of Phyllanthus emblica L. (Euphorbiaceae). Chem. Biodivers. 2017, 14, e1700404. [Google Scholar] [CrossRef]
- Bai, J.; Zhang, Y.; Tang, C.; Hou, Y.; Ai, X.; Chen, X.; Zhang, Y.; Wang, X.; Meng, X. Gallic acid: Pharmacological activities and molecular mechanisms involved in inflammation-related diseases. Biomed. Pharmacother. 2021, 133, 110985. [Google Scholar] [CrossRef]
- BenSaad, L.A.; Kim, K.H.; Quah, C.C.; Kim, W.R.; Shahimi, M. Anti-inflammatory potential of ellagic acid, gallic acid and punicalagin A&B isolated from Punica granatum. BMC Complement. Altern. Med. 2017, 17, 47. [Google Scholar]
- Hamada, S.; Kataoka, T.; Woo, J.T.; Yamada, A.; Yoshida, Y.; Nishimura, T.; Otake, N.; Nagai, K. Immunosuppressive effects of gallic acid and chebulagic acid on CTL-mediated cytotoxicity. Biol. Pharm. Bull. 1997, 20, 1017–1019. [Google Scholar] [CrossRef] [PubMed] [Green Version]
- Lin, C.H.; Wu, J.B.; Jian, J.Y.; Shih, C.C. (–)-Epicatechin-3-O-β-D-allopyranoside from Davallia formosana prevents diabetes and dyslipidemia in streptozotocin-induced diabetic mice. PLoS ONE 2017, 12, e0173984. [Google Scholar] [CrossRef] [PubMed] [Green Version]
- Lin, C.H.; Kuo, Y.H.; Shih, C.C. Antidiabetic and antihyperlipidemic effects of sulphurenic acid, a triterpenoid compound from Antrodia camphorata, in streptozotocin-induced diabetic mice. Int. J. Mol. Sci. 2019, 20, 4897. [Google Scholar] [CrossRef] [Green Version]
- Lin, C.H.; Kuo, Y.H.; Shih, C.C. Antidiabetic and hypolipidemic activities of eburicoic acid, a triterpenoid compound from Antrodia camphorata by regulation of Akt phosphorylation, gluconeogenesis, and PPARα in streptozotocin-induced diabetic mice. RSC Adv. 2018, 8, 20462–20467. [Google Scholar] [CrossRef] [Green Version]
- Gonzalez, R.; Tiwari, A.; Unniappan, S. Pancreatic beta cells colocalize insulin and pronesfatin immunoreactivity in rodents. Biochem. Biophys. Res. Commun. 2009, 381, 643–648. [Google Scholar] [CrossRef]
- Fedchenko, N.; Reifenrath, J. Different approaches for interpretation and reporting of immunohisto- chemistry analysis results in the bone tissue—A review. Diagn. Pathol. 2014, 9, 221. [Google Scholar] [CrossRef] [Green Version]
- Lin, C.H.; Kuo, Y.H.; Shih, C.C. Eburicoic acid, a Triterpenoid compound from Antrodia camphorata, displays antidiabetic and antihyperlipidemic effects in palmitate-treated C2C12 myotubes and in high-fat diet-fed Mice. Int. J. Mol. Sci. 2017, 18, 2314. [Google Scholar] [CrossRef] [Green Version]
- Huang, S.S.; Chiu, C.S.; Lin, T.H.; Lee, M.M.; Lee, C.Y.; Chang, S.J.; Hou, W.C.; Huang, G.J.; Deng, J.S. Antioxidant and anti-inflammatory activities of aqueous extract of Centipeda minima. J. Ethnopharmacol. 2013, 147, 395–405. [Google Scholar] [CrossRef]


| Parameters | S-NOD Con | S-NOD+EPE |
|---|---|---|
| Relative Tissue Weight (%) | ||
| EWAT (%) | 1.695 ± 0.878 | 1.176 ± 0.251 |
| RWAT (%) | 0.626 ± 0.091 | 0.561 ± 0.119 |
| visceral fat (%) | 2.321 ± 0.906 | 1.737 ± 0.325 |
| Liver (%) | 5.120 ± 0.289 | 6.210 ± 0.650 |
| Spleen (%) | 0.359 ± 0.013 | 0.287 ± 0.030 * |
| Pancreas (%) | 0.660 ± 0.046 | 0.579 ± 0.002 |
| Skeletal muscle (%) | 1.484 ± 0.095 | 1.535 ± 0.103 |
| Parameters | Cyp-NOD Con | Cyp-NOD+EPE |
|---|---|---|
| Relative Tissue Weight (%) | ||
| EWAT (%) | 0.682 ± 0.165 | 0.499 ± 0.163 |
| RWAT (%) | 0.518 ± 0.082 | 0.376 ± 0.083 |
| visceral fat (%) | 1.200 ± 0.244 | 0.876 ± 0.243 |
| Liver (%) | 4.934 ± 0.200 | 4.788 ± 0.082 |
| Spleen (%) | 0.879 ± 0.444 | 0.297 ± 0.024 * |
| Skeletal muscle (%) | 1.772 ± 0.150 | 1.055 ± 0.134 * |
Disclaimer/Publisher’s Note: The statements, opinions and data contained in all publications are solely those of the individual author(s) and contributor(s) and not of MDPI and/or the editor(s). MDPI and/or the editor(s) disclaim responsibility for any injury to people or property resulting from any ideas, methods, instructions or products referred to in the content. |
© 2023 by the authors. Licensee MDPI, Basel, Switzerland. This article is an open access article distributed under the terms and conditions of the Creative Commons Attribution (CC BY) license (https://creativecommons.org/licenses/by/4.0/).
Share and Cite
Lin, C.-H.; Kuo, Y.-H.; Shih, C.-C. Antidiabetic and Immunoregulatory Activities of Extract of Phyllanthus emblica L. in NOD with Spontaneous and Cyclophosphamide-Accelerated Diabetic Mice. Int. J. Mol. Sci. 2023, 24, 9922. https://doi.org/10.3390/ijms24129922
Lin C-H, Kuo Y-H, Shih C-C. Antidiabetic and Immunoregulatory Activities of Extract of Phyllanthus emblica L. in NOD with Spontaneous and Cyclophosphamide-Accelerated Diabetic Mice. International Journal of Molecular Sciences. 2023; 24(12):9922. https://doi.org/10.3390/ijms24129922
Chicago/Turabian StyleLin, Cheng-Hsiu, Yueh-Hsiung Kuo, and Chun-Ching Shih. 2023. "Antidiabetic and Immunoregulatory Activities of Extract of Phyllanthus emblica L. in NOD with Spontaneous and Cyclophosphamide-Accelerated Diabetic Mice" International Journal of Molecular Sciences 24, no. 12: 9922. https://doi.org/10.3390/ijms24129922