Article

Modulation of Anthocyanin Biosynthesis-Related Genes during the Ripening of Olea europaea L. cvs Carolea and Tondina Drupes in Relation to Environmental Factors

1
Department of Biology, Ecology, and Earth Sciences, University of Calabria, 87036 Arcavacata di Rende, Italy
2
CREA—Council for Agricultural Research and Agricultural Economy Analysis, Forestry and Wood Research Center, 87036 Rende, Italy
*
Author to whom correspondence should be addressed.
Int. J. Mol. Sci. 2023, 24(10), 8770; https://doi.org/10.3390/ijms24108770
Submission received: 28 April 2023 / Revised: 11 May 2023 / Accepted: 12 May 2023 / Published: 15 May 2023
(This article belongs to the Special Issue Genomic and Transcriptomic Analysis of Olive (Olea europaea L.))

Abstract

:
Anthocyanins protect plants against various biotic and abiotic stresses, and anthocyanin-rich foods exert benefits on human health due to their antioxidant activity. Nevertheless, little information is available on the influence of genetic and environmental factors on the anthocyanin content in olive fruits. Based on this consideration, the total anthocyanin content, the genes involved in anthocyanin biosynthesis, and three putative R2R3-MYB transcription factors were evaluated at different ripening stages in the drupes of the Carolea and Tondina cultivars, sampled at different altitudes in the Calabria region, Italy. During drupe ripening, the total anthocyanin content and the transcript levels of analyzed genes gradually increased. In line with the anthocyanin content, a different level of expression of anthocyanin structural genes was observed in ‘Carolea’ compared to ‘Tondina’, and in relation to the cultivation area. Furthermore, we identified Oeu050989.1 as a putative R2R3-MYB involved in the regulation of anthocyanin structural genes correlated with the environmental temperature change response. We conclude that anthocyanin accumulation is strongly regulated by development, genotype, and also by environmental factors such as temperature, associated with the altitude gradient. The obtained results contribute to reducing the current information gap regarding the molecular mechanisms on anthocyanin biosynthesis regulation related to the environmental conditions in Olea europaea.

1. Introduction

The olive (Olea europaea L. subsp. europaea var. europaea) is one of the most iconic trees of the Mediterranean basin, with important implications from a social, economic, and ecological point of view [1]. However, olive tree cultivation is widespread all over the world, from temperate areas in the north to sub-tropical regions, and from low to high altitudes [2].
The olive tree produces edible fruits, classified as drupes, which are used for olive oil and olive table production. The physiological processes and metabolic pathways involved in drupes development, from growth to maturation and ripening, have been largely investigated and elucidated, given the agronomic relevance of olives [3,4].
During ripening, the olive drupes undergo various changes in their physiology, such as color alterations resulting from variations in pigment compounds (chlorophyll, flavonoids, and carotenoids) and texture modifications. There are also changes in turgor or cell wall composition, and modifications in the production of carbohydrates and other organic compounds, which alter organoleptic properties (nutritional value, aroma, and flavor) [5]. In addition, the expression of ripening-related genes and proteins are responsible for the ripening of olives, and they act under the control of a network of metabolic pathways that are in turn triggered by external and/or internal factors [6]. Environmental factors such as temperature, solar radiation, water stress, and soil can affect the anthocyanins content in fruits, altering both the qualitative and quantitative accumulations of antioxidant compounds [7,8,9].
Anthocyanins are water-soluble flavonoids, a class of secondary metabolites that are responsible for the red, purple, and blue colorations of flowers, fruits, and seeds. They act as visual signals to pollinators, as well as seed distributors [10]. In addition, they protect against biotic and abiotic stresses [11]. Furthermore, anthocyanins exert potential benefits in the human diet, including antioxidation, anti-inflammation, anti-aging, lowering lipids, anti-cancer, and neuroprotection [12,13].
Anthocyanins typically accumulate in plant vacuoles, and their biosynthesis occurs through the phenylpropanoid metabolic pathway. Anthocyanins synthesis is mainly controlled by two classes of genes, the anthocyanin biosynthesis structural genes, which encode the enzymes of the anthocyanin biosynthesis pathway, and the regulatory ones. The regulatory genes are transcription factors (TFs), mainly MYB (myeloblastosis), bHLH (basic helix-loop-helix) and WD40 (WD-40 with a scaffolding function) [14,15,16]. MYB TFs play a pivotal role in regulating the anthocyanin pathway [17], and can act alone or combined with bHLH and WD40 to form the ternary complex MYB-bHLH-WD40 (MBW) to regulate the structural genes of the anthocyanin pathway.
The structural genes (enzyme genes), involved in the anthocyanin biosynthetic pathway are well characterized and include phenylalanine ammonia lyase (PAL), cinnamate 4-hydroxylase (C4H), 4-cinnamate-CoA ligase (4CL), chalcone synthase (CHS) (which catalyzes the key reaction involved in flavonoid biosynthesis), flavanone 3-hydroxylase (F3H), and dihydroflavonol 4-reductase (DFR) (which synthesizes colorless leucoanthocyanidins). The final steps include anthocyanidin synthase (ANS) and flavonoid 3-O-glucosyltransferase (UFGT) that transform the colorless dihydrogen flavonols into colored anthocyanins [18,19,20,21,22].
Transcription profiling, performed through an Illumina RNA-seq approach on ‘Leucocarpa’ and ‘Cassanese’ drupes collected at different stages of maturation, was used to obtain information on the genes involved in the flavonoid and anthocyanin biosynthetic pathways during olive fruit ripening [23]. Furthermore, it was observed that some TF members with similarity to the MYB, MIC, and WD40 families were directly related to anthocyanin accumulation [23]. In addition, in the cv Leccino, the expression of anthocyanin biosynthesis structural genes was regulated by the above mentioned three TF families in both fruits and leaves [24].
The interaction between the TFs and the structural genes can promote or reduce anthocyanin accumulation through positive and negative regulation, respectively [25,26,27]. Among the MYB TFs family, the R2R3-MYBs type plays crucial roles as positive transcriptional regulators in anthocyanin production. For instance, in Arabidopsis, AtMYB75 (PAP1, At1g56650), AtMYB90 (PAP2, At1g66390), AtMYB113 (At1g66370), and AtMYB114 (At1g66380) of subgroup 6 promote anthocyanin biosynthesis in vegetative tissues by transcriptionally upregulating the expression of the structural genes [17].
O. europaea drupes collected from plants grown in areas at different altitudes, and therefore experiencing different climatic conditions, showed a modulation in the pathways of fatty acids as well as phenolic compounds in relation to both the drupe ripening stage and the growing area [28].
Despite this information, the molecular mechanisms involved in the regulation of anthocyanin biosynthesis in relation to the environmental conditions are still poorly known in O. europaea.
Starting from this scenario, we aimed to elucidate the effect of altitude on anthocyanin biosynthesis during the drupe development of two O. europaea cultivars, namely Carolea and Tondina, grown in the Calabria region (Italy). Attention was focused on changes in anthocyanin accumulation during drupe development, related to the three different cultivation areas. To achieve this goal, the expression levels of the genes encoding PAL, 4CL, CHS, CHI, F3H, flavonol 3′-hydrogenase (F3′H), flavonol 3′5′-hydrogenase (F3′5′H), DFR, ANS, and UFGT were evaluated through qRT-PCR. Moreover, in order to identify putative R2R3-MYB TFs, the selection, classification, and phylogenetic analysis of the R2R3-MYB gene family was performed in the oleaster (O. europaea var sylvestris) genome.

2. Results

2.1. Temperature Detection

The minimum, medium, and maximum temperature values represent the average of the respective temperatures, recorded over 15 days prior to each sampling (Figure 1). The temperatures were measured in the three different areas under study, and four samplings.
The obtained data showed no significant differences among the three sites in the same considered temperature range and at each stage of the drupes ripening. Instead, significant changes were observed between the minimum and maximum temperature values collected at each stage of drupe ripening, and for each altitude considered. The highest temperature values were recorded at 130 days after flowering (DAF) (Figure 1A) and gradually reduced during drupes ripening. The lowest minimum temperature was 8.4 °C, reached at 300 masl of altitude at 180 DAF (Figure 1D), whereas the highest maximum temperature was 29.8 °C at 200 masl of altitude in drupes collected at 130 DAF (Figure 1A).

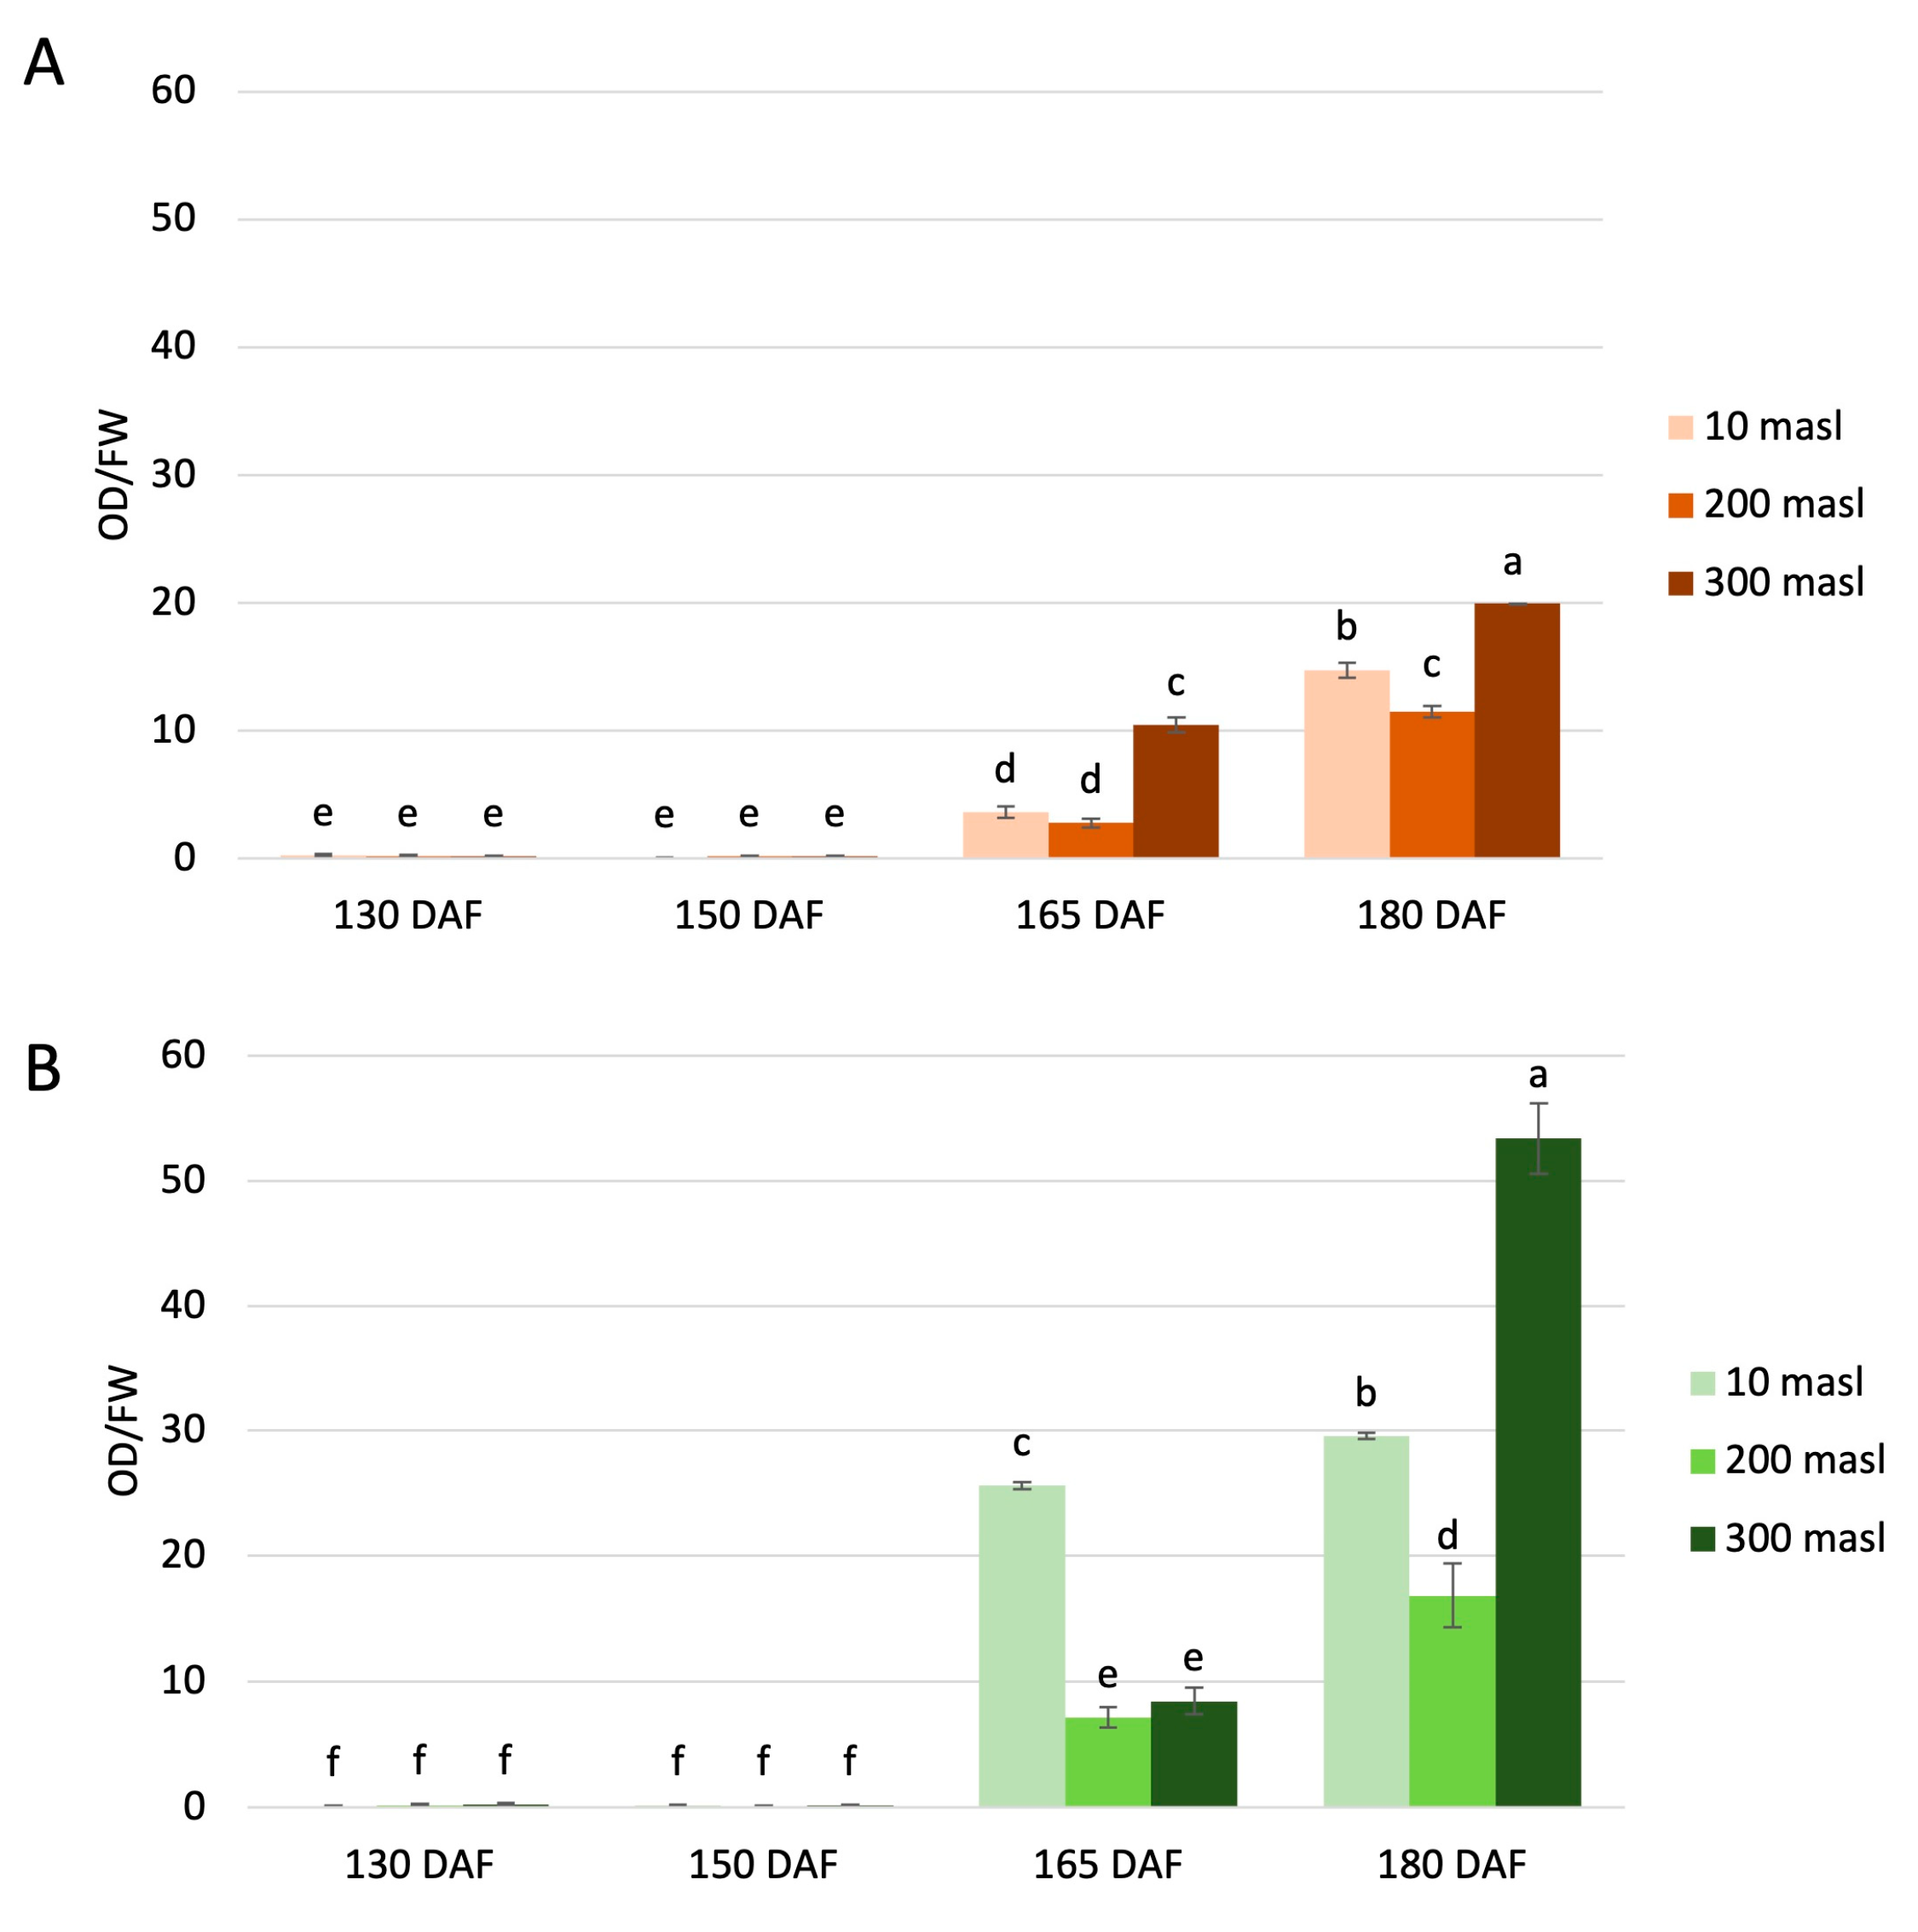
2.2. Total Anthocyanins

The UV spectrophotometric determination of the total anthocyanin levels was carried out in the Carolea and Tondina cultivars at each stage considered (Figure 2). The anthocyanin content was significantly different between the drupes, both in relation to the maturation stage and the altitude. Differences were also observed in relation to the genotype. Indeed, the total amount of anthocyanins was higher in ‘Tondina’ than ‘Carolea’. Our results showed a very low content of total anthocyanins in drupes collected at 130 and 150 DAF compared to the drupes sampled at the other stages of ripening. An increase in anthocyanin amount was observed starting from 165 DAF, closely related to the development of the purple coloration of the fruit, in both the Carolea (Figure 2A) and Tondina cultivars (Figure 2B).
In ‘Carolea’, comparing the drupes collected at 180 DAF vs. 165 DAF, the anthocyanins content increased above four-fold at 10 masl and 200 masl, and two-fold at 300 masl, although the highest quantity is always present at 300 masl (Figure 2A).
With respect to ‘Tondina’ at 165 DAF, the highest anthocyanin content was measured at 10 masl of altitude, which was about 3.6- and 3-fold higher than the values measured at 200 and 300 masl, respectively. When comparing the drupes at 180 DAF vs. 165 DAF, a slow increase was recorded in the drupes harvested at 10 masl, while a significant increase of about 2- and 6.3-fold was monitored in drupes grown at 200 and 300 masl, respectively (Figure 2B).

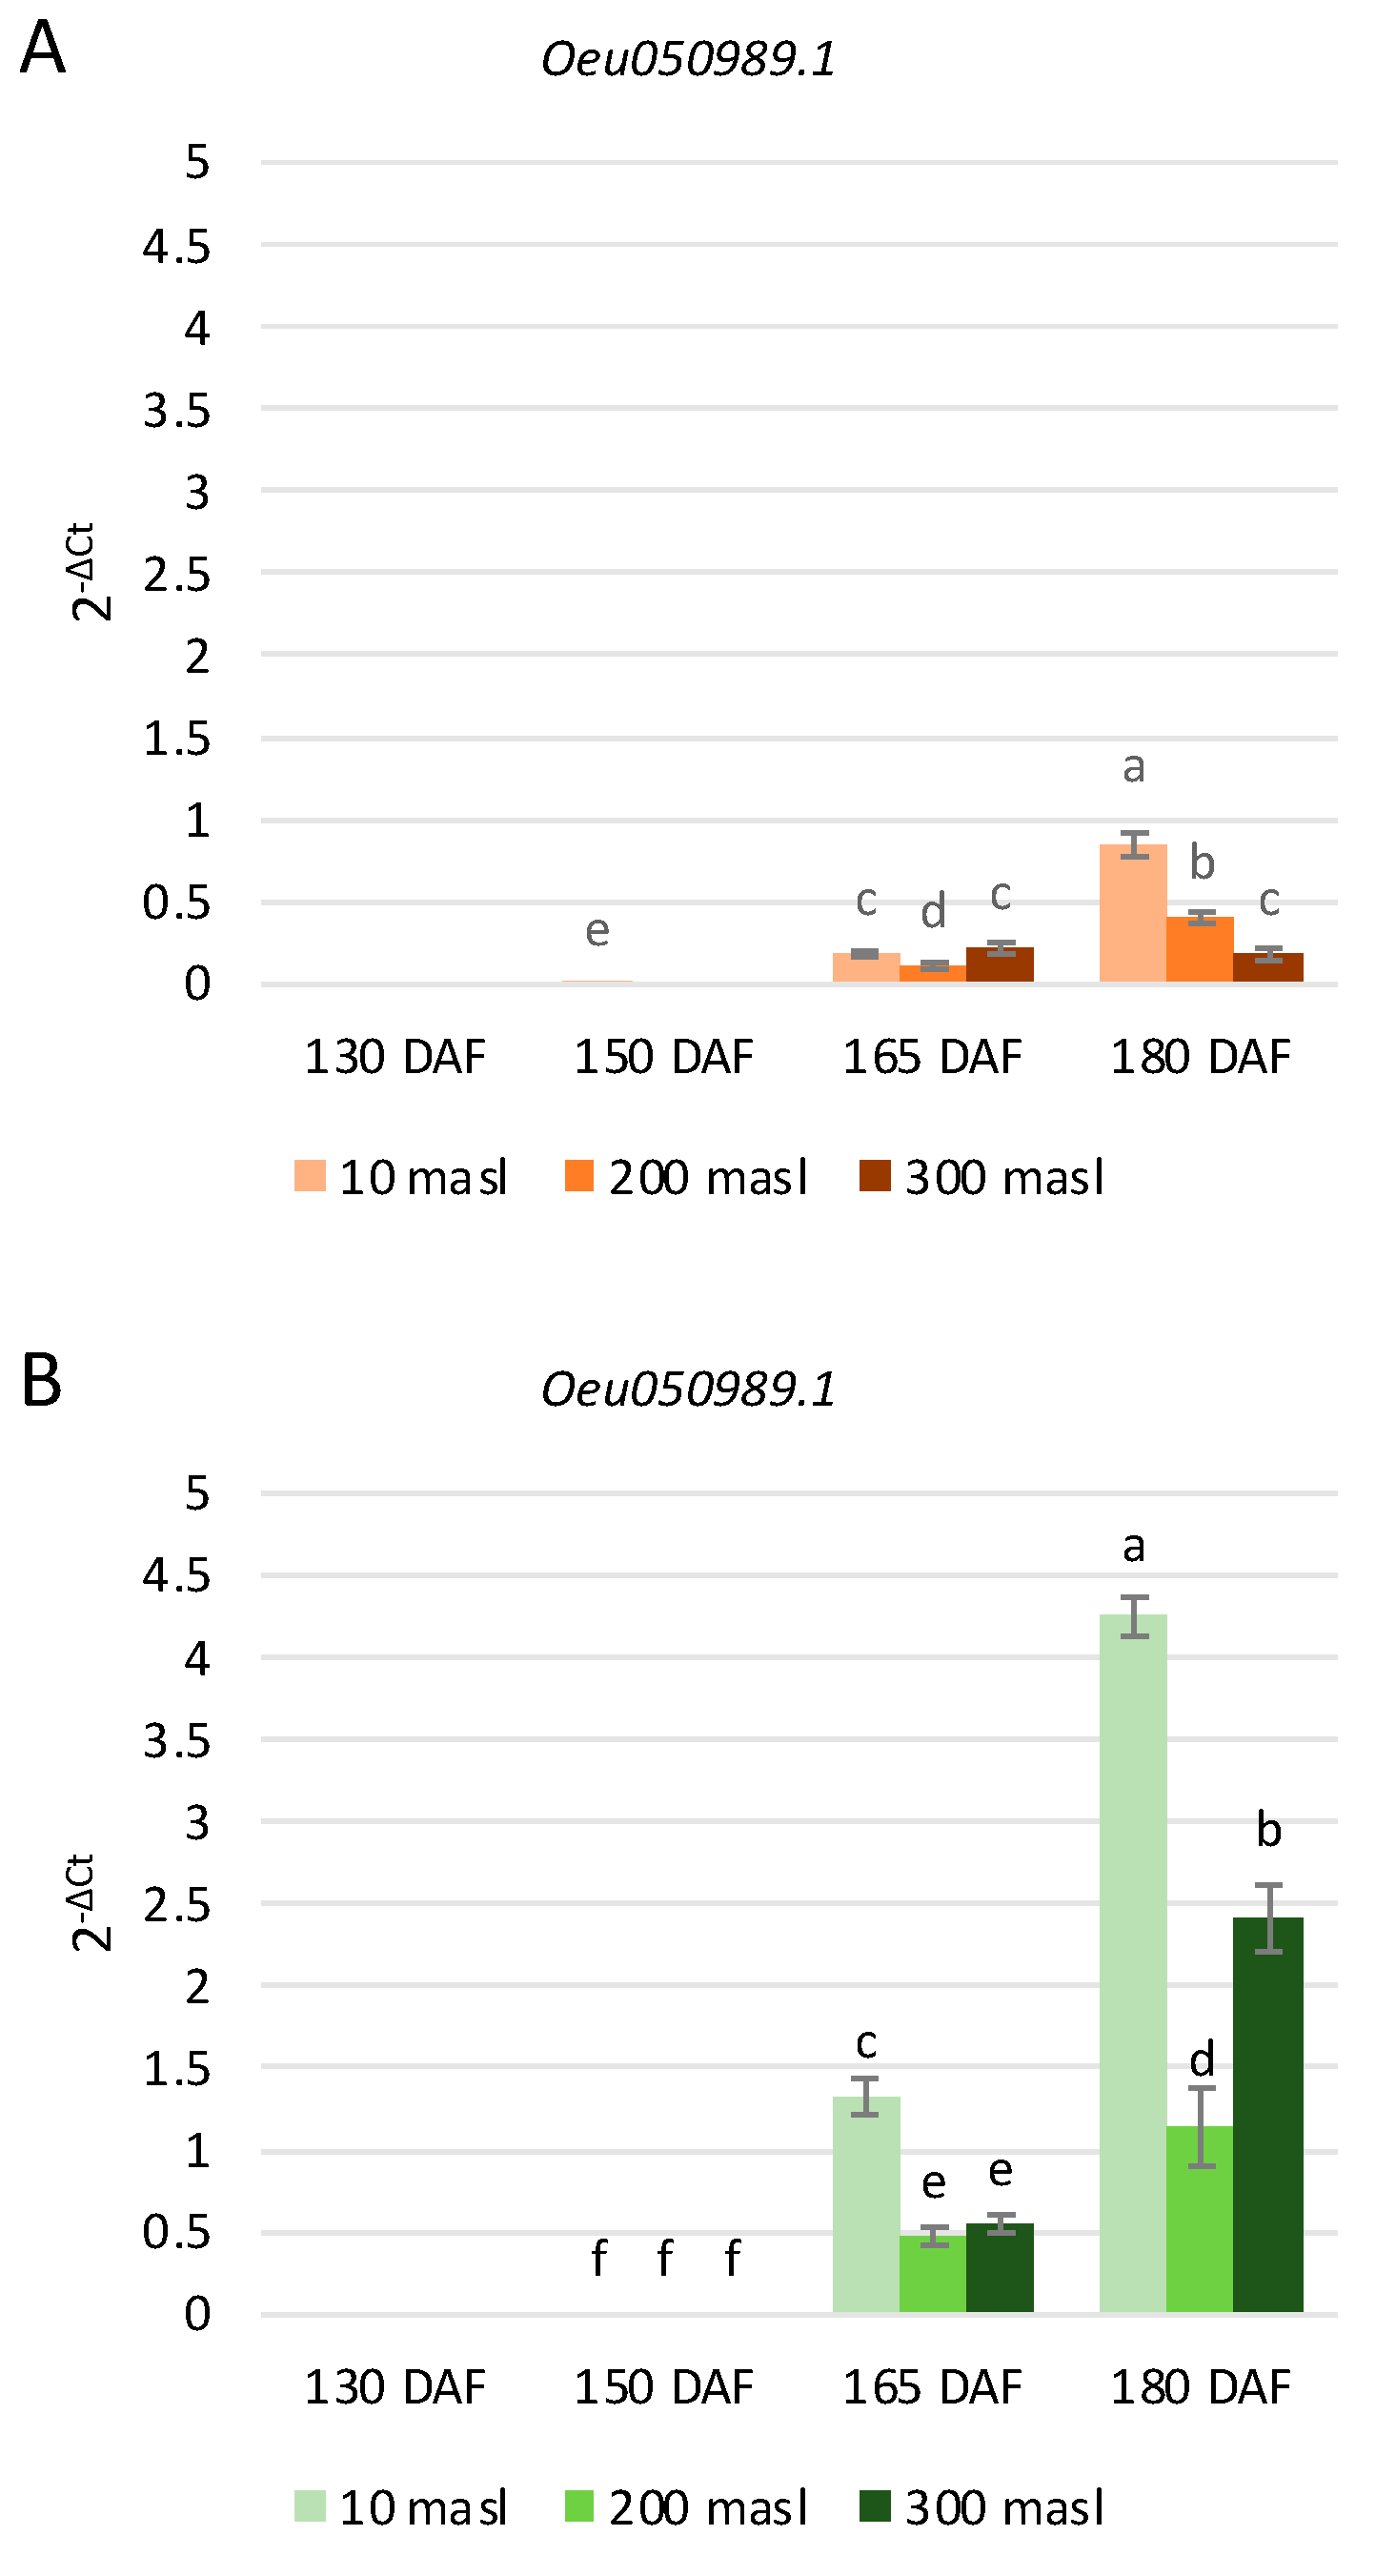
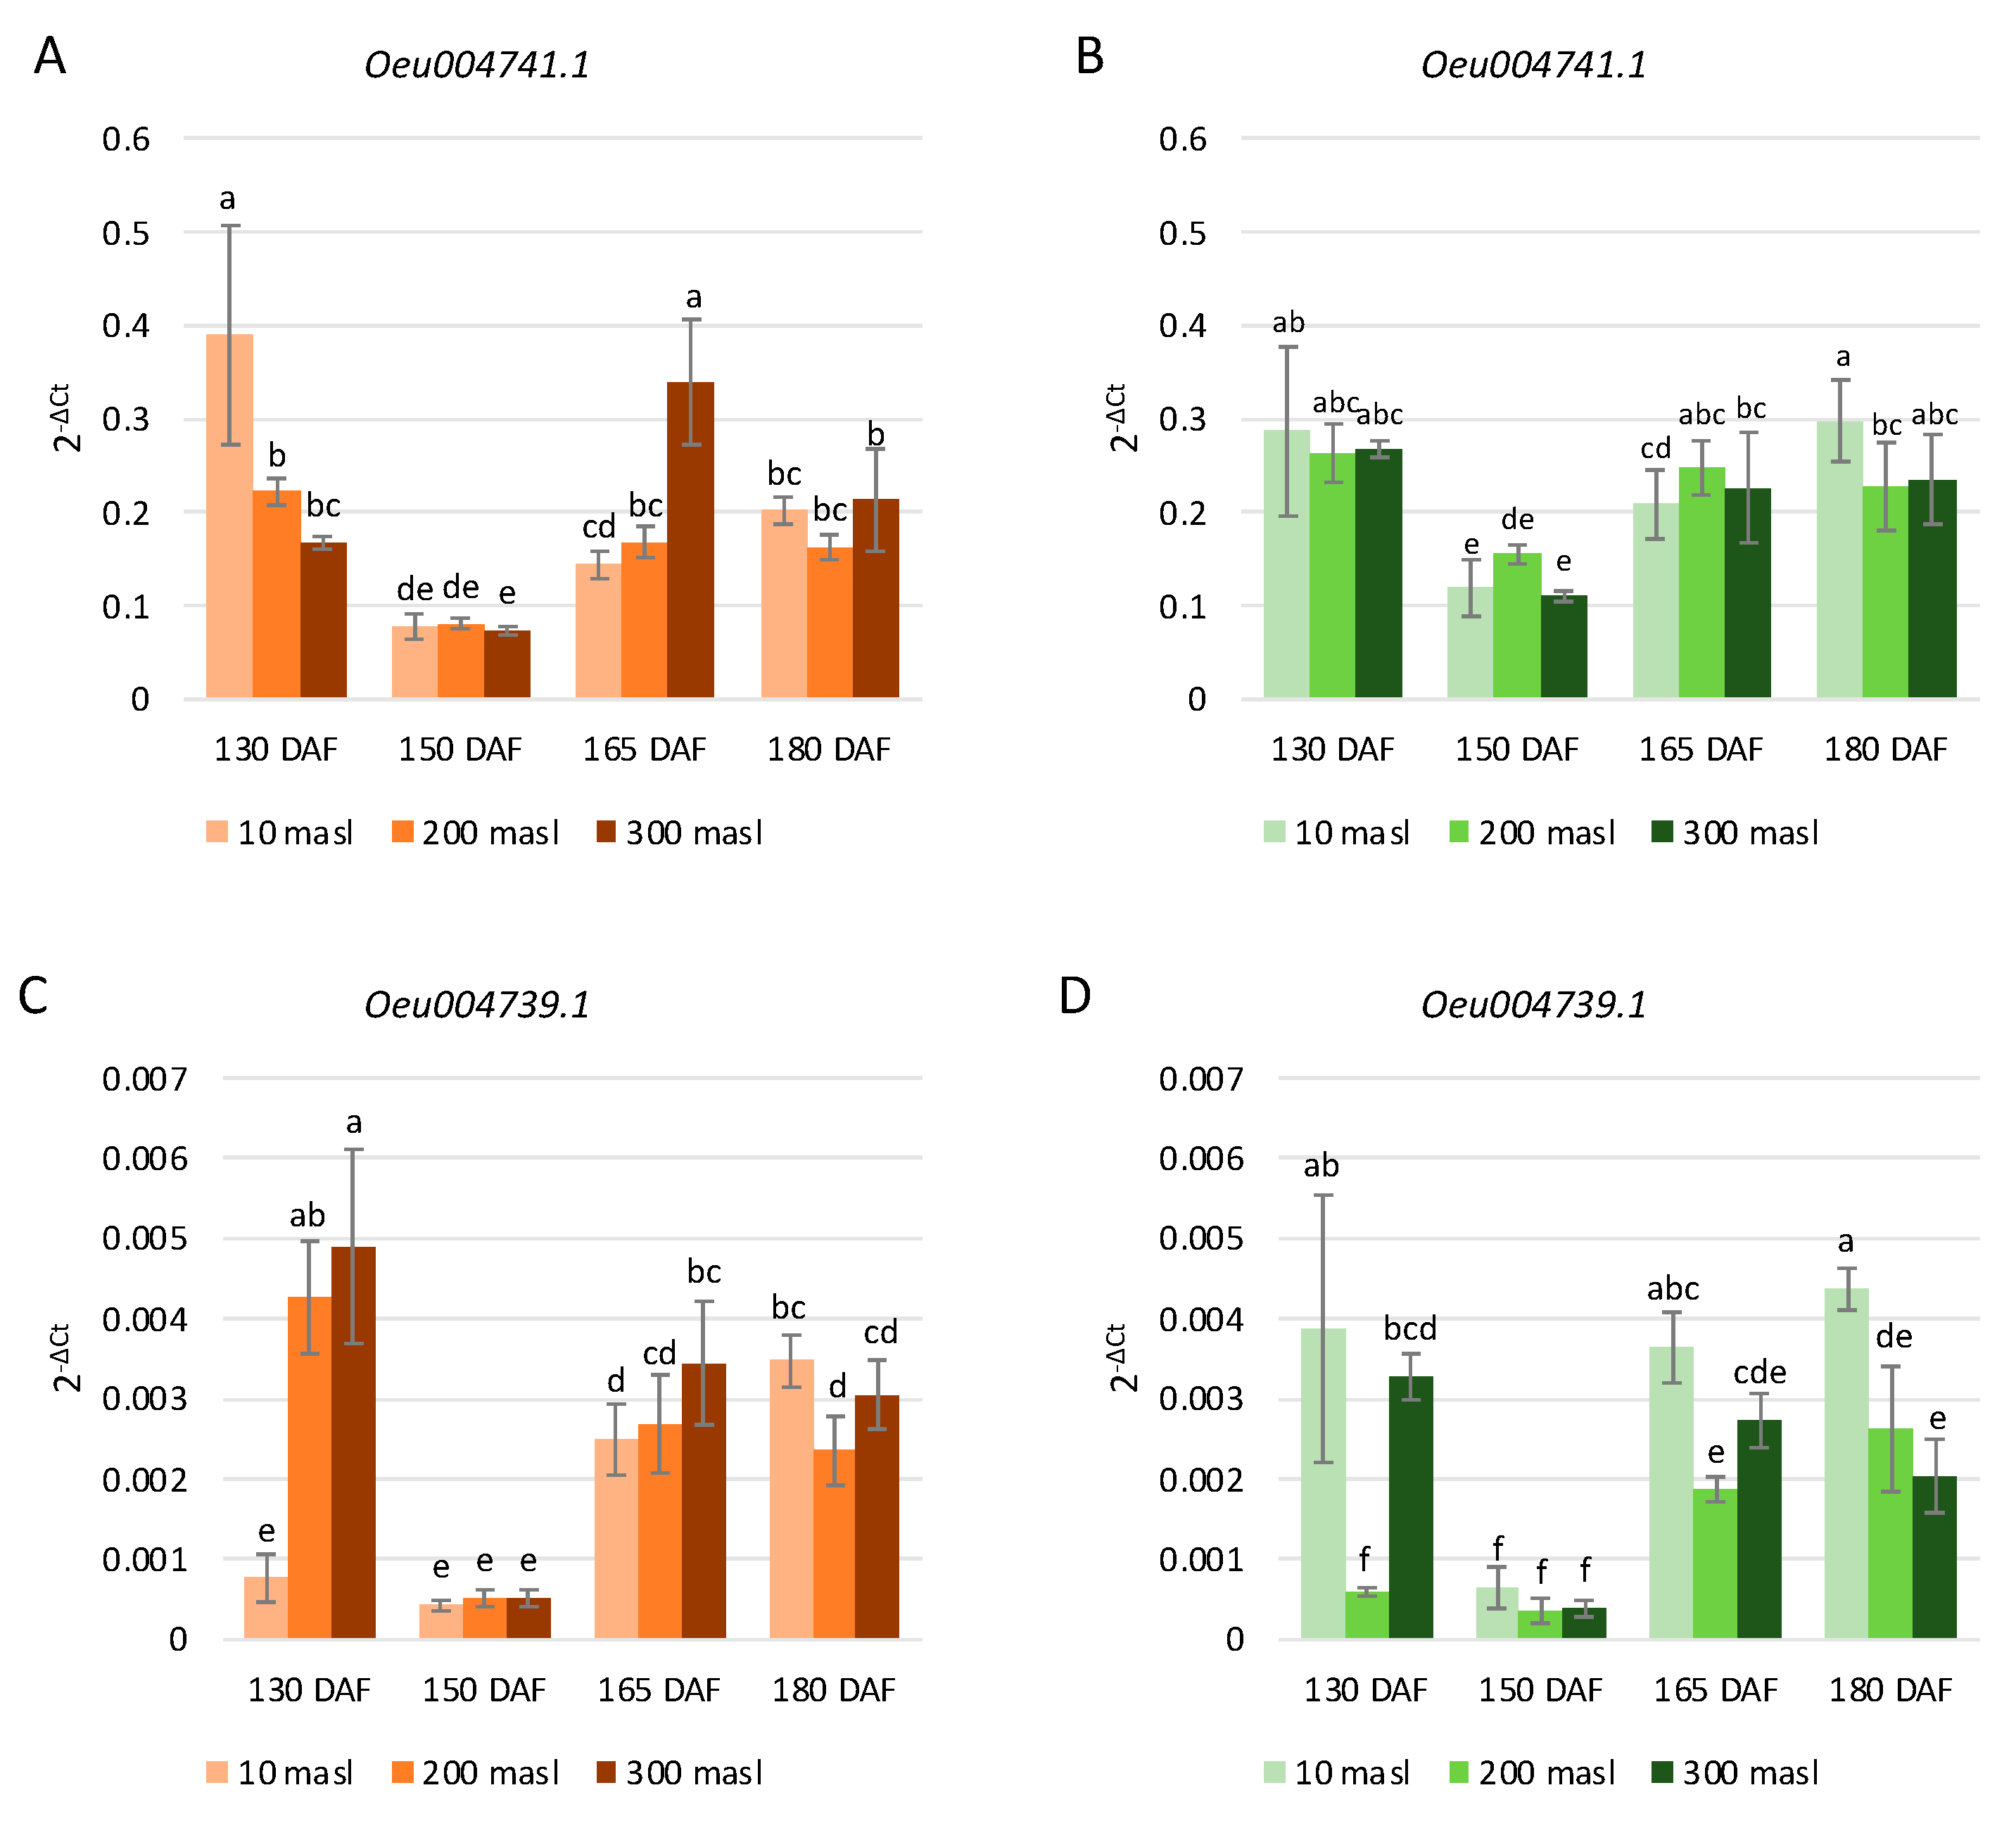
2.3. Expression Profiles of Anthocyanin Biosynthesis-Related Genes

In addition to the anthocyanin content, the transcript abundance of anthocyanin-related genes was evaluated via qRT-PCR (Figure 3). The obtained data indicate that the considered genes were differentially expressed in the ‘Carolea’ and ‘Tondina’ drupes with respect to ripening stage, altitude, and genotype.
A general upregulation of the anthocyanin genetic pathway was observed in ‘Tondina’ drupes compared to ‘Carolea’ ones.
Concerning the ‘Carolea’ cultivar, OePAL, expression increased during ripening in drupes grown at 10 and 300 masl, reaching the highest values at 180 DAF. On the contrary, OePAL expression showed an opposite trend at 200 masl (Figure 3B). Oe4CL was expressed, at low levels, at the last stage of ripening in all drupes of the studied populations, with the exception of the drupes grown at 200 masl. In this case, the expression levels were detected starting from 165 DAF, and were similar to those observed at 180 DAF. With respect to OeCHS, OeCHI, and OeF3′H, globally, they showed a similar expression trend during ripening. A gradual upregulation during the time-course occurred, even if the expression levels were higher at 130 than 150 DAF (Figure 3F,H,L). OeF3H resulted in a gradual upregulation in the above-described genes, except in the populations growing at 300 masl, in which it was gradually downregulated. OeF3’5’H showed a different expression trend with respect to altitude. In the drupes harvested at 10 masl, a low OeF3’5’H expression level was found at 130 DAF, and this increased approximately 10-fold at 150 and 180 DAF, and 7-fold at 165 DAF (Figure 3N). An opposite behavior was observed in the drupes sampled at 200 masl. Indeed, the OeF3’5’H levels were higher at 130 and 165 DAF than at 150 and 180 DAF. In the fruits collected at 300 masl, a low and similar expression of OeF3’5’H was observed (Figure 3N). OeANS was gradually downregulated over the time in the drupes of all the analyzed populations (Figure 3P). Finally, OeDRF and OeUFGT showed a similar expression pattern, reaching the highest transcription values in the last two ripening stages analyzed (Figure 3R,T).
Considering the ‘Tondina’ genotype, a general upregulation of the anthocyanin biosynthesis-related genes was observed during the last two ripening stages, corresponding to the onset of color change. Likewise, for that observed in ‘Carolea’, OeANS showed a gradual downregulation during drupe ripening (Figure 3Q). Nonetheless, some genes exhibit a peculiar form of expression during the time-course. Oe4CL was expressed starting from 150 DAF, and this increased to 165 DAF and was no longer expressed at 180 DAF in the drupes harvested at 10 masl; it had a bell-trend from 150 to 180 DAF in the drupes sampled at 200 masl. Whereas, it was poorly expressed at 165 DAF in the fruits harvested at 300 masl, and it had the highest expression values at 180 DAF (Figure 3E). The OeCHS and OeUFGT genes showed the same expression trend in which an increase in their expression during the time-course with a greater upregulation in the drupes collected at 10 masl at 165 and 180 DAF was observed (Figure 3G,U). The transcription of the OePAL, OeCHI, OeF3’H, and OeDRF genes increased at 165 DAF and at 180 DAF, in which, respectively, the drupes harvested at 10 masl and at 300 masl showed the highest level (Figure 3C,I,M,S). OeF3H was expressed during the time-course in the drupes harvested at 10, 200, and 300 masl; and upregulated in the samples collected at 180 DAF (Figure 3K). Similar to that observed in ‘Carolea’, OeF3’5’H, showed a different expression trend based on the altitude at which the drupes were harvested. A gradual increase in expression level was observed at 10 masl during the time-course. OeF3’5’H expression increased from 130 DAF to 165 DAF and decreased to 180 DAF at 200 masl, and finally, the transcription levels peaked at 150 DAF, decreased at 165 DAF, and then increased to 180 DAF in drupes collected at 300 masl (Figure 3O).

2.4. Selection, Classification, and Phylogenetic Analysis of the R2R3-MYB Gene Family in Olea europaea var sylvestris

According to the number of domains observed in each gene, the 217 genes retrieved in PlantTFDB were assigned to three subfamilies: 13 R1-MYB members (containing one repeat), 190 R2R3-MYB members (containing two repeats), 7 R1R2R3-MYB (containing three repeats), and 2 atypical-MYB genes (containing 4 repeats) (Supplementary Table S1). The remaining seven genes did not have the PF00249 consensus pattern (Supplementary Table S1).
A neighbor-joining tree was generated based on multiple alignments of the predicted amino acid sequences of the R2R3-MYB domains from O. europaea var sylvestris and Arabidopsis (Figure 4) to understand the evolutionary relationships between OeR2R3-MYB proteins, and known R2R3-MYB proteins from Arabidopsis. This tree could also give us insights to predict gene classifications and functions.
Using a sequence-similarity topology and subgroup classification previously reported [17], all R2R3-MYB members from Olea and Arabidopsis were classified into 30 subgroups, of which the subgroups S1 to S25 were named according to the previous principle [17], and the remaining subgroups were named S26 to S34 (Figure 4). Furthermore, the Arabidopsis sequences previously contained in S2 and S3, as well as those in S19 and S20, were found clustered in a single subgroup named S2–S3 and S19–S20, respectively.
Notably, except for S30, all subgroups were clustered members from the two species, indicating that the expansion of the R2R3-MYB members may have occurred before the divergence of the O. europaea plants and Arabidopsis. The subgroup S30 contained only Olea sequences; nevertheless, this was close to S16, suggesting a recent gene duplication, or one subsequent to the separation of the two species, could have occurred between the members of the two subgroups.
In previous studies, AtMYB75, AtMYB90, AtMYB113, and AtMYB114 of S6 have been designated to participate in the phenylpropanoid pathway/anthocyanin biosynthesis [29,30]. In addition, AtMYB4 of S4 was reported as a MYB repressor in the anthocyanin pathway [31]. Based on phylogenetic and classification analysis, we investigated the expression levels of Oeu050989.1 (retrieved in the S6 subgroup), as well as Oeu004741.1 and Oeu004739.1 (both present in the S4 subgroup), in both cultivars at the different ripening stages.
The Oeu050989.1 gene showed a higher expression level in ‘Tondina’ than in ‘Carolea’ (Figure 5), and it was mainly expressed at 165 and 180 DAF, corresponding to the onset of color change. No expression levels were detected at 130 DAF in both of the studied cultivars (Figure 5). With respect to ‘Carolea’, the Oeu050989.1 expression level increased in drupes collected at 10 and 200 masl, starting from the 165 DAF to 180 DAF stages of ripening, whereas no changes were detected in fruits harvested at 300 masl (Figure 5A). In ‘Tondina’, a gradual upregulation of this gene was observed from 150 to 180 DAF at all altitudes condidered. (Figure 5B).
Concerning the selected genes belonging to the S4 subgroup, in ‘Carolea’ and ‘Tondina’, a different trend of their expression was observed, related to both the altitude and ripening stages. In the population grown at 10 masl, Oeu004741.1 and Oeu004739.1 expression were decreased at 150 vs. 130 DAF and then increased progressively at 165 and 180 DAF in both cultivars (Figure 6A–D). In fruits collected at 200 masl, the gene transcription level of both Oeu004741.1 and Oeu004739.1 decreased from 130 to 150 DAF, then increased at 165 DAF and remained substantially stable until 180 DAF in both genotypes (Figure 6A–D). Finally, in drupes harvested at 300 masl, the Oeu004741.1 and Oeu004739.1 gene expression levels were reduced at 150 vs. 130 DAF and increased at 165 DAF. No changes were detected in both the S4 subgroup selected genes levels at 180 vs. 165 DAF with the exception of cv Carolea drupes, in which we observed a significant decrease (Figure 6A).
Furthermore, in both cultivars, the transcription levels of Oeu004739.1 were dramatically lower than in Oeu004741.1 (Figure 6).
We performed correlation analyses between gene expression, total anthocyanin content, and temperatures in both ‘Carolea’ and ‘Tondina’ (Figure 7). According to the screening criteria (correlation coefficient r > 0.7, p < 0.05), in both ‘Carolea’ and ‘Tondina’, OeDRF and Oeu050989.1 expression were both significantly and negatively correlated with the temperature changes (Figure 7 and Supplementary Table S2). Moreover, the transcription levels of Oeu050989.1 were positively correlated to OeCSH, OeCHI, OeF3′H, OeDRF, and OeUFGT levels in ‘Carolea’ drupes (Figure 7). In addition, OePAL and OeF3′5′H transcription levels were also significantly correlated with Oeu050989.1 expression in ‘Tondina’ (Figure 7B and Supplementary Table S2).
Conversely, no correlation was found between the expression levels of Oeu004741.1 and Oeu004739.1 (belonging to the S4 subgroup), and anthocyanins biosynthesis-related genes, and neither between their expression levels and anthocyanin content, for both the Carolea and Tondina cultivars.
Finally, total anthocyanin content was significantly correlated with the temperature medium values in both cultivars, with a correlation coefficient of −0.66 and −0.69 in ‘Carolea’ and ‘Tondina’, respectively (Figure 7 and Supplementary Table S2). In addition, the total anthocyanins content was significantly and positively correlated with the expression levels of the OeCSH, OeF3′H, OeDRF, OeUFGT, and Oeu050989.1 genes in both cultivars.

3. Discussion

In the present work, we assayed the anthocyanin amount and the expression levels of the transcripts along the anthocyanin biosynthetic pathway by comparing the fruits of two olive cultivars collected at different stages of ripening. Therefore, drupes were collected at 130, 150, 165, and 180 DAF, corresponding to the ripening stages in which the transition from green mature to turning purple stages occurs.
Previously, we reported that O. europaea drupes showed differential modulation for both the fatty acids and secondary metabolites pathways, i.e., phenols, in relation to altitude [28]. Thus, we verified whether and how anthocyanin biosynthesis differs in relation to the altitude.
In olive, a large variation in the phenolic composition was observed, including an increase in anthocyanins corresponding to the ripening trends of fruits [32]. During the ripening of drupes, the biosynthesis of anthocyanins begins when oleuropein decreases as a direct consequence of an increase in the enzymatic activity of phenylalanine-ammonium lyase (PAL) [32]. Interestingly, a reduction in the oleuropein content between 150 and 180 DAF was found in the ‘Carolea’ drupes collected at both 10 and 200 masl [28].
Our results revealed a very low content of total anthocyanins in drupes harvested at 130 and 150 DAF in all three grown areas, in both ‘Carolea’ and ‘Tondina’. Furthermore, a gradual increase in the anthocyanins amount was observed between the sampling dates, a trend closely related to the development of the purple drupes color. Moreover, the different altitude at which olive fruits ripened impacted the accumulation of the total content of anthocyanins. Indeed, the higher anthocyanin levels were measured at 300 masl at the lowest minimum temperature. Nevertheless, other factors can affect the anthocyanin accumulation.
In blueberries, the low daily temperatures at higher altitudes, as well as the sunlight spectra, visible light, and UV radiation, also seem to correlate with the accumulation of anthocyanin [33,34]. Furthermore, high temperatures decrease anthocyanin content in the skins of apples and grapevine berries [35,36].
Our data showed that several genes related to anthocyanin biosynthesis in both O. europaea ‘Carolea’ and ‘Tondina’ reflected the quantities of total anthocyanins content and were associated with both fruit ripening and the environmental factors to which they were subjected to.
Previous data have shown that in O. europaea cv Leccino, the concentration of flavonoids increased in young fruits, and anthocyanins were accumulated during ripening, in particular in the epicarp, in conjunction with the upregulation of the PAL, CHS, F3H, and UFGT genes [21]. The DFR gene was induced in the epicarp at the beginning of the drupe color change, whereas ANS were mainly expressed at a more advanced stage [21].
Transcriptomic analysis on O. europaea cv Leccino revealed the presence of nine ANS/LDOX genes that were differentially expressed during fruit ripening [24]. Some of these isoforms were up- or downregulated during the later stages of maturation (140 and 170 DAF), while some exhibited a bell-like expression trend, from 50 to 170 DAF [24].
In our case, the gradual OeANS downregulation observed in both ‘Carolea’ and ‘Tondina’ may be due to the isoform that tends to downregulate during maturation.
With respect to OeF3’H and OeF3’5’H genes, we observed a different expression trend related to the altitude at which the drupes were harvested. However, at the post-transcriptional level, a different kind of regulation occurs, and our results can suggest a different content of dihydroquercetin and dihydromyricetin from which different anthocyanins are synthesized in response to different pedoclimatic conditions.
Dihydrokaempferol is an important precursor of anthocyanin biosynthesis that can be hydroxylated by both the flavonoid 3′-hydroxylase (F3′H) and flavonoid 3′, 5′-hydroxylase (F3′5′H) into dihydroquercetin and dihydromyricetin, respectively. These two enzymes are responsible for the structural diversity of anthocyanins and influence their B-ring hydroxylation patterns and their colors [37].
In grape berries (Vitis vinifera), the transcription of VvF3′H and VvF3′5′H was related to flavonoids composition [8] and different abiotic stresses, such as shading, water stress, and low temperatures, causing a different expression of these genes, and as a consequence, a different content of di- and tri-substituted flavonoids [38,39,40]. Indeed, the exposure of the bunch to the sun increased both the proportion of B ring trihydroxylation in anthocyanins and the expression of VvF3′5′H [39]. Furthermore, high temperatures affect the relative proportion of di- and tri-substituted flavonoids in the berry by reducing the expression ratio between VvF3′5′H and VvF3′H, and the proportions of proanthocyanidins and tri-substituted anthocyanins [40]. In addition, water stress induced the gene expression of VvF3′5′H, with a significant increase in 3′4′5′-hydroxylated anthocyanins [38].
In ‘Carolea’ a generally lower expression level of F3′H and F3′5′H genes than in ‘Tondina’ was observed during the analyzed ripening stages, in agreement with the quantified anthocyanin content. Thus, the observed differences in anthocyanin levels in ‘Carolea’ vs. ‘Tondina’ were mainly related to the differences in the expression levels of the related genes. Moreover, it is possible to hypothesize a different degree of sensitivity and/or acclimatization to the pedoclimatic conditions shown by the cultivars analyzed.
The anthocyanin biosynthesis pathway is controlled by TFs with similarity to the MYB, MIC, and WD40 family [41,42,43], which form the ternary complex MBW and play a key role in the accumulation and inhibition of anthocyanin and proanthocyanin. In O. europaea cv Cassanese, as well as in cv Leccino, different transcription factor members were found to be involved in anthocyanin biosynthesis [23,24].
In the present work, a higher number of R2R3-MYB members (190) were identified in O. europaea var sylvestris than other species—for instance, Camellia sinensis (122) [44], Solanum tuberosum (124) [45], Hypernicum perforatum (109) [46], and Ananas comosus (94) [47]. This result implied that R2R3-MYB gene replication occurred widely in species evolution and played a crucial role in the regulation of specific traits of plant development [48].
A neighbor-joining tree was constructed from multiple alignments of the R2R3-MYB protein sequences from Arabidopsis and Olea to investigate evolutionary relationships. The analytical results led to the separation of the R2R3-MYB proteins into 31 subgroups. Notably, the subgroups were clustered members from the two species, indicating that the expansion of the R2R3-MYB members may have occurred before the divergence of the O. europaea plants and Arabidopsis, with the exception of the S30 subgroup. This subgroup contained exclusively Olea sequences, indicating a likely derivation from a duplication that occurred after the divergence of the Olea and Arabidopsis during their evolutionary history.
It is supposed that members belonging to the same branch may experience a common evolutionary process and possess a conserved function. This study compared the R2R3-MYB genes of Olea and Arabidopsis, elucidating the landscape of Olea R2R3-MYB preservation and amplification. The phylogenetic tree of R2R3-MYB protein also contributes to predicting the function of the Olea R2R3-MYB protein based on the reported branches of Arabidopsis thaliana MYBs. Our attention was focused on genes related to anthocyanin biosynthesis. For example, in the phylogenetic tree, the MYB TFs of the S6 and S4 subgroups might be regulators of the phenylpropanoid pathway [29,30,31].
In the present study, the Oeu050989.1 gene, belonging to the S6 subgroup, was mainly expressed at 165 and 180 DAF, corresponding to the onset of fruit color change. The expression of this gene was positively correlated with those of OeCSH, OeCHI, OeF3′H, OeDRF, and OeUFGT in both the Carolea and Tondina cultivars. Interestingly, the expression of Oeu050989.1 and OeDRF was negatively correlated with the environmental temperature trend, while the remaining analyzed genes did not show a significant correlation. These results confirm that OeDRF play a key role in the regulation of anthocyanin biosynthesis in olives [21], and suggest that Oeu050989.1 could be a crucial role as a transcriptional regulator in the production of anthocyanins in the temperature changes response.
On the other hand, AtMYB4-like type repressors (belong to S4 subgroup) act as direct repressors by binding to the MYB motifs found in the promoters of many structural genes in the anthocyanin pathway, leading to the downregulation of this pathway [27]. The suppression of ANS, DFR, and UFGT has been a common feature observed in all transgenic tobacco and other plants heterologously expressing the AtMYB4-like repressor [49,50,51].
In the present study, no association between the expression levels of Oeu004741.1 and Oeu004739.1, and anthocyanin biosynthesis-related genes was found, nor between the expression levels of both genes and the drupes anthocyanin content, suggesting that these genes are not involved in the regulation of anthocyanin pigmentation in Olea europaea cv Carolea and Tondina.

4. Materials and Methods

4.1. Plant Material

Drupes of ten/eleven-year-old plants of both Olea europaea Carolea and Tondina cultivars were collected from clonal populations belonging to the olive germplasm collections of CREA-OFA at Mirto Crosia (Cosenza, Calabria, Italy, latitude 39°37′04.57″N; longitude 16°45′42.00″ E, altitude 10 masl), at Rende (Cosenza, Calabria, Italy, latitude 39°21′58″ N; longitude 16°13′44″ E, altitude 200 masl) and from a farm located at Terranova da Sibari (Cosenza, Calabria, Italy, latitude 39°40’50” N; longitude 16°22’03” E, altitude 300 masl).
The same agronomic practices without irrigation were used for all populations, and sampling was performed in the seasons of 2019/2020 and 2020/2021 at 130, 150, 165, and 180 days after flowering (DAF). A total of 20 drupes were harvested from 5 plants grown in the same farm (n = 100 drupes for each sampling). For each stage of maturation, the drupes were pulled together to minimize individual variation and to reduce variability [52,53]. All samples were fixed in liquid nitrogen and stored at −80 °C for both total anthocyanin quantification and qRT-PCR experiments.
The environmental temperature was monitored with the ONSET HOBOware (HOBO, Onset Computer Corporation, Pocasset, MA, USA) experimental weather station, equipped with an air temperature sensor.

4.2. Total Anthocyanin Quantification

For each sample, total anthocyanins were extracted from a pool of epi-mesocarp drupes tissues (n = 20 × 5 plants). Samples were pulverizing in liquid nitrogen by using a mortar and pestle.
Briefly, 300 mg of pulverized material were incubated with 1 mL of acidic methanol (1% HCl, w/v) at 4 °C in the dark, overnight, according to [54]. The extracts were centrifuged at 10,000× g for 15 min at 4 °C. The clear supernatant was transferred into a new tube, and the anthocyanin content was determined at 530 nm and 657 nm using a Shimadzu UV-1601 spectrophotometer (Shimadzu, Kyoto, Japan). Total anthocyanin concentration was calculated according to [54] using the following formula:
Q A n t h o c y a n i n s = ( A 530 0.25 A 657 ) / F W
where QAnthocyanins is the anthocyanins amount, A530 and A657 are the absorption values at the indicated wavelengths, and FW is the sample fresh weight. Each sample was analyzed in triplicate; the obtained data represent the mean ± SD of three independent experiments. Statistical analyses were performed using a one-way analysis of variance (ANOVA) followed by Tukey’s post hoc test (p < 0.05).

4.3. RNA Isolation and Real-Time Quantitative PCR Analysis

Total RNA was extracted from 100 mg of a pool of the epi-mesocarp tissues of drupes (n = 20 × 5 plants) harvested at 130, 150, 165, and 180 DAF, as previously described [28]. A total of 1 µg of total RNA for each sample was retro-transcribed into cDNA using a SuperScript III Reverse Transcriptase kit (Invitrogen, Waltham, MA, USA), according to the manufacturer’s protocol.
Primers used for the quantitative real-time PCR analysis (qRT-PCR) of anthocyanin biosynthesis-related genes were selected according to [21,23] (Table 1).
Primers used to quantify Oeu050989.1, Oeu004741.1, and Oeu004739.1 MYB genes were designed using Primer Express™ Software v3.0.1 (Applied Biosystems, Foster City, CA, USA) and selected according to robustness, specificity, and consistency. Only the pairs with an average efficiency of between 0.90 and 1.0 were used (Table 1). Amplification reactions were performed using a STEP ONE instrument (Applied Biosystems, Foster City, CA, USA), and were prepared in a final volume of 20 μL containing: 1X Select SYBR® Green PCR Master Mix (Applied Biosystems, Foster City, CA, USA), 0.2 μM of each primer, and 50 ng cDNA. The reactions were carried out in triplicate in 48-well reaction plates, and negative controls were included. The cycling parameters were as follows: 50 °C for 2 min and 95 °C for 2 min, followed by 40 cycles of 95 °C for 10 s and 60°C for 30 s. Melting curve analysis was also performed to confirm the existence of a unique PCR product, and evaluated via an increase of 0.5 °C every 10 s, from 60 °C to 95 °C.
The relative quantification of gene expression was calculated according to Schmittgen and Livak, 2008 [56]. The ΔCt values were obtained by calculating the difference of the Ct of each target, compared to the arithmetic mean of the Ct for the OeCRY2 housekeeping gene [55] (Table 1), and the relative expression was expressed as 2−ΔCt [57].
Statistical analyses were performed using ANOVA and a Tukey’s rank test (p < 0.05).

4.4. Identification and Phylogenetic Analysis of the O. europaea var sylvestris OeR2R3-MYB Proteins

With the aim of identifying the regulatory interaction between MYB transcription factors (TFs) and their target genes, the Plant Transcription Factor Database (PlantTFDB; http://planttfdb.cbi.pku.edu.cn, accessed on 20 July 2022) was used as a high-quality resource [58].
Genes of Arabidopsis thaliana and Olea europaea var. sylvestris encoding MYB transcription factors were retrieved from PlantTFDB, whereas the MYB transcription factors sequences of olive cultivars were not available in the database.
The primary search disclosed 217 and 168 members annotated as “MYB” in the Olea and Arabidopsis, respectively, in the plantTFDB database. The presence of MYB-repetition domains (the PF00249 consensus pattern) in Olea protein sequences was checked with PROSITE (https://prosite.expasy.org/scanprosite/, accessed on 20 July 2022), with the aim of identifying the R2R3-type sequences. The protein sequences lacking the MYB-DNA binding domain, even if they were annotated as a MYB protein family in the plantTFDB database, were discarded.
The Arabidopsis R2R3-type sequences were selected according to [59]. The gene identifiers were assigned to each AtMYB gene to avoid confusion when multiple names were used for the same gene. Uncharacterized AtMYB genes were denoted by their locus ID.
The full-length amino acid sequences of 190 OeR2R3-MYB proteins (Olea europaea var sylvestris) and 138 AtR2R3-MYB proteins (Arabidopsis thaliana) were used to explore the corresponding phylogenetic relationships. The sequences were aligned, and a neighbor-joining (NJ) phylogenetic tree was constructed using the MEGA X program with the p-distance parameter [60]. A total of 1000 replicates were used for the pairwise deletion and bootstrap analysis.

4.5. Pearson Correlation Analysis

A Pearson correlation was used among the expression of analyzed genes, total anthocyanin content, and temperatures, in both ‘Carolea’ and ‘Tondina’. Pearson correlation coefficients (r) and the corresponding p-values (p) were calculated by using the Statistical Software R package “corrplot”, based on the criteria of r > 0.70 and p < 0.05.

5. Conclusions

Taken together, our results suggest that anthocyanin accumulation is strongly affected by both developmental stage and genotype in olive. The environmental temperature on anthocyanin content and structure-related genes in drupes is mainly associated with the ripening progression. The reduction in drupes pigmentation under high temperatures for ‘Carolea’ and ‘Tondina’ implies great challenges in olive growing in order to maintain the nutritional and antioxidant quality, taking into account the central role of these cultivars for Calabria olive growing. In addition, ‘Tondina’ drupes, used for both olive oil production and table olives, could represent a precious source of beneficial compounds for human health.
Finally, for the first time, the classification and phylogenetic analysis of the R2R3-MYB gene family in Olea europaea var sylvestris was conducted, and the gene expression analysis demonstrated that Oeu050989.1 may be responsible for the transcription regulation of anthocyanin synthesis in drupes under a low temperature regime.

Supplementary Materials

The following supporting information can be downloaded at: https://www.mdpi.com/article/10.3390/ijms24108770/s1.

Author Contributions

Conceptualization, A.C., I.M. and M.F.; methodology, A.C., M.F. and I.M.; validation, A.C., I.M. and M.F.; investigation, M.F. and A.M.; resources, A.C., I.M. and L.B.; project administration, A.C. and I.M.; supervision, A.C.; funding acquisition, I.M.; writing—original draft preparation, M.F., A.C. and I.M; writing—review and editing, A.C., M.F. and I.M. All authors have read and agreed to the published version of the manuscript.

Funding

This research was funded by Project “Caratterizzazione e valorizzazione delle olive da tavola e a duplice attitudine—ALIVE”, MASAF D.M. 93880/2017, CUP C54I7000010006; MICROLIVE, C.U.P. J96G20000340005, PSR Calabria 2014–2020, Misura 16.

Institutional Review Board Statement

Not applicable.

Informed Consent Statement

Not applicable.

Data Availability Statement

All data used in this study appear in the paper’s text, figures, and Supplementary Material.

Conflicts of Interest

The authors declare no conflict of interest.

References

  1. Carrión, Y.; Ntinou, M.; Badal, E. Olea Europaea L. in the North Mediterranean Basin during the Pleniglacial and the Early–Middle Holocene. Quat. Sci. Rev. 2010, 29, 952–968. [Google Scholar] [CrossRef]
  2. Besnard, G.; Rubio de Casas, R.; Christin, P.-A.; Vargas, P. Phylogenetics of Olea (Oleaceae) Based on Plastid and Nuclear Ribosomal DNA Sequences: Tertiary Climatic Shifts and Lineage Differentiation Times. Ann. Bot. 2009, 104, 143–160. [Google Scholar] [CrossRef]
  3. Alagna, F.; D’Agostino, N.; Torchia, L.; Servili, M.; Rao, R.; Pietrella, M.; Giuliano, G.; Chiusano, M.L.; Baldoni, L.; Perrotta, G. Comparative 454 Pyrosequencing of Transcripts from Two Olive Genotypes during Fruit Development. BMC Genom. 2009, 10, 399. [Google Scholar] [CrossRef]
  4. Bianco, L.; Alagna, F.; Baldoni, L.; Finnie, C.; Svensson, B.; Perrotta, G. Proteome Regulation during Olea Europaea Fruit Development. PLoS ONE 2013, 8, e53563. [Google Scholar] [CrossRef]
  5. Skodra, C.; Titeli, V.S.; Michailidis, M.; Bazakos, C.; Ganopoulos, I.; Molassiotis, A.; Tanou, G. Olive Fruit Development and Ripening: Break on through to the “-Omics” Side. Int. J. Mol. Sci. 2021, 22, 5806. [Google Scholar] [CrossRef]
  6. Giovannoni, J.J. Genetic Regulation of Fruit Development and Ripening. Plant Cell 2004, 16, S170–S180. [Google Scholar] [CrossRef]
  7. Connor, A.M.; Luby, J.J.; Tong, C.B.S.; Finn, C.E.; Hancock, J.F. Genotypic and Environmental Variation in Antioxidant Activity, Total Phenolic Content, and Anthocyanin Content among Blueberry Cultivars. J. Am. Soc. Hortic. Sci. 2002, 127, 89–97. [Google Scholar] [CrossRef]
  8. Castellarin, S.D.; Di Gaspero, G. Transcriptional Control of Anthocyanin Biosynthetic Genes in Extreme Phenotypes for Berry Pigmentation of Naturally Occurring Grapevines. BMC Plant Biol. 2007, 7, 46. [Google Scholar] [CrossRef]
  9. Stevenson, D.; Scalzo, J. Anthocyanin Composition and Content of Blueberries from around the World. J. Berry Res. 2012, 2, 179–189. [Google Scholar] [CrossRef]
  10. Davies, K.M.; Albert, N.W.; Schwinn, K.E. From Landing Lights to Mimicry: The Molecular Regulation of Flower Colouration and Mechanisms for Pigmentation Patterning. Functional Plant Biol. 2012, 39, 619–638. [Google Scholar] [CrossRef]
  11. Ahmed, N.U.; Park, J.-I.; Jung, H.-J.; Hur, Y.; Nou, I.-S. Anthocyanin Biosynthesis for Cold and Freezing Stress Tolerance and Desirable Color in Brassica Rapa. Funct. Integr. Genom. 2015, 15, 383–394. [Google Scholar] [CrossRef]
  12. Han, F.; Yang, P.; Wang, H.; Fernandes, I.; Mateus, N.; Liu, Y. Digestion and Absorption of Red Grape and Wine Anthocyanins through the Gastrointestinal Tract. Trends Food Sci. Technol. 2019, 83, 211–224. [Google Scholar] [CrossRef]
  13. Li, X.; Yao, Z.; Yang, D.; Jiang, X.; Sun, J.; Tian, L.; Hu, J.; Wu, B.; Bai, W. Cyanidin-3-O-Glucoside Restores Spermatogenic Dysfunction in Cadmium-Exposed Pubertal Mice via Histone Ubiquitination and Mitigating Oxidative Damage. J. Hazard. Mater. 2020, 387, 121706. [Google Scholar] [CrossRef]
  14. Quattrocchio, F.; Verweij, W.; Kroon, A.; Spelt, C.; Mol, J.; Koes, R. PH4 of Petunia Is an R2R3 MYB Protein That Activates Vacuolar Acidification through Interactions with Basic-Helix-Loop-Helix Transcription Factors of the Anthocyanin Pathway. Plant Cell 2006, 18, 1274–1291. [Google Scholar] [CrossRef]
  15. Li, S. Transcriptional Control of Flavonoid Biosynthesis. Plant Signal. Behav. 2014, 9, e27522. [Google Scholar] [CrossRef]
  16. Conde, C.; Delrot, S.; Gerós, H. Physiological, Biochemical and Molecular Changes Occurring during Olive Development and Ripening. J. Plant Physiol. 2008, 165, 1545–1562. [Google Scholar] [CrossRef]
  17. Dubos, C.; Stracke, R.; Grotewold, E.; Weisshaar, B.; Martin, C.; Lepiniec, L. MYB Transcription Factors in Arabidopsis. Trends Plant Sci. 2010, 15, 573–581. [Google Scholar] [CrossRef]
  18. Reif, H.J.; Niesbach, U.; Deumling, B.; Saedler, H. Cloning and Analysis of Two Genes for Chalcone Synthase from Petunia Hybrida. Mol. Genet. Genom. 1985, 199, 208–215. [Google Scholar] [CrossRef]
  19. Beld, M.; Martin, C.; Huits, H.; Stuitje, A.R.; Gerats, A.G.M. Flavonoid Synthesis in Petunia Hybrida: Partial Characterization of Dihydroflavonol-4-Reductase Genes. Plant Mol. Biol. 1989, 13, 491–502. [Google Scholar] [CrossRef]
  20. Tanaka, Y.; Sasaki, N.; Ohmiya, A. Biosynthesis of Plant Pigments: Anthocyanins, Betalains and Carotenoids. Plant J. 2008, 54, 733–749. [Google Scholar] [CrossRef]
  21. Martinelli, F.; Tonutti, P. Flavonoid Metabolism and Gene Expression in Developing Olive (Olea Europaea L.) Fruit. Plant Biosyst. 2012, 146, 164–170. [Google Scholar] [CrossRef]
  22. Mattioli, R.; Francioso, A.; Mosca, L.; Silva, P. Anthocyanins: A Comprehensive Review of Their Chemical Properties and Health Effects on Cardiovascular and Neurodegenerative Diseases. Molecules 2020, 25, 3809. [Google Scholar] [CrossRef]
  23. Iaria, D.L.; Chiappetta, A.; Muzzalupo, I. A De Novo Transcriptomic Approach to Identify Flavonoids and Anthocyanins “Switch-Off” in Olive (Olea Europaea L.) Drupes at Different Stages of Maturation. Front. Plant Sci. 2016, 6. [Google Scholar] [CrossRef]
  24. Guodong, R.; Jianguo, Z.; Xiaoxia, L.; Ying, L. Identification of Putative Genes for Polyphenol Biosynthesis in Olive Fruits and Leaves Using Full-Length Transcriptome Sequencing. Food Chem. 2019, 300, 125246. [Google Scholar] [CrossRef]
  25. Durbin, M.L.; Learn, G.H.; Huttley, G.A.; Clegg, M.T. Evolution of the Chalcone Synthase Gene Family in the Genus Ipomoea. Proc. Natl. Acad. Sci. USA 1995, 92, 3338–3342. [Google Scholar] [CrossRef]
  26. Vimolmangkang, S.; Han, Y.; Wei, G.; Korban, S.S. An Apple MYB Transcription Factor, MdMYB3, Is Involved in Regulation of Anthocyanin Biosynthesis and Flower Development. BMC Plant Biol. 2013, 13, 176. [Google Scholar] [CrossRef]
  27. Chen, L.; Hu, B.; Qin, Y.; Hu, G.; Zhao, J. Advance of the Negative Regulation of Anthocyanin Biosynthesis by MYB Transcription Factors. Plant Physiol. Biochem. 2019, 136, 178–187. [Google Scholar] [CrossRef]
  28. Bruno, L.; Picardi, E.; Pacenza, M.; Chiappetta, A.; Muto, A.; Gagliardi, O.; Muzzalupo, I.; Pesole, G.; Bitonti, M.B. Changes in Gene Expression and Metabolic Profile of Drupes of Olea Europaea L. Cv Carolea in Relation to Maturation Stage and Cultivation Area. BMC Plant Biol. 2019, 19, 428. [Google Scholar] [CrossRef]
  29. Mondal, S.K.; Roy, S. Genome-Wide Sequential, Evolutionary, Organizational and Expression Analyses of Phenylpropanoid Biosynthesis Associated MYB Domain Transcription Factors in Arabidopsis. J. Biomol. Struct. 2018, 36, 1577–1601. [Google Scholar] [CrossRef]
  30. Li, T.; Jia, K.-P.; Lian, H.-L.; Yang, X.; Li, L.; Yang, H.-Q. Jasmonic Acid Enhancement of Anthocyanin Accumulation Is Dependent on Phytochrome A Signaling Pathway under Far-Red Light in Arabidopsis. Biochem. Biophys. Res. Commun. 2014, 454, 78–83. [Google Scholar] [CrossRef]
  31. Jin, H.; Cominelli, E.; Bailey, P.; Parr, A.; Mehrtens, F.; Jones, J.; Tonelli, C.; Weisshaar, B.; Martin, C. Transcriptional Repression by AtMYB4 Controls Production of UV-Protecting Sunscreens in Arabidopsis. EMBO J. 2000, 19, 6150–6161. [Google Scholar] [CrossRef]
  32. Amiot, M.J.; Fleuriet, A.; Macheix, J.J. Importance and Evolution of Phenolic Compounds in Olive during Growth and Maturation. J. Agric. Food Chem. 1986, 34, 823–826. [Google Scholar] [CrossRef]
  33. Karppinen, K.; Zoratti, L.; Nguyenquynh, N.; Häggman, H.; Jaakola, L. On the Developmental and Environmental Regulation of Secondary Metabolism in Vaccinium Spp. Berries. Front. Plant Sci. 2016, 7, 655. [Google Scholar] [CrossRef]
  34. Zoratti, L.; Jaakola, L.; Häggman, H.; Giongo, L. Modification of Sunlight Radiation through Colored Photo-Selective Nets Affects Anthocyanin Profile in Vaccinium Spp. Berries. PLoS ONE 2015, 10, e0135935. [Google Scholar] [CrossRef]
  35. Azuma, A.; Yakushiji, H.; Koshita, Y.; Kobayashi, S. Flavonoid Biosynthesis-Related Genes in Grape Skin Are Differentially Regulated by Temperature and Light Conditions. Planta 2012, 236, 1067–1080. [Google Scholar] [CrossRef]
  36. Lin-Wang, K.; Micheletti, D.; Palmer, J.; Volz, R.; Lozano, L.; Espley, R.; Hellens, R.P.; Chagné, D.; Rowan, D.D.; Troggio, M.; et al. High Temperature Reduces Apple Fruit Colour via Modulation of the Anthocyanin Regulatory Complex. Plant Cell Environ. 2011, 34, 1176–1190. [Google Scholar] [CrossRef]
  37. Liu, Y.; Tikunov, Y.; Schouten, R.E.; Marcelis, L.F.M.; Visser, R.G.F.; Bovy, A. Anthocyanin Biosynthesis and Degradation Mechanisms in Solanaceous Vegetables: A Review. Front. Chem. 2018, 6, 52. [Google Scholar] [CrossRef]
  38. Castellarin, S.D.; Matthews, M.A.; Di Gaspero, G.; Gambetta, G.A. Water Deficits Accelerate Ripening and Induce Changes in Gene Expression Regulating Flavonoid Biosynthesis in Grape Berries. Planta 2007, 227, 101–112. [Google Scholar] [CrossRef]
  39. Koyama, K.; Goto-Yamamoto, N. Bunch Shading During Different Developmental Stages Affects the Phenolic Biosynthesis in Berry Skins of ‘Cabernet Sauvignon’ Grapes. J. Amer. Soc. Hort. Sci. 2008, 133, 743–753. [Google Scholar] [CrossRef]
  40. Cohen, S.D.; Tarara, J.M.; Gambetta, G.A.; Matthews, M.A.; Kennedy, J.A. Impact of Diurnal Temperature Variation on Grape Berry Development, Proanthocyanidin Accumulation, and the Expression of Flavonoid Pathway Genes. J. Exp. Bot. 2012, 63, 2655–2665. [Google Scholar] [CrossRef]
  41. Kiferle, C.; Fantini, E.; Bassolino, L.; Povero, G.; Spelt, C.; Buti, S.; Giuliano, G.; Quattrocchio, F.; Koes, R.; Perata, P.; et al. Tomato R2R3-MYB Proteins SlANT1 and SlAN2: Same Protein Activity, Different Roles. PLoS ONE 2015, 10, e0136365. [Google Scholar] [CrossRef]
  42. Zheng, J.; Wu, H.; Zhu, H.; Huang, C.; Liu, C.; Chang, Y.; Kong, Z.; Zhou, Z.; Wang, G.; Lin, Y.; et al. Determining Factors, Regulation System, and Domestication of Anthocyanin Biosynthesis in Rice Leaves. New Phytol. 2019, 223, 705–721. [Google Scholar] [CrossRef]
  43. Dong, N.-Q.; Lin, H.-X. Contribution of Phenylpropanoid Metabolism to Plant Development and Plant–Environment Interactions. J. Integr. Plant Biol. 2021, 63, 180–209. [Google Scholar] [CrossRef]
  44. Chen, X.; Wang, P.; Gu, M.; Lin, X.; Hou, B.; Zheng, Y.; Sun, Y.; Jin, S.; Ye, N. R2R3-MYB Transcription Factor Family in Tea Plant (Camellia Sinensis): Genome-Wide Characterization, Phylogeny, Chromosome Location, Structure and Expression Patterns. Genomics 2021, 113, 1565–1578. [Google Scholar] [CrossRef]
  45. Li, Y.; Liang, J.; Zeng, X.; Guo, H.; Luo, Y.; Kear, P.; Zhang, S.; Zhu, G. Genome-Wide Analysis of MYB Gene Family in Potato Provides Insights into Tissue-Specific Regulation of Anthocyanin Biosynthesis. Hortic. Plant J. 2021, 7, 129–141. [Google Scholar] [CrossRef]
  46. Zhou, W.; Zhang, Q.; Sun, Y.; Yang, L.; Wang, Z. Genome-Wide Identification and Characterization of R2R3-MYB Family in Hypericum Perforatum under Diverse Abiotic Stresses. Int. J. Biol. Macromol. 2020, 145, 341–354. [Google Scholar] [CrossRef]
  47. Liu, C.; Xie, T.; Chen, C.; Luan, A.; Long, J.; Li, C.; Ding, Y.; He, Y. Genome-Wide Organization and Expression Profiling of the R2R3-MYB Transcription Factor Family in Pineapple (Ananas Comosus). BMC Genom. 2017, 18, 503. [Google Scholar] [CrossRef]
  48. Stracke, R.; Werber, M.; Weisshaar, B. The R2R3-MYB Gene Family in Arabidopsis Thaliana. Curr. Opin. Plant Biol. 2001, 4, 447–456. [Google Scholar] [CrossRef]
  49. Pérez-Díaz, J.R.; Pérez-Díaz, J.; Madrid-Espinoza, J.; González-Villanueva, E.; Moreno, Y.; Ruiz-Lara, S. New Member of the R2R3-MYB Transcription Factors Family in Grapevine Suppresses the Anthocyanin Accumulation in the Flowers of Transgenic Tobacco. Plant Mol. Biol. 2016, 90, 63–76. [Google Scholar] [CrossRef]
  50. Xu, H.; Wang, N.; Liu, J.; Qu, C.; Wang, Y.; Jiang, S.; Lu, N.; Wang, D.; Zhang, Z.; Chen, X. The Molecular Mechanism Underlying Anthocyanin Metabolism in Apple Using the MdMYB16 and MdbHLH33 Genes. Plant Mol. Biol. 2017, 94, 149–165. [Google Scholar] [CrossRef]
  51. Anwar, M.; Wang, G.; Wu, J.; Waheed, S.; Allan, A.C.; Zeng, L. Ectopic Overexpression of a Novel R2R3-MYB, NtMYB2 from Chinese Narcissus Represses Anthocyanin Biosynthesis in Tobacco. Molecules 2018, 23, 781. [Google Scholar] [CrossRef]
  52. Peng, X.; Wood, C.L.; Blalock, E.M.; Chen, K.C.; Landfield, P.W.; Stromberg, A.J. Statistical Implications of Pooling RNA Samples for Microarray Experiments. BMC Bioinform. 2003, 4, 26. [Google Scholar] [CrossRef]
  53. Karp, N.A.; Lilley, K.S. Investigating Sample Pooling Strategies for DIGE Experiments to Address Biological Variability. Proteomics 2009, 9, 388–397. [Google Scholar] [CrossRef]
  54. Mehrtens, F.; Kranz, H.; Bednarek, P.; Weisshaar, B. The Arabidopsis Transcription Factor MYB12 Is a Flavonol-Specific Regulator of Phenylpropanoid Biosynthesis. Plant Physiol. 2005, 138, 1083–1096. [Google Scholar] [CrossRef]
  55. D’Angeli, S.; Falasca, G.; Matteucci, M.; Altamura, M.M. Cold Perception and Gene Expression Differ in Olea Europaea Seed Coat and Embryo during Drupe Cold Acclimation. New Phytol. 2013, 197, 123–138. [Google Scholar] [CrossRef]
  56. Schmittgen, T.D.; Livak, K.J. Analyzing Real-Time PCR Data by the Comparative CT Method. Nature Protocols 2008, 3, 1101–1108. [Google Scholar] [CrossRef]
  57. Muto, A.; Müller, C.T.; Bruno, L.; McGregor, L.; Ferrante, A.; Chiappetta, A.A.C.; Bitonti, M.B.; Rogers, H.J.; Spadafora, N.D. Fruit Volatilome Profiling through GC × GC-ToF-MS and Gene Expression Analyses Reveal Differences amongst Peach Cultivars in Their Response to Cold Storage. Sci. Rep. 2020, 10, 18333. [Google Scholar] [CrossRef]
  58. Jin, J.; Tian, F.; Yang, D.-C.; Meng, Y.-Q.; Kong, L.; Luo, J.; Gao, G. PlantTFDB 4.0: Toward a Central Hub for Transcription Factors and Regulatory Interactions in Plants. Nucleic Acids Res. 2017, 45, D1040–D1045. [Google Scholar] [CrossRef]
  59. Katiyar, A.; Smita, S.; Lenka, S.K.; Rajwanshi, R.; Chinnusamy, V.; Bansal, K.C. Genome-Wide Classification and Expression Analysis of MYB Transcription Factor Families in Rice and Arabidopsis. BMC Genom. 2012, 13, 544. [Google Scholar] [CrossRef]
  60. Kumar, S.; Stecher, G.; Li, M.; Knyaz, C.; Tamura, K. MEGA X: Molecular Evolutionary Genetics Analysis across Computing Platforms. Mol. Biol. Evol. 2018, 35, 1547–1549. [Google Scholar] [CrossRef]
Figure 1. Minimum, medium, and maximum temperature values calculated as the average of the respective temperatures recorded over 15 days prior to the sampling performed at 130 (A), 150 (B), 165 (C), and 180 (D) days after flowering (DAF), at altitudes of 10, 200, and 300 m above sea level (masl). Different letters denote significant differences between the ripening stage and the growing area.
Ijms 24 08770 g001
Figure 2. Quantification of total anthocyanins content in the Carolea (A) and Tondina (B) cultivars. Analysis was performed in drupes harvested at 130, 150, 165, and 180 days after flowering (DAF) from plants grown at different meters above sea level (masl). The results were reported as the mean value (±standard deviation) of three replicas. Statistical analyses were performed using one-way ANOVA with the Tukey post hoc test (p < 0.05) after the Shapiro-Wilk normality test. Different letters denote a significant difference between the ripening stage and the growing area.
Ijms 24 08770 g002
Figure 3. Schematic representation of the main step in the anthocyanin biosynthetic pathway (A). Phenylalanine ammonia lyase (PAL), cinnamate 4-hydroxylase (C4H), 4-coumarate-CoA ligase (4CL), chalcone synthase (CHS), chalcone isomerase (CHI), flavonol 3-hydrogenase (F3H), flavonol 3′-hydrogenase (F3′H), flavonol 3′5 ′-hydrogenase (F3′5′H), dihydroflavonol 4-reductase (DFR), anthocyanidin synthase (ANS), and UDP-glucose:anthocianidin:flavonoid glucosyltransferase (UFGT). Relative expression levels of OePAL, Oe4CL, OeCHS, OeCHI, OeF3H, OeF3′H, OeF3′5′H, OeDFR, OeANS, and OeUFGT genes (BU) in ‘Carolea’ (orange scales) and ‘Tondina’ (green scales) drupes harvested at 130, 150, 165, and 180 days after flowering (DAF) from plants grown at different meters above sea level (masl). The results were reported as mean value (±standard deviation) of three replicas. Statistical analyses were performed using one-way ANOVA with the Tukey post hoc test (p < 0.05) after the Shapiro-Wilk normality test. Different letters denote significant differences between ripening stage and growing area.
Ijms 24 08770 g003
Figure 4. Phylogenetic tree of the Olea and Arabidopsis R2R3-MYB protein sequences. The evolutionary history was inferred using the neighbor-joining method. The complete amino acid sequences of 190 OeR2R3-MYB and 138 AtR2R3-MYB proteins were used. The subgroups S1 to S25, named according to the previous principle [17], were marked in green, whereas the remaining subgroups, named S26 to S34, were marked in blue.
Ijms 24 08770 g004
Figure 5. Relative expression levels of Oeu050989.1 in ‘Carolea’ (A) and ‘Tondina’ (B). Analyses were performed on drupes harvested at 130, 150, 165, and 180 days after flowering (DAF), from plants grown at different meters above sea level (masl). Statistical analyses were performed using one-way ANOVA with the Tukey post hoc test (p < 0.05) after the Shapiro-Wilk normality test. Different letters denote significant differences between ripening stage and growing area.
Ijms 24 08770 g005
Figure 6. Relative expression levels of Oeu004741.1 (A,B) and Oeu004739.1 (C,D) in ‘Carolea’ (A,C) and ‘Tondina’ (B,D). Analyses were performed on drupes harvested at 130, 150, 165, and 180 days after flowering (DAF) from plants grown at different meters above sea level (masl). Statistical analyses were performed using one-way ANOVA with the Tukey post hoc test (p < 0.05) after the Shapiro-Wilk normality test. Different letters denote significant differences between the ripening stage and growing area.
Ijms 24 08770 g006
Figure 7. Correlation analysis among OePAL, Oe4CL, OeCHS, OeCHI, OeF3H, OeF3′H, OeF3′5′H, OeDFR, OeANS, OeUFGT, Oeu050989.1, Oeu004741.1, and Oeu004739.1 genes; and total anthocyanin content and temperatures in ‘Carolea’ (A) and ‘Tondina’ (B). Analyses were performed using the Pearson correlation and correlation coefficients r > 0.70, and the corresponding p-values < 0.05 were used as the cut-off threshold. Red color indicates negative correlation (−1); blue color indicates positive correlation (+1); and the color intensity represents the strength of correlation.
Ijms 24 08770 g007
Table 1. List of primers used for qRT-PCR analysis.
GeneForwardReverseReference
OePAL5’-ACACATCCATCTTCCAAAAG-3’5’-GTTCCCAGTTCTTCCCTTAC-3’[23]
Oe4CL5’-AAATTTAAAGGCTTCCAGGT-3’5’-GCTTCTTCGGTAAGTTCAAA-3’[23]
OeCHS5’-GATTGGAACTCGATTTTCTG-3’5’-GGACTTTCTCATCTCATCCA-3’[23]
OeCHI5’-AGGGTTCACGTATGGAGTG-3’5’-TGCAAATACAATCTCAGCAG-3’[23]
OeF3H5’-TCCTCTGCCCGTGTGATAGT-3’5’-AATCCGTGTGATGCAGTGAG-3’[23]
OeF3’H5’-GTGGCAGAAGCTGACCTACC-3’5’-CGTAGAGCCCTTTGGAATGA-3’[23]
OeF3’5’H5’-AGTGGTCACCAATGGGATGT-3’5’-CACATCAAACGTGGCTCATT-3’[23]
OeDFR5’-ATTTCAGGTGTTGGCTGAGG-3’5’-ATTCCATATGGCCAGGTCAA-3’[21]
OeANS5’-GCATAGGGTCACTGTCAATGG-3’5’-TCCTTACCATCATGGCCTTT-3’[23]
OeUFGT5’-AATGGCTTTGATGGAAGGTG-3’5’-TTCACGCTGGCATAAACTCA-3’[21]
Oeu050989.15′-TGGTCAAATTACTTTTCGGGAAGT-3′5’-TCTCGTGCCATGTGTAATTATGG-3’Our study
Oeu004741.15’-ACTGACAGACAGAACCCCATGA-3’5’-ATCTGCAGGATTTGCATGAGAA-3’Our study
Oeu004739.15’-TCTCTTATTTTCAACCATACACTCTTCAA-3’5’-AGAGCATGTTTGTTTCTCATTTTCA-3’Our study
OeCRY25′-GTCCTACAAGCTCGTCCTATG-3′5′-CTTGTCGCAACTATGCAAGT-3′[55]
Disclaimer/Publisher’s Note: The statements, opinions and data contained in all publications are solely those of the individual author(s) and contributor(s) and not of MDPI and/or the editor(s). MDPI and/or the editor(s) disclaim responsibility for any injury to people or property resulting from any ideas, methods, instructions or products referred to in the content.

