
Ion and Water Transport in Ion-Exchange Membranes for Power Generation Systems: Guidelines for Modeling

 , , ,
, , ,
Abstract
:
1. Introduction
2. Structure of IEMs


3. Basics of Modeling of Ion and Water Transport in Ion-Exchange Membranes
3.1. Conservation Equations
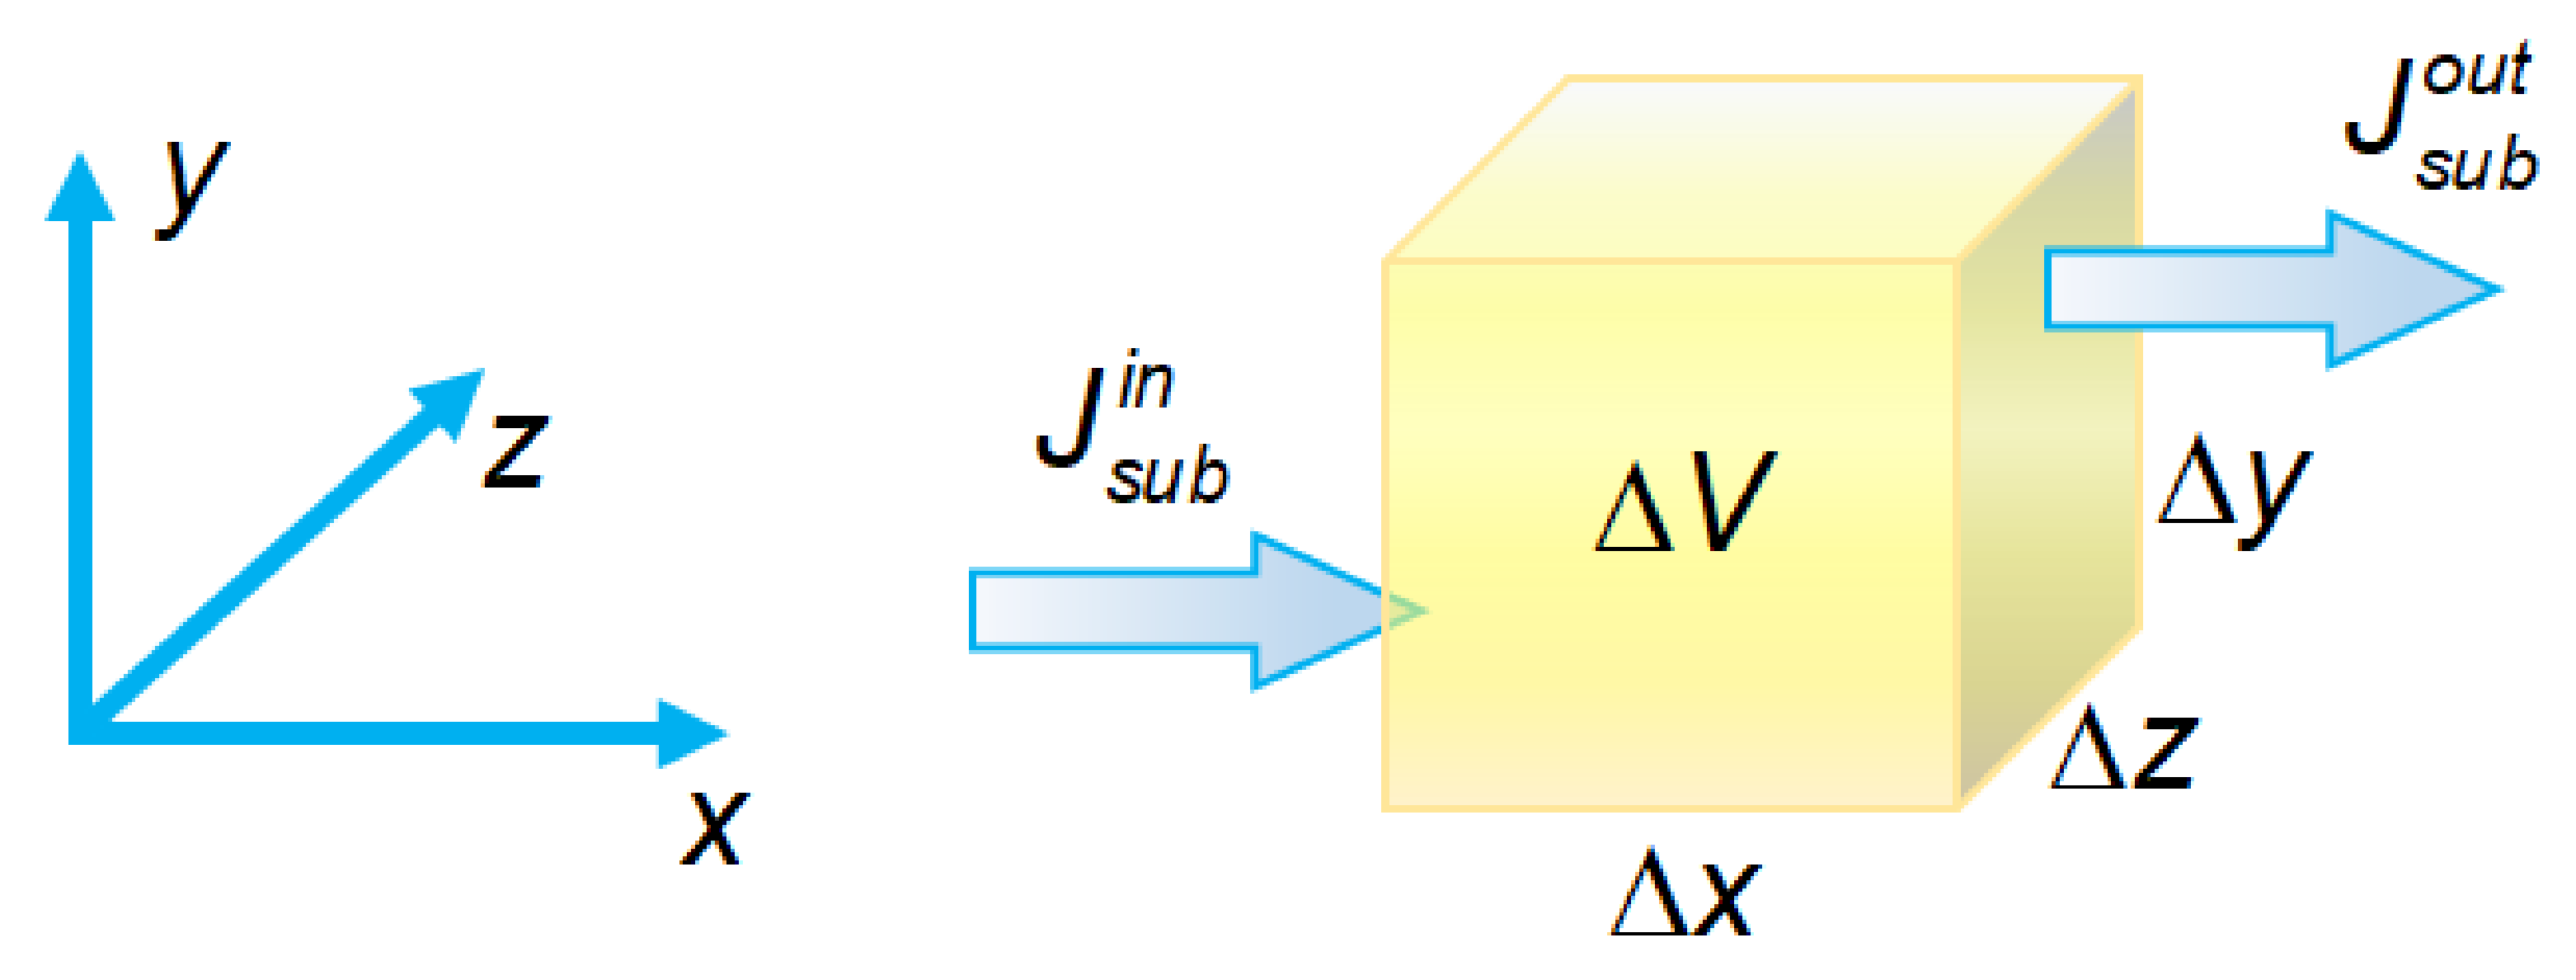
3.1.1. Material Conservation
3.1.2. Navier–Stokes Equation
3.1.3. Charge Conservation Law: Poisson Equation
3.2. Irreversible Thermodynamics
3.2.1. Onsager Phenomenological Equations
3.2.2. Kedem–Katchalsky Equations
3.2.3. Nernst–Planck Equation
3.3. Chemical Reactions
3.4. Donnan Equilibrium Relation
3.5. Donnan–Manning Equilibrium Relation
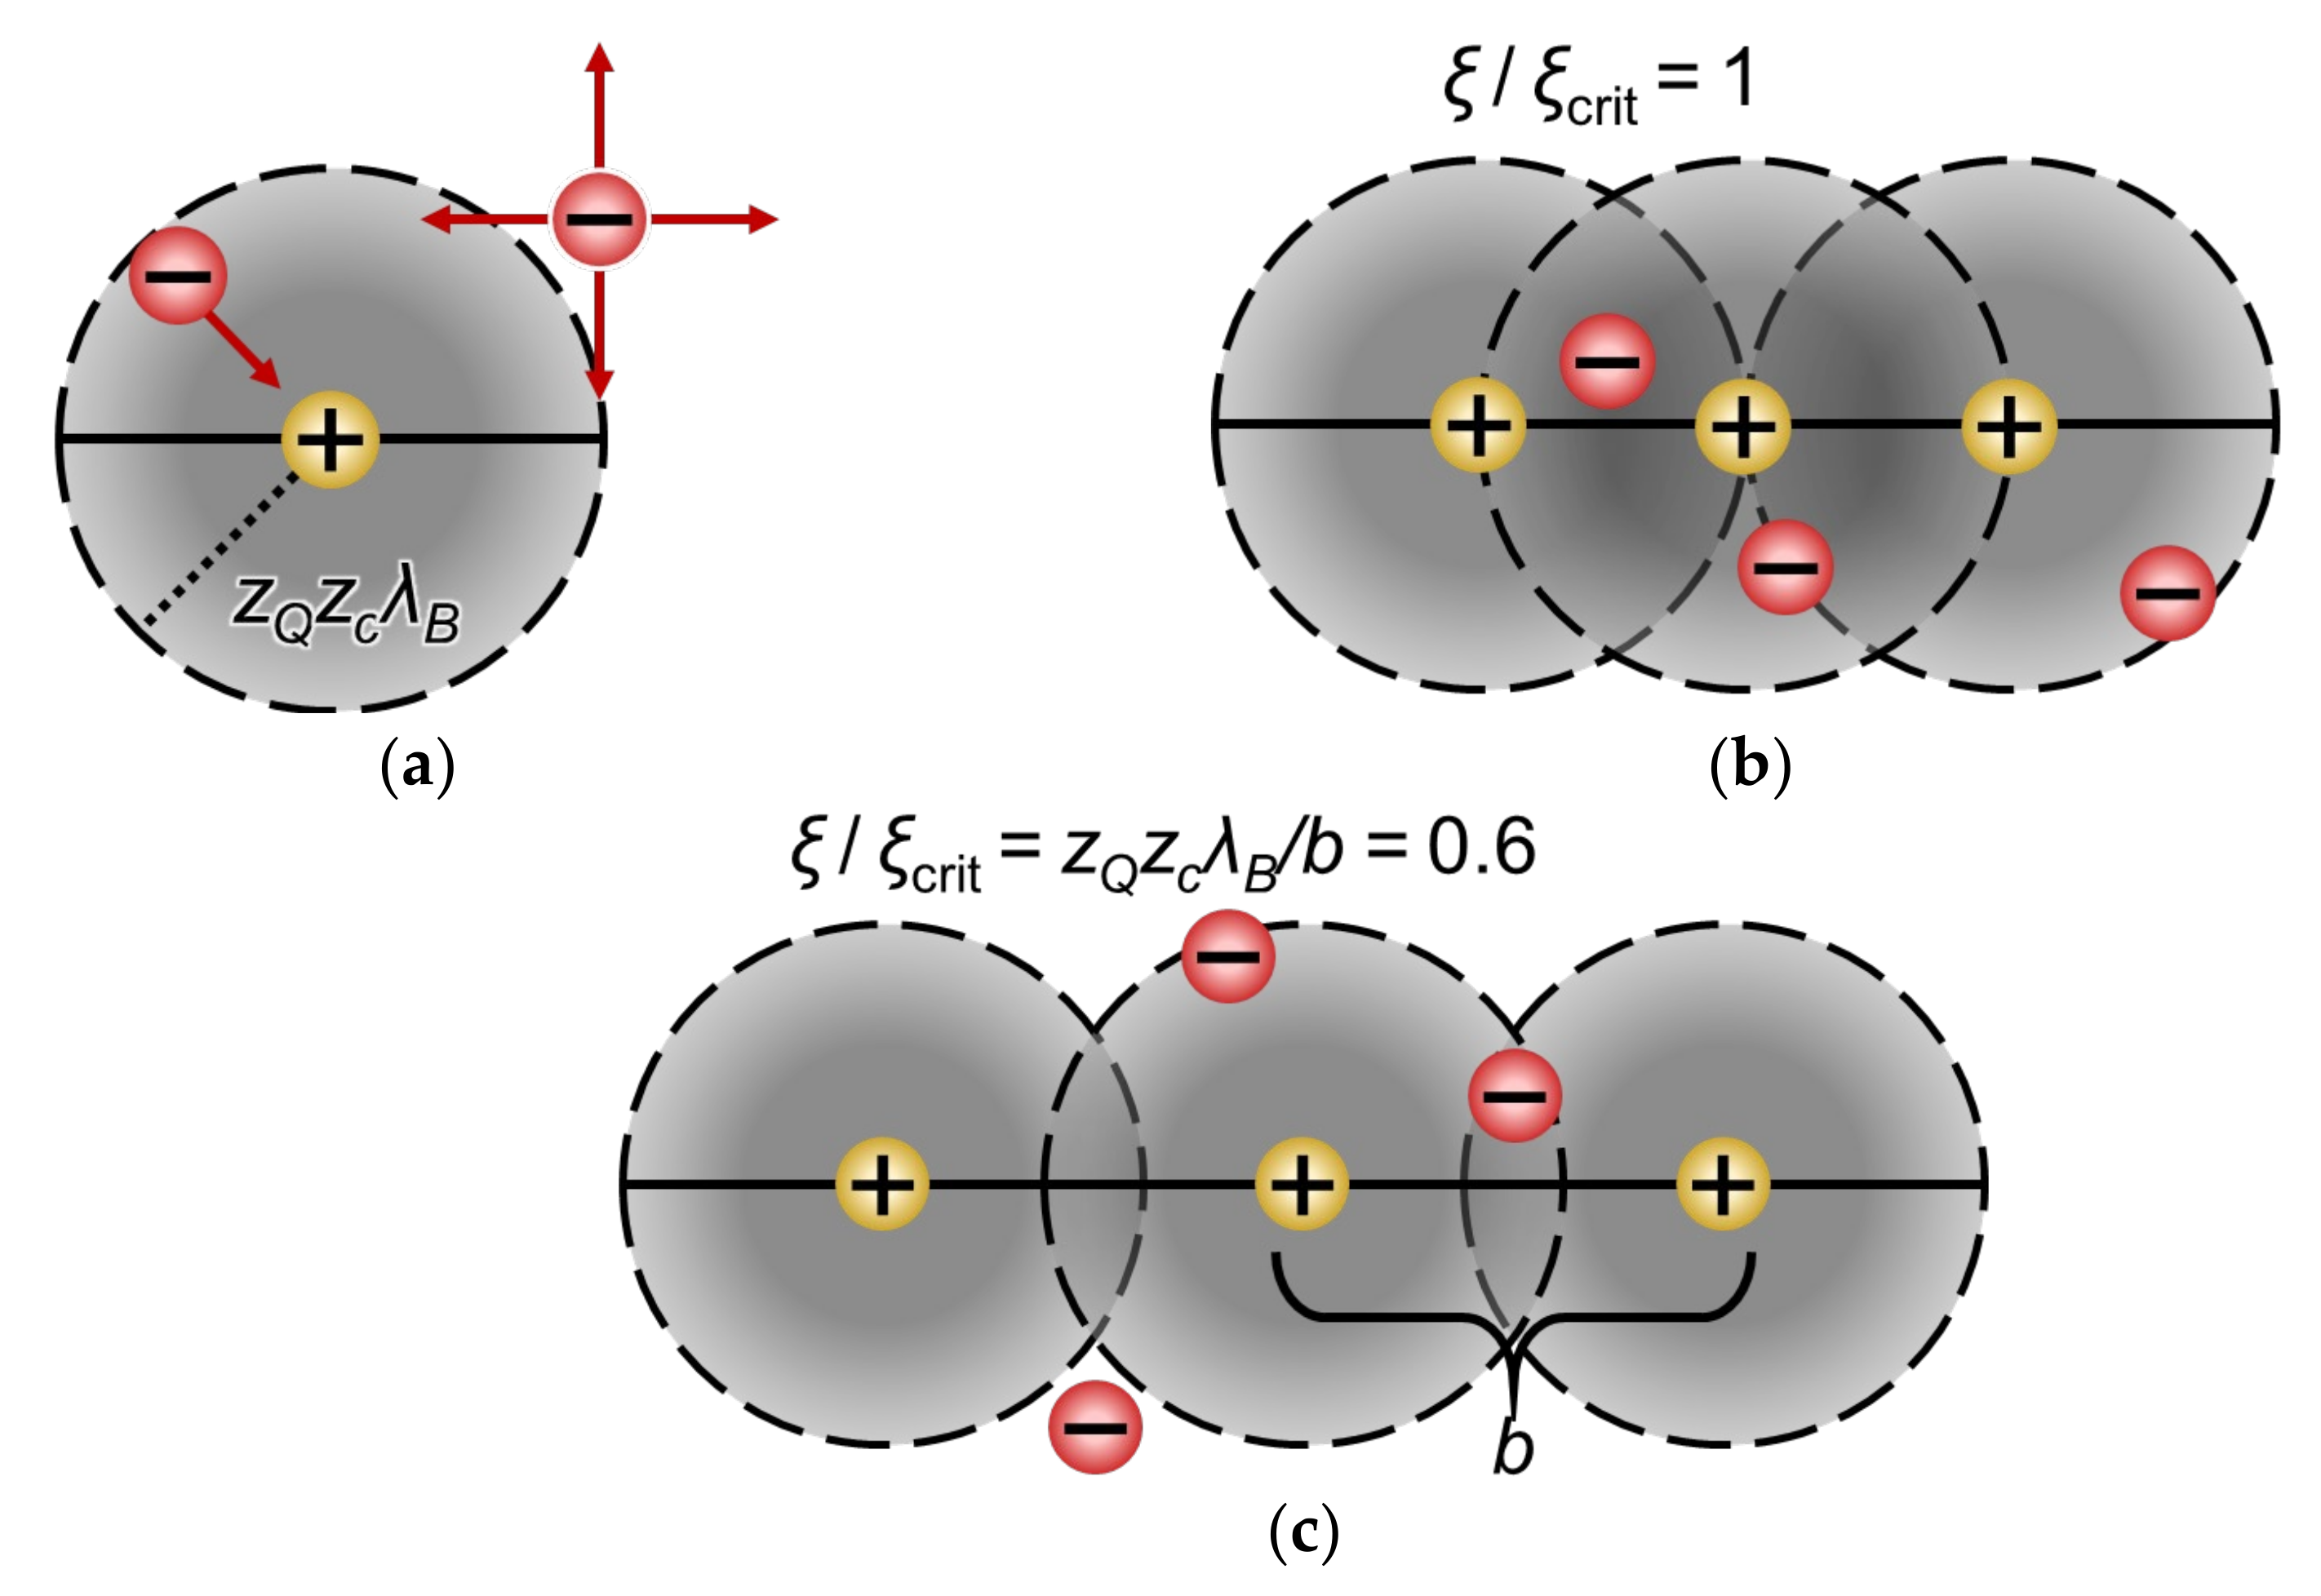
3.5.1. Manning’s Condensation Theory
3.5.2. Condensation Theory Applied to IEMs: Donnan–Manning Theory
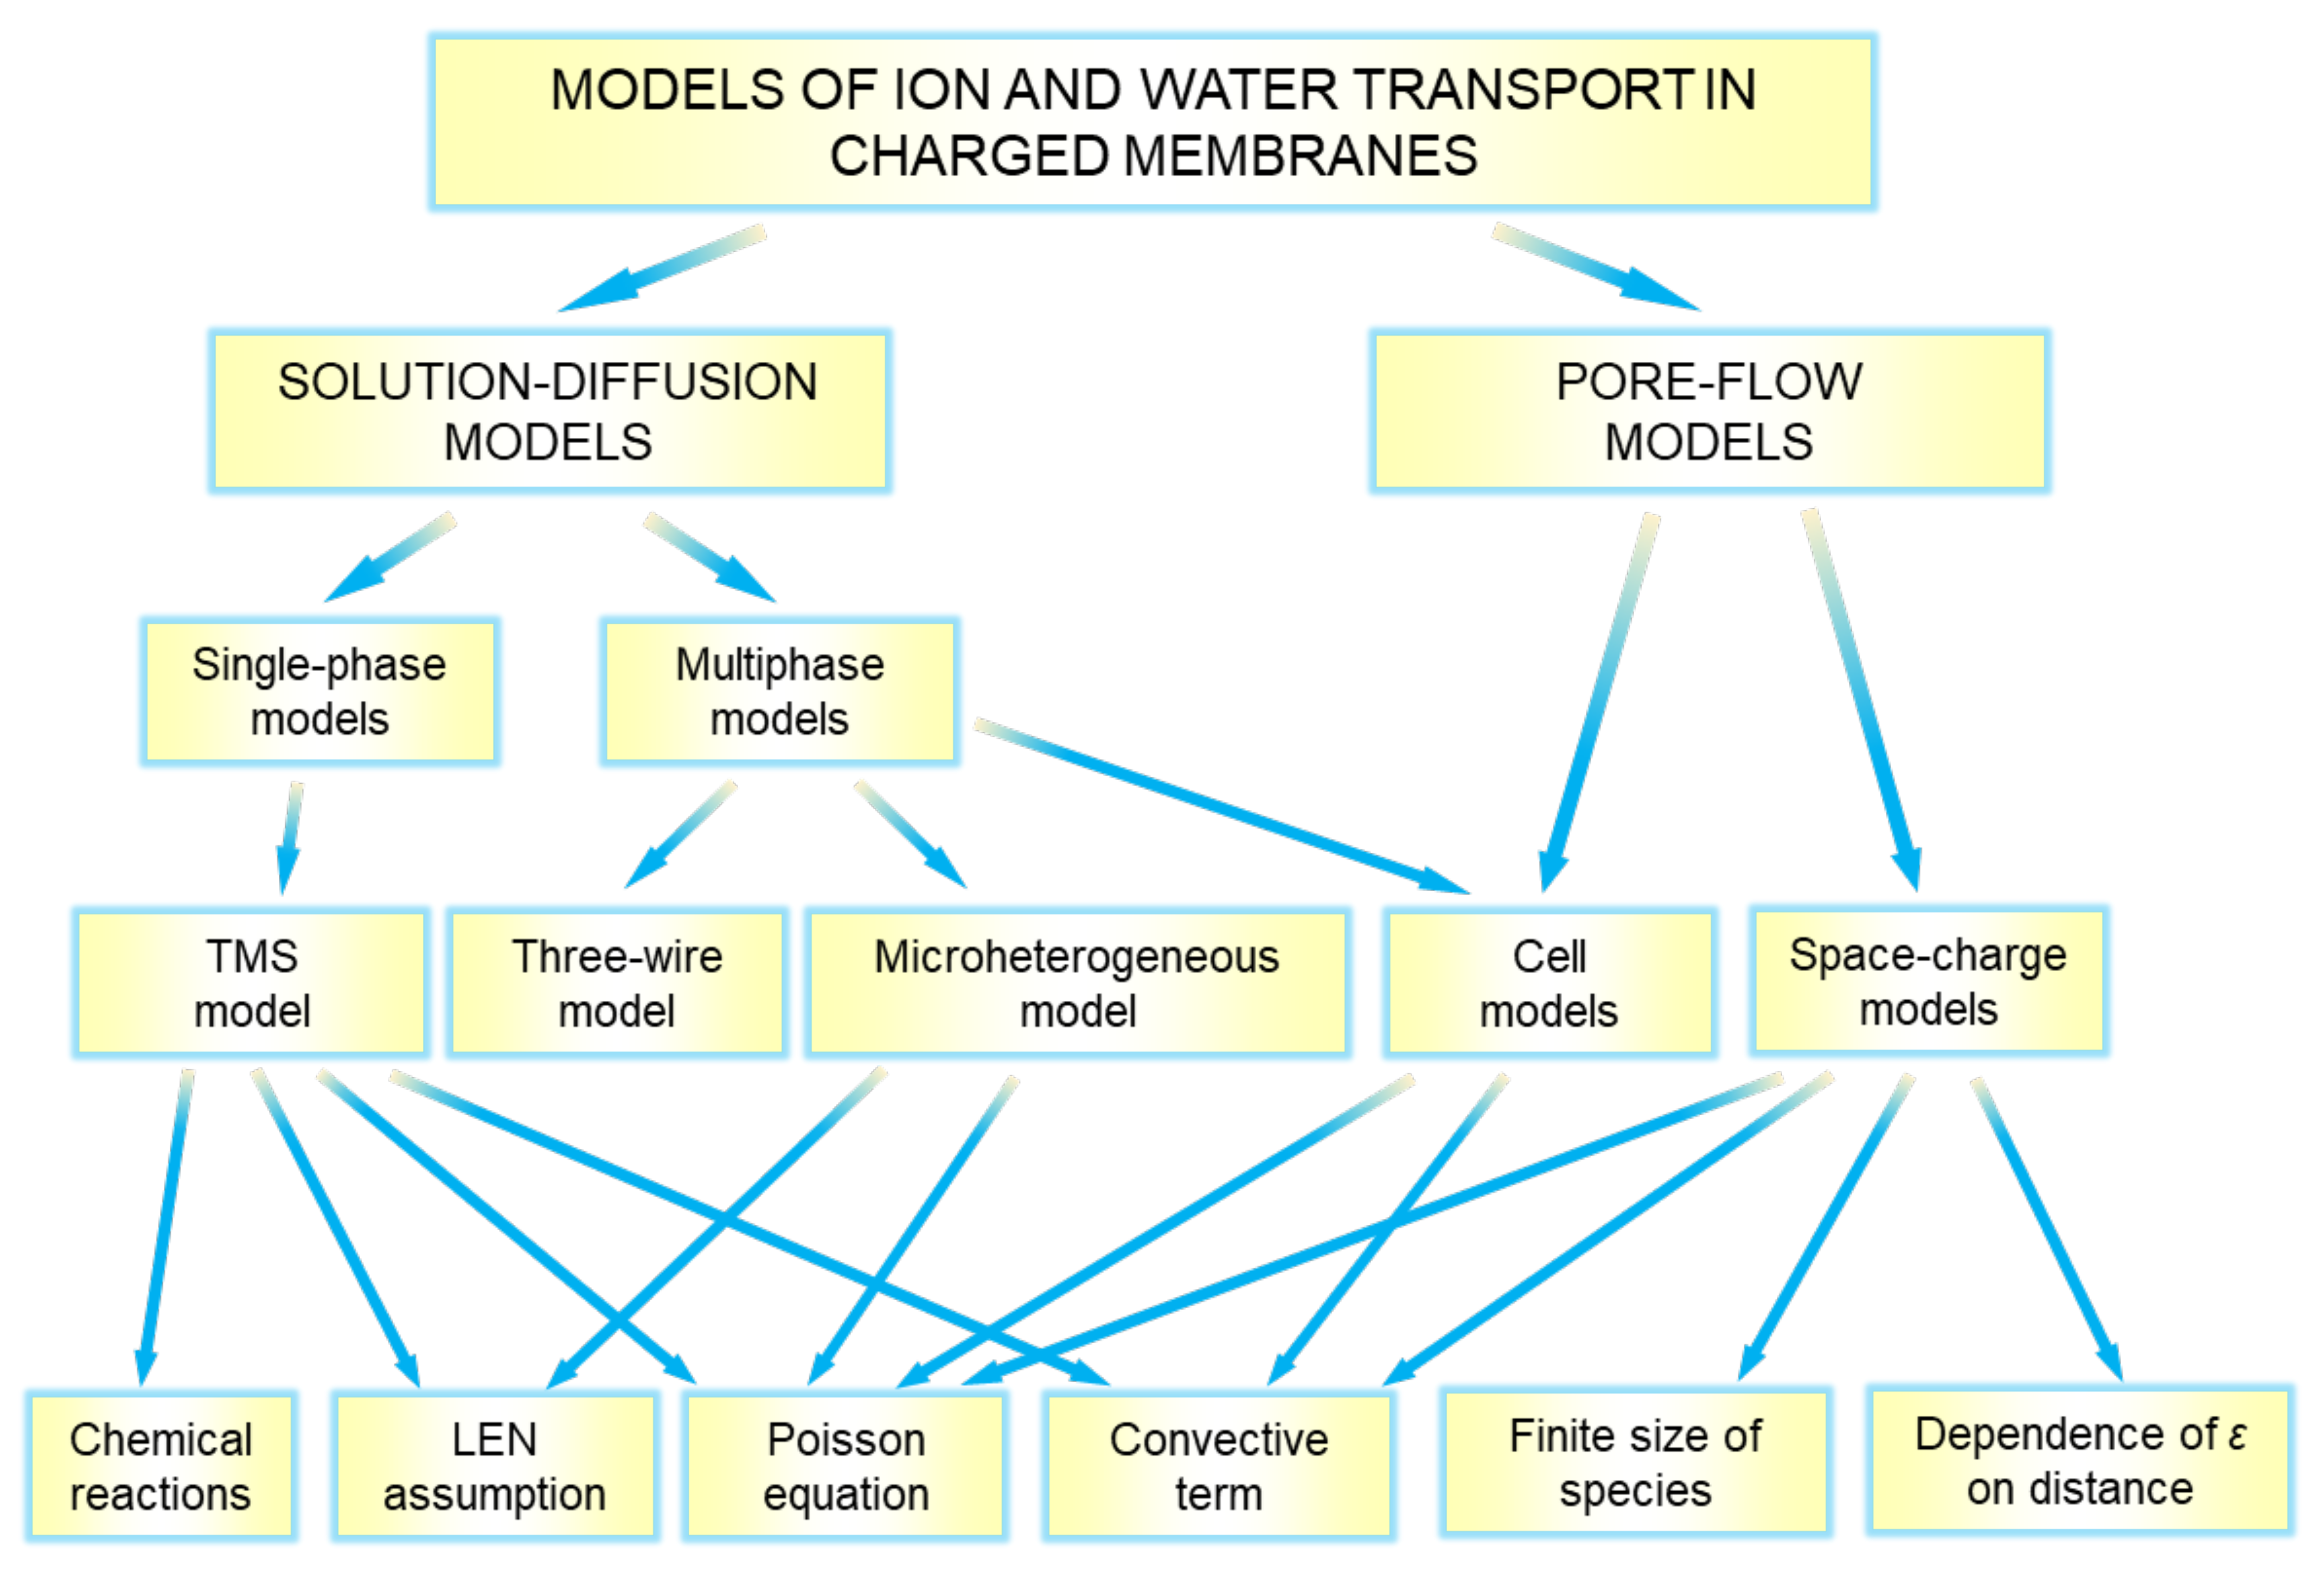
4. Modeling of Ion and Water Transport in IEMs
4.1. “Solution-Diffusion” Models
4.1.1. Teorell–Meyer–Sievers (TMS) Model
4.1.2. Multiphase Models
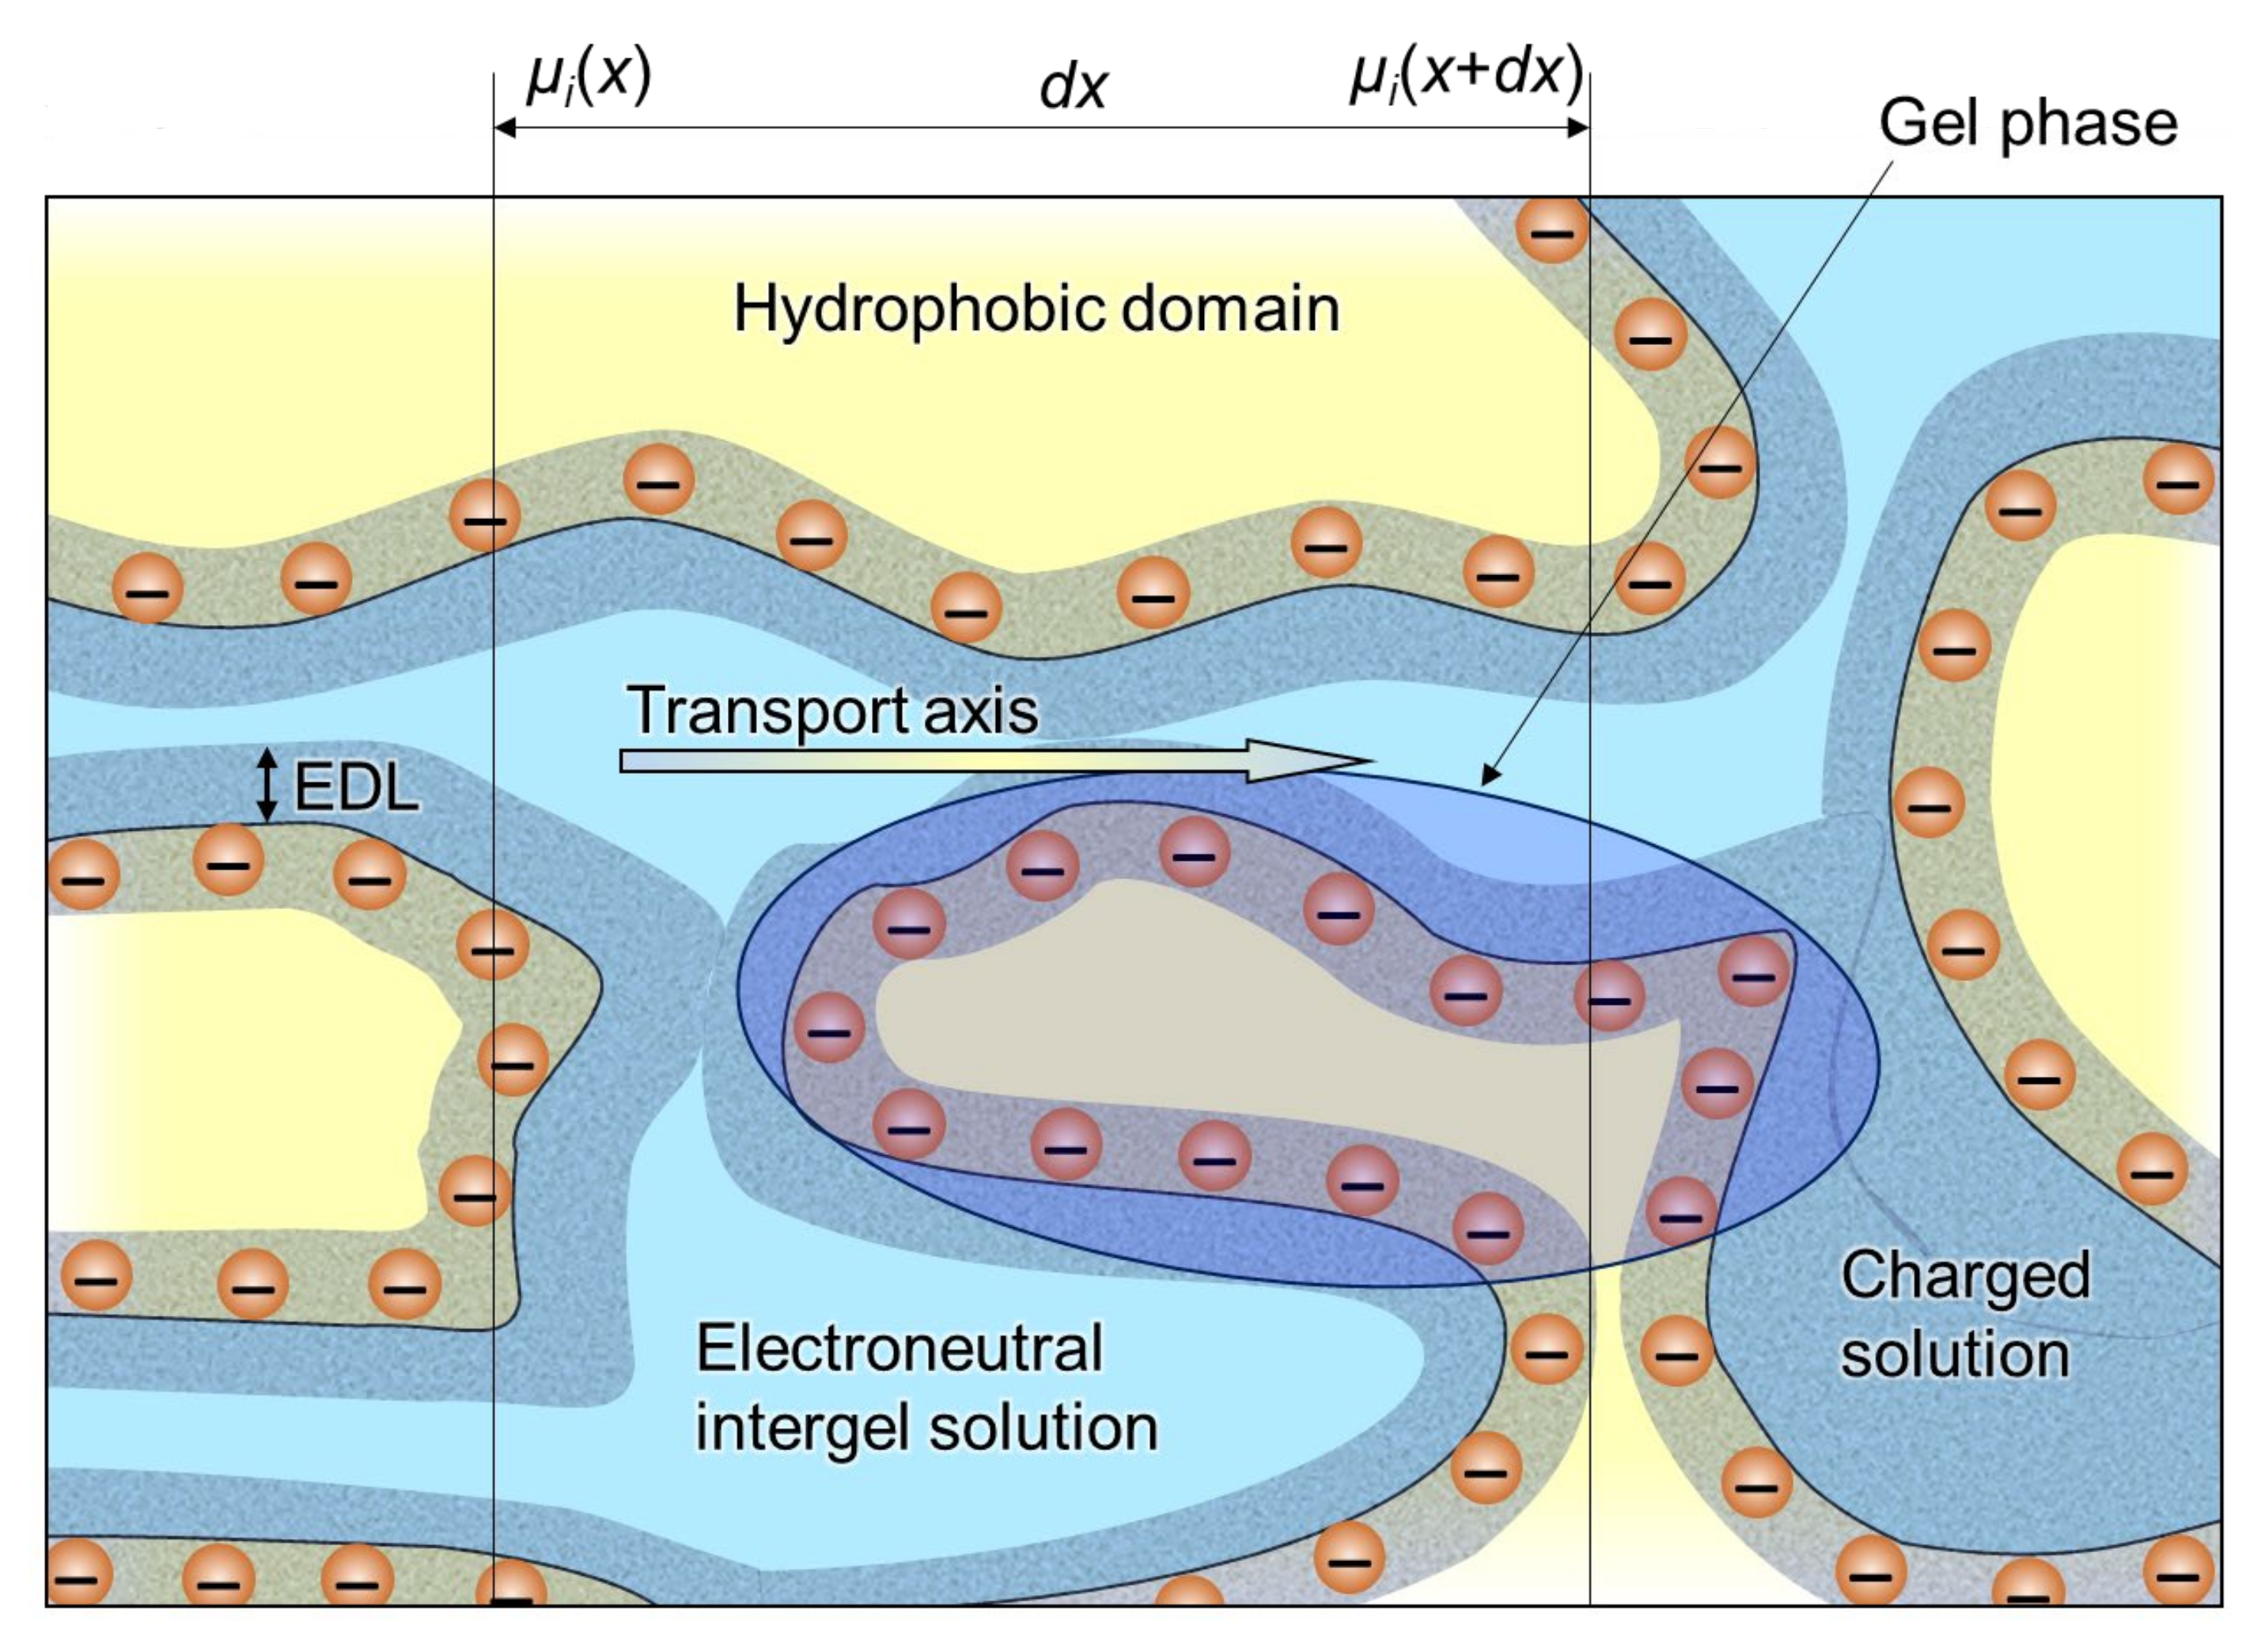
Microheterogeneous Model
Three-Wire Model
Cell Model
4.2. “Pore-Flow” Models
5. Current State of Modeling of Ion and Water Transport in Membrane Energy Generation Systems
5.1. PEMFC Models
5.2. RED Models
6. Conclusions
Author Contributions
Funding
Conflicts of Interest
Nomenclature
| Abbreviations | |
| AEM | anion-exchange membrane |
| BCE | block copolymer electrolyte |
| BPM | bipolar membranes |
| CEM | cation-exchange membrane |
| DBL | diffusion boundary layer |
| ED | electrodialysis |
| EDL | electrical double layer |
| FC | fuel cell |
| HER | hydrogen evolution reaction |
| HOR | hydrogen oxidation reaction |
| IEM | ion-exchange membrane |
| LE | liquid equilibrated |
| LEN | local electroneutrality |
| NF | nanofiltration |
| NPP | Nernst–Planck–Poisson |
| OER | oxygen evolution reaction |
| ORR | oxygen reduction reaction |
| PEM | proton-exchange membrane |
| PEMFC | proton exchange membrane fuel cells |
| PTFE | polytetrafluorethylene |
| RED | reverse electrodialysis |
| RFB | redox flow batteries |
| RO | reverse osmosis |
| TMS | Teorell–Meyer–Sievers (model) |
| VE | vapor equilibrated |
| Symbols | |
| ai | activity of species i |
| aw | water vapor activity |
| b | distance between two neighboring functional groups |
| ci | molar concentration of species i |
| cs | molar salt concentration |
| d | membrane thickness |
| D | electrolyte diffusion coefficient |
| Di | diffusion coefficient of species i |
| electric field intensity | |
| e | protonic charge |
| F | Faraday’s constant |
| body force | |
| Fm | morphological factor |
| f1 | gel phase volume fraction |
| f2 | intergel electroneutral solution volume fraction |
| fi-j | friction factor between ion i and substance j |
| gravitational acceleration | |
| g | activity factor |
| h | channel width |
| electric current density | |
| Faradaic current density | |
| flux density of species i | |
| Jsub | substance flux |
| volumetric flux density | |
| kB | Boltzmann constant |
| KD | Donnan equilibrium coefficient |
| kp | porous medium hydraulic permeability |
| Ks | partition coefficient |
| L | channel length |
| Lij | phenomenological conductivity coefficient |
| Lp | hydraulic permeability coefficient |
| Mwater | water molar mass |
| nch | charged monomer mole fraction |
| nxl | neutral crosslinker mole fraction |
| P | diffusion permeability coefficient |
| p | pressure |
| pm | membrane pore volume fraction |
| average power density | |
| Psat | saturation pressure of water |
| concentration fixed ions | |
| q | space charge |
| R | gas constant |
| area cell resistance | |
| Ri | generation rate of species i in a chemical reaction |
| T | temperature |
| t | time |
| ti | transport number of species i |
| is the average flow rate | |
| substance movement velocity | |
| V | volume |
| fluid flow velocity | |
| partial molar volume | |
| w | membrane water content |
| xw | mole fraction of water in the gas |
| zi | charge number of species i |
| zQ | charge of functional group |
| Greek Symbols | |
| α | structural parameter depending on the position of the phases with respect to the transport axis |
| β | electroosmotic permeability coefficient |
| γi | activity coefficient of species i |
| δ | diffusion layer thickness |
| ε | relative permittivity |
| ε0 | vacuum permittivity |
| εp | polymer dielectric constant |
| εw | water dielectric constant |
| κ | electrical conductivity |
| λB | Bjerrum length |
| λeq | water content (in H2O/SO3−) |
| μ | dynamic viscosity |
| µi | electrochemical potential of species i |
| standard electrochemical potential of species i | |
| ν | kinematic viscosity |
| ν± | stoichiometric number |
| ξ | reduced linear charge density |
| ξcrit | critical reduced linear charge density |
| π | osmotic pressure |
| density | |
| volumetric charge density | |
| σ | Staverman reflection coefficient |
| φ | electric potential |
| ϕw | membrane water volume fraction |
| Δ | difference in a quantity |
| gradient operator | |
| Indices | |
| − | anion |
| + | cation |
| A | coion |
| c | counterion |
| g | superscript denoting that the quantity relates to the gel phase |
| i | species |
| s | superscript denoting that the quantity relates to the interstitial solution |
| w | water |
References
- Werber, J.R.; Osuji, C.O.; Elimelech, M. Materials for next-generation desalination and water purification membranes. Nat. Rev. Mater. 2016, 1, 16018. [Google Scholar] [CrossRef]
- Mauter, M.S.; Zucker, I.; Perreault, F.; Werber, J.R.; Kim, J.-H.; Elimelech, M. The role of nanotechnology in tackling global water challenges. Nat. Sustain. 2018, 1, 166–175. [Google Scholar] [CrossRef]
- Al-Amshawee, S.; Yunus, M.Y.B.M.; Azoddein, A.A.M.; Hassell, D.G.; Dakhil, I.H.; Hasan, H.A. Electrodialysis desalination for water and wastewater: A review. Chem. Eng. J. 2020, 380, 122231. [Google Scholar] [CrossRef]
- Gurreri, L.; Tamburini, A.; Cipollina, A.; Micale, G. Electrodialysis Applications in Wastewater Treatment for Environmental Protection and Resources Recovery: A Systematic Review on Progress and Perspectives. Membranes 2020, 10, 146. [Google Scholar] [CrossRef]
- Alkhadra, M.A.; Su, X.; Suss, M.E.; Tian, H.; Guyes, E.N.; Shocron, A.N.; Conforti, K.M.; de Souza, J.P.; Kim, N.; Tedesco, M.; et al. Electrochemical Methods for Water Purification, Ion Separations, and Energy Conversion. Chem. Rev. 2022, 122, 13547–13635. [Google Scholar] [CrossRef]
- Apel, P.Y.; Bobreshova, O.V.; Volkov, A.V.; Volkov, V.V.; Nikonenko, V.V.; Stenina, I.A.; Filippov, A.N.; Yampolskii, Y.P.; Yaroslavtsev, A.B. Prospects of Membrane Science Development. Membr. Membr. Technol. 2019, 1, 45–63. [Google Scholar] [CrossRef] [Green Version]
- Bazinet, L.; Geoffroy, T.R. Electrodialytic Processes: Market Overview, Membrane Phenomena, Recent Developments and Sustainable Strategies. Membranes 2020, 10, 221. [Google Scholar] [CrossRef]
- Du, L.; Prabhakaran, V.; Xie, X.; Park, S.; Wang, Y.; Shao, Y. Low-PGM and PGM-Free Catalysts for Proton Exchange Membrane Fuel Cells: Stability Challenges and Material Solutions. Adv. Mater. 2021, 33, 1908232. [Google Scholar] [CrossRef]
- Luo, T.; Abdu, S.; Wessling, M. Selectivity of ion exchange membranes: A review. J. Membr. Sci. 2018, 555, 429–454. [Google Scholar] [CrossRef]
- Falcão, D.S.; Pinto, A.M.F.R. A review on PEM electrolyzer modelling: Guidelines for beginners. J. Clean. Prod. 2020, 261, 121184. [Google Scholar] [CrossRef]
- Jiang, S.; Sun, H.; Wang, H.; Ladewig, B.P.; Yao, Z. A comprehensive review on the synthesis and applications of ion exchange membranes. Chemosphere 2021, 282, 130817. [Google Scholar] [CrossRef] [PubMed]
- Xiong, P.; Zhang, L.; Chen, Y.; Peng, S.; Yu, G. A Chemistry and Microstructure Perspective on Ion-Conducting Membranes for Redox Flow Batteries. Angew. Chem. Int. Ed. 2021, 60, 24770–24798. [Google Scholar] [CrossRef] [PubMed]
- Logan, B.E.; Elimelech, M. Membrane-based processes for sustainable power generation using water. Nature 2012, 488, 313–319. [Google Scholar] [CrossRef]
- Davydov, D.; Nosova, E.; Loza, S.; Achoh, A.; Korzhov, A.; Sharafan, M.; Melnikov, S. Use of the Microheterogeneous Model to Assess the Applicability of Ion-Exchange Membranes in the Process of Generating Electricity from a Concentration Gradient. Membranes 2021, 11, 406. [Google Scholar] [CrossRef] [PubMed]
- Veerman, J.; Saakes, M.J.; Metz, S.J.; Harmsen, G. Reverse electrodialysis: A validated process model for design and optimization. Chem. Eng. J. 2011, 166, 256–268. [Google Scholar] [CrossRef]
- Tian, H.; Wang, Y.; Pei, Y.; Crittenden, J.C. Unique applications and improvements of reverse electrodialysis: A review and outlook. Appl. Energy 2020, 262, 114482. [Google Scholar] [CrossRef]
- Xu, A.; Shyy, W.; Zhao, T. Lattice Boltzmann modeling of transport phenomena in fuel cells and flow batteries. Acta Mech. Sin. 2017, 33, 555–574. [Google Scholar] [CrossRef]
- Vichard, L.; Steiner, N.Y.; Zerhouni, N.; Hissel, D. Hybrid fuel cell system degradation modeling methods: A comprehensive review. J. Power Source 2021, 506, 230071. [Google Scholar] [CrossRef]
- Ran, J.; Wu, L.; He, Y.; Yang, Z.; Wang, Y.; Jiang, C.; Ge, L.; Bakangura, E.; Xu, T. Ion exchange membranes: New developments and applications. J. Membr. Sci. 2017, 522, 267–291. [Google Scholar] [CrossRef]
- Mizutani, Y. Structure of ion exchange membranes. J. Membr. Sci. 1990, 49, 121–144. [Google Scholar] [CrossRef]
- Sarapulova, V.; Shkorkina, I.; Mareev, S.; Pismenskaya, N.; Kononenko, N.; Larchet, C.; Dammak, L.; Nikonenko, V. Transport Characteristics of Fujifilm Ion-Exchange Membranes as Compared to Homogeneous Membranes AMX and CMX and to Heterogeneous Membranes MK-40 and MA-41. Membranes 2019, 9, 84. [Google Scholar] [CrossRef] [PubMed] [Green Version]
- Nikonenko, V.V.; Mareev, S.A.; Pis’menskaya, N.D.; Uzdenova, A.M.; Kovalenko, A.V.; Urtenov, M.K.; Pourcelly, G. Effect of electroconvection and its use in intensifying the mass transfer in electrodialysis (Review). Russ. J. Electrochem. 2017, 53, 1122–1144. [Google Scholar] [CrossRef]
- Mani, A.; Wang, K.M. Electroconvection Near Electrochemical Interfaces: Experiments, Modeling, and Computation. Annu. Rev. Fluid Mech. 2020, 52, 509–529. [Google Scholar] [CrossRef]
- Kreuer, K.-D.; Paddison, S.J.; Spohr, E.; Schuster, M. Transport in Proton Conductors for Fuel-Cell Applications: Simulations, Elementary Reactions, and Phenomenology. Chem. Rev. 2004, 104, 4637–4678. [Google Scholar] [CrossRef] [Green Version]
- Giorno, L.; Drioli, E.; Strathmann, H. Permselectivity of Ion-Exchange Membranes. In Encyclopedia of Membranes; Springer: Berlin/Heidelberg, Germany, 2016; pp. 1490–1493. [Google Scholar]
- Zhang, Y.; Paepen, S.; Pinoy, L.; Meesschaert, B.; Van der Bruggen, B. Selectrodialysis: Fractionation of divalent ions from monovalent ions in a novel electrodialysis stack. Sep. Purif. Technol. 2012, 88, 191–201. [Google Scholar] [CrossRef]
- Park, H.B.; Kamcev, J.; Robeson, L.M.; Elimelech, M.; Freeman, B.D. Maximizing the right stuff: The trade-off between membrane permeability and selectivity. Science 2017, 356, 1138–1148. [Google Scholar] [CrossRef] [Green Version]
- Zhang, B.; Gao, H.; Xiao, C.; Tong, X.; Chen, Y. The trade-off between membrane permselectivity and conductivity: A percolation simulation of mass transport. J. Membr. Sci. 2020, 597, 117751. [Google Scholar] [CrossRef]
- Pärnamäe, R.; Mareev, S.; Nikonenko, V.; Melnikov, S.; Sheldeshov, N.; Zabolotskii, V.; Hamelers, H.V.M.; Tedesco, M. Bipolar membranes: A review on principles, latest developments, and applications. J. Membr. Sci. 2021, 617, 118538. [Google Scholar] [CrossRef]
- Weber, A.Z.; Borup, R.L.; Darling, R.M.; Das, P.K.; Dursch, T.J.; Gu, W.; Harvey, D.; Kusoglu, A.; Litster, S.; Mench, M.M.; et al. A Critical Review of Modeling Transport Phenomena in Polymer-Electrolyte Fuel Cells. J. Electrochem. Soc. 2014, 161, F1254–F1299. [Google Scholar] [CrossRef] [Green Version]
- Stenina, I.A.; Yaroslavtsev, A.B. Ionic Mobility in Ion-Exchange Membranes. Membranes 2021, 11, 198. [Google Scholar] [CrossRef]
- Douglin, J.C.; Varcoe, J.R.; Dekel, D.R. A high-temperature anion-exchange membrane fuel cell. J. Power Sources Adv. 2020, 5, 100023. [Google Scholar] [CrossRef]
- Van Rijn, P.; Tutus, M.; Kathrein, C.; Zhu, L.; Wessling, M.; Schwaneberg, U.; Böker, A. Challenges and advances in the field of self-assembled membranes. Chem. Soc. Rev. 2013, 42, 6578–6592. [Google Scholar] [CrossRef] [PubMed]
- Timashev, S.F. Physical Chemistry of Membrane Processes; Ellis Horwood Ltd.: New York, NY, USA, 1991; ISBN 9780136629825. [Google Scholar]
- Mauritz, K.A.; Moore, R.B. State of Understanding of Nafion. Chem. Rev. 2004, 104, 4535–4586. [Google Scholar] [CrossRef] [PubMed]
- Gebel, G. Structural evolution of water swollen perfluorosulfonated ionomers from dry membrane to solution. Polymer 2000, 41, 5829–5838. [Google Scholar] [CrossRef]
- Helfferich, F.G. Ion Exchange; McGraw-Hill/Dover Publications: New York, NY, USA, 1995; Volume 138, ISBN 0486687848. [Google Scholar]
- Drozdov, A.D.; de Claville Christiansen, J. The effects of pH and ionic strength on equilibrium swelling of polyampholyte gels. Int. J. Solids Struct. 2017, 110–111, 192–208. [Google Scholar] [CrossRef]
- Kozmai, A.E.; Nikonenko, V.V.; Zyryanova, S.; Pismenskaya, N.D.; Dammak, L.; Baklouti, L. Modelling of anion-exchange membrane transport properties with taking into account the change in exchange capacity and swelling when varying bathing solution concentration and pH. J. Membr. Sci. 2019, 590, 117291. [Google Scholar] [CrossRef]
- Gierke, T.D.; Munn, G.E.; Wilson, F.C. The morphology in nafion perfluorinated membrane products, as determined by wide- and small-angle X-ray studies. J. Polym. Sci. Polym. Phys. Ed. 1981, 19, 1687–1704. [Google Scholar] [CrossRef]
- Kreuer, K.D. On the development of proton conducting polymer membranes for hydrogen and methanol fuel cells. J. Membr. Sci. 2001, 185, 29–39. [Google Scholar] [CrossRef]
- Berezina, N.P.; Kononenko, N.A.; Dyomina, O.A.; Gnusin, N.P. Characterization of ion-exchange membrane materials: Properties vs structure. Adv. Colloid Interface Sci. 2008, 139, 3–28. [Google Scholar] [CrossRef]
- Kononenko, N.; Nikonenko, V.; Grande, D.; Larchet, C.; Dammak, L.; Fomenko, M.; Volfkovich, Y. Porous structure of ion exchange membranes investigated by various techniques. Adv. Colloid Interface Sci. 2017, 246, 196–216. [Google Scholar] [CrossRef]
- Svoboda, M.; Beneš, J.; Vobecká, L.; Slouka, Z. Swelling induced structural changes of a heterogeneous cation-exchange membrane analyzed by micro-computed tomography. J. Membr. Sci. 2017, 525, 195–201. [Google Scholar] [CrossRef]
- Zvaigzne, M.A.; Martynov, I.L.; Samokhvalov, P.S.; Nabiev, I.R. Fabrication of composite materials from semiconductor quantum dots and organic polymers for optoelectronics and biomedicine: Role of surface ligands. Russ. Chem. Bull. 2016, 65, 2568–2577. [Google Scholar] [CrossRef]
- Donnan, F.G. The theory of membrane equilibrium and membrane potential in the presence of a non-dialyzable electrolyte. A contribution to physical-chemical physiology. Z. Elektrochem. Angew. Phys. Chem. 1911, 17, 572–581. [Google Scholar]
- Shiryaeva, I.M.; Victorov, A.I. Equilibrium of ion-exchange polymeric membrane with aqueous salt solution and its thermodynamic modeling. Fluid Phase Equilibria 2001, 180, 115–138. [Google Scholar] [CrossRef]
- Paddison, S.J.; Bender, G.; Kreuer, K.D.; Nicoloso, N.; Zawodzinski, T.A. The microwave region of the dielectric spectrum of hydrated Nafion® and other sulfonated membranes. J. New Mater. Electrochem. Syst. 2000, 3, 291–300. [Google Scholar]
- Paddison, S.J.; Reagor, D.W.; Zawodzinski, T.A., Jr. High frequency dielectric studies of hydrated Nafion®. J. Electroanal. Chem. 1998, 459, 91–97. [Google Scholar] [CrossRef]
- Haubold, H.-G.; Vad, T.; Jungbluth, H.; Hiller, P. Nano structure of NAFION: A SAXS study. Electrochim. Acta 2001, 46, 1559–1563. [Google Scholar] [CrossRef]
- Kornyshev, A.A.; Kuznetsov, A.M.; Spohr, E.; Ulstrup, J. Kinetics of Proton Transport in Water. J. Phys. Chem. B 2003, 107, 3351–3366. [Google Scholar] [CrossRef] [Green Version]
- Nikonenko, V.V.; Yaroslavtsev, A.B.; Pourcelly, G. Ion Transfer in and Through Charged Membranes: Structure, Properties, and Theory. In Ionic Interactions in Natural and Synthetic Macromolecules; John Wiley & Sons Inc.: Hoboken, NJ, USA, 2012; pp. 267–335. ISBN 9780470529270. [Google Scholar]
- Lu, Z. State of water in perfluorosulfonic acid membranes. J. Electrochem. Soc. 2005, 155, 67–68. [Google Scholar]
- Paddison, S.J. Proton Conduction Mechanisms at Low Degrees of Hydration in Sulfonic Acid–Based Polymer Electrolyte Membranes. Annu. Rev. Mater. Res. 2003, 33, 289–319. [Google Scholar] [CrossRef]
- Zhou, X.; Wang, Z.; Epsztein, R.; Zhan, C.; Li, W.; Fortner, J.D.; Pham, T.A.; Kim, J.-H.; Elimelech, M. Intrapore energy barriers govern ion transport and selectivity of desalination membranes. Sci. Adv. 2020, 6, eabd9045. [Google Scholar] [CrossRef] [PubMed]
- Larchet, C.; Nouri, S.; Auclair, B.; Dammak, L.; Nikonenko, V. Application of chronopotentiometry to determine the thickness of diffusion layer adjacent to an ion-exchange membrane under natural convection. Adv. Colloid Interface Sci. 2008, 139, 45–61. [Google Scholar] [CrossRef] [PubMed]
- Goh, P.S.; Ismail, A.F. A review on inorganic membranes for desalination and wastewater treatment. Desalination 2018, 434, 60–80. [Google Scholar] [CrossRef]
- Dickinson, E.J.F.; Smith, G. Modelling the Proton-Conductive Membrane in Practical Polymer Electrolyte Membrane Fuel Cell (PEMFC) Simulation: A Review. Membranes 2020, 10, 310. [Google Scholar] [CrossRef] [PubMed]
- Tanaka, Y. Ion Exchange Membranes. In Fundamentals and Applications, 2nd ed.; Elsevier Science: Amsterdam, The Netherlands, 2015; ISBN 9780444633194. [Google Scholar]
- Newman, J.S.; Balsara, N.P. Electrochemical Systems, 4th ed.; Wiley-Blackwell: Hoboken, NJ, USA, 2021; ISBN 9781119514602. [Google Scholar]
- Nikonenko, V.; Nebavsky, A.; Mareev, S.; Kovalenko, A.; Urtenov, M.; Pourcelly, G.; Nikonenko, V.; Nebavsky, A.; Mareev, S.; Kovalenko, A.; et al. Modelling of Ion Transport in Electromembrane Systems: Impacts of Membrane Bulk and Surface Heterogeneity. Appl. Sci. 2018, 9, 25. [Google Scholar] [CrossRef] [Green Version]
- Soetaert, K.; Herman, P.M.J. A practical Guide to Ecological Modelling: Using R as a Simulation Platform; Soetaert, K., Herman, P.M.J., Eds.; Springer: Dordrecht, The Netherlands, 2009; ISBN 9781402086236. [Google Scholar]
- Bear, J. Dynamics of Fluids in Porous Media (Dover Civil and Mechanical Engineering); Dover Publications: New York, NY, USA, 1988; ISBN 9780486656755. [Google Scholar]
- Liu, J.-L. Poisson’s Equation in Electrostatics. Available online: https://dasher.wustl.edu/chem430/readings/poisson-equation.pdf (accessed on 16 December 2022).
- Cohen, H.; Cooley, J.W. The Numerical Solution of the Time-Dependent Nernst-Planck Equations. Biophys. J. 1965, 5, 145–162. [Google Scholar] [CrossRef] [Green Version]
- Uzdenova, A.; Kovalenko, A.; Urtenov, M.; Nikonenko, V. 1D Mathematical Modelling of Non-Stationary Ion Transfer in the Diffusion Layer Adjacent to an Ion-Exchange Membrane in Galvanostatic Mode. Membranes 2018, 8, 84. [Google Scholar] [CrossRef] [Green Version]
- Moya, A.A. Electrochemical Impedance of Ion-Exchange Membranes in Ternary Solutions with Two Counterions. J. Phys. Chem. C 2014, 118, 2539–2553. [Google Scholar] [CrossRef]
- Yaroshchuk, A.; Zhu, Y.; Bondarenko, M.; Bruening, M.L. Deviations from Electroneutrality in Membrane Barrier Layers: A Possible Mechanism Underlying High Salt Rejections. Langmuir 2016, 32, 2644–2658. [Google Scholar] [CrossRef]
- Kilic, M.S.; Bazant, M.Z.; Ajdari, A. Steric effects in the dynamics of electrolytes at large applied voltages. II. Modified Poisson-Nernst-Planck equations. Phys. Rev. E 2007, 75, 021503. [Google Scholar] [CrossRef] [Green Version]
- Golubenko, D.V.; Yaroslavtsev, A.B. Effect of current density, concentration of ternary electrolyte and type of cations on the monovalent ion selectivity of surface-sulfonated graft anion-exchange membranes: Modelling and experiment. J. Membr. Sci. 2021, 635, 119466. [Google Scholar] [CrossRef]
- Gorobchenko, A.; Mareev, S.; Nikonenko, V. Mathematical Modeling of Monovalent Permselectivity of a Bilayer Ion-Exchange Membrane as a Function of Current Density. Int. J. Mol. Sci. 2022, 23, 4711. [Google Scholar] [CrossRef] [PubMed]
- Honarparvar, S.; Reible, D. Modeling multicomponent ion transport to investigate selective ion removal in electrodialysis. Environ. Sci. Ecotechnol. 2020, 1, 100007. [Google Scholar] [CrossRef]
- Mareev, S.A.; Evdochenko, E.; Wessling, M.; Kozaderova, O.A.; Niftaliev, S.I.; Pismenskaya, N.D.; Nikonenko, V.V. A comprehensive mathematical model of water splitting in bipolar membranes: Impact of the spatial distribution of fixed charges and catalyst at bipolar junction. J. Membr. Sci. 2020, 603, 118010. [Google Scholar] [CrossRef]
- Skolotneva, E.; Tsygurina, K.; Mareev, S.; Melnikova, E.; Pismenskaya, N.; Nikonenko, V. High Diffusion Permeability of Anion-Exchange Membranes for Ammonium Chloride: Experiment and Modeling. Int. J. Mol. Sci. 2022, 23, 5782. [Google Scholar] [CrossRef]
- Yaroshchuk, A.; Bruening, M.L.; Zholkovskiy, E. Modelling nanofiltration of electrolyte solutions. Adv. Colloid Interface Sci. 2019, 268, 39–63. [Google Scholar] [CrossRef]
- Kedem, O.; Katchalsky, A. Permeability of composite membranes. Part 1.—Electric current, volume flow and flow of solute through membranes. Trans. Faraday Soc. 1963, 59, 1918–1930. [Google Scholar] [CrossRef]
- Meares, P. Coupling of ion and water fluxes in synthetic membranes. J. Membr. Sci. 1981, 8, 295–307. [Google Scholar] [CrossRef]
- Koter, S.; Kujawski, W.; Koter, I. Importance of the cross-effects in the transport through ion-exchange membranes. J. Membr. Sci. 2007, 297, 226–235. [Google Scholar] [CrossRef]
- Auclair, B.; Nikonenko, V.; Larchet, C.; Métayer, M.; Dammak, L. Correlation between transport parameters of ion-exchange membranes. J. Membr. Sci. 2002, 195, 89–102. [Google Scholar] [CrossRef]
- Sarapulova, V.; Pismenskaya, N.; Butylskii, D.; Titorova, V.; Wang, Y.; Xu, T.; Zhang, Y.; Nikonenko, V. Transport and Electrochemical Characteristics of CJMCED Homogeneous Cation Exchange Membranes in Sodium Chloride, Calcium Chloride, and Sodium Sulfate Solutions. Membranes 2020, 10, 165. [Google Scholar] [CrossRef] [PubMed]
- Rubinstein, I.; Schur, A.; Zaltzman, B. Artifact of “Breakthrough” osmosis: Comment on the local Spiegler-Kedem-Katchalsky equations with constant coefficients. Sci. Rep. 2021, 11, 5051. [Google Scholar] [CrossRef]
- Jarzyńska, M.; Staryga, E.; Kluza, F.; Spiess, W.E.L.; Góral, D. Diffusion Characteristics in Ethyl Alcohol and Glucose Solutions Using Kedem-Katchalsky Equations. Chem. Eng. Technol. 2020, 43, 248–252. [Google Scholar] [CrossRef]
- Kujawski, W.; Yaroshchuk, A.; Zholkovskiy, E.; Koter, I.; Koter, S. Analysis of Membrane Transport Equations for Reverse Electrodialysis (RED) Using Irreversible Thermodynamics. Int. J. Mol. Sci. 2020, 21, 6325. [Google Scholar] [CrossRef] [PubMed]
- Hidalgo, A.M.; León, G.; Gómez, M.; Murcia, M.D.; Gómez, E.; Macario, J.A. Removal of different dye solutions: A comparison study using a polyamide nf membrane. Membranes 2020, 10, 408. [Google Scholar] [CrossRef] [PubMed]
- De Jaegher, B.; De Schepper, W.; Verliefde, A.; Nopens, I. A model-based analysis of electrodialysis fouling during pulsed electric field operation. J. Membr. Sci. 2022, 642, 119975. [Google Scholar] [CrossRef]
- Rybalkina, O.A.; Sharafan, M.V.; Nikonenko, V.V.; Pismenskaya, N.D. Two mechanisms of H+/OH− ion generation in anion-exchange membrane systems with polybasic acid salt solutions. J. Membr. Sci. 2022, 651, 120449. [Google Scholar] [CrossRef]
- Kimani, E.M.; Pranić, M.; Porada, S.; Kemperman, A.J.B.; Ryzhkov, I.I.; van der Meer, W.G.J.; Biesheuvel, P.M. The influence of feedwater pH on membrane charge ionization and ion rejection by reverse osmosis: An experimental and theoretical study. J. Membr. Sci. 2022, 660, 120800. [Google Scholar] [CrossRef]
- Zhang, L.; Biesheuvel, P.M.; Ryzhkov, I.I. Theory of Ion and Water Transport in Electron-Conducting Membrane Pores with p H-Dependent Chemical Charge. Phys. Rev. Appl. 2019, 12, 014039. [Google Scholar] [CrossRef] [Green Version]
- Chen, G. Donnan equilibrium revisited: Coupling between ion concentrations, osmotic pressure, and donnan potential. J. Micromech. Mol. Phys. 2022, 07, 127–134. [Google Scholar] [CrossRef]
- Robinson, R.A.; Stokes, R.H. Electrolyte Solutions, 2nd ed.; Butterworths: London, UK, 2002; ISBN 0-486-42225-9. [Google Scholar]
- Miller, D.G. Application of Irreversible Thermodynamics to Electrolyte Solutions. I. Determination of Ionic Transport Coefficients l ij for Isothermal Vector Transport Processes in Binary Electrolyte Systems 1,2. J. Phys. Chem. 1966, 70, 2639–2659. [Google Scholar] [CrossRef]
- Münchinger, A.; Kreuer, K.-D. Selective ion transport through hydrated cation and anion exchange membranes I. The effect of specific interactions. J. Membr. Sci. 2019, 592, 117372. [Google Scholar] [CrossRef]
- Tran, T.; Lin, C.; Chaurasia, S.; Lin, H. Elucidating the relationship between states of water and ion transport properties in hydrated polymers. J. Membr. Sci. 2019, 574, 299–308. [Google Scholar] [CrossRef]
- Kamcev, J.; Galizia, M.; Benedetti, F.M.; Jang, E.-S.; Paul, D.R.; Freeman, B.D.; Manning, G.S. Partitioning of mobile ions between ion exchange polymers and aqueous salt solutions: Importance of counter-ion condensation. Phys. Chem. Chem. Phys. 2016, 18, 6021–6031. [Google Scholar] [CrossRef] [PubMed]
- Manning, G.S. Limiting Laws and Counterion Condensation in Polyelectrolyte Solutions I. Colligative Properties. J. Chem. Phys. 1969, 51, 924–933. [Google Scholar] [CrossRef]
- Manning, G.S. Polyelectrolytes. Annu. Rev. Phys. Chem. 1972, 23, 117–140. [Google Scholar] [CrossRef]
- Bockris, J.O.; Reddy, A.K.N. Modern Electrochemistry, 2nd ed.; Springer: Berlin/Heidelberg, Germany, 1998; ISBN 0306455552. [Google Scholar]
- Kitto, D.; Kamcev, J. Manning condensation in ion exchange membranes: A review on ion partitioning and diffusion models. J. Polym. Sci. 2022, 60, 2929–2973. [Google Scholar] [CrossRef]
- Kamcev, J.; Paul, D.R.; Freeman, B.D. Ion Activity Coefficients in Ion Exchange Polymers: Applicability of Manning’s Counterion Condensation Theory. Macromolecules 2015, 48, 8011–8024. [Google Scholar] [CrossRef]
- Jang, E.-S.; Kamcev, J.; Kobayashi, K.; Yan, N.; Sujanani, R.; Talley, S.J.; Moore, R.B.; Paul, D.R.; Freeman, B.D. Effect of Water Content on Sodium Chloride Sorption in Cross-Linked Cation Exchange Membranes. Macromolecules 2019, 52, 2569–2579. [Google Scholar] [CrossRef]
- Yu, Y.; Yan, N.; Freeman, B.D.; Chen, C. Mobile ion partitioning in ion exchange membranes immersed in saline solutions. J. Membr. Sci. 2021, 620, 118760. [Google Scholar] [CrossRef]
- Yan, N.; Paul, D.R.; Freeman, B.D. Water and ion sorption in a series of cross-linked AMPS/PEGDA hydrogel membranes. Polymer 2018, 146, 196–208. [Google Scholar] [CrossRef]
- Ji, Y.; Luo, H.; Geise, G.M. Specific co-ion sorption and diffusion properties influence membrane permselectivity. J. Membr. Sci. 2018, 563, 492–504. [Google Scholar] [CrossRef]
- Chang, K.; Luo, H.; Geise, G.M. Water content, relative permittivity, and ion sorption properties of polymers for membrane desalination. J. Membr. Sci. 2019, 574, 24–32. [Google Scholar] [CrossRef]
- Chang, K.; Luo, H.; Bannon, S.M.; Lin, S.Y.; Agata, W.-A.S.; Geise, G.M. Methoxy groups increase water and decrease salt permeability properties of sulfonated polysulfone desalination membranes. J. Membr. Sci. 2021, 630, 119298. [Google Scholar] [CrossRef]
- Galizia, M.; Paul, D.R.; Freeman, B.D. Co-ion specific effect on sodium halides sorption and transport in a cross-linked poly(p-styrene sulfonate-co-divinylbenzene) for membrane applications. J. Membr. Sci. 2020, 612, 118410. [Google Scholar] [CrossRef]
- Galizia, M.; Manning, G.S.; Paul, D.R.; Freeman, B.D. Ion partitioning between brines and ion exchange polymers. Polymer 2019, 165, 91–100. [Google Scholar] [CrossRef]
- Chen, G.Q.; Wei, K.; Hassanvand, A.; Freeman, B.D.; Kentish, S.E. Single and binary ion sorption equilibria of monovalent and divalent ions in commercial ion exchange membranes. Water Res. 2020, 175, 115681. [Google Scholar] [CrossRef]
- Kingsbury, R.S.; Zhu, S.; Flotron, S.; Coronell, O. Microstructure Determines Water and Salt Permeation in Commercial Ion-Exchange Membranes. ACS Appl. Mater. Interfaces 2018, 10, 39745–39756. [Google Scholar] [CrossRef]
- Wang, Q.; Chen, G.Q.; Kentish, S.E. Sorption and diffusion of organic acid ions in anion exchange membranes: Acetate and lactate ions as a case study. J. Membr. Sci. 2020, 614, 118534. [Google Scholar] [CrossRef]
- Kusoglu, A.; Weber, A.Z. New Insights into Perfluorinated Sulfonic-Acid Ionomers. Chem. Rev. 2017, 117, 987–1104. [Google Scholar] [CrossRef]
- Sujanani, R.; Katz, L.E.; Paul, D.R.; Freeman, B.D. Aqueous ion partitioning in Nafion: Applicability of Manning’s counter-ion condensation theory. J. Membr. Sci. 2021, 638, 119687. [Google Scholar] [CrossRef]
- Ramos-Garcés, M.V.; Li, K.; Lei, Q.; Bhattacharya, D.; Kole, S.; Zhang, Q.; Strzalka, J.; Angelopoulou, P.P.; Sakellariou, G.; Kumar, R.; et al. Understanding the ionic activity and conductivity value differences between random copolymer electrolytes and block copolymer electrolytes of the same chemistry. RSC Adv. 2021, 11, 15078–15084. [Google Scholar] [CrossRef] [PubMed]
- Lei, Q.; Li, K.; Bhattacharya, D.; Xiao, J.; Kole, S.; Zhang, Q.; Strzalka, J.; Lawrence, J.; Kumar, R.; Arges, C.G. Counterion condensation or lack of solvation? Understanding the activity of ions in thin film block copolymer electrolytes. J. Mater. Chem. A 2020, 8, 15962–15975. [Google Scholar] [CrossRef]
- Ritt, C.L.; Werber, J.R.; Wang, M.; Yang, Z.; Zhao, Y.; Kulik, H.J.; Elimelech, M. Ionization behavior of nanoporous polyamide membranes. Proc. Natl. Acad. Sci. USA 2020, 117, 30191–30200. [Google Scholar] [CrossRef]
- Wang, J.; Kingsbury, R.S.; Perry, L.A.; Coronell, O. Partitioning of Alkali Metal Salts and Boric Acid from Aqueous Phase into the Polyamide Active Layers of Reverse Osmosis Membranes. Environ. Sci. Technol. 2017, 51, 2295–2303. [Google Scholar] [CrossRef]
- Chang, K.; Luo, H.; Geise, G.M. Influence of Salt Concentration on Hydrated Polymer Relative Permittivity and State of Water Properties. Macromolecules 2021, 54, 637–646. [Google Scholar] [CrossRef]
- Chang, K.; Geise, G.M. Dielectric Permittivity Properties of Hydrated Polymers: Measurement and Connection to Ion Transport Properties. Ind. Eng. Chem. Res. 2020, 59, 5205–5217. [Google Scholar] [CrossRef]
- Baker, R.W. Membrane Technology and Applications, 3rd ed.; John Wiley and Sons Ltd.: New York, NY, USA, 2012; ISBN 9780470743720. [Google Scholar]
- Yaroshchuk, A.E.; Dukhin, S.S. Phenomenological theory of reverse osmosis in macroscopically homogeneous membranes and its specification for the capillary space-charge model. J. Membr. Sci. 1993, 79, 133–158. [Google Scholar] [CrossRef]
- Choy, T.C. Effective Medium Theory: Principles and Applications; Oxford University Press: Oxford, UK, 2015; ISBN 0198518927. [Google Scholar]
- Teorell, T. An Attempt to Formulate a Quantitative Theory of Membrane Permeability. Proc. Soc. Exp. Biol. Med. 1935, 33, 282–285. [Google Scholar] [CrossRef]
- Meyer, K.H.; Sievers, J.F. La perméabilité des membranes I. Théorie de la perméabilité ionique. Helv. Chim. Acta 1936, 19, 649–664. [Google Scholar] [CrossRef]
- Tanaka, Y. Chapter 4 Theory of Teorell, Meyer and Sievers (TMS Theory). Membr. Sci. Technol. 2007, 12, 59–66. [Google Scholar] [CrossRef]
- Nikonenko, V.; Lebedev, K.; Manzanares, J.A.; Pourcelly, G. Modelling the transport of carbonic acid anions through anion-exchange membranes. Electrochim. Acta 2003, 48, 3639–3650. [Google Scholar] [CrossRef]
- Murphy, W.D.; Manzanares, J.A.; Mafe, S.; Reiss, H. A numerical study of the equilibrium and nonequilibrium diffuse double layer in electrochemical cells. J. Phys. Chem. 1992, 96, 9983–9991. [Google Scholar] [CrossRef]
- Rossi, M.; Wallmersperger, T. Thermodynamically consistent three-dimensional electrochemical model for polymeric membranes. Electrochim. Acta 2018, 283, 1323–1338. [Google Scholar] [CrossRef]
- Titorova, V.D.; Mareev, S.A.; Gorobchenko, A.D.; Gil, V.V.; Nikonenko, V.V.; Sabbatovskii, K.G.; Pismenskaya, N.D. Effect of current-induced coion transfer on the shape of chronopotentiograms of cation-exchange membranes. J. Membr. Sci. 2021, 624, 119036. [Google Scholar] [CrossRef]
- Wang, X.-L.; Tsuru, T.; Nakao, S.-i.; Kimura, S. Electrolyte transport through nanofiltration membranes by the space-charge model and the comparison with Teorell-Meyer-Sievers model. J. Membr. Sci. 1995, 103, 117–133. [Google Scholar] [CrossRef]
- Galama, A.H.; Post, J.W.; Hamelers, H.V.M.; Nikonenko, V.V.; Biesheuvel, P.M. On the Origin of the Membrane Potential Arising Across Densely Charged Ion Exchange Membranes: How Well Does the Teorell-Meyer-Sievers Theory Work? J. Membr. Sci. Res. 2016, 2, 128–140. [Google Scholar] [CrossRef]
- Yan, Z.; Zhu, L.; Li, Y.C.; Wycisk, R.J.; Pintauro, P.N.; Hickner, M.A.; Mallouk, T.E. The balance of electric field and interfacial catalysis in promoting water dissociation in bipolar membranes. Energy Environ. Sci. 2018, 11, 2235–2245. [Google Scholar] [CrossRef]
- Vermaas, D.A.; Wiegman, S.; Nagaki, T.; Smith, W.A. Ion transport mechanisms in bipolar membranes for (photo)electrochemical water splitting. Sustain. Energy Fuels 2018, 2, 2006–2015. [Google Scholar] [CrossRef]
- Strathmann, H.; Krol, J.; Rapp, H.-J.; Eigenberger, G. Limiting current density and water dissociation in bipolar membranes. J. Membr. Sci. 1997, 125, 123–142. [Google Scholar] [CrossRef] [Green Version]
- Wrubel, J.A.; Chen, Y.; Ma, Z.; Deutsch, T.G. Modeling Water Electrolysis in Bipolar Membranes. J. Electrochem. Soc. 2020, 167, 114502. [Google Scholar] [CrossRef]
- Culcasi, A.; Gurreri, L.; Zaffora, A.; Cosenza, A.; Tamburini, A.; Micale, G. On the modelling of an Acid/Base Flow Battery: An innovative electrical energy storage device based on pH and salinity gradients. Appl. Energy 2020, 277, 115576. [Google Scholar] [CrossRef]
- Ortega, A.; Arenas, L.F.; Pijpers, J.J.H.; Vicencio, D.L.; Martínez, J.C.; Rodríguez, F.A.; Rivero, E.P. Modelling water dissociation, acid-base neutralization and ion transport in bipolar membranes for acid-base flow batteries. J. Membr. Sci. 2022, 641, 119899. [Google Scholar] [CrossRef]
- Yan, Z.; Wycisk, R.J.; Metlay, A.S.; Xiao, L.; Yoon, Y.; Pintauro, P.N.; Mallouk, T.E. High-Voltage Aqueous Redox Flow Batteries Enabled by Catalyzed Water Dissociation and Acid–Base Neutralization in Bipolar Membranes. ACS Cent. Sci. 2021, 7, 1028–1035. [Google Scholar] [CrossRef] [PubMed]
- Dykstra, J.E.; Heijne, A.; Puig, S.; Biesheuvel, P. Theory of transport and recovery in microbial electrosynthesis of acetate from CO2. Electrochim. Acta 2021, 379, 138029. [Google Scholar] [CrossRef]
- Bui, J.C.; Corpus, K.R.M.; Bell, A.T.; Weber, A.Z. On the Nature of Field-Enhanced Water Dissociation in Bipolar Membranes. J. Phys. Chem. C 2021, 125, 24974–24987. [Google Scholar] [CrossRef]
- Lin, M.; Digdaya, I.A.; Xiang, C. Modeling the electrochemical behavior and interfacial junction profiles of bipolar membranes at solar flux relevant operating current densities. Sustain. Energy Fuels 2021, 5, 2149–2158. [Google Scholar] [CrossRef]
- Hurwitz, H.D.; Dibiani, R. Experimental and theoretical investigations of steady and transient states in systems of ion exchange bipolar membranes. J. Membr. Sci. 2004, 228, 17–43. [Google Scholar] [CrossRef]
- León, T.; López, J.; Torres, R.; Grau, J.; Jofre, L.; Cortina, J.-L. Describing ion transport and water splitting in an electrodialysis stack with bipolar membranes by a 2-D model: Experimental validation. J. Membr. Sci. 2022, 660, 120835. [Google Scholar] [CrossRef]
- Achoh, A.R.; Zabolotsky, V.I.; Lebedev, K.A.; Sharafan, M.V.; Yaroslavtsev, A.B. Electrochemical Properties and Selectivity of Bilayer Ion-Exchange Membranes in Ternary Solutions of Strong Electrolytes. Membr. Membr. Technol. 2021, 3, 52–71. [Google Scholar] [CrossRef]
- Zabolotsky, V.I.; Achoh, A.R.; Lebedev, K.A.; Melnikov, S.S. Permselectivity of bilayered ion-exchange membranes in ternary electrolyte. J. Membr. Sci. 2020, 608, 118152. [Google Scholar] [CrossRef]
- Melnikova, E.D.; Pismenskaya, N.D.; Bazinet, L.; Mikhaylin, S.; Nikonenko, V.V. Effect of ampholyte nature on current-voltage characteristic of anion-exchange membrane. Electrochim. Acta 2018, 285, 185–191. [Google Scholar] [CrossRef]
- Sarapulova, V.; Nevakshenova, E.; Pismenskaya, N.; Dammak, L.; Nikonenko, V. Unusual concentration dependence of ion-exchange membrane conductivity in ampholyte-containing solutions: Effect of ampholyte nature. J. Membr. Sci. 2015, 479, 28–38. [Google Scholar] [CrossRef]
- Titorova, V.D.; Moroz, I.A.; Mareev, S.A.; Pismenskaya, N.D.; Sabbatovskii, K.G.; Wang, Y.; Xu, T.; Nikonenko, V.V. How bulk and surface properties of sulfonated cation-exchange membranes response to their exposure to electric current during electrodialysis of a Ca2+ containing solution. J. Membr. Sci. 2022, 644, 120149. [Google Scholar] [CrossRef]
- Zhang, W.; Yan, H.; Wang, Q.; Zhao, C. An extended Teorell-Meyer-Sievers theory for membrane potential under non-isothermal conditions. J. Membr. Sci. 2022, 643, 120073. [Google Scholar] [CrossRef]
- Tedesco, M.; Hamelers, H.V.M.; Biesheuvel, P.M.M. Nernst-Planck transport theory for (reverse) electrodialysis: I. Effect of co-ion transport through the membranes. J. Membr. Sci. 2016, 510, 370–381. [Google Scholar] [CrossRef]
- Tedesco, M.; Hamelers, H.V.M.; Biesheuvel, P.M. Nernst-Planck transport theory for (reverse) electrodialysis: II. Effect of water transport through ion-exchange membranes. J. Membr. Sci. 2017, 531, 172–182. [Google Scholar] [CrossRef] [Green Version]
- Gurreri, L.; Filingeri, A.; Ciofalo, M.; Cipollina, A.; Tedesco, M.; Tamburini, A.; Micale, G. Electrodialysis with asymmetrically profiled membranes: Influence of profiles geometry on desalination performance and limiting current phenomena. Desalination 2021, 506, 115001. [Google Scholar] [CrossRef]
- Forrest, T.; Höfler, L.; Bakker, E. Dialysis membranes as liquid junction materials: Simplified model based on the phase boundary potential. J. Electroanal. Chem. 2022, 904, 115886. [Google Scholar] [CrossRef]
- Fíla, V.; Bouzek, K. The Effect of Convection in the External Diffusion Layer on the Results of a Mathematical Model of Multiple Ion Transport across an Ion-Selective Membrane; Springer: Dordrecht, The Netherlands, 2008; Volume 38, pp. 1241–1252. [Google Scholar]
- Fíla, V.; Bouzek, K. A Mathematical Model of Multiple Ion Transport across an Ion-Selective Membrane under Current Load Conditions. J. Appl. Electrochem. 2003, 33, 675–684. [Google Scholar] [CrossRef]
- Sokirko, A.V.; Manzanares, J.A.; Pellicer, J. The Permselectivity of Membrane Systems with an Inhomogeneous Distribution of Fixed Charge Groups. J. Colloid Interface Sci. 1994, 168, 32–39. [Google Scholar] [CrossRef]
- Moya, A.A.; Moleón, J.A. Study of the electrical properties of bi-layer ion-exchange membrane systems. J. Electroanal. Chem. 2010, 647, 53–59. [Google Scholar] [CrossRef]
- Zabolotsky, V.I.; Nikonenko, V.V. Effect of structural membrane inhomogeneity on transport properties. J. Membr. Sci. 1993, 79, 181–198. [Google Scholar] [CrossRef]
- Berezina, N.P.; Gnusin, N.P.; Demina, O.A.; Annikova, L.A. Effect of polyaniline on the current passing through structural fragments of ion-exchange sulfonic-cationite resins and membranes. Russ. J. Electrochem. 2009, 45, 1226–1233. [Google Scholar] [CrossRef]
- Mafé, S.; Manzanares, J.A.; Pellicer, J. On the introduction of the pore wall charge in the space-charge model for microporous membranes. J. Membr. Sci. 1990, 51, 161–168. [Google Scholar] [CrossRef]
- Hsu, W.Y.; Gierke, T.D. Ion transport and clustering in nafion perfluorinated membranes. J. Membr. Sci. 1983, 13, 307–326. [Google Scholar] [CrossRef]
- Filippov, A.N. A Cell Model of an Ion-Exchange Membrane. Capillary-Osmosis and Reverse-Osmosis Coefficients. Colloid J. 2022, 84, 332–343. [Google Scholar] [CrossRef]
- Dubinin, M.M. Surface and Porosity of Adsorbents. Russ. Chem. Rev. 1982, 51, 605–611. [Google Scholar] [CrossRef]
- Gnusin, N.P.; Zabolotsky, V.I.; Nikonenko, V.V.; Meshechkov, A.I. Development of the generalized conductance principle to the description of transfer phenomena in disperse systems under the acting of different forces. Russ. J. Phys. Chem. 1980, 54, 1518–1522. [Google Scholar]
- Gnusin, N.P.; Berezina, N.P.; Kononenko, N.A.; Dyomina, O.A. Transport structural parameters to characterize ion exchange membranes. J. Membr. Sci. 2004, 243, 301–310. [Google Scholar] [CrossRef]
- Porozhnyy, M.; Huguet, P.; Cretin, M.; Safronova, E.; Nikonenko, V. Mathematical modeling of transport properties of proton-exchange membranes containing immobilized nanoparticles. Int. J. Hydrogen Energy 2016, 41, 15605–15614. [Google Scholar] [CrossRef]
- Nichka, V.S.; Mareev, S.A.; Porozhnyy, M.V.; Shkirskaya, S.A.; Safronova, E.Y.; Pismenskaya, N.D.; Nikonenko, V.V. Modified Microheterogeneous Model for Describing Electrical Conductivity of Membranes in Dilute Electrolyte Solutions. Membr. Membr. Technol. 2019, 1, 190–199. [Google Scholar] [CrossRef] [Green Version]
- Kozmai, A.; Pismenskaya, N.; Nikonenko, V. Mathematical Description of the Increase in Selectivity of an Anion-Exchange Membrane Due to Its Modification with a Perfluorosulfonated Ionomer. Int. J. Mol. Sci. 2022, 23, 2238. [Google Scholar] [CrossRef] [PubMed]
- Melnikov, S.; Kolot, D.; Nosova, E.; Zabolotskiy, V. Peculiarities of transport-structural parameters of ion-exchange membranes in solutions containing anions of carboxylic acids. J. Membr. Sci. 2018, 557, 1–12. [Google Scholar] [CrossRef]
- Manohar, M.; Thakur, A.K.; Pandey, R.P.; Shahi, V.K. Efficient and stable anion exchange membrane: Tuned membrane permeability and charge density for molecular/ionic separation. J. Membr. Sci. 2015, 496, 250–258. [Google Scholar] [CrossRef]
- Niftaliev, S.I.; Kozaderova, O.A.; Kim, K.B. Electroconductance of heterogeneous ion-exchange membranes in aqueous salt solutions. J. Electroanal. Chem. 2017, 794, 58–63. [Google Scholar] [CrossRef]
- Sedkaoui, Y.; Szymczyk, A.; Lounici, H.; Arous, O. A new lateral method for characterizing the electrical conductivity of ion-exchange membranes. J. Membr. Sci. 2016, 507, 34–42. [Google Scholar] [CrossRef]
- Tong, X.; Zhang, B.; Fan, Y.; Chen, Y. Mechanism Exploration of Ion Transport in Nanocomposite Cation Exchange Membranes. ACS Appl. Mater. Interfaces 2017, 9, 13491–13499. [Google Scholar] [CrossRef]
- Kudashova, D.S.; Kononenko, N.A.; Brovkina, M.A.; Falina, I.V. A Study of the Degradation of a Perfluorinated Membrane during Operation in a Proton-Exchange Membrane Fuel Cell. Membr. Membr. Technol. 2022, 4, 23–30. [Google Scholar] [CrossRef]
- Falina, I.; Loza, N.; Loza, S.; Titskaya, E.; Romanyuk, N. Permselectivity of Cation Exchange Membranes Modified by Polyaniline. Membranes 2021, 11, 227. [Google Scholar] [CrossRef]
- Salmeron-Sanchez, I.; Asenjo-Pascual, J.; Avilés-Moreno, J.R.; Ocón, P. Microstructural description of ion exchange membranes: The effect of PPy-based modification. J. Membr. Sci. 2022, 659, 120771. [Google Scholar] [CrossRef]
- Pismenskaya, N.D.; Nevakshenova, E.E.; Nikonenko, V.V. Using a Single Set of Structural and Kinetic Parameters of the Microheterogeneous Model to Describe the Sorption and Kinetic Properties of Ion-Exchange Membranes. Pet. Chem. 2018, 58, 465–473. [Google Scholar] [CrossRef]
- Falina, I.V.; Kononenko, N.A.; Demina, O.A.; Titskaya, E.V.; Loza, S.A. Estimation of Ion-Exchange Equilibrium Constant Using Membrane Conductivity Data. Colloid J. 2021, 83, 379–386. [Google Scholar] [CrossRef]
- Golubenko, D.V.; Karavanova, Y.A.; Melnikov, S.S.; Achoh, A.R.; Pourcelly, G.; Yaroslavtsev, A.B. An approach to increase the permselectivity and mono-valent ion selectivity of cation-exchange membranes by introduction of amorphous zirconium phosphate nanoparticles. J. Membr. Sci. 2018, 563, 777–784. [Google Scholar] [CrossRef]
- Le, X.T. Permselectivity and microstructure of anion exchange membranes. J. Colloid Interface Sci. 2008, 325, 215–222. [Google Scholar] [CrossRef] [PubMed]
- Kozmai, A.; Nikonenko, V.; Pismenskaya, N.; Dammak, L.; Baklouti, L.; Yutskevich, Y. Effect of anion exchange membrane capacity loss on pH and electric conductivity of saline solution during neutralization dialysis. J. Membr. Sci. 2020, 595, 117573. [Google Scholar] [CrossRef]
- Sarapulova, V.V.; Titorova, V.D.; Nikonenko, V.V.; Pismenskaya, N.D. Transport Characteristics of Homogeneous and Heterogeneous Ion-Exchange Membranes in Sodium Chloride, Calcium Chloride, and Sodium Sulfate Solutions. Membr. Membr. Technol. 2019, 1, 168–182. [Google Scholar] [CrossRef]
- Perreault, V.; Sarapulova, V.; Tsygurina, K.; Pismenskaya, N.; Bazinet, L. Understanding of Adsorption and Desorption Mechanisms of Anthocyanins and Proanthocyanidins on Heterogeneous and Homogeneous Cation-Exchange Membranes. Membranes 2021, 11, 136. [Google Scholar] [CrossRef]
- Tuan, L.X.; Buess-Herman, C. Study of water content and microheterogeneity of CMS cation exchange membrane. Chem. Phys. Lett. 2007, 434, 49–55. [Google Scholar] [CrossRef]
- Zabolotsky, V.I.; Lebedev, K.A.; Nikonenko, V.V.; Shudrenko, A.A. Identification of a microheterogeneous model for a heterogeneous membrane. Russ. J. Electrochem. 1993, 29, 811–816. [Google Scholar]
- Wyllie, M.R.J.; Southwick, P.F. An Experimental Investigation of the S.P. and Resistivity Phenomena in Dirty Sands. J. Pet. Technol. 1954, 6, 44–57. [Google Scholar] [CrossRef]
- Sauer, M.C.; Southwick, P.F.; Spiegler, K.S.; Wyllie, M.R.J. Electrical Conductance of Porous Plugs—Ion Exchange Resin-Solution Systems. Ind. Eng. Chem. 1955, 47, 2187–2193. [Google Scholar] [CrossRef]
- Spiegler, K.S.; Yoest, R.L.; Wyllie, M.R.J. Electrical potentials across porous plugs and membranes. Ion-exchange resin-solution systems. Discuss. Faraday Soc. 1956, 21, 174–185. [Google Scholar] [CrossRef]
- Narębska, A.; Wódzki, R. Diffusion of electrolytes across inhomogeneous permselective membranes. Die Angew. Makromol. Chem. 1979, 80, 105–118. [Google Scholar] [CrossRef]
- Wódzki, R.; Narebska, A. Composition and structure of cation permselective membranes II. Multilayer electrochemical model. Angew. Makromol. Chem. 1980, 88, 149–163. [Google Scholar] [CrossRef]
- Demina, O.A.; Kononenko, N.A.; Falina, I.V. New approach to the characterization of ion-exchange membranes using a set of model parameters. Pet. Chem. 2014, 54, 515–525. [Google Scholar] [CrossRef]
- Filippov, A.N.; Safronova, E.Y.; Yaroslavtsev, A.B. Theoretical and experimental investigation of diffusion permeability of hybrid MF-4SC membranes with silica nanoparticles. J. Membr. Sci. 2014, 471, 110–117. [Google Scholar] [CrossRef]
- Filippov, A.; Khanukaeva, D.; Afonin, D.; Skorikova, G.; Ivanov, E.; Vinokurov, V.; Lvov, Y. Transport Properties of Novel Hybrid Cation-Exchange Membranes on the Base of MF-4SC and Halloysite Nanotubes. J. Mater. Sci. Chem. Eng. 2015, 03, 58–65. [Google Scholar] [CrossRef] [Green Version]
- Filippov, A.; Afonin, D.; Kononenko, N.; Lvov, Y.; Vinokurov, V. New approach to characterization of hybrid nanocomposites. Colloids Surf. A Physicochem. Eng. Asp. 2017, 521, 251–259. [Google Scholar] [CrossRef]
- Happel, J.; Brenner, H. Low Reynolds Number Hydrodynamics; Springer: Berlin/Heidelberg, Germany, 1973; ISBN 9789024728770. [Google Scholar]
- Deo, S.; Filippov, A.; Tiwari, A.; Vasin, S.; Starov, V. Hydrodynamic permeability of aggregates of porous particles with an impermeable core. Adv. Colloid Interface Sci. 2011, 164, 21–37. [Google Scholar] [CrossRef] [Green Version]
- Filippov, A.N. A Cell Model of an Ion-Exchange Membrane. Hydrodynamic Permeability. Colloid J. 2018, 80, 716–727. [Google Scholar] [CrossRef]
- Vasin, S.I.; Filippov, A.N.; Starov, V.M. Hydrodynamic permeability of membranes built up by particles covered by porous shells: Cell models. Adv. Colloid Interface Sci. 2008, 139, 83–96. [Google Scholar] [CrossRef] [PubMed]
- Filippov, A.N. A Cell Model of the Ion-Exchange Membrane. Electrical Conductivity and Electroosmotic Permeability. Colloid J. 2018, 80, 728–738. [Google Scholar] [CrossRef]
- Brinkman, H.C. A calculation of the viscous force exerted by a flowing fluid on a dense swarm of particles. Flow Turbul. Combust. 1949, 1, 27. [Google Scholar] [CrossRef]
- Filippov, A.N.; Shkirskaya, S.A. Approbation of the Cell Model of a Cation-Exchange Membrane on 1:1 Electrolytes. Membr. Membr. Technol. 2019, 1, 278–285. [Google Scholar] [CrossRef]
- Filippov, A.N.; Kononenko, N.A.; Loza, N.V.; Kopitsyn, D.S.; Petrova, D.A. Modelling of transport properties of perfluorinated one- and bilayer membranes modified by polyaniline decorated clay nanotubes. Electrochim. Acta 2021, 389, 138768. [Google Scholar] [CrossRef]
- Yadav, P.K.; Tiwari, A.; Singh, P. Hydrodynamic permeability of a membrane built up by spheroidal particles covered by porous layer. Acta Mech. 2018, 229, 1869–1892. [Google Scholar] [CrossRef]
- Yadav, P.K.; Deo, S.; Singh, S.P.; Filippov, A. Effect of magnetic field on the hydrodynamic permeability of a membrane built up by porous spherical particles. Colloid J. 2017, 79, 160–171. [Google Scholar] [CrossRef]
- Tang, C.; Yaroshchuk, A.; Bruening, M.L. Flow through negatively charged, nanoporous membranes separates Li+ and K+ due to induced electromigration. Chem. Commun. 2020, 56, 10954–10957. [Google Scholar] [CrossRef]
- Kislyi, A.G.; Butylskii, D.Y.; Mareev, S.A.; Nikonenko, V.V. Model of Competitive Ion Transfer in an Electro-Baromembrane System with Track-Etched Membrane. Membr. Membr. Technol. 2021, 3, 131–138. [Google Scholar] [CrossRef]
- Wijmans, J.G.; Baker, R.W. The solution-diffusion model: A review. J. Membr. Sci. 1995, 107, 1–21. [Google Scholar] [CrossRef]
- García-Morales, V.; Cervera, J.; Manzanares, J.A. Pore entrance effects on the electrical potential distribution in charged porous membranes and ion channels. J. Electroanal. Chem. 2007, 599, 203–208. [Google Scholar] [CrossRef]
- Sparreboom, W.; van den Berg, A.; Eijkel, J.C.T. Principles and applications of nanofluidic transport. Nat. Nanotechnol. 2009, 4, 713–720. [Google Scholar] [CrossRef] [PubMed]
- Bazant, M.Z.; Squires, T.M. Induced-charge electrokinetic phenomena. Curr. Opin. Colloid Interface Sci. 2010, 15, 203–213. [Google Scholar] [CrossRef] [Green Version]
- Yaroshchuk, A.; Boiko, Y.; Makovetskiy, A. Ion-Rejection, Electrokinetic and Electrochemical Properties of a Nanoporous Track-Etched Membrane and Their Interpretation by Means of Space Charge Model. Langmuir 2009, 25, 9605–9614. [Google Scholar] [CrossRef] [PubMed]
- Szymczyk, A.; Zhu, H.; Balannec, B. Ion Rejection Properties of Nanopores with Bipolar Fixed Charge Distributions. J. Phys. Chem. B 2010, 114, 10143–10150. [Google Scholar] [CrossRef] [PubMed]
- Peters, P.B.; van Roij, R.; Bazant, M.Z.; Biesheuvel, P.M. Analysis of electrolyte transport through charged nanopores. Phys. Rev. E 2016, 93, 053108. [Google Scholar] [CrossRef] [Green Version]
- Moya, A.A.; Nikonenko, V.V. A comparative theoretical study of potential distribution and conductivity in cation- and anion-exchange nanoporous membranes filled with ternary electrolytes. Electrochim. Acta 2015, 180, 929–938. [Google Scholar] [CrossRef]
- Ryzhkov, I.I.; Lebedev, D.V.; Solodovnichenko, V.S.; Shiverskiy, A.V.; Simunin, M.M. Induced-Charge Enhancement of the Diffusion Potential in Membranes with Polarizable Nanopores. Phys. Rev. Lett. 2017, 119, 226001. [Google Scholar] [CrossRef] [Green Version]
- Catalano, J.; Hamelers, H.V.M.; Bentien, A.; Biesheuvel, P.M. Revisiting Morrison and Osterle 1965: The efficiency of membrane-based electrokinetic energy conversion. J. Phys. Condens. Matter 2016, 28, 324001. [Google Scholar] [CrossRef]
- Szymczyk, A.; Zhu, H.; Balannec, B. Pressure-Driven Ionic Transport through Nanochannels with Inhomogenous Charge Distributions. Langmuir 2010, 26, 1214–1220. [Google Scholar] [CrossRef] [PubMed]
- Balannec, B.; Ghoufi, A.; Szymczyk, A. Nanofiltration performance of conical and hourglass nanopores. J. Membr. Sci. 2018, 552, 336–340. [Google Scholar] [CrossRef]
- Chen, Y.-T.; Hsu, J.-P. Pressure-driven power generation and ion separation using a non-uniformly charged nanopore. J. Colloid Interface Sci. 2022, 607, 1120–1130. [Google Scholar] [CrossRef] [PubMed]
- Liu, Z.; Liu, X.; Wang, Y.; Yang, D.; Li, C. Ion current rectification in asymmetric charged bilayer nanochannels. Electrochim. Acta 2022, 403, 139706. [Google Scholar] [CrossRef]
- Wu, C.-T.; Hsu, J.-P. Electrokinetic behavior of bullet-shaped nanopores modified by functional groups: Influence of finite thickness of modified layer. J. Colloid Interface Sci. 2021, 582, 741–751. [Google Scholar] [CrossRef]
- Han, W.; Chen, X. A review: Applications of ion transport in micro-nanofluidic systems based on ion concentration polarization. J. Chem. Technol. Biotechnol. 2020, 95, 1622–1631. [Google Scholar] [CrossRef]
- Hsu, J.-P.; Su, T.-C.; Lin, C.-Y.; Tseng, S. Power generation from a pH-regulated nanochannel through reverse electrodialysis: Effects of nanochannel shape and non-uniform H+ distribution. Electrochim. Acta 2019, 294, 84–92. [Google Scholar] [CrossRef]
- Ryzhkov, I.I.; Lebedev, D.V.; Solodovnichenko, V.S.; Minakov, A.V.; Simunin, M.M. On the origin of membrane potential in membranes with polarizable nanopores. J. Membr. Sci. 2018, 549, 616–630. [Google Scholar] [CrossRef] [Green Version]
- Ryzhkov, I.I.; Minakov, A.V. Theoretical study of electrolyte transport in nanofiltration membranes with constant surface potential/charge density. J. Membr. Sci. 2016, 520, 515–628. [Google Scholar] [CrossRef] [Green Version]
- Ryzhkov, I.I.; Shchurkina, M.A.; Mikhlina, E.V.; Simunin, M.M.; Nemtsev, I.V. Switchable ionic selectivity of membranes with electrically conductive surface: Theory and experiment. Electrochim. Acta 2021, 375, 137970. [Google Scholar] [CrossRef]
- Ryzhkov, I.I.; Vyatkin, A.S.; Mikhlina, E.V. Modelling of Conductive Nanoporous Membranes with Switchable Ionic Selectivity. Membr. Membr. Technol. 2020, 2, 10–19. [Google Scholar] [CrossRef] [Green Version]
- Bocquet, L.; Charlaix, E. Nanofluidics, from bulk to interfaces. Chem. Soc. Rev. 2010, 39, 1073–1095. [Google Scholar] [CrossRef] [PubMed] [Green Version]
- Guzmán-Garcia, A.G.; Pintauro, P.N.; Verbrugge, M.W.; Hill, R.F. Development of a space-charge transport model for ion-exchange membranes. AIChE J. 1990, 36, 1061–1074. [Google Scholar] [CrossRef]
- Eikerling, M.; Kornyshev, A.A. Proton transfer in a single pore of a polymer electrolyte membrane. J. Electroanal. Chem. 2001, 502, 1–14. [Google Scholar] [CrossRef]
- Biesheuvel, P.M.; Bazant, M.Z. Analysis of ionic conductance of carbon nanotubes. Phys. Rev. E 2016, 94, 050601. [Google Scholar] [CrossRef]
- Zangle, T.A.; Mani, A.; Santiago, J.G. Theory and experiments of concentration polarization and ion focusing at microchannel and nanochannel interfaces. Chem. Soc. Rev. 2010, 39, 1014–1035. [Google Scholar] [CrossRef]
- Melnikov, D.V.; Hulings, Z.K.; Gracheva, M.E. Electro-osmotic flow through nanopores in thin and ultrathin membranes. Phys. Rev. E 2017, 95, 063105. [Google Scholar] [CrossRef] [Green Version]
- Mansouri, A.; Scheuerman, C.; Bhattacharjee, S.; Kwok, D.Y.; Kostiuk, L.W. Transient streaming potential in a finite length microchannel. J. Colloid Interface Sci. 2005, 292, 567–580. [Google Scholar] [CrossRef]
- Yang, Y.; Pintauro, P.N. Multicomponent space-charge transport model for ion-exchange membranes. AIChE J. 2000, 46, 1177–1190. [Google Scholar] [CrossRef]
- Höltzel, A.; Tallarek, U. Ionic conductance of nanopores in microscale analysis systems: Where microfluidics meets nanofluidics. J. Sep. Sci. 2007, 30, 1398–1419. [Google Scholar] [CrossRef]
- Schoch, R.B.; Han, J.; Renaud, P. Transport phenomena in nanofluidics. Rev. Mod. Phys. 2008, 80, 839–883. [Google Scholar] [CrossRef] [Green Version]
- Bazant, M.Z.; Kilic, M.S.; Storey, B.D.; Ajdari, A. Towards an understanding of induced-charge electrokinetics at large applied voltages in concentrated solutions. Adv. Colloid Interface Sci. 2009, 152, 48–88. [Google Scholar] [CrossRef] [PubMed] [Green Version]
- Cwirko, E.H.; Carbonell, R.G. Interpretation of transport coefficients in Nafion using a parallel pore model. J. Membr. Sci. 1992, 67, 227–247. [Google Scholar] [CrossRef]
- Szymczyk, A.; Fievet, P.; Aoubiza, B.; Simon, C.; Pagetti, J. An application of the space charge model to the electrolyte conductivity inside a charged microporous membrane. J. Membr. Sci. 1999, 161, 275–285. [Google Scholar] [CrossRef]
- Narȩbska, A.; Koter, S.; Kujawski, W. Ions and water transport across charged nafion membranes. Irreversible thermodynamics approach. Desalination 1984, 51, 3–17. [Google Scholar] [CrossRef]
- Zhu, Z.; Wang, D.; Tian, Y.; Jiang, L. Ion/Molecule Transportation in Nanopores and Nanochannels: From Critical Principles to Diverse Functions. J. Am. Chem. Soc. 2019, 141, 8658–8669. [Google Scholar] [CrossRef]
- Kurupath, V.P.; Kannam, S.K.; Hartkamp, R.; Sathian, S.P. Highly efficient water desalination through hourglass shaped carbon nanopores. Desalination 2021, 505, 114978. [Google Scholar] [CrossRef]
- Chen, Y.; Liu, Y.; Xu, Y.; Guo, X.; Cao, Y.; Ming, W. Review: Modeling and Simulation of Membrane Electrode Material Structure for Proton Exchange Membrane Fuel Cells. Coatings 2022, 12, 1145. [Google Scholar] [CrossRef]
- Zhao, J.; Li, X.; Shum, C.; McPhee, J. A Review of physics-based and data-driven models for real-time control of polymer electrolyte membrane fuel cells. Energy AI 2021, 6, 100114. [Google Scholar] [CrossRef]
- Zhang, G.; Jiao, K. Multi-phase models for water and thermal management of proton exchange membrane fuel cell: A review. J. Power Source 2018, 391, 120–133. [Google Scholar] [CrossRef]
- Olivier, P.; Bourasseau, C.; Bouamama, P.B. Low-temperature electrolysis system modelling: A review. Renew. Sustain. Energy Rev. 2017, 78, 280–300. [Google Scholar] [CrossRef]
- Jahnke, T.; Futter, G.; Latz, A.; Malkow, T.; Papakonstantinou, G.; Tsotridis, G.; Schott, P.; Gérard, M.; Quinaud, M.; Quiroga, M.; et al. Performance and degradation of Proton Exchange Membrane Fuel Cells: State of the art in modeling from atomistic to system scale. J. Power Sources 2016, 304, 207–233. [Google Scholar] [CrossRef] [Green Version]
- Chen, Q.; Wang, Y.; Yang, F.; Xu, H. Two-dimensional multi-physics modeling of porous transport layer in polymer electrolyte membrane electrolyzer for water splitting. Int. J. Hydrogen Energy 2020, 45, 32984–32994. [Google Scholar] [CrossRef]
- Manso, A.P.; Marzo, F.F.; Barranco, J.; Garikano, X.; Garmendia Mujika, M. Influence of geometric parameters of the flow fields on the performance of a PEM fuel cell. A review. Int. J. Hydrogen Energy 2012, 37, 15256–15287. [Google Scholar] [CrossRef]
- Yang, Z.; Du, Q.; Jia, Z.; Yang, C.; Jiao, K. Effects of operating conditions on water and heat management by a transient multi-dimensional PEMFC system model. Energy 2019, 183, 462–476. [Google Scholar] [CrossRef]
- Zhang, G.; Xie, X.; Xie, B.; Du, Q.; Jiao, K. Large-scale multi-phase simulation of proton exchange membrane fuel cell. Int. J. Heat Mass Transf. 2018, 130, 555–563. [Google Scholar] [CrossRef]
- Zhang, H.; Rahman, M.A.; Mojica, F.; Sui, P.; Chuang, P.A. A comprehensive two-phase proton exchange membrane fuel cell model coupled with anisotropic properties and mechanical deformation of the gas diffusion layer. Electrochim. Acta 2021, 382, 138273. [Google Scholar] [CrossRef]
- Zhao, J.; Li, X. Oxygen transport in polymer electrolyte membrane fuel cells based on measured electrode pore structure and mass transport properties. Energy Convers. Manag. 2019, 186, 570–585. [Google Scholar] [CrossRef]
- Yin, C.; Gao, Y.; Li, T.; Xie, G.; Li, K.; Tang, H. Study of internal multi-parameter distributions of proton exchange membrane fuel cell with segmented cell device and coupled three-dimensional model. Renew. Energy 2020, 147, 650–662. [Google Scholar] [CrossRef]
- Yin, Y.; Wang, X.; Shangguan, X.; Zhang, J.; Qin, Y. Numerical investigation on the characteristics of mass transport and performance of PEMFC with baffle plates installed in the flow channel. Int. J. Hydrogen Energy 2018, 43, 8048–8062. [Google Scholar] [CrossRef]
- Tsukamoto, T.; Aoki, T.; Kanesaka, H.; Taniguchi, T.; Takayama, T.; Motegi, H.; Takayama, R.; Tanaka, S.; Komiyama, K.; Yoneda, M. Three-dimensional numerical simulation of full-scale proton exchange membrane fuel cells at high current densities. J. Power Source 2021, 488, 229412. [Google Scholar] [CrossRef]
- Schiffer, L.; Shirsath, A.V.; Raël, S.; Bonnet, C.; Lapicque, F.; Bessler, W.G. Electrochemical Pressure Impedance Spectroscopy for Polymer Electrolyte Membrane Fuel Cells: A Combined Modeling and Experimental Analysis. J. Electrochem. Soc. 2022, 169, 034503. [Google Scholar] [CrossRef]
- Bagherighajari, F.; Ramiar, A.; Abdollahzadehsangroudi, M.; Páscoa, J.C.; Oliveira, P.J. Numerical simulation of the polymer electrolyte membrane fuel cells with intermediate blocked interdigitated flow fields. Int. J. Energy Res. 2022, 46, 15309–15331. [Google Scholar] [CrossRef]
- Springer, T.E.; Zawodzinski, T.A.; Gottesfeld, S. Polymer Electrolyte Fuel Cell Model. J. Electrochem. Soc. 1991, 138, 2334–2342. [Google Scholar] [CrossRef]
- Weber, A.Z.; Newman, J. Transport in Polymer-Electrolyte Membranes. J. Electrochem. Soc. 2004, 151, A311–A325. [Google Scholar] [CrossRef]
- Zawodzinski, T.A.; Neeman, M.; Sillerud, L.O.; Gottesfeld, S. Determination of water diffusion coefficients in perfluorosulfonate ionomeric membranes. J. Phys. Chem. 1991, 95, 6040–6044. [Google Scholar] [CrossRef]
- Barnoon, P.; Toghraie, D.; Mehmandoust, B.; Fazilati, M.A.; Eftekhari, S.A. Numerical modeling of species transport and functional characteristics of a proton exchange membrane fuel cell using an agglomerate model with a multi-phase model. Energy Rep. 2022, 8, 11343–11362. [Google Scholar] [CrossRef]
- Tian, P.; Liu, X.; Luo, K.; Li, H.; Wang, Y. Deep learning from three-dimensional multiphysics simulation in operational optimization and control of polymer electrolyte membrane fuel cell for maximum power. Appl. Energy 2021, 288, 116632. [Google Scholar] [CrossRef]
- Ortiz-Imedio, R.; Gomez-Coma, L.; Fallanza, M.; Ortiz, A.; Ibañez, R.; Ortiz, I. Comparative performance of Salinity Gradient Power-Reverse Electrodialysis under different operating conditions. Desalination 2019, 457, 8–21. [Google Scholar] [CrossRef]
- Tristán, C.; Pérez, G.; Fallanza, M.; Ortiz, A.; Ibañez, R.; Ortiz, I. A comprehensive study on the effects of operation variables on reverse electrodialysis performance. Desalination 2020, 482, 114389. [Google Scholar] [CrossRef]
- Tedesco, M.; Cipollina, A.; Tamburini, A.; van Baak, W.; Micale, G. Modelling the Reverse ElectroDialysis process with seawater and concentrated brines. Desalin. Water Treat. 2012, 49, 404–424. [Google Scholar] [CrossRef] [Green Version]
- Gurreri, L.; Battaglia, G.; Tamburini, A.; Cipollina, A.; Micale, G.; Ciofalo, M. Multi-physical modelling of reverse electrodialysis. Desalination 2017, 423, 52–64. [Google Scholar] [CrossRef] [Green Version]
- Moya, A.A. Numerical simulation of ionic transport processes through bilayer ion-exchange membranes in reverse electrodialysis stacks. J. Membr. Sci. 2017, 524, 400–408. [Google Scholar] [CrossRef]
- Moya, A.A. A Nernst-Planck analysis on the contributions of the ionic transport in permeable ion-exchange membranes to the open circuit voltage and the membrane resistance in reverse electrodialysis stacks. Electrochim. Acta 2017, 238, 134–141. [Google Scholar] [CrossRef]
- Moya, A.A. Uphill transport in improved reverse electrodialysis by removal of divalent cations in the dilute solution: A Nernst-Planck based study. J. Membr. Sci. 2020, 598, 117784. [Google Scholar] [CrossRef]
- Leveque, M.A. Transmission de chaleur par convection. Les Lois Transm. 1928, 13, 204. [Google Scholar]
- Tedesco, M.; Hamelers, H.V.M.; Biesheuvel, P.M. Nernst-Planck transport theory for (reverse) electrodialysis: III. Optimal membrane thickness for enhanced process performance. J. Membr. Sci. 2018, 565, 480–487. [Google Scholar] [CrossRef] [Green Version]
- La Cerva, M.L.; Di Liberto, M.; Gurreri, L.; Tamburini, A.; Cipollina, A.; Micale, G.; Ciofalo, M. Coupling CFD with a one-dimensional model to predict the performance of reverse electrodialysis stacks. J. Membr. Sci. 2017, 541, 595–610. [Google Scholar] [CrossRef] [Green Version]
- Fan, H.; Yin, N. Elucidating conductivity-permselectivity tradeoffs in electrodialysis and reverse electrodialysis by structure-property analysis of ion-exchange membranes. J. Membr. Sci. 2019, 573, 668–681. [Google Scholar] [CrossRef]
- Mackie, J.S.; Meares, P. The diffusion of electrolytes in a cation-exchange resin membrane I. Theoretical. Proc. R. Soc. London. Ser. A Math. Phys. Sci. 1955, 232, 498–509. [Google Scholar] [CrossRef]
- Jin, D.; Xi, R.; Xu, S.; Wang, P.; Wu, X. Numerical simulation of salinity gradient power generation using reverse electrodialysis. Desalination 2021, 512, 115132. [Google Scholar] [CrossRef]
- Tedesco, M.; Mazzola, P.; Tamburini, A.; Micale, G.; Bogle, I.D.L.; Papapetrou, M.; Cipollina, A. Analysis and simulation of scale-up potentials in reverse electrodialysis. Desalin. Water Treat. 2015, 55, 3391–3403. [Google Scholar] [CrossRef] [Green Version]
- Chen, M.; Mei, Y.; Yu, Y.; Zeng, R.J.; Zhang, F.; Zhou, S.; Tang, C.Y. An internal-integrated RED/ED system for energy-saving seawater desalination: A model study. Energy 2019, 170, 139–148. [Google Scholar] [CrossRef]
- Saleem, M.W.; Jande, Y.A.C.; Kim, W.S. Performance optimization of integrated electrochemical capacitive deionization and reverse electrodialysis model through a series pass desorption process. J. Electroanal. Chem. 2017, 795, 41–50. [Google Scholar] [CrossRef]
- Kim, M.; Kim, S.; Choi, J.; Kim, H.; Jeong, N.; Kwak, R. Numerical analysis of real-scale reverse electrodialysis with microscale structures and electrode segmentation. Chem. Eng. J. 2022, 446, 137357. [Google Scholar] [CrossRef]
- Pawlowski, S.; Geraldes, V.; Crespo, J.G.; Velizarov, S. Computational fluid dynamics (CFD) assisted analysis of profiled membranes performance in reverse electrodialysis. J. Membr. Sci. 2016, 502, 179–190. [Google Scholar] [CrossRef]
- Dong, F.; Jin, D.; Xu, S.; Xu, L.; Wu, X.; Wang, P.; Leng, Q.; Xi, R. Numerical simulation of flow and mass transfer in profiled membrane channels for reverse electrodialysis. Chem. Eng. Res. Des. 2020, 157, 77–91. [Google Scholar] [CrossRef]
- Jalili, Z.; Pharoah, J.; Stokke Burheim, O.; Einarsrud, K. Temperature and Velocity Effects on Mass and Momentum Transport in Spacer-Filled Channels for Reverse Electrodialysis: A Numerical Study. Energies 2018, 11, 2028. [Google Scholar] [CrossRef] [Green Version]
- Moya, A.A. A numerical comparison of optimal load and internal resistances in ion-exchange membrane systems under reverse electrodialysis conditions. Desalination 2016, 392, 25–33. [Google Scholar] [CrossRef]
- He, Z.; Gao, X.; Zhang, Y.; Wang, Y.; Wang, J. Revised spacer design to improve hydrodynamics and anti-fouling behavior in reverse electrodialysis processes. Desalin. Water Treat. 2016, 57, 28176–28186. [Google Scholar] [CrossRef]


Disclaimer/Publisher’s Note: The statements, opinions and data contained in all publications are solely those of the individual author(s) and contributor(s) and not of MDPI and/or the editor(s). MDPI and/or the editor(s) disclaim responsibility for any injury to people or property resulting from any ideas, methods, instructions or products referred to in the content. |
© 2022 by the authors. Licensee MDPI, Basel, Switzerland. This article is an open access article distributed under the terms and conditions of the Creative Commons Attribution (CC BY) license (https://creativecommons.org/licenses/by/4.0/).
Share and Cite
Mareev, S.; Gorobchenko, A.; Ivanov, D.; Anokhin, D.; Nikonenko, V. Ion and Water Transport in Ion-Exchange Membranes for Power Generation Systems: Guidelines for Modeling. Int. J. Mol. Sci. 2023, 24, 34. https://doi.org/10.3390/ijms24010034
Mareev S, Gorobchenko A, Ivanov D, Anokhin D, Nikonenko V. Ion and Water Transport in Ion-Exchange Membranes for Power Generation Systems: Guidelines for Modeling. International Journal of Molecular Sciences. 2023; 24(1):34. https://doi.org/10.3390/ijms24010034
Chicago/Turabian StyleMareev, Semyon, Andrey Gorobchenko, Dimitri Ivanov, Denis Anokhin, and Victor Nikonenko. 2023. "Ion and Water Transport in Ion-Exchange Membranes for Power Generation Systems: Guidelines for Modeling" International Journal of Molecular Sciences 24, no. 1: 34. https://doi.org/10.3390/ijms24010034