
Close Related Drug-Resistance Beijing Isolates of Mycobacterium tuberculosis Reveal a Different Transcriptomic Signature in a Murine Disease Progression Model

 , , , , , and
Abstract
:1. Introduction
2. Results
2.1. Infection of Mice with MTB Beijing Strains
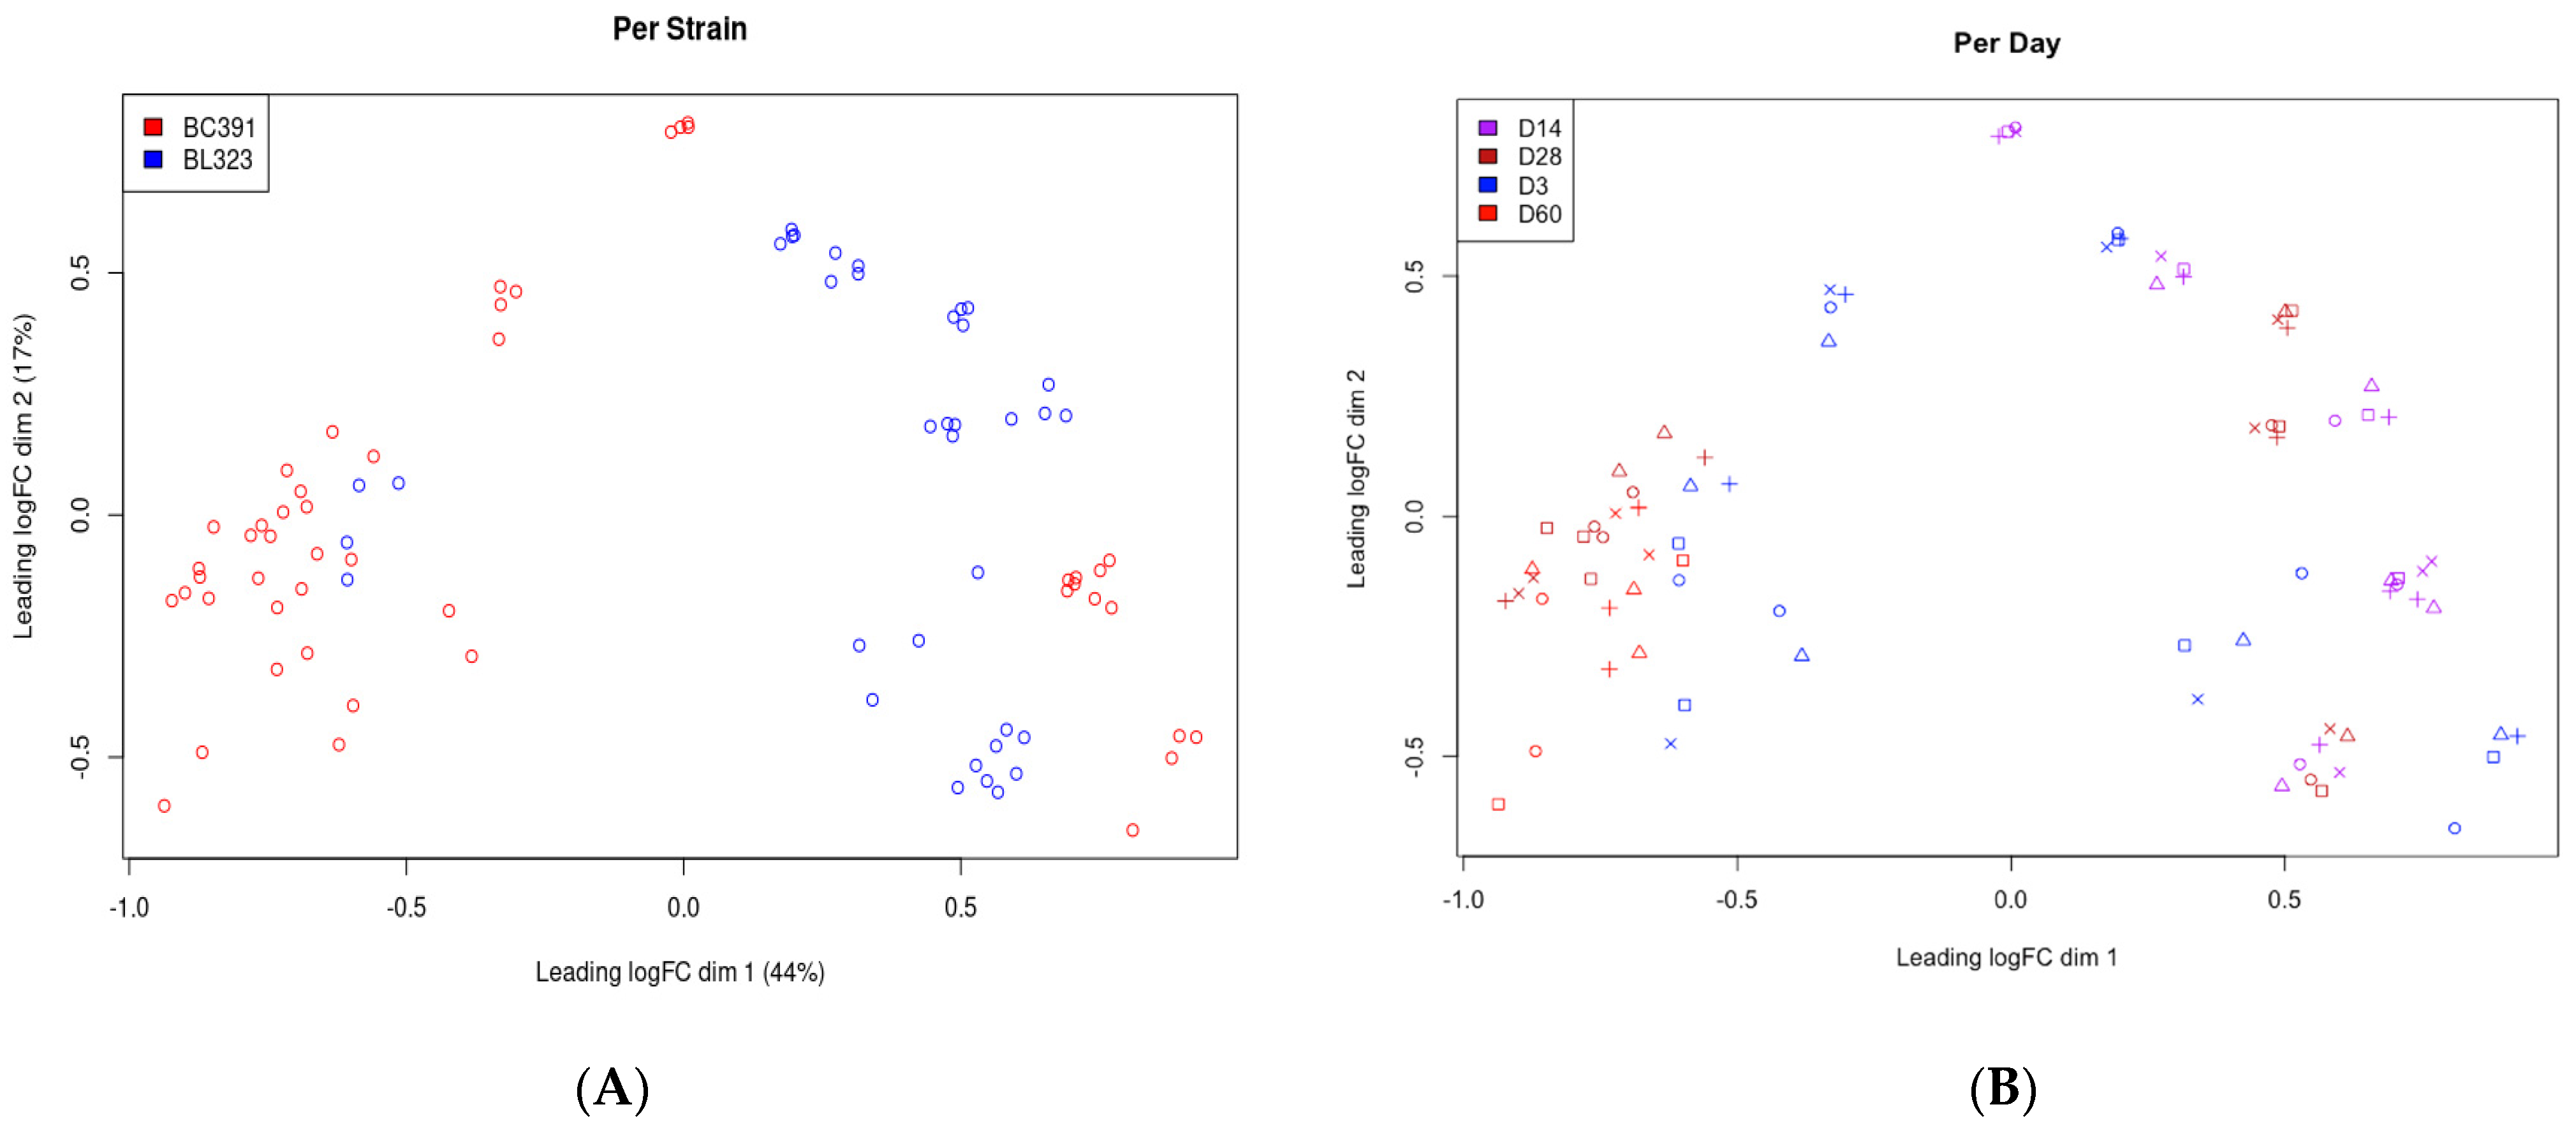
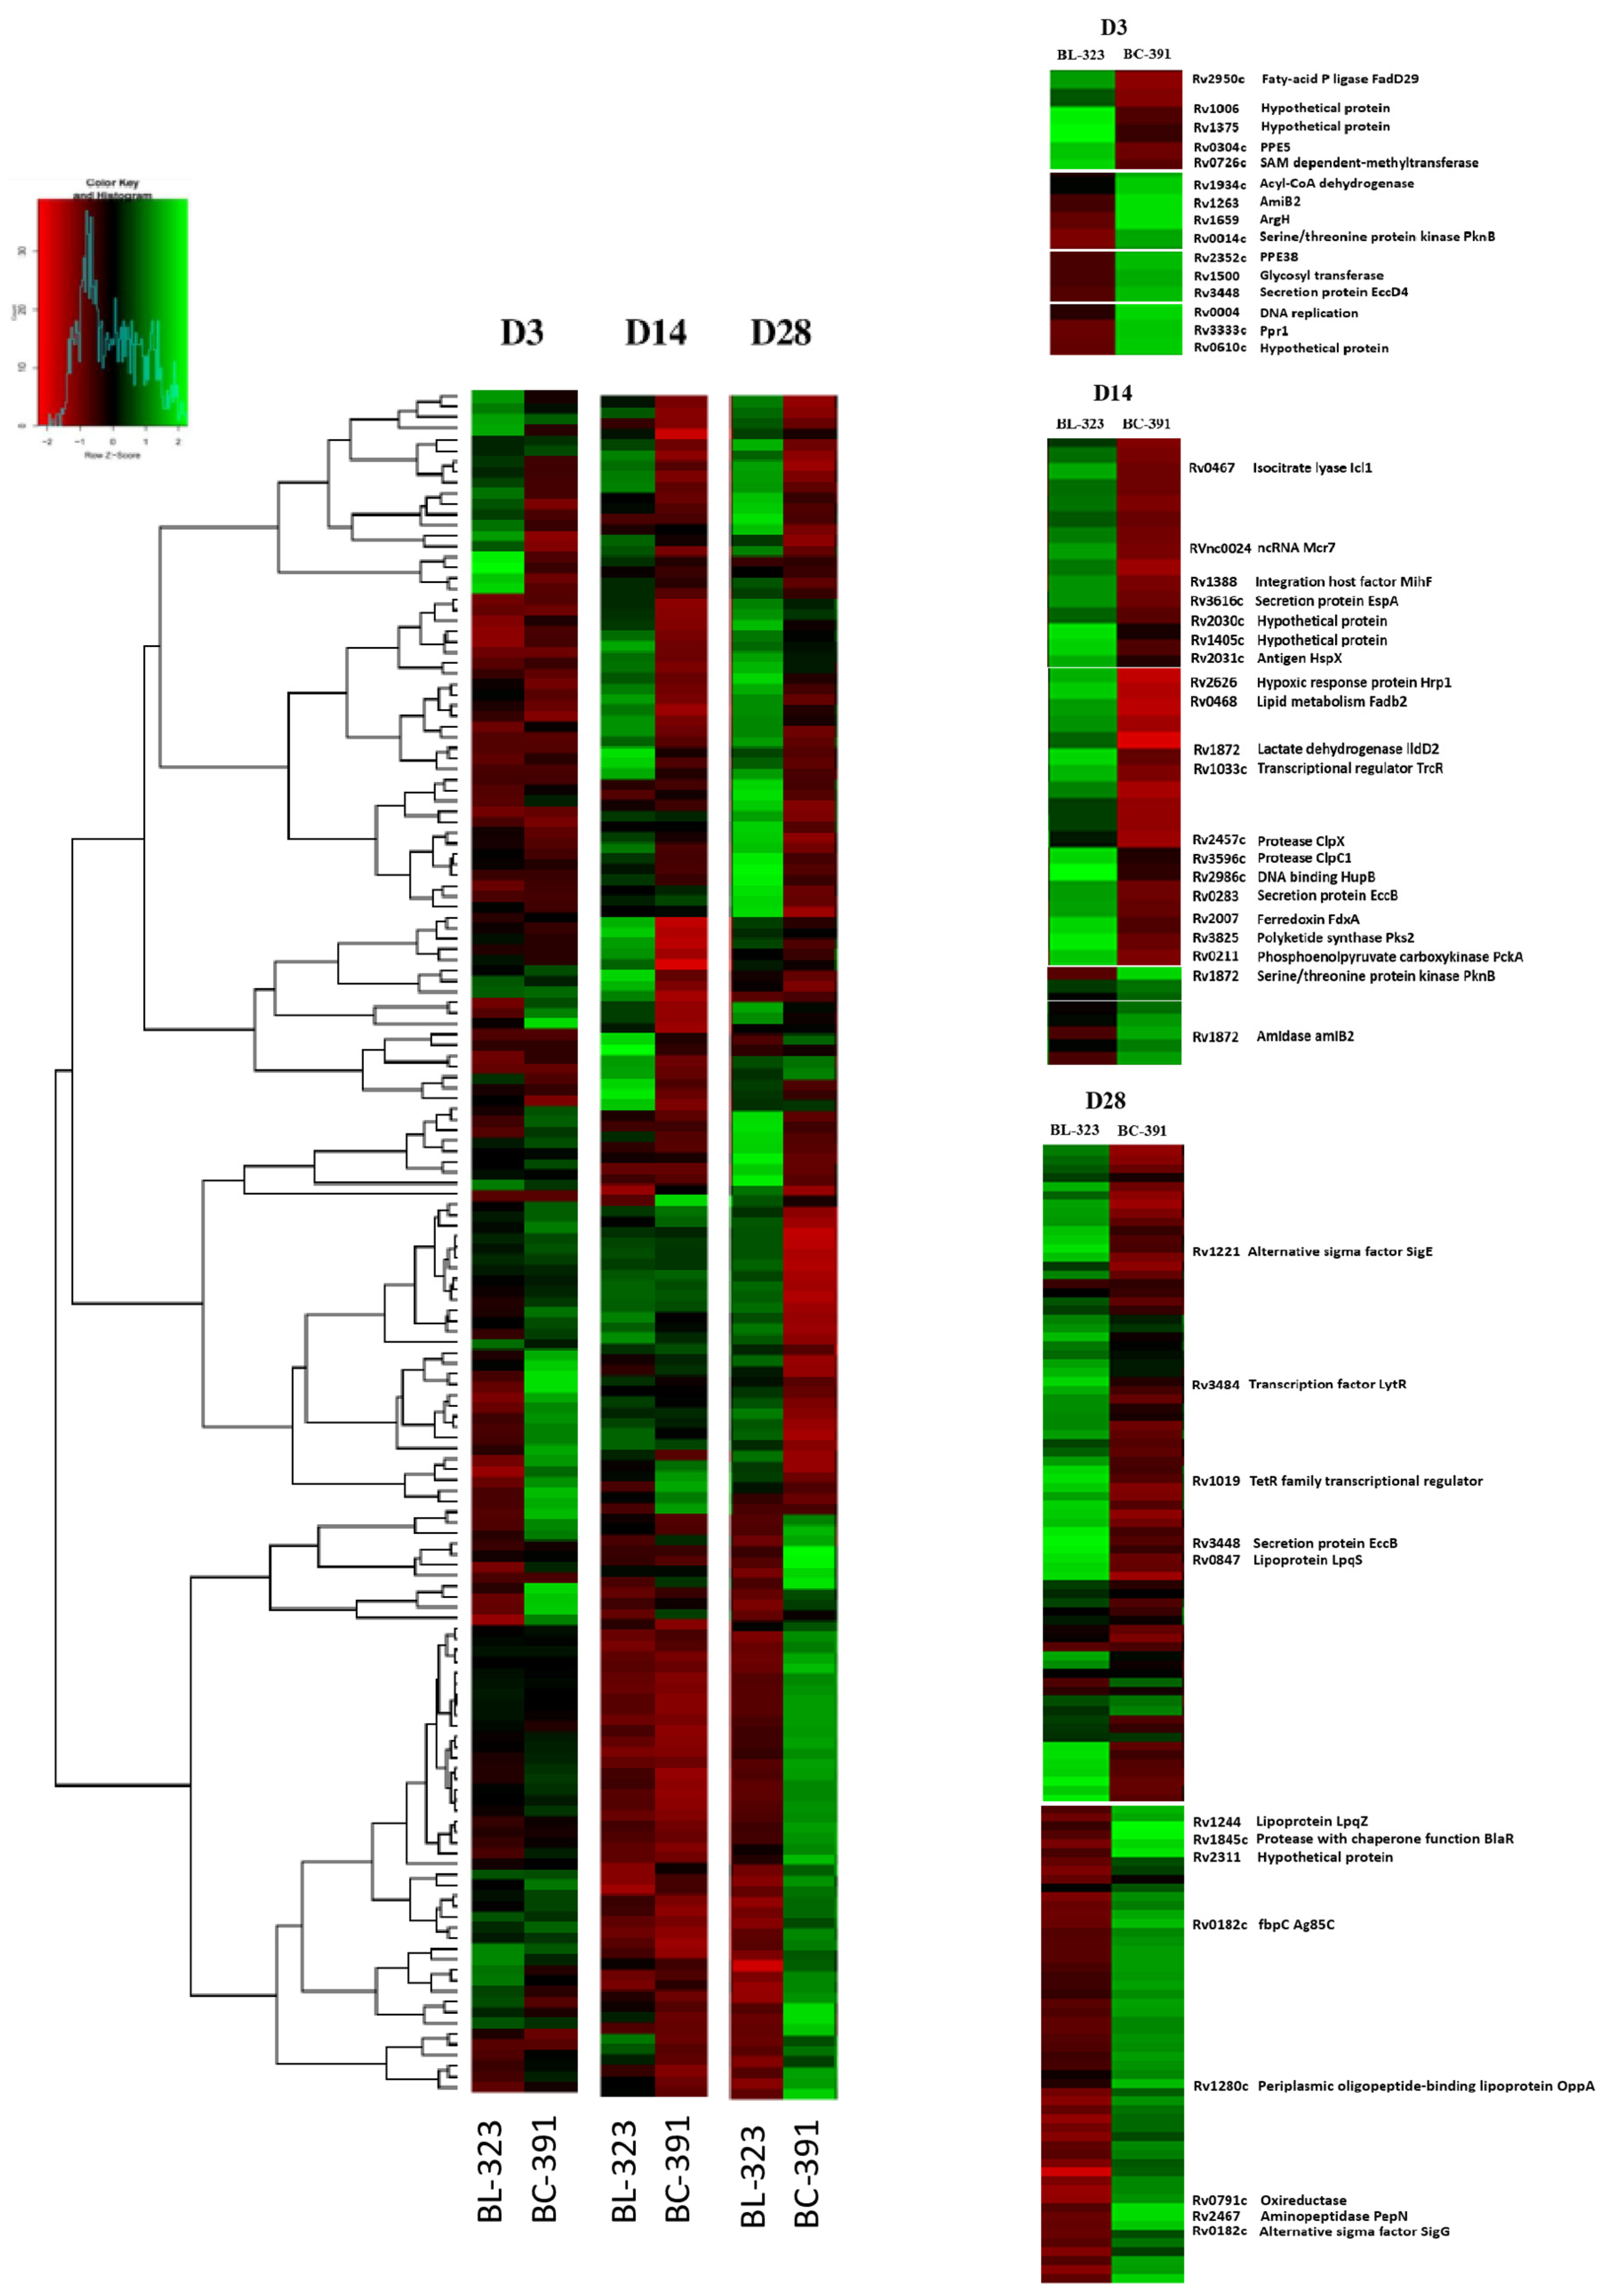
2.2. Global Transcriptomic Analysis
2.3. Differential Expression Analysis
2.4. Intra-Strain Analysis
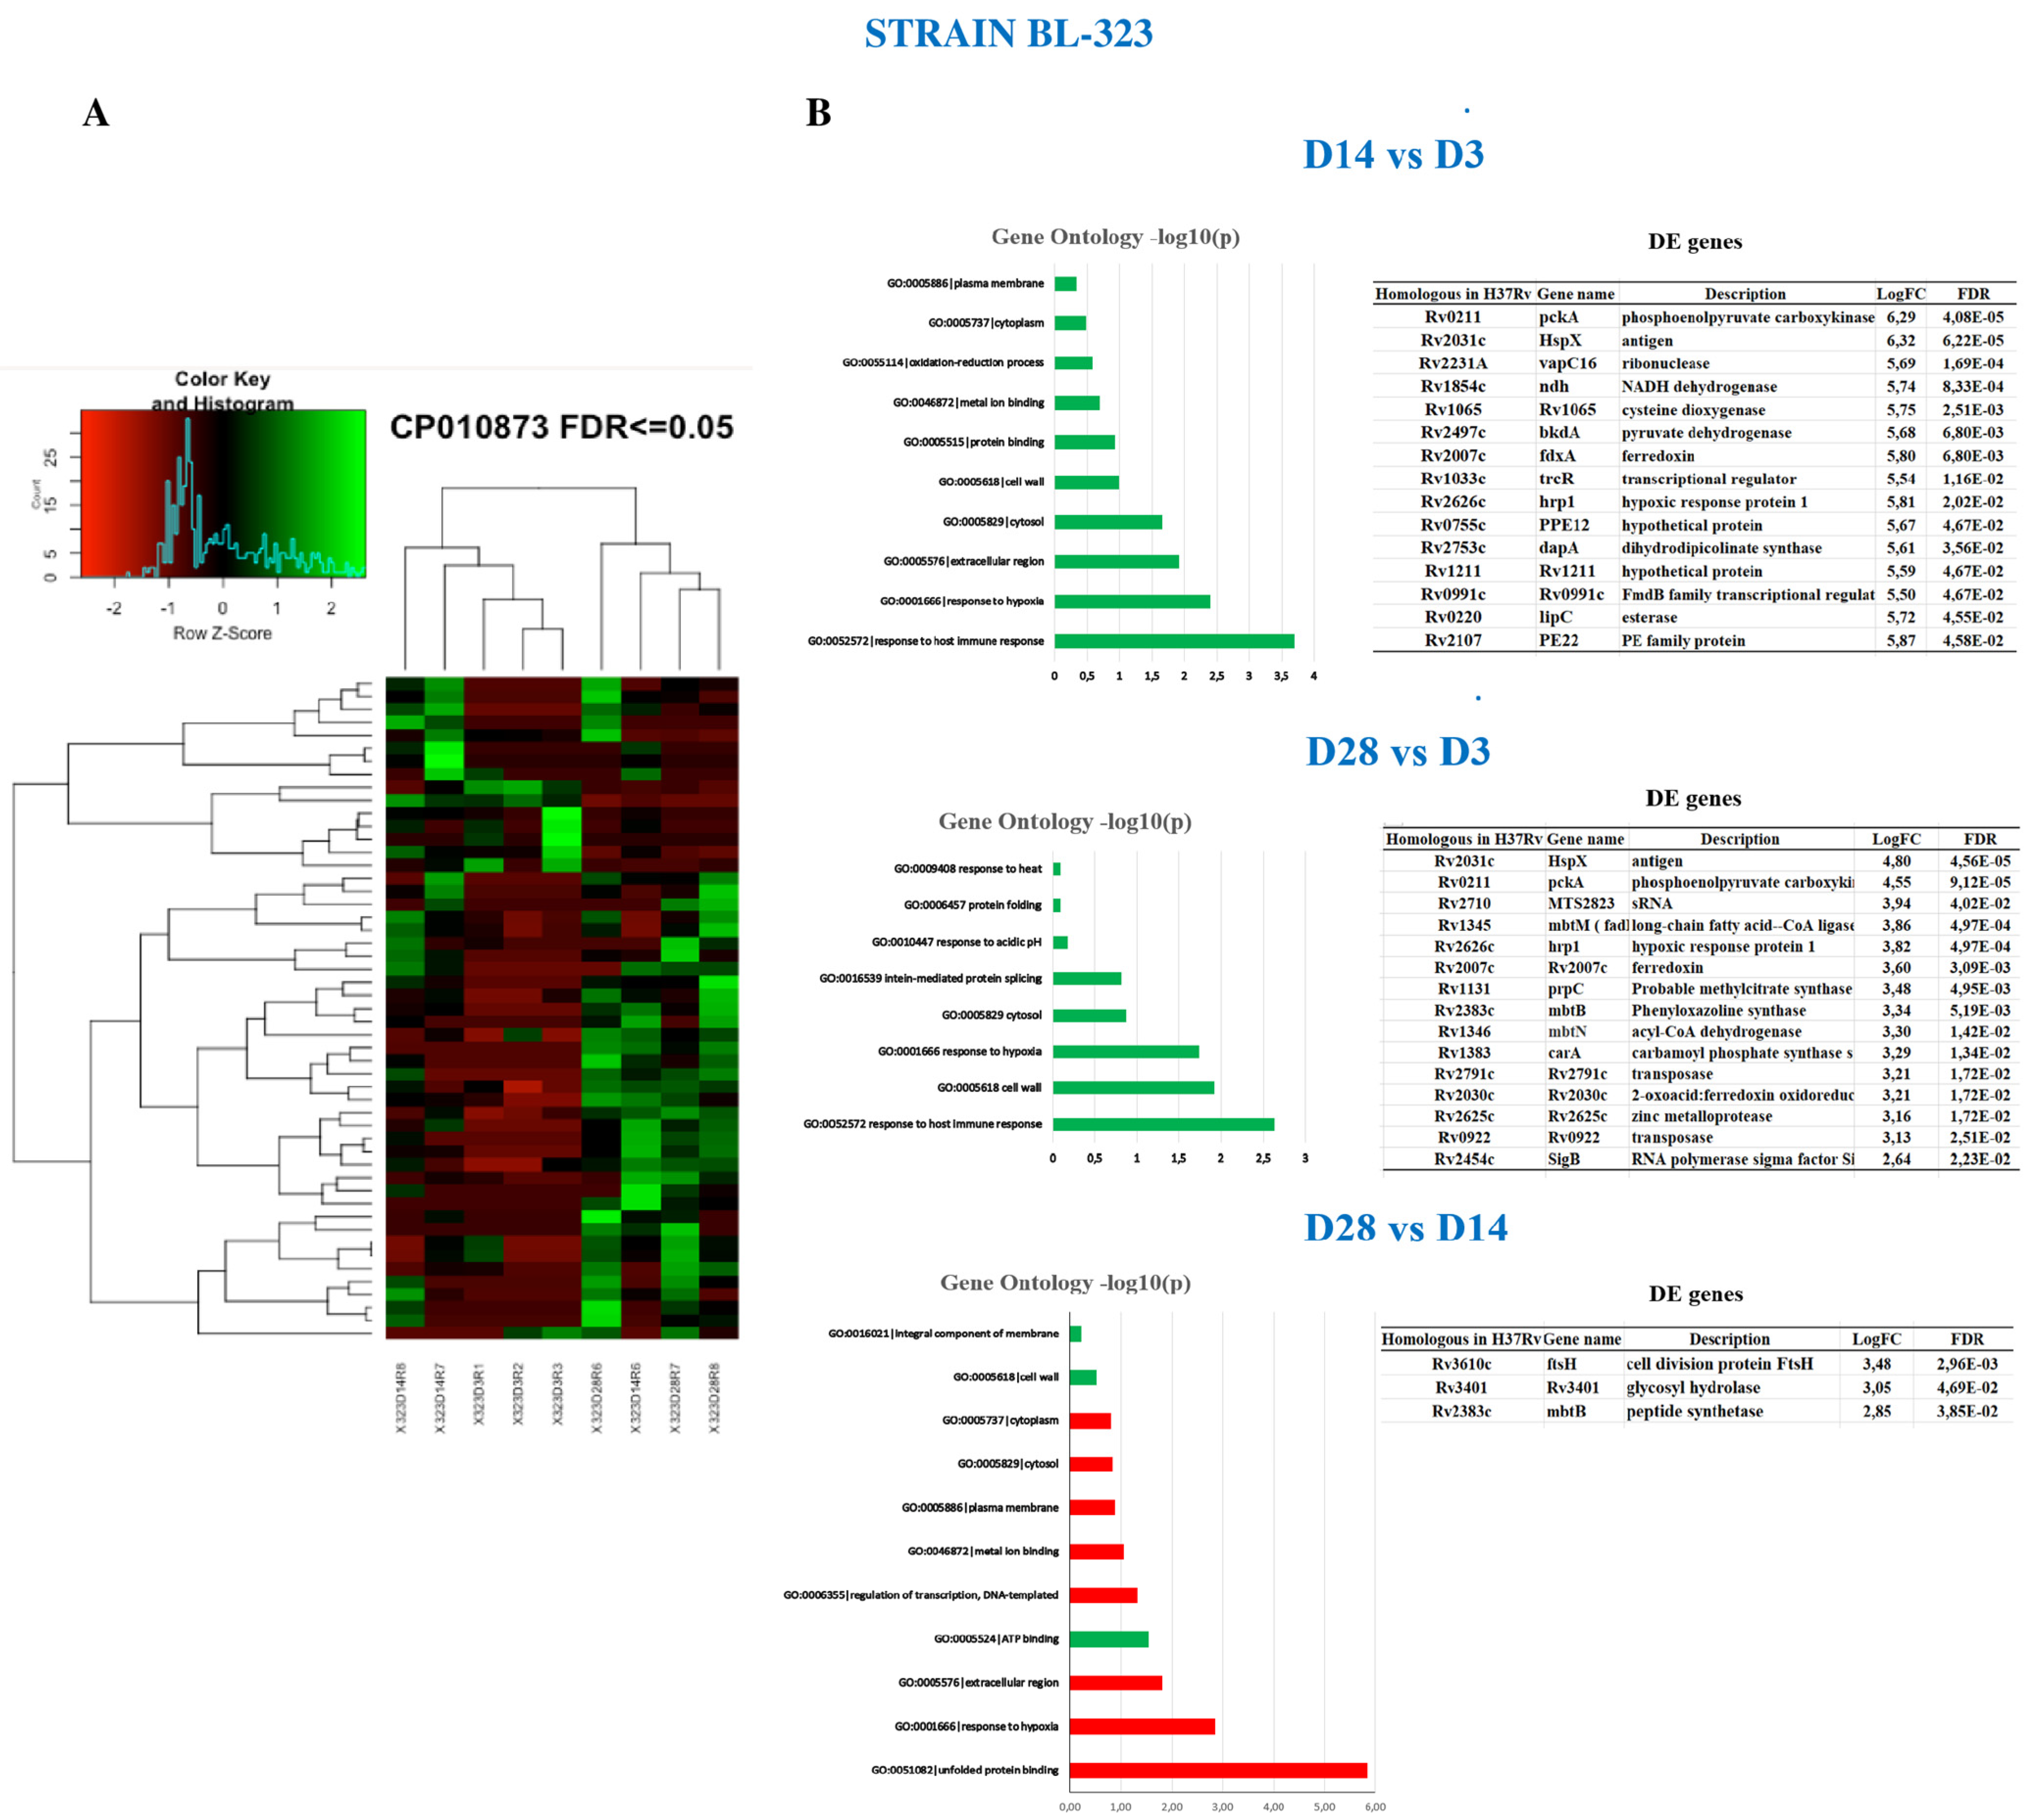
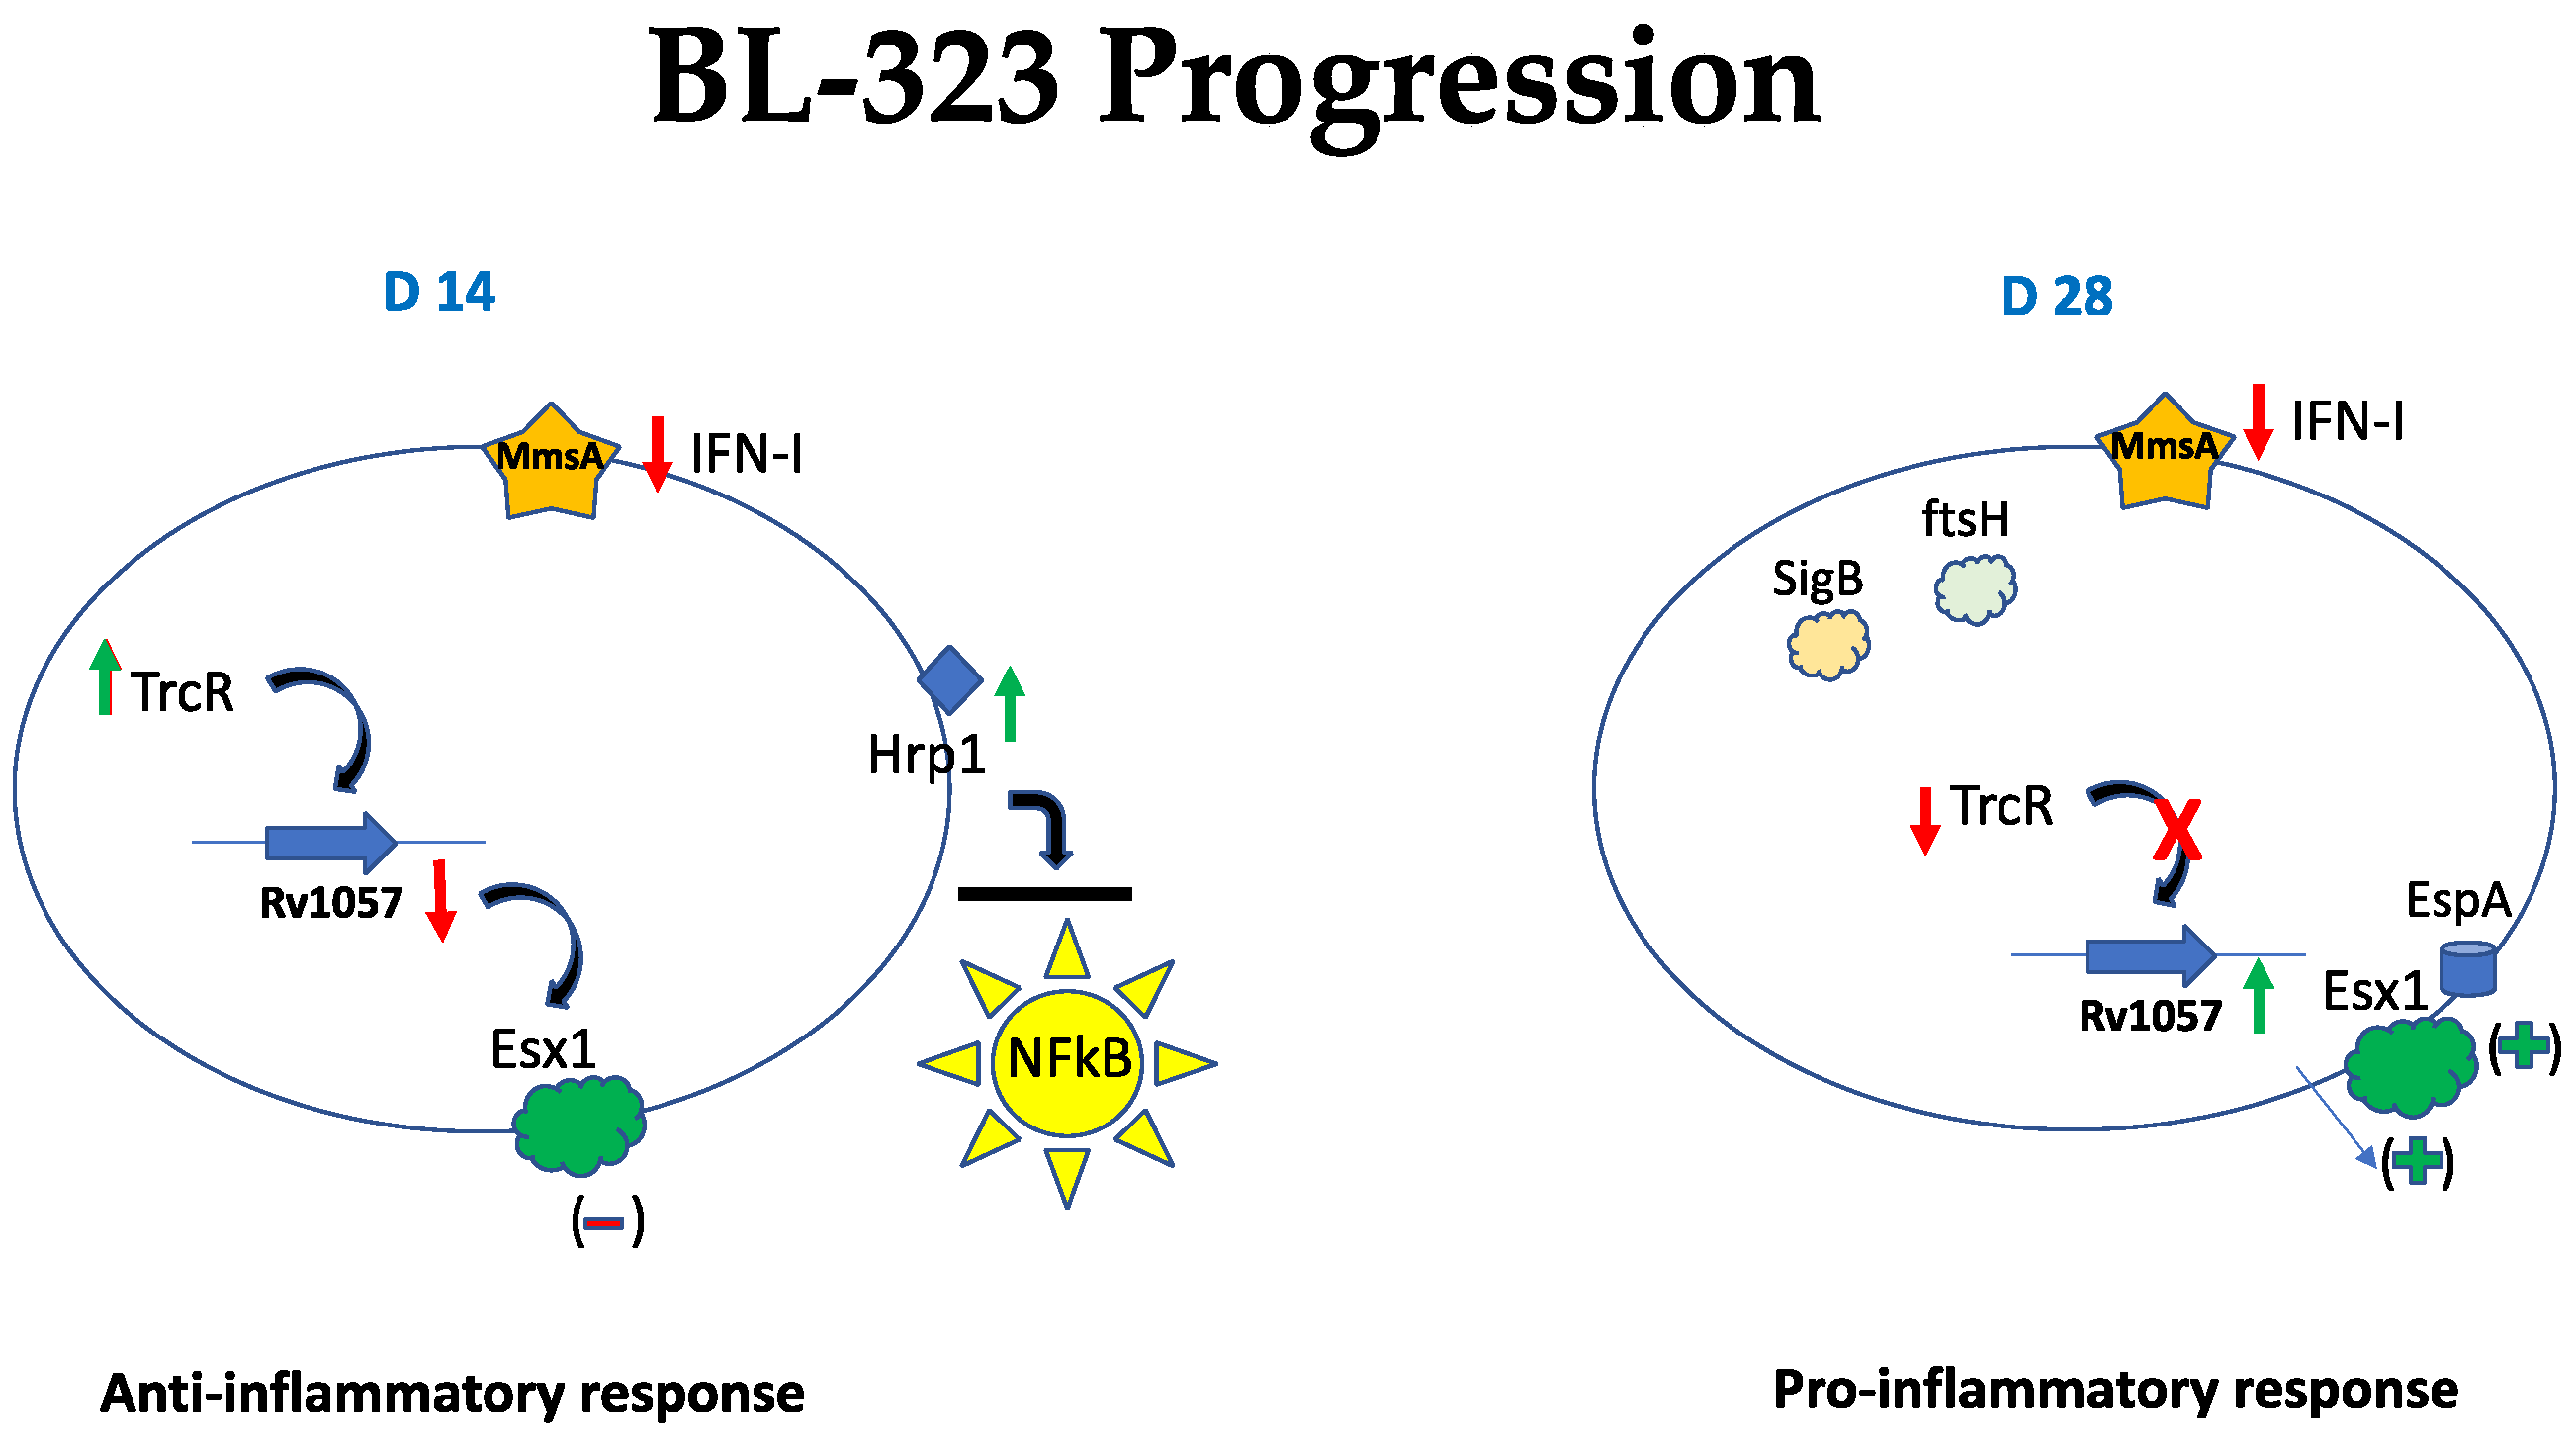
2.5. Strain BL-323
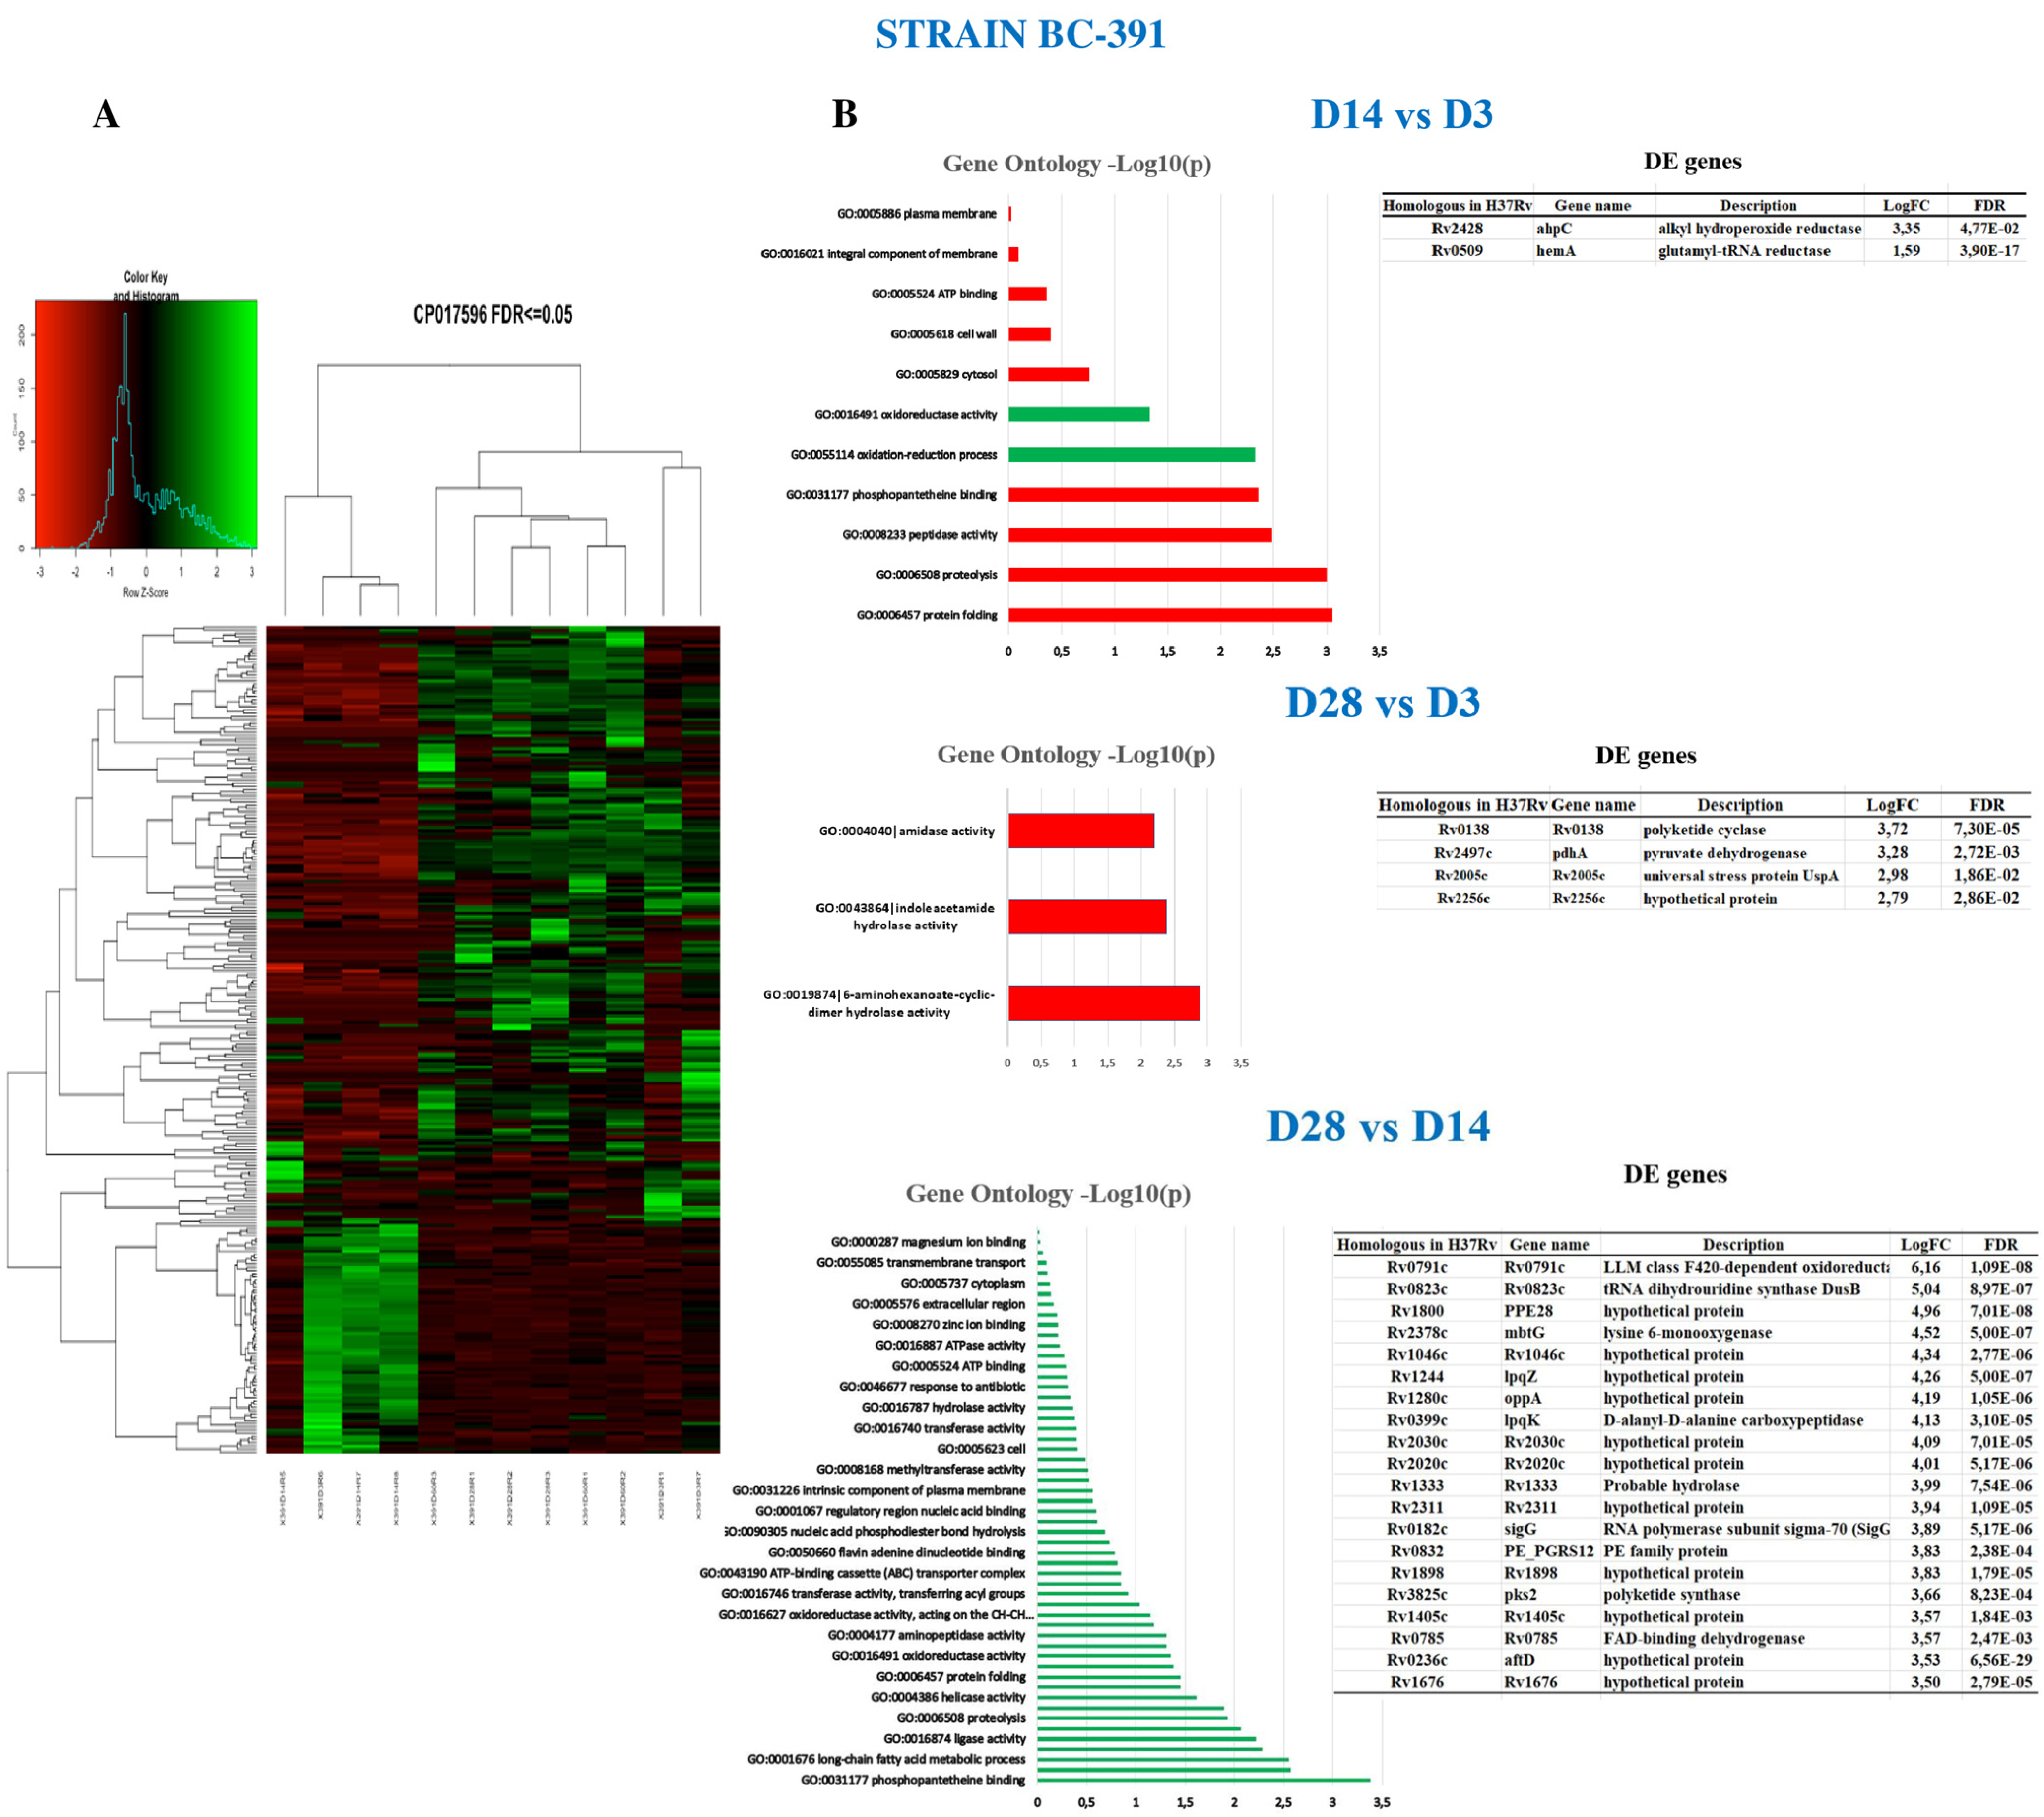
2.6. Strain BC-391
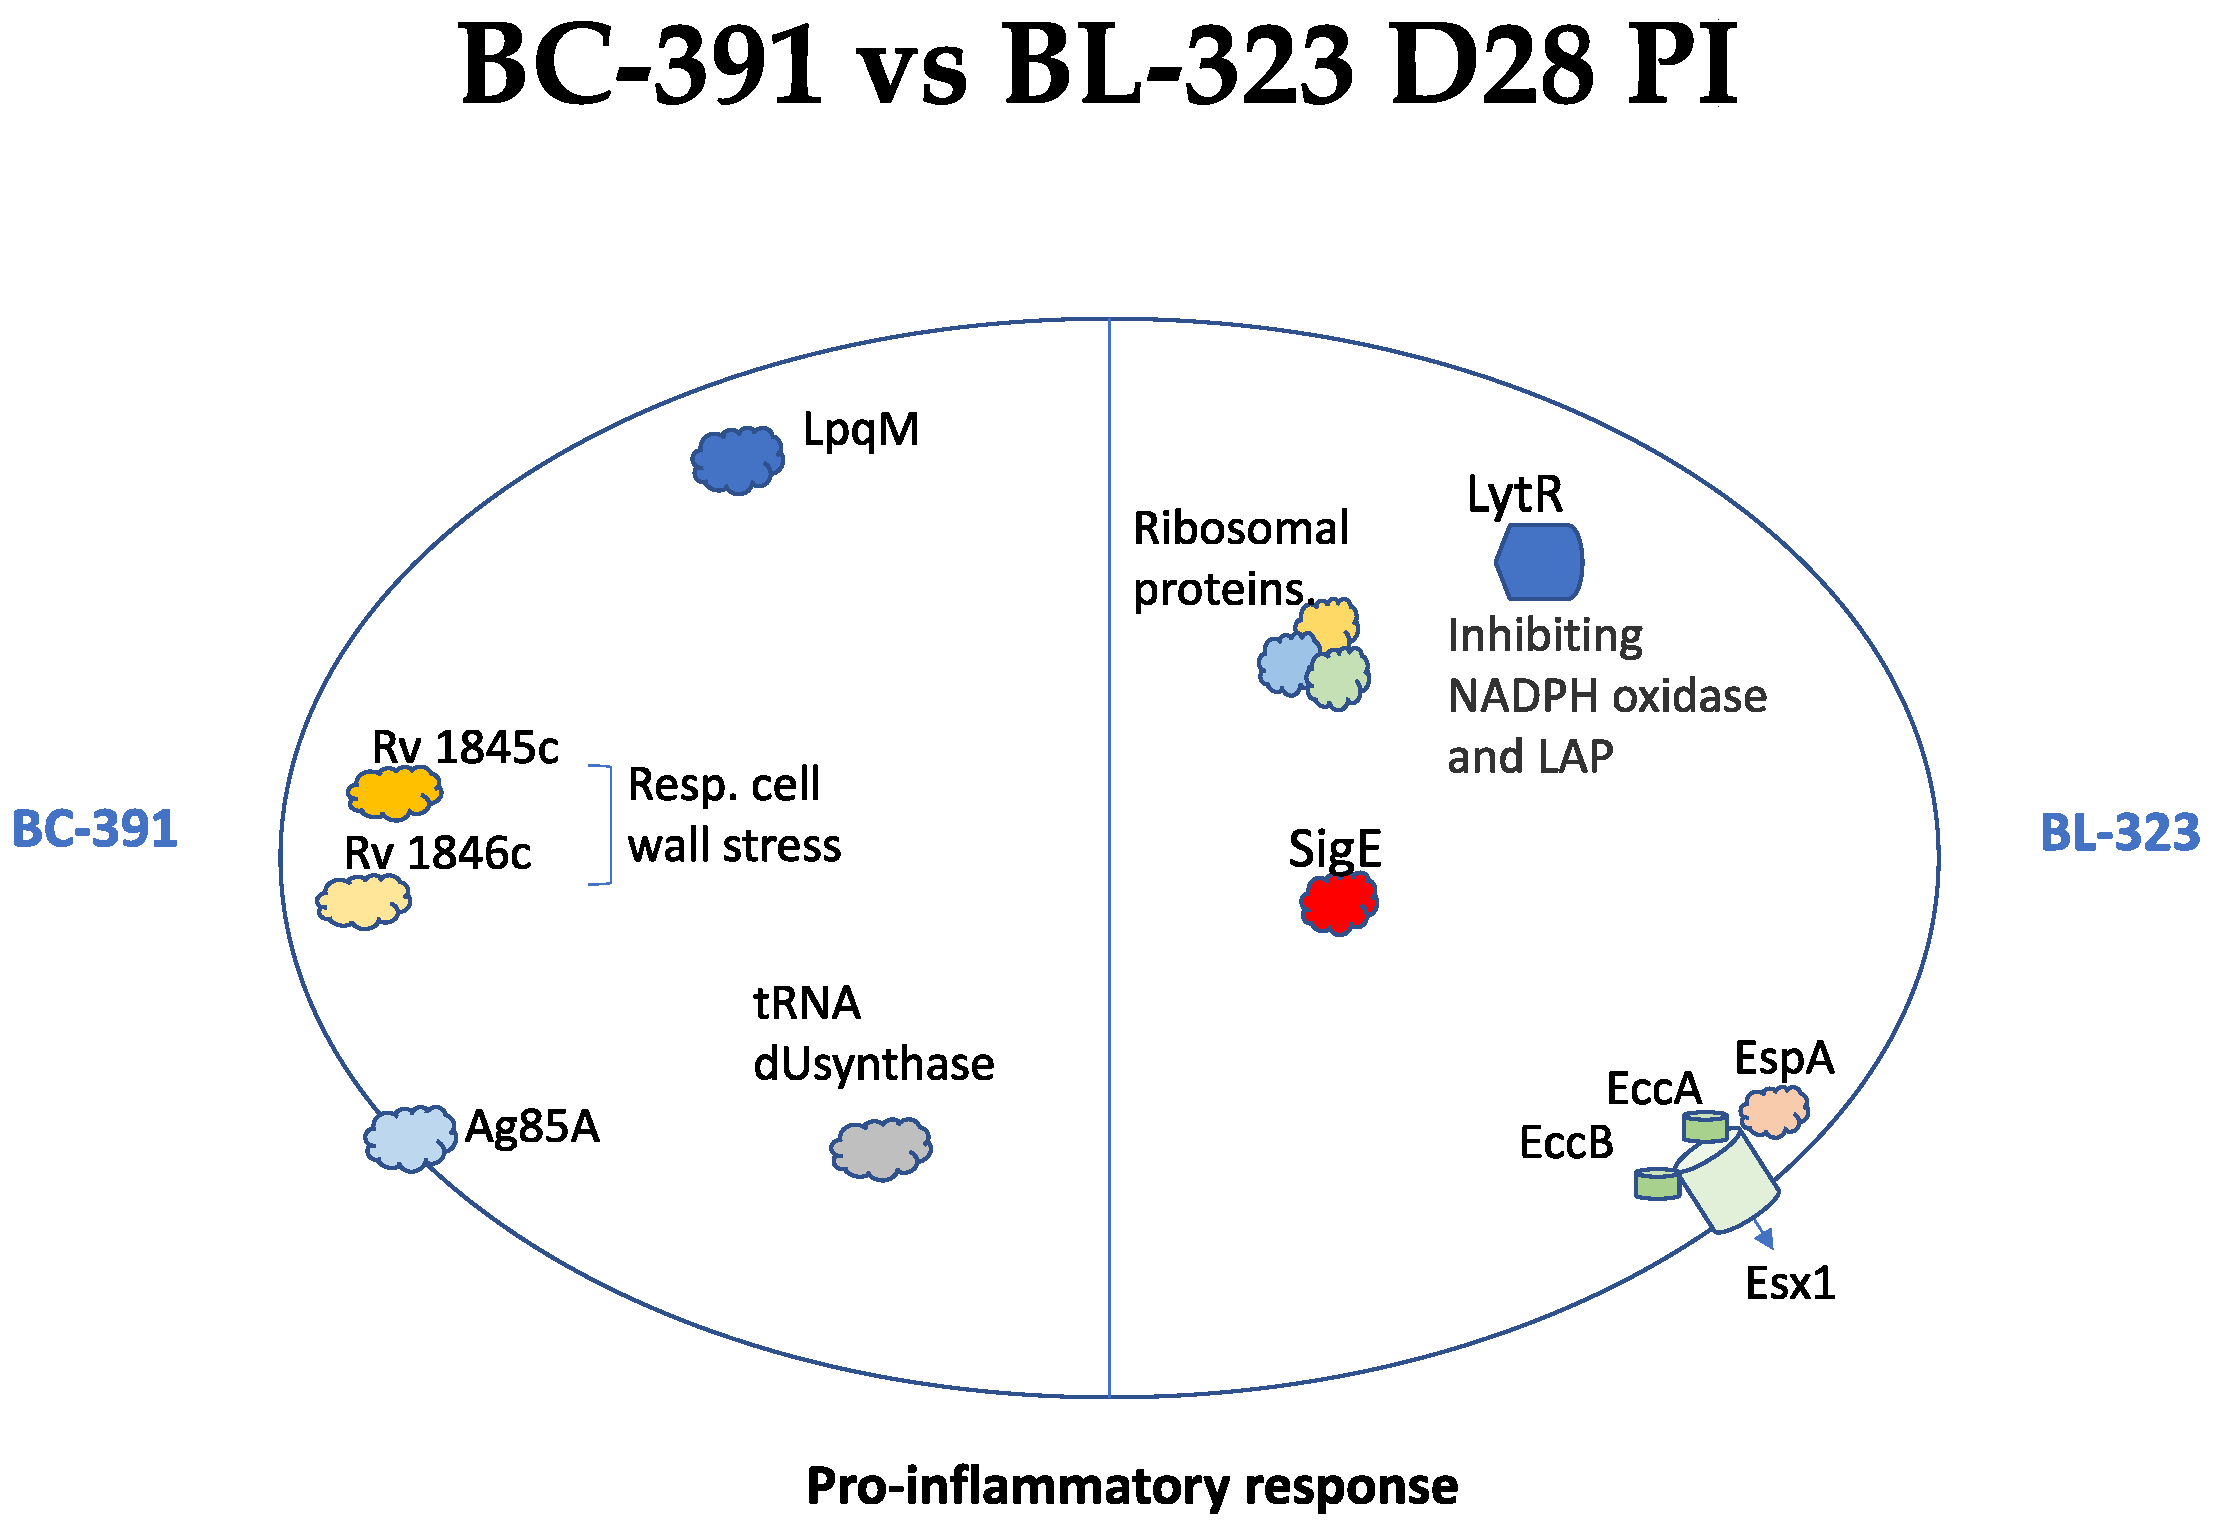
2.7. Inter-Strain Analysis
3. Discussion
4. Materials and Methods
4.1. Ethics Statement
4.2. Bacterial Strains
4.3. Bacterial Culture
4.4. Infection of Mice with MTB Beijing Isolates for Transcriptomic Assays
4.5. RNA Extraction
4.6. Eukaryotic Ribosomal RNA Depletion and Libraries Construction
4.7. Bioinformatic Analysis
4.8. Gene Ontology and Functional Enrichment Analysis
4.9. MDS Analysis
4.10. Heatmap
4.11. Methaplhan (Metagenomic Phylogenetic Analysis)
Supplementary Materials
Author Contributions
Funding
Institutional Review Board Statement
Data Availability Statement
Acknowledgments
Conflicts of Interest
References
- Portevin, D.; Gagneux, S.; Comas, I.; Young, D. Human Macrophage Responses to Clinical Isolates from the Mycobacterium tuberculosis Complex Discriminate between Ancient and Modern Lineages. PLoS Pathog. 2011, 7, e1001307. [Google Scholar] [CrossRef] [Green Version]
- Mourik, B.C.; de Steenwinkel, J.E.M.; de Knegt, G.J.; Huizinga, R.; Verbon, A.; Ottenhoff, T.H.M.; van Soolingen, D.; Leenen, P.J.M. Mycobacterium tuberculosis Clinical Isolates of the Beijing and East-African Indian Lineage Induce Fundamentally Different Host Responses in Mice Compared to H37Rv. Sci. Rep. 2019, 9, 19922. [Google Scholar] [CrossRef] [PubMed]
- Coscolla, M.; Gagneux, S. Consequences of Genomic Diversity in Mycobacterium tuberculosis. Semin. Immunol. 2014, 26, 431–444. [Google Scholar] [CrossRef] [PubMed] [Green Version]
- Brosch, R.; Gordon, S.V.; Marmiesse, M.; Brodin, P.; Buchrieser, C.; Eiglmeier, K.; Garnier, T.; Gutierrez, C.; Hewinson, G.; Kremer, K.; et al. A New Evolutionary Scenario for the Mycobacterium tuberculosis Complex. Proc. Natl. Acad. Sci. USA 2002, 99, 3684–3689. [Google Scholar] [CrossRef] [Green Version]
- Comas, I.; Chakravartti, J.; Small, P.M.; Galagan, J.; Niemann, S.; Kremer, K.; Ernst, J.D.; Gagneux, S. Human T Cell Epitopes of Mycobacterium tuberculosis Are Evolutionarily Hyperconserved. Nat. Genet. 2010, 42, 498–503. [Google Scholar] [CrossRef] [PubMed] [Green Version]
- Coscolla, M.; Gagneux, S.; Menardo, F.; Loiseau, C.; Ruiz-Rodriguez, P.; Borrell, S.; Otchere, I.D.; Asante-Poku, A.; Asare, P.; Sánchez-Busó, L.; et al. Phylogenomics of Mycobacterium Africanum Reveals a New Lineage and a Complex Evolutionary History. Microb. Genom. 2021, 7, 000477. [Google Scholar] [CrossRef]
- Ngabonziza, J.C.S.; Loiseau, C.; Marceau, M.; Jouet, A.; Menardo, F.; Tzfadia, O.; Antoine, R.; Niyigena, E.B.; Mulders, W.; Fissette, K.; et al. A Sister Lineage of the Mycobacterium tuberculosis Complex Discovered in the African Great Lakes Region. Nat. Commun. 2020, 11, 2917. [Google Scholar] [CrossRef] [PubMed]
- Wiens, K.E.; Woyczynski, L.P.; Ledesma, J.R.; Ross, J.M.; Zenteno-Cuevas, R.; Goodridge, A.; Ullah, I.; Mathema, B.; Djoba Siawaya, J.F.; Biehl, M.H.; et al. Global Variation in Bacterial Strains That Cause Tuberculosis Disease: A Systematic Review and Meta-Analysis. BMC Med. 2018, 16, 196. [Google Scholar] [CrossRef] [PubMed]
- De Jong, B.C.; Hill, P.C.; Aiken, A.; Awine, T.; Antonio, M.; Adetifa, I.M.; Jackson-Sillah, D.J.; Fox, A.; DeRiemer, K.; Gagneux, S.; et al. Progression to Active Tuberculosis, but Not Transmission, Varies by Mycobacterium tuberculosis Lineage in The Gambia. J. Infect. Dis. 2008, 198, 1037–1043. [Google Scholar] [CrossRef] [PubMed] [Green Version]
- Ribeiro, S.C.M.; Gomes, L.L.; Amaral, E.P.; Andrade, M.R.M.; Almeida, F.M.; Rezende, A.L.; Lanes, V.R.; Carvalho, E.C.Q.; Suffys, P.N.; Mokrousov, I.; et al. Mycobacterium tuberculosis Strains of the Modern Sublineage of the Beijing Family Are More Likely To Display Increased Virulence than Strains of the Ancient Sublineage. J. Clin. Microbiol. 2014, 52, 2615–2624. [Google Scholar] [CrossRef] [PubMed] [Green Version]
- Mokrousov, I.; Narvskaya, O.; Otten, T.; Vyazovaya, A.; Limeschenko, E.; Steklova, L.; Vyshnevskyi, B. Phylogenetic Reconstruction within Mycobacterium tuberculosis Beijing Genotype in Northwestern Russia. Res. Microbiol. 2002, 153, 629–637. [Google Scholar] [CrossRef]
- Shitikov, E.; Kolchenko, S.; Mokrousov, I.; Bespyatykh, J.; Ischenko, D.; Ilina, E.; Govorun, V. Evolutionary Pathway Analysis and Unified Classification of East Asian Lineage of Mycobacterium tuberculosis OPEN. Sci. Rep. 2017, 7, 9227. [Google Scholar] [CrossRef] [PubMed] [Green Version]
- Brudey, K.; Driscoll, J.R.; Rigouts, L.; Prodinger, W.M.; Gori, A.; Al-Hajoj, S.A.; Allix, C.; Aristimuño, L.; Arora, J.; Baumanis, V.; et al. Mycobacterium tuberculosis Complex Genetic Diversity: Mining the Fourth International Spoligotyping Database (SpolDB4) for Classification, Population Genetics and Epidemiology. BMC Microbiol. 2006, 6, 23. [Google Scholar] [CrossRef] [PubMed] [Green Version]
- Ritacco, V.; López, B.; Cafrune, P.I.; Ferrazoli, L.; Suffys, P.N.; Candia, N.; Vásquez, L.; Realpe, T.; Fernández, J.; Lima, K.V.; et al. Mycobacterium tuberculosis Strains of the Beijing Genotype Are Rarely Observed in Tuberculosis Patients in South America. Memórias Inst. Oswaldo Cruz 2008, 103, 489–492. [Google Scholar] [CrossRef] [PubMed]
- Cerezo-Cortés, M.; Rodríguez-Castillo, J.; Hernández-Pando, R.; Murcia, M. Circulation of M. Tuberculosis Beijing Genotype in Latin America and the Caribbean. Pathog. Glob. Health 2019, 113, 336–351. [Google Scholar] [CrossRef] [PubMed]
- Ferro, B. Multidrug-Resistant Mycobacterium tuberculosis, Southwestern Colombia. Emerg. Infect. Dis. 2011, 17, 1259–1262. [Google Scholar] [CrossRef]
- Murcia, M.I.; Manotas, M.; Jiménez, Y.J.; Hernández, J.; Cortès, M.I.C.; López, L.E.; Zozio, T.; Rastogi, N. First Case of Multidrug-Resistant Tuberculosis Caused by a Rare “Beijing-like” Genotype of Mycobacterium tuberculosis in Bogotá, Colombia. Infect. Genet. Evol. 2010, 10, 678–681. [Google Scholar] [CrossRef] [PubMed]
- Nieto Ramirez, L.M.; Ferro, B.E.; Diaz, G.; Anthony, R.M.; de Beer, J.; van Soolingen, D. Genetic Profiling of Mycobacterium tuberculosis Revealed “Modern” Beijing Strains Linked to MDR-TB from Southwestern Colombia. PLoS ONE 2020, 15, e0224908. [Google Scholar] [CrossRef] [PubMed]
- Rodríguez-Castillo, J.G.; Pino, C.; Niño, L.F.; Rozo, J.C.; Llerena-Polo, C.; Parra-López, C.A.; Tauch, A.; Murcia-Aranguren, M.I. Comparative Genomic Analysis of Mycobacterium tuberculosis Beijing-like Strains Revealed Specific Genetic Variations Associated with Virulence and Drug Resistance. Infect. Genet. Evol. 2017, 54, 314–323. [Google Scholar] [CrossRef]
- Moreira-Teixeira, L.; Tabone, O.; Graham, C.M.; Singhania, A.; Stavropoulos, E.; Redford, P.S.; Chakravarty, P.; Priestnall, S.L.; Suarez-Bonnet, A.; Herbert, E.; et al. Mouse Transcriptome Reveals Potential Signatures of Protection and Pathogenesis in Human Tuberculosis. Nat. Immunol. 2020, 21, 464–476. [Google Scholar] [CrossRef] [PubMed]
- Westermann, A.J.; Barquist, L.; Vogel, J. Resolving Host–Pathogen Interactions by Dual RNA-Seq. PLoS Pathog. 2017, 13, e1006033. [Google Scholar] [CrossRef] [PubMed] [Green Version]
- María Irene, C.C.; Juan Germán, R.C.; Gamaliel, L.L.; Dulce Adriana, M.E.; Estela Isabel, B.; Brenda Nohemí, M.; Payan Jorge, B.; Zyanya Lucía, Z.B.; del Myriam, B.V.; Fernanda, C.G.; et al. Profiling the Immune Response to Mycobacterium tuberculosis Beijing Family Infection: A Perspective from the Transcriptome. Virulence 2021, 12, 1689–1704. [Google Scholar] [CrossRef] [PubMed]
- Cornejo-Granados, F.; López-Leal, G.; Mata-Espinosa, D.A.; Barrios-Payán, J.; Marquina-Castillo, B.; Equihua-Medina, E.; Zatarain-Barrón, Z.L.; Molina-Romero, C.; Hernández-Pando, R.; Ochoa-Leyva, A. Targeted RNA-Seq Reveals the M. Tuberculosis Transcriptome from an In Vivo Infection Model. Biology 2021, 10, 848. [Google Scholar] [CrossRef] [PubMed]
- Cole, S.T.; Brosch, R.; Parkhill, J.; Garnier, T.; Churcher, C.; Harris, D.; Gordon, S.V.; Eiglmeier, K.; Gas, S.; Barry, C.E.; et al. Deciphering the Biology of Mycobacterium tuberculosis from the Complete Genome Sequence. Nature 1998, 393, 537–544. [Google Scholar] [CrossRef]
- Beghini, F.; McIver, L.J.; Blanco-Míguez, A.; Dubois, L.; Asnicar, F.; Maharjan, S.; Mailyan, A.; Manghi, P.; Scholz, M.; Thomas, A.M.; et al. Integrating Taxonomic, Functional, and Strain-Level Profiling of Diverse Microbial Communities with BioBakery 3. eLife 2021, 10, e65088. [Google Scholar] [CrossRef] [PubMed]
- Haydel, S.E.; Dunlap, N.E.; Benjamin, W.H., Jr. In Vitro evidence of Two-Component System Phosphorylation between the Mycobacterium tuberculosis TrcR/TrcS Proteins. Microb. Pathog. 1999, 26, 195–206. [Google Scholar] [CrossRef] [PubMed]
- Fu, J.; Zong, G.; Zhang, P.; Gu, Y.; Cao, G. Deletion of the β-Propeller Protein Gene Rv1057 Reduces ESAT-6 Secretion and Intracellular Growth of Mycobacterium tuberculosis. Curr. Microbiol. 2018, 75, 401–409. [Google Scholar] [CrossRef]
- Zhang, Q.; Liu, H.; Liu, X.; Jiang, D.; Zhang, B.; Tian, H.; Yang, C.; Guddat, L.W.; Yang, H.; Mi, K.; et al. Discovery of the First Macrolide Antibiotic Binding Protein in Mycobacterium tuberculosis: A New Antibiotic Resistance Drug Target. Protein Cell 2018, 9, 971–975. [Google Scholar] [CrossRef] [PubMed] [Green Version]
- Ostrik, A.A.; Azhikina, T.L.; Salina, E.G. Small Noncoding RNAs and Their Role in the Pathogenesis of Mycobacterium tuberculosis Infection. Biochemistry 2021, 86, S109–S119. [Google Scholar] [CrossRef] [PubMed]
- Rodríguez, J.G.; Hernández, A.C.; Helguera-Repetto, C.; Aguilar Ayala, D.; Guadarrama-Medina, R.; Anzóla, J.M.; Bustos, J.R.; Zambrano, M.M.; González-y-Merchand, J.; García, M.J.; et al. Global Adaptation to a Lipid Environment Triggers the Dormancy-Related Phenotype of Mycobacterium tuberculosis. mBio 2014, 5, e01125-14. [Google Scholar] [CrossRef] [PubMed] [Green Version]
- Arnvig, K.; Young, D. Non-Coding RNA and Its Potential Role in Mycobacterium tuberculosis Pathogenesis. RNA Biol. 2012, 9, 427–436. [Google Scholar] [CrossRef] [PubMed] [Green Version]
- Solans, L.; Gonzalo-Asensio, J.; Sala, C.; Benjak, A.; Uplekar, S.; Rougemont, J.; Guilhot, C.; Malaga, W.; Martín, C.; Cole, S.T. The PhoP-Dependent NcRNA Mcr7 Modulates the TAT Secretion System in Mycobacterium tuberculosis. PLoS Pathog. 2014, 10, e1004183. [Google Scholar] [CrossRef] [PubMed]
- Patil, S.; Palande, A.; Lodhiya, T.; Pandit, A.; Mukherjee, R. Redefining Genetic Essentiality in Mycobacterium tuberculosis. Gene 2021, 765, 145091. [Google Scholar] [CrossRef] [PubMed]
- Kiran, M.; Chauhan, A.; Dziedzic, R.; Maloney, E.; Mukherji, S.K.; Madiraju, M.; Rajagopalan, M. Mycobacterium tuberculosis FtsH Expression in Response to Stress and Viability. Tuberculosis 2009, 89, S70–S73. [Google Scholar] [CrossRef] [Green Version]
- Master, S.S.; Springer, B.; Sander, P.; Boettger, E.C.; Deretic, V.; Timmins, G.S. Oxidative Stress Response Genes in Mycobacterium tuberculosis: Role of AhpC in Resistance to Peroxynitrite and Stage-Specific Survival in Macrophages. Microbiology 2002, 148, 3139–3144. [Google Scholar] [CrossRef] [PubMed] [Green Version]
- Degiacomi, G.; Benjak, A.; Madacki, J.; Boldrin, F.; Provvedi, R.; Palù, G.; Kordulakova, J.; Cole, S.T.; Manganelli, R. Essentiality of MmpL3 and Impact of Its Silencing on Mycobacterium tuberculosis Gene Expression. Sci. Rep. 2017, 7, 43495. [Google Scholar] [CrossRef] [PubMed] [Green Version]
- Back, Y.W.; Shin, K.W.; Choi, S.; Park, H.-S.; Lee, K.-I.; Choi, H.-G.; Kim, H.-J. Mycobacterium tuberculosis Rv2005c Induces Dendritic Cell Maturation and Th1 Responses and Exhibits Immunotherapeutic Activity by Fusion with the Rv2882c Protein. Vaccines 2020, 8, 370. [Google Scholar] [CrossRef]
- Miller, B.R.; Gulick, A.M. Structural Biology of Nonribosomal Peptide Synthetases. Methods Mol. Biol. 2016, 1401, 3–29. [Google Scholar]
- Barraud, P.; Tisné, C. To Be or Not to Be Modified: Miscellaneous Aspects Influencing Nucleotide Modifications in TRNAs. IUBMB Life 2019, 71, 1126–1140. [Google Scholar] [CrossRef]
- Gaudion, A.; Dawson, L.; Davis, E.; Smollett, K. Characterisation of the Mycobacterium tuberculosis Alternative Sigma Factor SigG: Its Operon and Regulon. Tuberculosis 2013, 93, 482–491. [Google Scholar] [CrossRef] [Green Version]
- Dasgupta, A.; Sureka, K.; Mitra, D.; Saha, B.; Sanyal, S.; Das, A.K.; Chakrabarti, P.; Jackson, M.; Gicquel, B.; Kundu, M.; et al. An Oligopeptide Transporter of Mycobacterium tuberculosis Regulates Cytokine Release and Apoptosis of Infected Macrophages. PLoS ONE 2010, 5, e12225. [Google Scholar] [CrossRef] [PubMed]
- Meng, L.; Tong, J.; Wang, H.; Tao, C.; Wang, Q.; Niu, C.; Zhang, X.; Gao, Q. PPE38 Protein of Mycobacterium tuberculosis Inhibits Macrophage MHC Class I Expression and Dampens CD8+ T Cell Responses. Front. Cell. Infect. Microbiol. 2017, 7, 68. [Google Scholar] [CrossRef] [Green Version]
- Mann, K.M.; Huang, D.L.; Hooppaw, A.J.; Logsdon, M.M.; Richardson, K.; Lee, H.J.; Kimmey, J.M.; Aldridge, B.B.; Stallings, C.L. Rv0004 Is a New Essential Member of the Mycobacterial DNA Replication Machinery. PLoS Genet. 2017, 13, e1007115. [Google Scholar] [CrossRef] [PubMed]
- Schneider, J.S.; Reddy, S.P.; Hock, Y.E.; Evans, H.W.; Glickman, M.S. Site-2 Protease Substrate Specificity and Coupling in Trans by a PDZ-Substrate Adapter Protein. Proc. Natl. Acad. Sci. USA 2013, 110, 19543–19548. [Google Scholar] [CrossRef] [Green Version]
- Chawla, Y.; Upadhyay, S.; Khan, S.; Nagarajan, S.N.; Forti, F.; Nandicoori, V.K. Protein Kinase B (PknB) of Mycobacterium tuberculosis Is Essential for Growth of the Pathogen in Vitro as Well as for Survival within the Host. J. Biol. Chem. 2014, 289, 13858–13875. [Google Scholar] [CrossRef] [PubMed] [Green Version]
- Alexander, D.C.; Jones, J.R.W.; Tan, T.; Chen, J.M.; Liu, J. PimF, a Mannosyltransferase of Mycobacteria, Is Involved in the Biosynthesis of Phosphatidylinositol Mannosides and Lipoarabinomannan. J. Biol. Chem. 2004, 279, 18824–18833. [Google Scholar] [CrossRef] [PubMed] [Green Version]
- Di Luca, M.; Bottai, D.; Batoni, G.; Orgeur, M.; Aulicino, A.; Counoupas, C.; Campa, M.; Brosch, R.; Esin, S. The ESX-5 Associated EccB5-EccC5 Locus Is Essential for Mycobacterium tuberculosis Viability. PLoS ONE 2012, 7, e52059. [Google Scholar] [CrossRef] [PubMed]
- Albrethsen, J.; Agner, J.; Piersma, S.R.; Højrup, P.; Pham, T.V.; Weldingh, K.; Jimenez, C.R.; Andersen, P.; Rosenkrands, I. Proteomic Profiling of Mycobacterium tuberculosis Identifies Nutrient-Starvation-Responsive Toxin—Antitoxin Systems. Mol. Cell. Proteom. 2013, 12, 1180–1191. [Google Scholar] [CrossRef] [PubMed] [Green Version]
- Karbalaei Zadeh Babaki, M.; Soleimanpour, S.; Rezaee, S.A. Antigen 85 Complex as a Powerful Mycobacterium tuberculosis Immunogene: Biology, Immune-Pathogenicity, Applications in Diagnosis, and Vaccine Design. Microb. Pathog. 2017, 112, 20–29. [Google Scholar] [CrossRef]
- Koster, S.; Upadhyay, S.; Chandra, P.; Papavinasasundaram, K.; Yang, G.; Hassan, A.; Philips, J.A. Mycobacterium tuberculosis Is Protected from NADPH Oxidase and LC3-Associated Phagocytosis by the LCP Protein CpsA. Proc. Natl. Acad. Sci. USA 2017, 114, E9752. [Google Scholar] [CrossRef] [Green Version]
- Malm, S.; Maaß, S.; Schaible, U.E.; Ehlers, S.; Niemann, S. In Vivo Virulence of Mycobacterium tuberculosis Depends on a Single Homologue of the LytR-CpsA-Psr Proteins. Sci. Rep. 2018, 8, 3936. [Google Scholar] [CrossRef] [PubMed]
- Aguilar-Ayala, D.A.; Tilleman, L.; Van Nieuwerburgh, F.; Deforce, D.; Palomino, J.C.; Vandamme, P.; Gonzalez-Y-Merchand, J.A.; Martin, A. The Transcriptome of Mycobacterium tuberculosis in a Lipid-Rich Dormancy Model through RNAseq Analysis. Sci. Rep. 2017, 7, 17665. [Google Scholar] [CrossRef] [PubMed] [Green Version]
- Pisu, D.; Huang, L.; Grenier, J.K.; Russell, D.G. Dual RNA-Seq of Mtb-Infected Macrophages In Vivo Reveals Ontologically Distinct Host-Pathogen Interactions. Cell Rep. 2020, 30, 335–350.e4. [Google Scholar] [CrossRef] [PubMed]
- Talaat, A.M.; Lyons, R.; Howard, S.T.; Johnston, S.A. The Temporal Expression Profile of Mycobacterium tuberculosis Infection in Mice. Proc. Natl. Acad. Sci. USA 2004, 101, 4602–4607. [Google Scholar] [CrossRef] [PubMed] [Green Version]
- Kim, S.Y.; Kim, D.; Kim, S.; Lee, D.; Mun, S.; Cho, E.; Son, W.; Jang, K.; Yang, C. Mycobacterium tuberculosis Rv2626c-derived Peptide as a Therapeutic Agent for Sepsis. EMBO Mol. Med. 2020, 12, e12497. [Google Scholar] [CrossRef]
- Haydel, S.E.; Benjamin, W.H.; Dunlap, N.E.; Clark-Curtiss, J.E. Expression, Autoregulation, and DNA Binding Properties of the Mycobacterium tuberculosis TrcR Response Regulator. J. Bacteriol. 2002, 184, 2192–2203. [Google Scholar] [CrossRef] [Green Version]
- Rachman, H.; Kim, N.; Ulrichs, T.; Baumann, S.; Pradl, L.; Eddine, A.N.; Bild, M.; Rother, M.; Kuban, R.-J.; Lee, J.S.; et al. Critical Role of Methylglyoxal and AGE in Mycobacteria-Induced Macrophage Apoptosis and Activation. PLoS ONE 2006, 1, e29. [Google Scholar] [CrossRef]
- Lee, J.-H.; Geiman, D.E.; Bishai, W.R. Role of Stress Response Sigma Factor SigG in Mycobacterium tuberculosis. J. Bacteriol. 2008, 190, 1128–1133. [Google Scholar] [CrossRef] [PubMed] [Green Version]
- Hernandez-Pando, R.; Shin, S.J.; Clark, S.; Casonato, S.; Becerril-Zambrano, M.; Kim, H.; Boldrin, F.; Mata-Espinoza, D.; Provvedi, R.; Arbues, A.; et al. Construction and Characterization of the Mycobacterium tuberculosis SigE FadD26 Unmarked Double Mutant as a Vaccine Candidate. Infect. Immun. 2019, 88, e00496-19. [Google Scholar] [CrossRef] [PubMed]
- Sun, Y.; Zhang, W.; Dong, C.; Xiong, S. Mycobacterium tuberculosis MmsA (Rv0753c) Interacts with STING and Blunts the Type I Interferon Response. mBio 2020, 11, e03254-19. [Google Scholar] [CrossRef]
- Weniger, T.; Krawczyk, J.; Supply, P.; Niemann, S.; Harmsen, D. MIRU-VNTRplus: A Web Tool for Polyphasic Genotyping of Mycobacterium tuberculosis Complex Bacteria. Nucleic Acids Res. 2010, 38, W326–W331. [Google Scholar] [CrossRef] [PubMed] [Green Version]
- Hernández-Pando, R.; Orozcoe, H.; Sampieri, A.; Pavón, L.; Velasquillo, C.; Larriva-Sahd, J.; Alcocer, J.M.; Madrid, M.V. Correlation between the Kinetics of Th1, Th2 Cells and Pathology in a Murine Model of Experimental Pulmonary Tuberculosis. Immunology 1996, 89, 26–33. [Google Scholar] [PubMed]
- Rangel Moreno, J.; Estrada Garcia, I.; de la Luz Garcia Hernandez, M.; Aguilar Leon, D.; Marquez, R.; Hernandez Pando, R. The Role of Prostaglandin E2 in the Immunopathogenesis of Experimental Pulmonary Tuberculosis. Immunology 2002, 106, 257–266. [Google Scholar] [CrossRef] [PubMed]
- Ewels, P.; Magnusson, M.; Lundin, S.; Käller, M. MultiQC: Summarize Analysis Results for Multiple Tools and Samples in a Single Report. Bioinformatics 2016, 32, 3047–3048. [Google Scholar] [CrossRef] [PubMed] [Green Version]
- Bolger, A.M.; Lohse, M.; Usadel, B. Trimmomatic: A Flexible Trimmer for Illumina Sequence Data. Bioinformatics 2014, 30, 2114–2120. [Google Scholar] [CrossRef] [PubMed] [Green Version]
- Robinson, M.D.; McCarthy, D.J.; Smyth, G.K. EdgeR: A Bioconductor Package for Differential Expression Analysis of Digital Gene Expression Data. Bioinformatics 2010, 26, 139–140. [Google Scholar] [CrossRef] [PubMed] [Green Version]
- The Gene Ontology Resource: 20 Years and Still GOing Strong. Nucleic Acids Res. 2019, 47, D330–D338. [CrossRef] [Green Version]
- Castillo-Davis, C.I.; Hartl, D.L. GeneMerge—Post-Genomic Analysis, Data Mining, and Hypothesis Testing. Bioinformatics 2003, 19, 891–892. [Google Scholar] [CrossRef] [PubMed] [Green Version]


| Reads/Genes | BL-323 Day PI | BC-391 Day PI | |||||
|---|---|---|---|---|---|---|---|
| 3 | 14 | 28 | 3 | 14 | 28 | 60 | |
| Total counts | 10,367,209.66 (100%) | 9,861,857.58 (100%) | 10,471,489.25 (100%) | 12,374,677.58 (100%) | 11,740,622.41 (100%) | 12,301,584.5 (100%) | 9,953,088.83 (100%) |
| Not maped to mouse | 796,283.83 (7.68%) | 875,917.66 (8.8%) | 948,499.16 (9.06%) | 757,210.5 (6.12%) | 945,525.66 (8.05%) | 809,753.83 (6.58%) | 757,883.66 (7.61%) |
| Maped to Mtb | 54,849 (0.53%) | 65,719.91 (0.66%) | 67,580.66 (0.64%) | 51,140.83 (0.41%) | 77,151.75 (0.65%) | 60,099.25 (0.48%) | 60,474.41 (0.60%) |
| Maped to CDS Mtb * | 52,167.08 (95.1%) | 58,889.41 (89.6%) | 58,970.91 (87.26%) | 49,105.41 (96.01%) | 76,026.58 (98.54%) | 56,595.16 (94.16%) | 55,783.91 (92.24%) |
| Maped to rRNA Mtb * | 2170.33 (3.95%) | 5142.33 (7.8%) | 6316 (9.34%) | 1574.25 (3.07) | 826 (1.07%) | 3094.66 (5.15%) | 4086.5 (6.75%) |
| Maped to ncRNA* | 28.58 (0.05%) | 156.92 (0.24%) | 277.58 (0.41%) | 9.25 (0.02%) | 82 (0.1%) | 31.75 (0.05%) | 170.41 (0.28%) |
| Not associated * | 483 (0.88%) | 1531.25 (2.33%) | 2016.16 (2.98%) | 430.91 (0.84%) | 217.16 (0.28%) | 377.66 (0.62%) | 433.58 (0.71%) |
| % of MTB genes mapped ** | 1148 (30%) | 1429 (37%) | 1493 (39%) | 1323 (33%) | 705 (18%) | 1357 (34%) | 1623 (41%) |
Publisher’s Note: MDPI stays neutral with regard to jurisdictional claims in published maps and institutional affiliations. |
© 2022 by the authors. Licensee MDPI, Basel, Switzerland. This article is an open access article distributed under the terms and conditions of the Creative Commons Attribution (CC BY) license (https://creativecommons.org/licenses/by/4.0/).
Share and Cite
Cerezo-Cortés, M.I.; Rodríguez-Castillo, J.G.; Mata-Espinosa, D.A.; Bini, E.I.; Barrios-Payan, J.; Zatarain-Barrón, Z.L.; Anzola, J.M.; Cornejo-Granados, F.; Ochoa-Leyva, A.; Del Portillo, P.; et al. Close Related Drug-Resistance Beijing Isolates of Mycobacterium tuberculosis Reveal a Different Transcriptomic Signature in a Murine Disease Progression Model. Int. J. Mol. Sci. 2022, 23, 5157. https://doi.org/10.3390/ijms23095157
Cerezo-Cortés MI, Rodríguez-Castillo JG, Mata-Espinosa DA, Bini EI, Barrios-Payan J, Zatarain-Barrón ZL, Anzola JM, Cornejo-Granados F, Ochoa-Leyva A, Del Portillo P, et al. Close Related Drug-Resistance Beijing Isolates of Mycobacterium tuberculosis Reveal a Different Transcriptomic Signature in a Murine Disease Progression Model. International Journal of Molecular Sciences. 2022; 23(9):5157. https://doi.org/10.3390/ijms23095157
Chicago/Turabian StyleCerezo-Cortés, María Irene, Juan Germán Rodríguez-Castillo, Dulce Adriana Mata-Espinosa, Estela Isabel Bini, Jorge Barrios-Payan, Zyanya Lucia Zatarain-Barrón, Juan Manuel Anzola, Fernanda Cornejo-Granados, Adrian Ochoa-Leyva, Patricia Del Portillo, and et al. 2022. "Close Related Drug-Resistance Beijing Isolates of Mycobacterium tuberculosis Reveal a Different Transcriptomic Signature in a Murine Disease Progression Model" International Journal of Molecular Sciences 23, no. 9: 5157. https://doi.org/10.3390/ijms23095157