2. Membrane Nanostructure
The first step to reveal the ionic transfer mechanism is a nanostructure of ionic transport channels. Nafion membranes attract keen interest.
The so-called Gierke model was proposed on the basis of small angle X-ray scattering (SAXS) data. According to this model, sulfonate groups, mobile cations, and water molecules are associated in spherical clusters with a diameter of 5 nm or less depending on membrane humidity. The clusters connect to each other by narrow channels formed by solitary sulfonate groups, and the channel width is about 1 nm (
Figure 1) [
102].
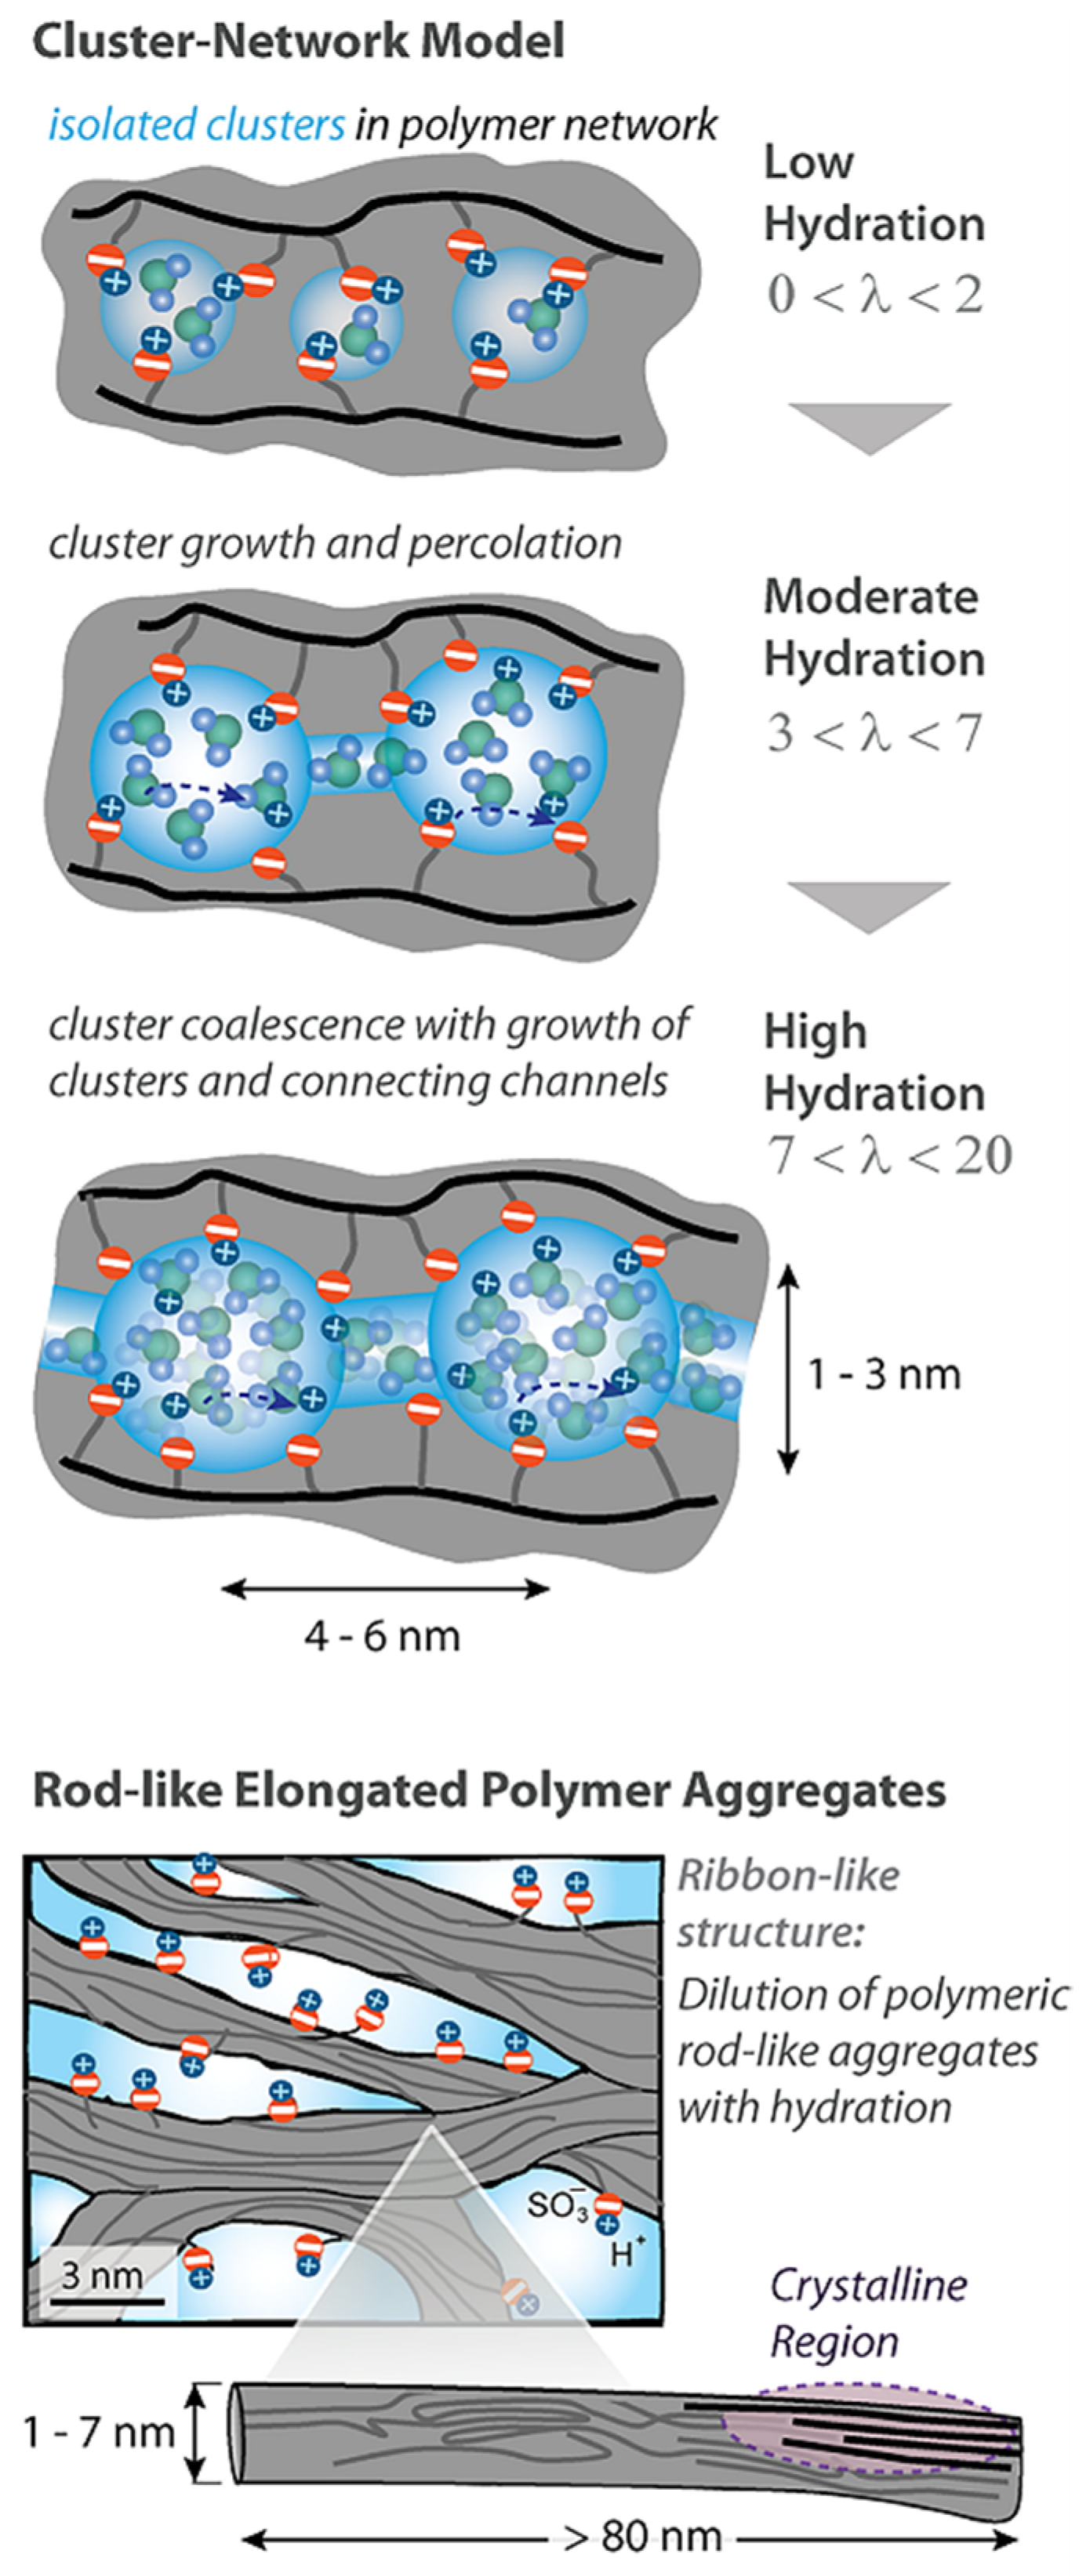
The cluster diameter is the only experimentally measured characteristic, but no channels were observed. Some modifications of the Gierke model are shown in
Figure 2 and
Figure 3.
As indicated in
Figure 3, at low hydration where
λ < 2 (
λ is the amount of water molecules per sulfonate group) the macroscopic transport is blocked because the channels “dry up”. At higher humidity, the cluster diameter increases and channels are opened. The macroscopic water and cation transfer is limited by their passing in narrow channels. The Gierke model describes qualitatively the threshold effect of the diffusion coefficient and conductivity humidity dependences. The channel width is about 1 nm, but the distance between sulfonate groups in the channel is more comparable with the average distance (0.7 nm);, therefore, the hydrogen bonds between water molecules in the channel are destroyed, which is the cause of low water and cation mobility, whereas the molecular and ionic mobility in hydrated clusters should be much higher. The first measurements of water self-diffusion coefficients by pulsed field gradient NMR show that the macroscopic self-diffusion coefficient in a Nafion membrane is comparable with the coefficient of bulk water. The correlation times of local water molecules and Li
+ cation translation motions in the clusters were estimated based on the
1H and
7Li NMR spin relaxation. The self-diffusion coefficients obtained by PFG NMR are macroscopic, because during the measurement time the particles move at least one hundred nm, passing through the clusters and channels many times. Their values were comparable with the self-diffusion coefficients calculated using the Einstein Equation (1).
where
l is the jump length of a water molecule (0.3 nm) or Li
+ cation (0.7 nm, average distance between SO
3− groups),
D is the diffusion coefficient, and
τi is the jump time.
As it is shown in
Table 1, the macroscopic experimental
Dexp and microscopic calculated
Dcalc self-diffusion coefficients of water molecules and lithium cations are in good agreement, which is not confirmed by the Gierke model.
Another model was developed on the basis of detailed SAXS measurements accompanied by Mössbauer spectroscopy, ENDOR, NMR relaxation, and standard porosimetry data (
Figure 4).
According to this nanostructure model, the macroscopic molecular and ionic transfer is controlled by water molecule and cation local jumping, which is in good agreement with the results in
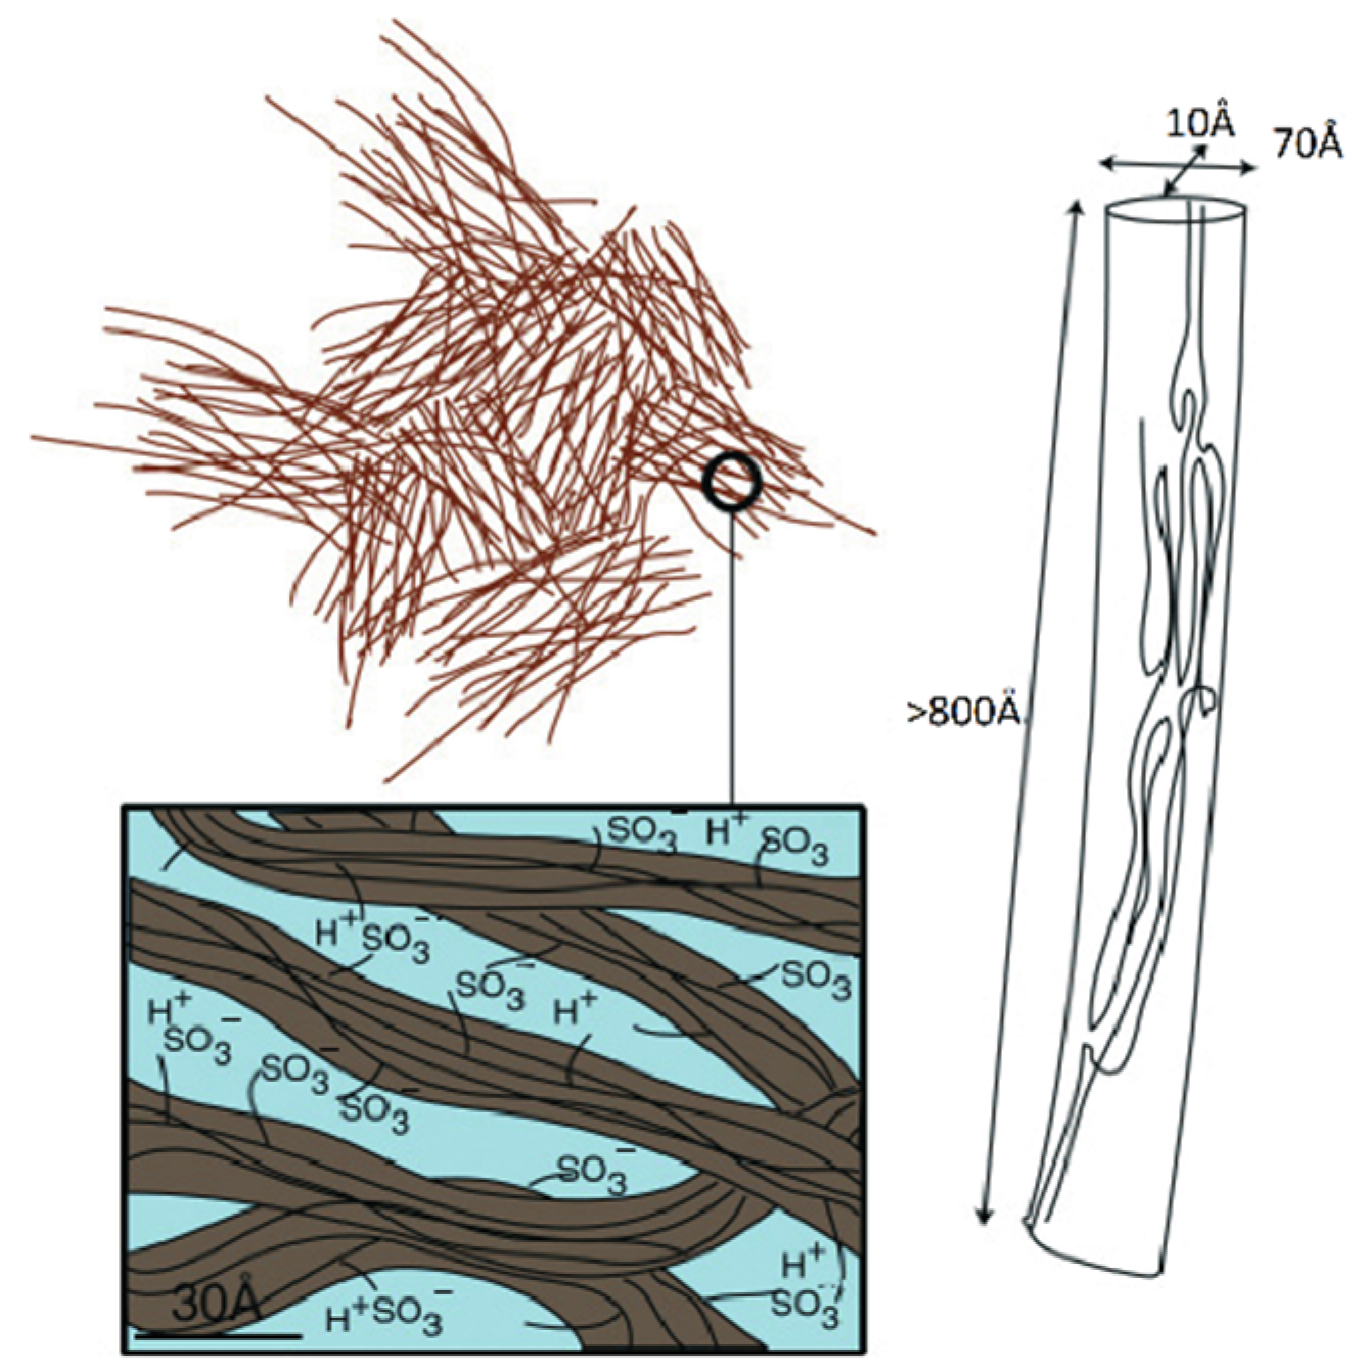
Table 1. This model was confirmed by the authors of [
104] who proposed rod-like aggregates (
Figure 5).
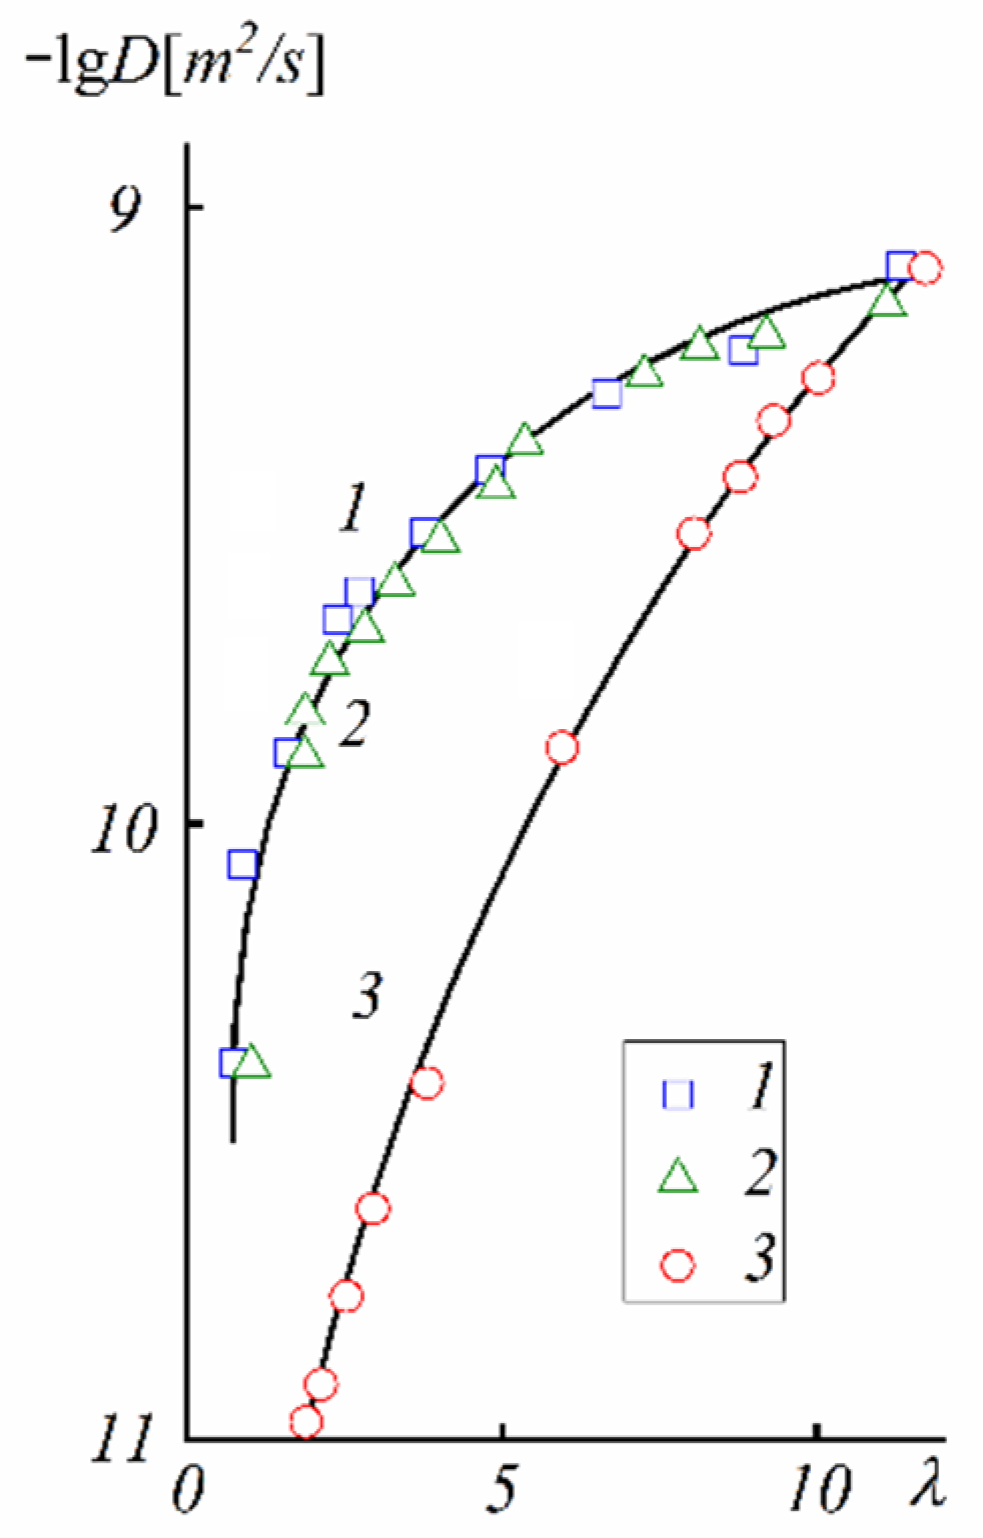
The next type of membrane is a membrane with sulfonate groups binding with styrene fragments. For these types of compositions, the calculated self-diffusion coefficient is higher compared with the macroscopic diffusion coefficient, as it is shown in
Figure 6, where the dependences of water self-diffusion coefficients on humidity
λ are shown for the sulfonated exchanger CU-2-8 (Russian analog of Dowex 50 W). Therefore, the cluster channel model of the nanostructure (particularly, the model in
Figure 2) is suitable for ionic molecular transfer explanation. This model is especially reasonable for ion exchangers based on styrene–divinylbenzene crosslinked copolymers. Namely, rather narrow channels are formed in the crosslinked fragments of polystyrene chains [
33].
As mentioned above, it should be concluded that Nafion macroscopic transport is carried out by local jumping of water molecules and cations between neighboring sulfonate groups. Therefore, ion transport is determined by ionogenic group hydration. For this reason, the hydration character should be correlated with the translational diffusion mobility of water molecules and cations, as well as membrane ionic conductivity.
3. Ion Hydration
The characteristic property for ion-exchange membranes is the threshold dependence of water and counterion mobility on the humidity [
24,
25,
33,
35,
36]. For example, in a Nafion membrane, the water and cation translational mobility as well as the ionic conductivity decrease by two or three orders of magnitude if the water content
λ decreases from 10–15 to 3–5 molecules per sulfonate group [
24]. Therefore, hydration controls the ion mobility in membrane nanochannels. The water content of the membranes is determined by the cation hydration energy and, therefore, water molecules are mainly sorbed by cations [
24,
25]. The basic cation hydration characteristic is the hydration number
h, which is the amount of water molecules in the first coordination sphere of the cation. For water content where
λ >
h, the water molecule located between the sulfonate group and hydrated cation–anion ionic pair dissociates and, therefore, the cation is mobile and its surroundings are similar to an aqueous solution. If
λ <
h, the oxygen atom of the sulfonate group is involved in the cation of the nearest sphere and the cation is fixed on the charged group. This phenomenon explains sharp ion mobility–humidity dependence.
High-resolution
1H NMR of water molecules is a direct technique for the calculation of the hydration number. Depending on the cation type (H
+ or metal cation), the water chemical shift in membranes varies from 6 ppm to −2 ppm (relative to bulk water). For a standard NMR spectrometer with a 500 MHz
1H NMR frequency, this variation is from 3000 to −1000 Hz. As it is shown in
Figure 7, the
1H NMR lines are narrow even at low temperature and humidity, thus chemical shift may be measured with high accuracy.
The hydration number is calculated from the
1H chemical shift dependence on temperature. The physical meaning of this calculation is as follows. Ion hydration water molecules are fixed, but their hydrogen bonds are destroyed; hence, the chemical shift is temperature independent. Therefore, only water molecules of the next hydration spheres, whose hydrogen bond network is similar to the bulk water network, are temperature dependent. The fast molecular exchange occurs between water molecules in different positions. Therefore, the average singlet line is observed with the following chemical shift:
where
δh is the chemical shift of protons of the hydrated cation,
ph is the relative part of hydrated cation protons;
is the bulk water chemical shift, and
is the bulk water relative part. The hydration numbers can be calculated from Equations (3) and (4) [
25,
41]. For the acid membrane ionic form:
For the salt membrane ionic form:
where
dδ/
dT is the temperature dependence of the membrane water
1H chemical shift and
dδH2O/
dT is the bulk water
1H chemical shift temperature dependence.
The calculation procedure of the hydration number from the
1H chemical shift temperature dependence was described in detail in [
24,
25,
30,
32,
33,
35,
41].
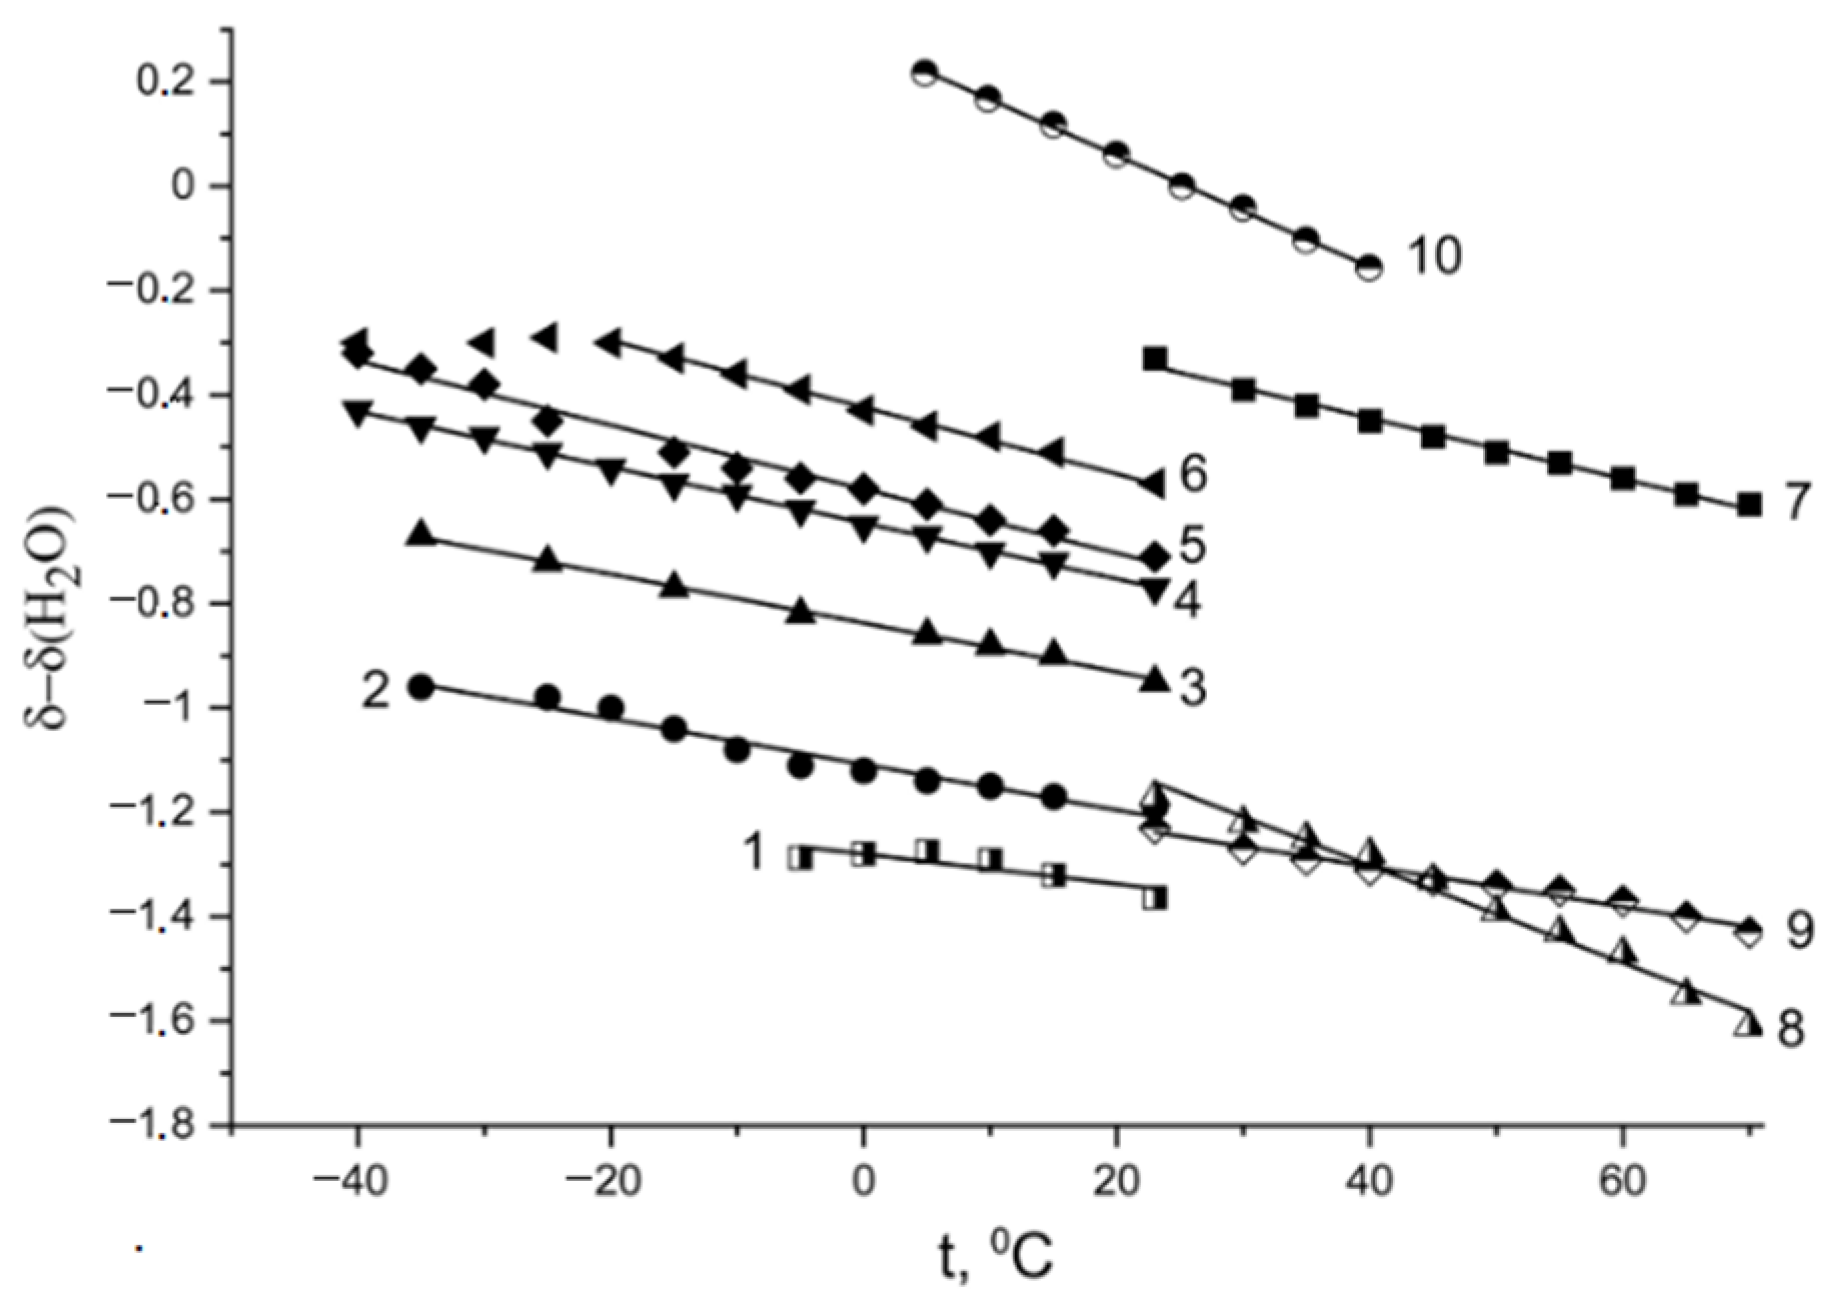
The proton chemical shift temperature dependences in the Nafion acid form are shown in
Figure 8.
These dependences are straight lines from −55 °C to 50 °C for
λ < 7.4 (curves 4–9). For higher
λ, this dependence slope increases in the freezing temperature range (curves 2 and3,
Figure 8). The same shape of the chemical shift temperature dependence was observed for the Nafion NRE-212 membrane (curve 10,
Figure 8) [
75].
The authors of [
75,
76] explain the shift of the
1H peak to a lower magnetic field with decreasing temperature by the enhancement of intermolecular interactions via hydrogen bonds.
In the acidic ionic form, the
1H line width is narrow even after the Nafion membrane was dried to a constant weight, indicating a high proton mobility under these conditions. The direct NMR measurements of the water content show that two residual water molecules remained after drying to form the hydroxonium (Zundel) ion H
5O
2+, which explains a high proton mobility [
41]. In
Table 2, the H
+ hydration numbers calculated from Equation (3) are given. The absolute value
λ with a glance at two residual water molecules is indicated in
Figure 8 and
Table 2. At a low water content (
λ < 3–4),
h is about 2, but with increasing humidity (
λ > 6) H
9O
4+ (Eigen-ion) is formed (
Figure 9) [
58].
It should be mentioned that this way of calculating the hydration number is rather crude, but some principal conclusions can be drawn, as it is shown above. These results are fundamental, because the same hydration peculiarities have been observed for all sulfonic cation exchangers [
24,
31,
32,
41].
The hydration numbers of alkaline and alkaline-earth metal ions were also calculated. In
Figure 10, the
1H chemical shift temperature dependences for Li
+, Na
+, and Cs
+ Nafion ionic forms are shown.
In
Table 3, the
h values of Li
+ calculated from Equation (4) at different
λ are indicated. As shown in
Table 3, at
λ < 10.7 hydration number
h of the Li
+ cation is lower than (4), which is equal to
h for aqueous salt solutions. Hydration numbers for Na
+ and Cs
+ cations at the maximum water content are 6 ± 1 (
λ = 10 at 98%
RH) and 1 ± 0.2 (
λ = 4 at 98%
RH), respectively [
60].
Another way of estimating the cation hydration number is an analysis of the water
1H chemical shift humidity dependences [
25,
31,
32,
33,
35,
36,
41].
In
Figure 11, these dependences for H
+, alkaline, and alkaline-earth metal cations in the perfluorinated sulfo cation-exchange membrane MF-4SC are shown.
Hydrogen numbers, hydration heat, and a part of the cleaved hydrogen bonds, as a result of cation polarization, are given in
Table 4. The
h value, as well as a part of the cleaved hydrogen bonds, increases with increasing hydration energy.
Some examples of the cation hydrated structure in Nafion 117, Flemion SH-120 (EW 909), and LSH-180 (EW 1099) are shown in
Figure 12.
High-resolution
7Li,
23Na, and
133Cs NMR provides the possibility to calculate a part of the cations Li
+, Na
+, and Cs
+ interacting with SO
3− membrane groups and directly forming contact ionic pairs. The NMR spectrum of these cations is a singlet line, whose chemical shift is the average value of chemical shifts of a cation in contact and separate ionic pairs.
where
δc is the chemical shift of a cation in the contact pair,
pc is a relative part of the contact ionic pairs,
δs is the chemical shift in the separate ionic pair, and
ps is a part of the separate ionic pairs. Additionally,
δc is the chemical shift at low humidity when all cations are fixed to SO
3− groups and
δs is the chemical shift of a fully hydrated cation. Cation NMR linewidth is the widest for contact ionic pairs and narrowest for separate ionic pairs. The linewidth is inverse to the cation mobility 1/
τd, where
τd is the quadrupole interaction correlation time.
In
Figure 13, the dependences of contact ionic pairs
Pc (a) and relative ionic mobility
τd (b) of Na
+ and Cs
+ cations on the water molecule amount per SO
3− group
λ is shown. The value of
Pc is lower, but the translation jumping frequency
A/
τd is higher for the sodium cation as compared to the cesium cation.
Let us examine the mixture of the Nafion ionic form containing high hydration energy Na
+ cation and low hydration energy Cs
+ cation. In the mixed ionic form, the average water content at the maximum humidity is lower than that for the individual Na
+ form, but higher than that for the individual Cs
+ form. Therefore, by the variation of Na
+ and Cs
+ concentrations we can change the average value of
λ. Thus, as shown in
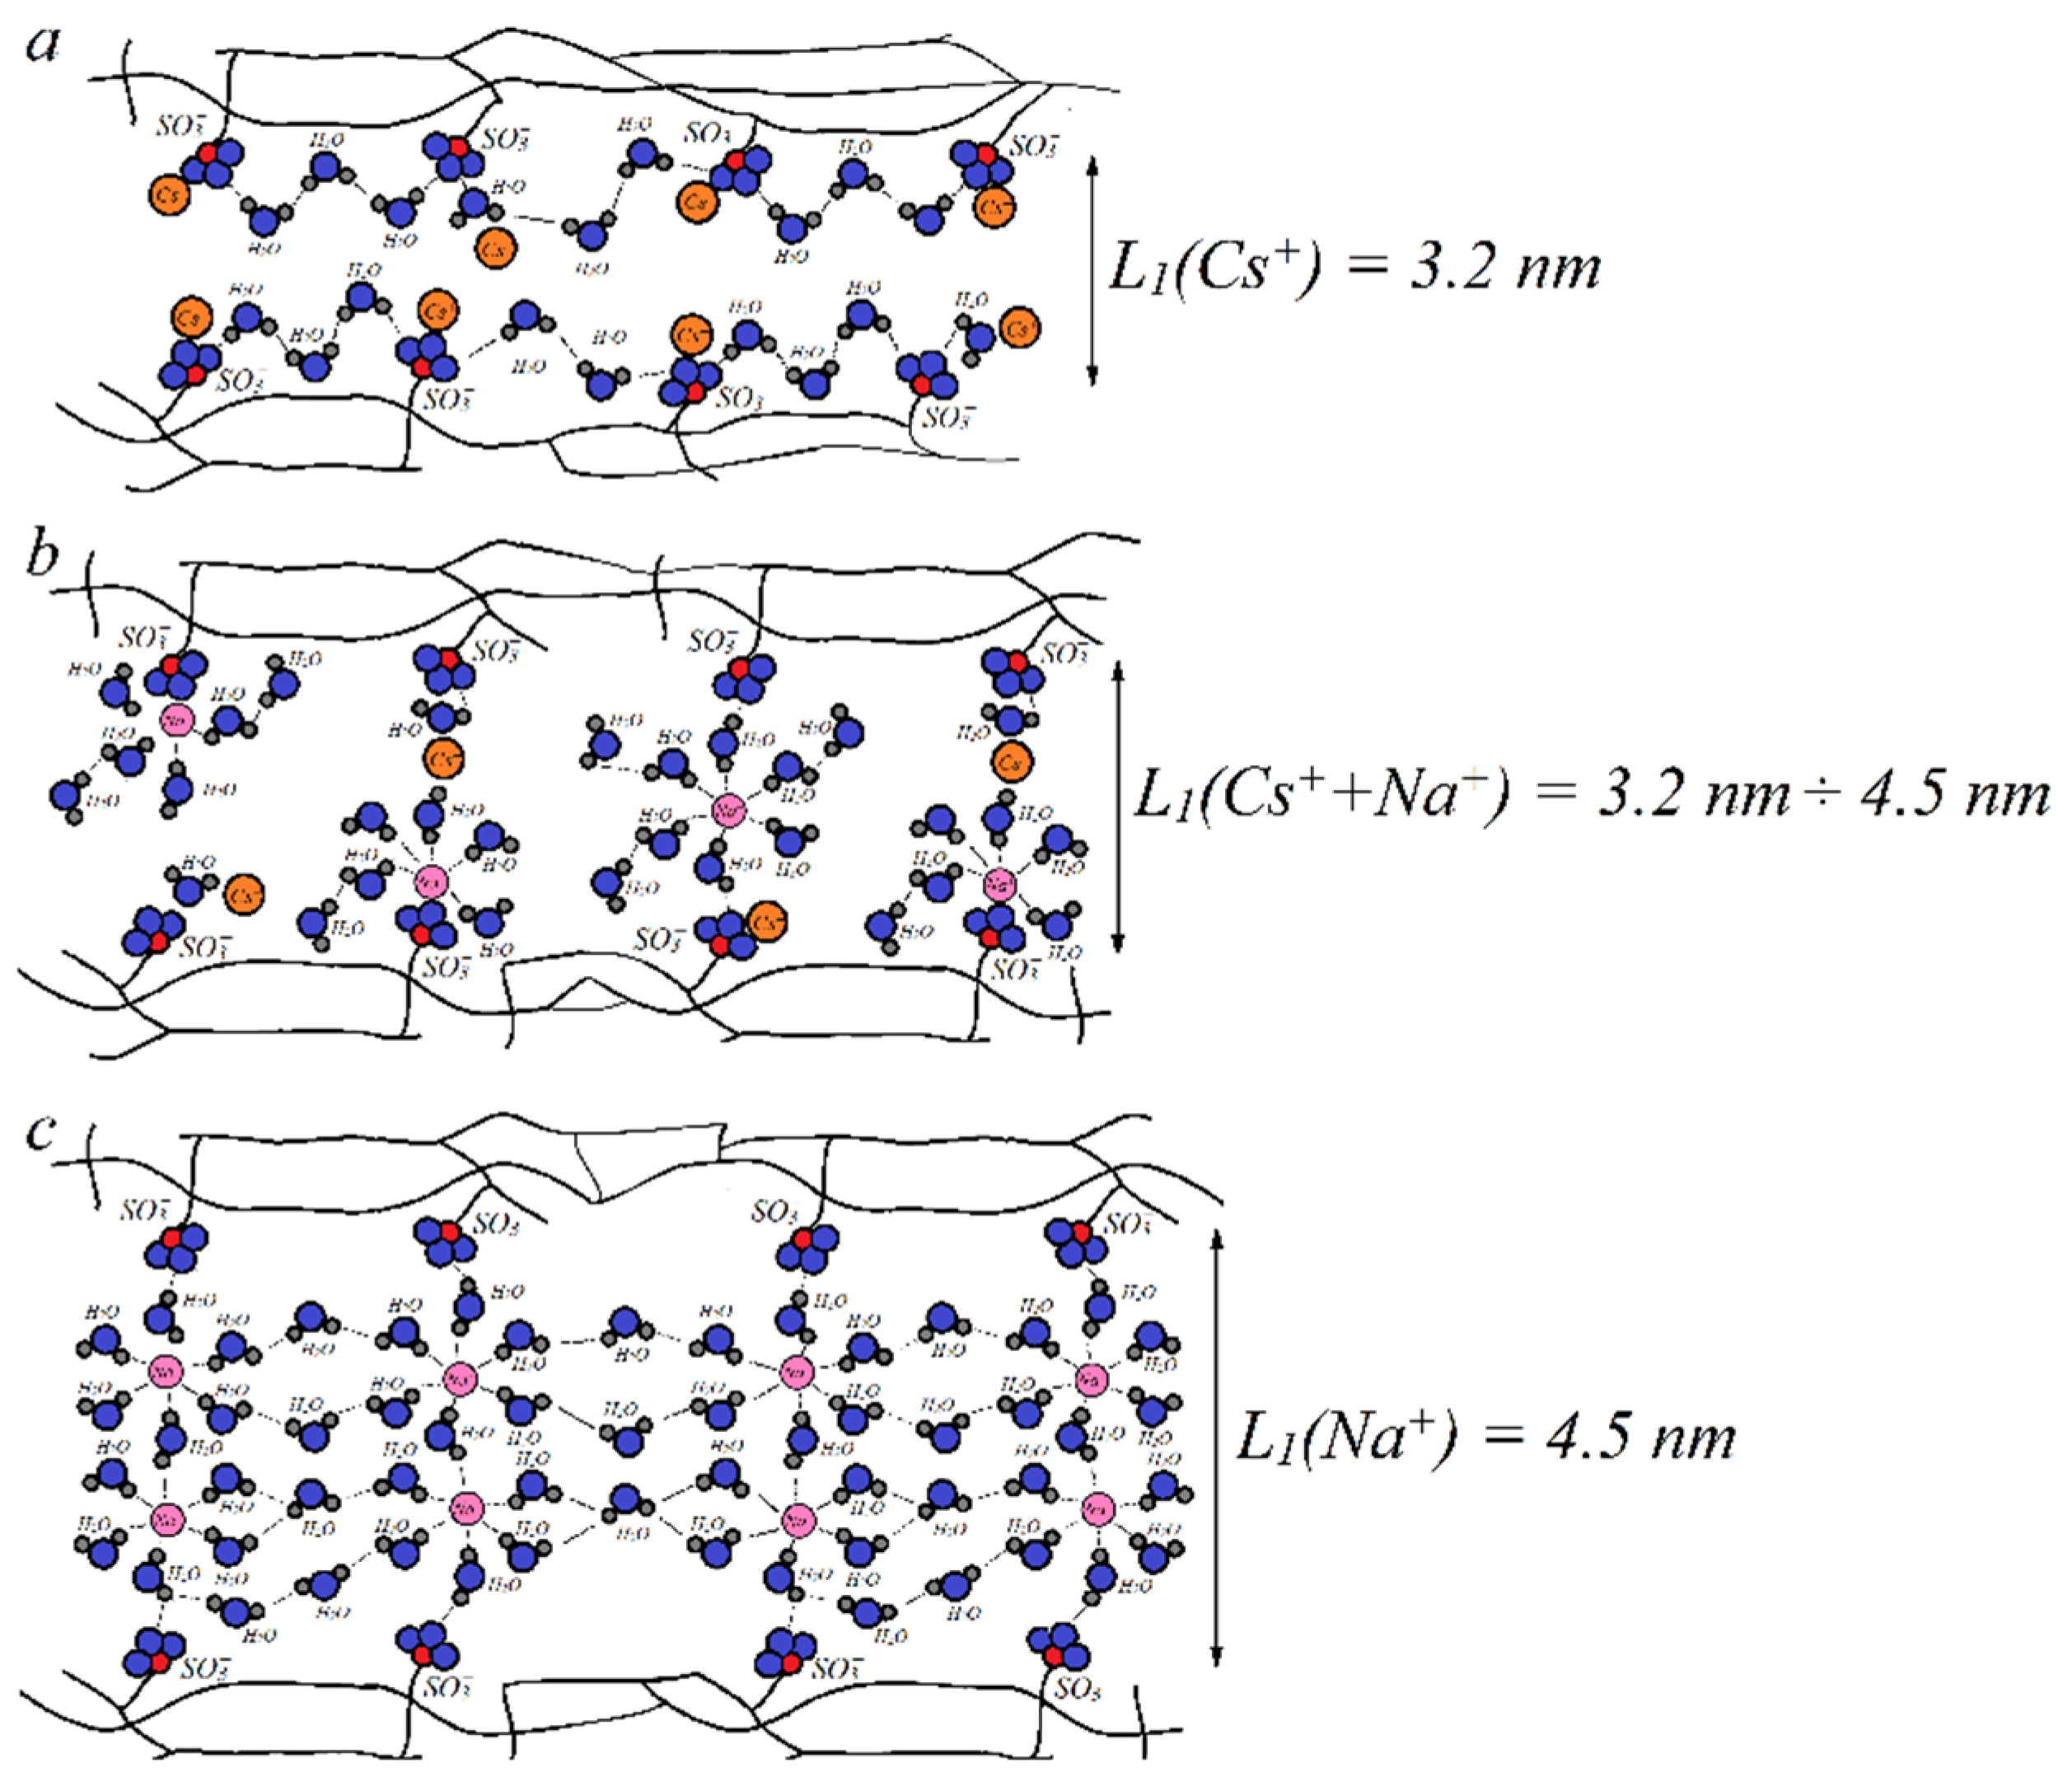
Figure 13, it is possible to vary the relative part of contact or separate ionic pairs for each cation. For example, we can make conditions for Na
+ to form contact ionic pairs, but Cs
+ and SO
3− are separated by the water molecule (
Figure 14b). Therefore, the cesium cation mobility is higher compared to the sodium cation mobility. The channel width
L1 increases with increasing water content
λ. The value of
λ in the mixed Na
+ + Cs
+ ionic form is lower than that in the Na
+ form, but higher than that in the Cs
+ form. Therefore, the
L1 value in the mixed form is between the channel width of individual Na
+ and Cs
+ forms. Thus, another reason for increasing Cs
+ mobility in the Na
+ + Cs
+ ionic form is a higher width diffusion channel compared with individual Cs
+ (
Figure 14a,b). The narrowing of the channel width
L1 in the mixed ionic form opposite to the individual Na
+ form is an additional reason for decreasing sodium cation mobility (
Figure 14b,c). Therefore, the detailed NMR investigations gave an opportunity to understand the microscopic mechanism of membrane selectivity of sulfo-containing membranes in regard to the alkaline metal cations. These results may be a guide for the development of new materials.
The water and cation behavior at subfreezing temperatures is controlled by membrane hydration particularities. The DSC shows a peak at temperatures below 0 °C, which is explained by freezing of the so-called “unbounded” water forming the ice phase, whereas another part of water (“bounded” water) remains mobile [
41,
106]. The amount of these two types of water is calculated from the DSC results [
106].
High-resolution
1H NMR of water molecules is a direct way to calculate the number of mobile water molecules, whereas no NMR spectrum of ice water is observed. It was shown that starting from
λ ≈
h a mobile water amount does not decrease at a low temperature [
56,
75,
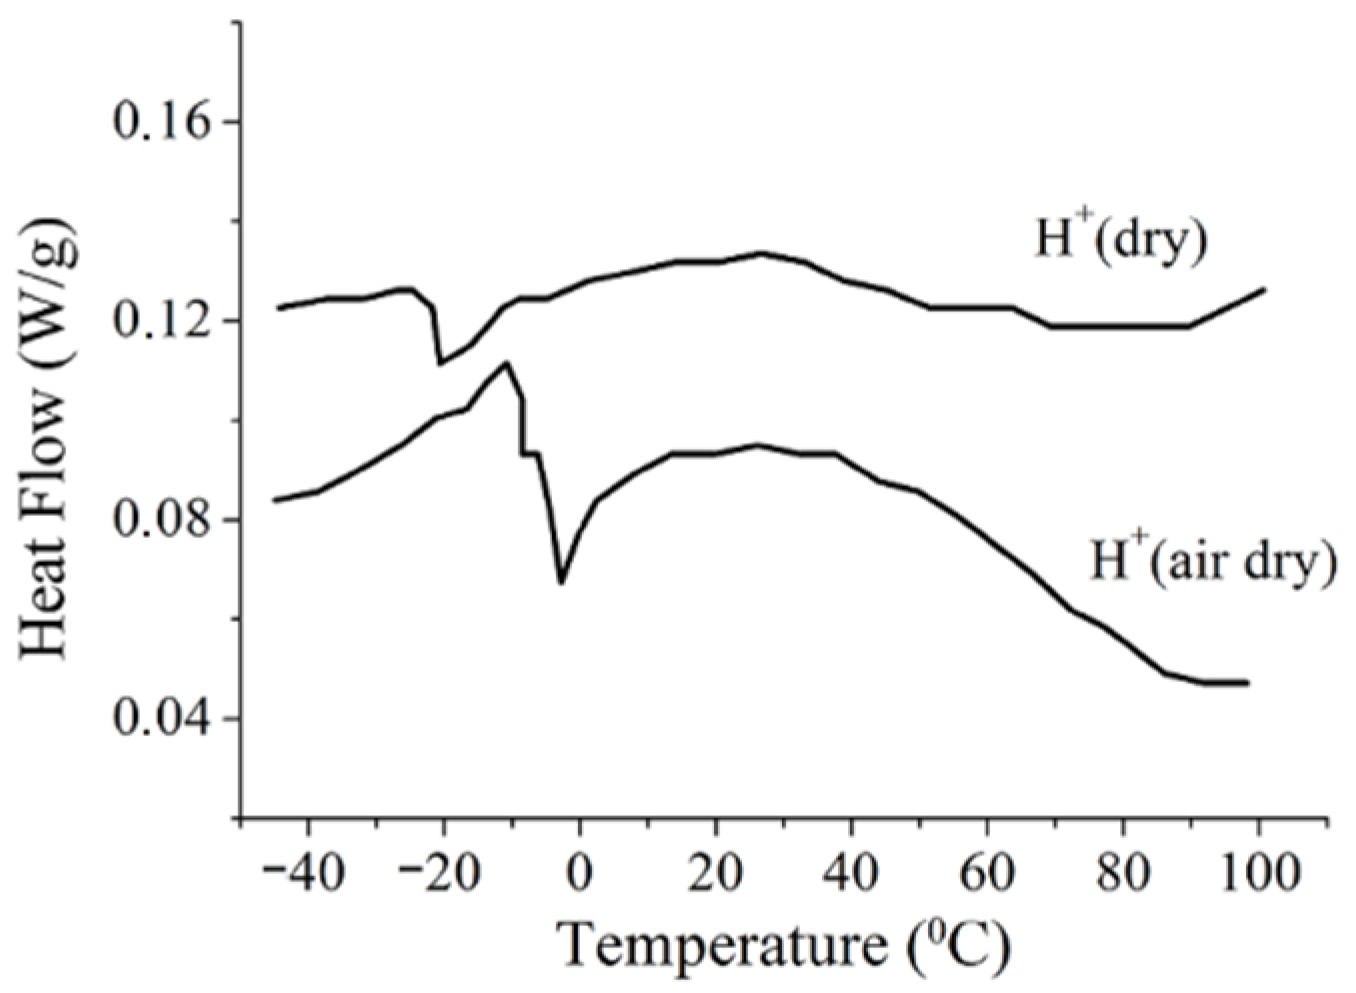
76]. This result agrees with the DSC data: with decreasing humidity only bounded water remains, which cannot form ice because its molecules form hydrogen bonds with the polymeric matrix; therefore, the DSC peak should disappear. As shown in
Figure 15, the DSC signal is observed even in a dry sample at
λ = 2, whereas the molecules remain mobile until −60 °C at
λ ≤ 10 (
Figure 16).
At higher
λ, water is adsorbed in macropores and forms the ice phase at the freezing temperature [
41,
107]. The similar phenomenon was observed in the Li ionic form of the Nafion membrane (
Figure 17) [
24,
60] and in the membrane based on polystyrene [
34].
As shown in
Figure 17, water and Li
+ cations are mobile at −40 °C at
λ ≤ 10.7.
The discrepancy between the DSC and NMR data was explained on the basis of the
1H spin-relaxation data [
25,
44]. It was concluded that at the freezing temperature, water molecules form additional hydrogen bonds with the formation of associates, which remain mobile. The formation of these hydrogen bonds is accompanied by the appearance of the DSC peak. This explanation is confirmed by the
1H chemical shift temperature dependences. As shown in
Figure 7 and
Figure 8, the slope of the chemical shift temperature dependence curves increased below 0 °C, which indicates the formation of extra hydrogen bonds.
The NMR method was applied to a water freezing investigation in pores of cellulose acetate membranes. As shown in
Figure 18, in narrow pores (2–10 nm) water is bounded with pore walls and cannot transform into ice (
Figure 18a). With increasing pore width, water molecules located far from pore walls tend to transform into microcrystals of ice (
Figure 18b) and a separate ice phase (
Figure 18c) [
107].
4. Water and Cation Self-Diffusion
The water and cation self-diffusion coefficients were measured by pulsed field gradient technique (PFG NMR). The stimulated echo sequence was used.
The evolution of spin echo signal (diffusion decay) is described by the following equation:
where
γ is the gyromagnetic ratio of
1H,
7Li,
19F,
23Na, and
133Cs;
g is the gradient pulse amplitude;
δ is the gradient pulse duration;
td = Δ−
δ/3 is the diffusion time; Δ is an interval between gradient pulses; and
D is the self-diffusion coefficient. The details of self-diffusion coefficient PFG NMR measurements are given in [
24,
25,
37,
41,
46,
100,
108].
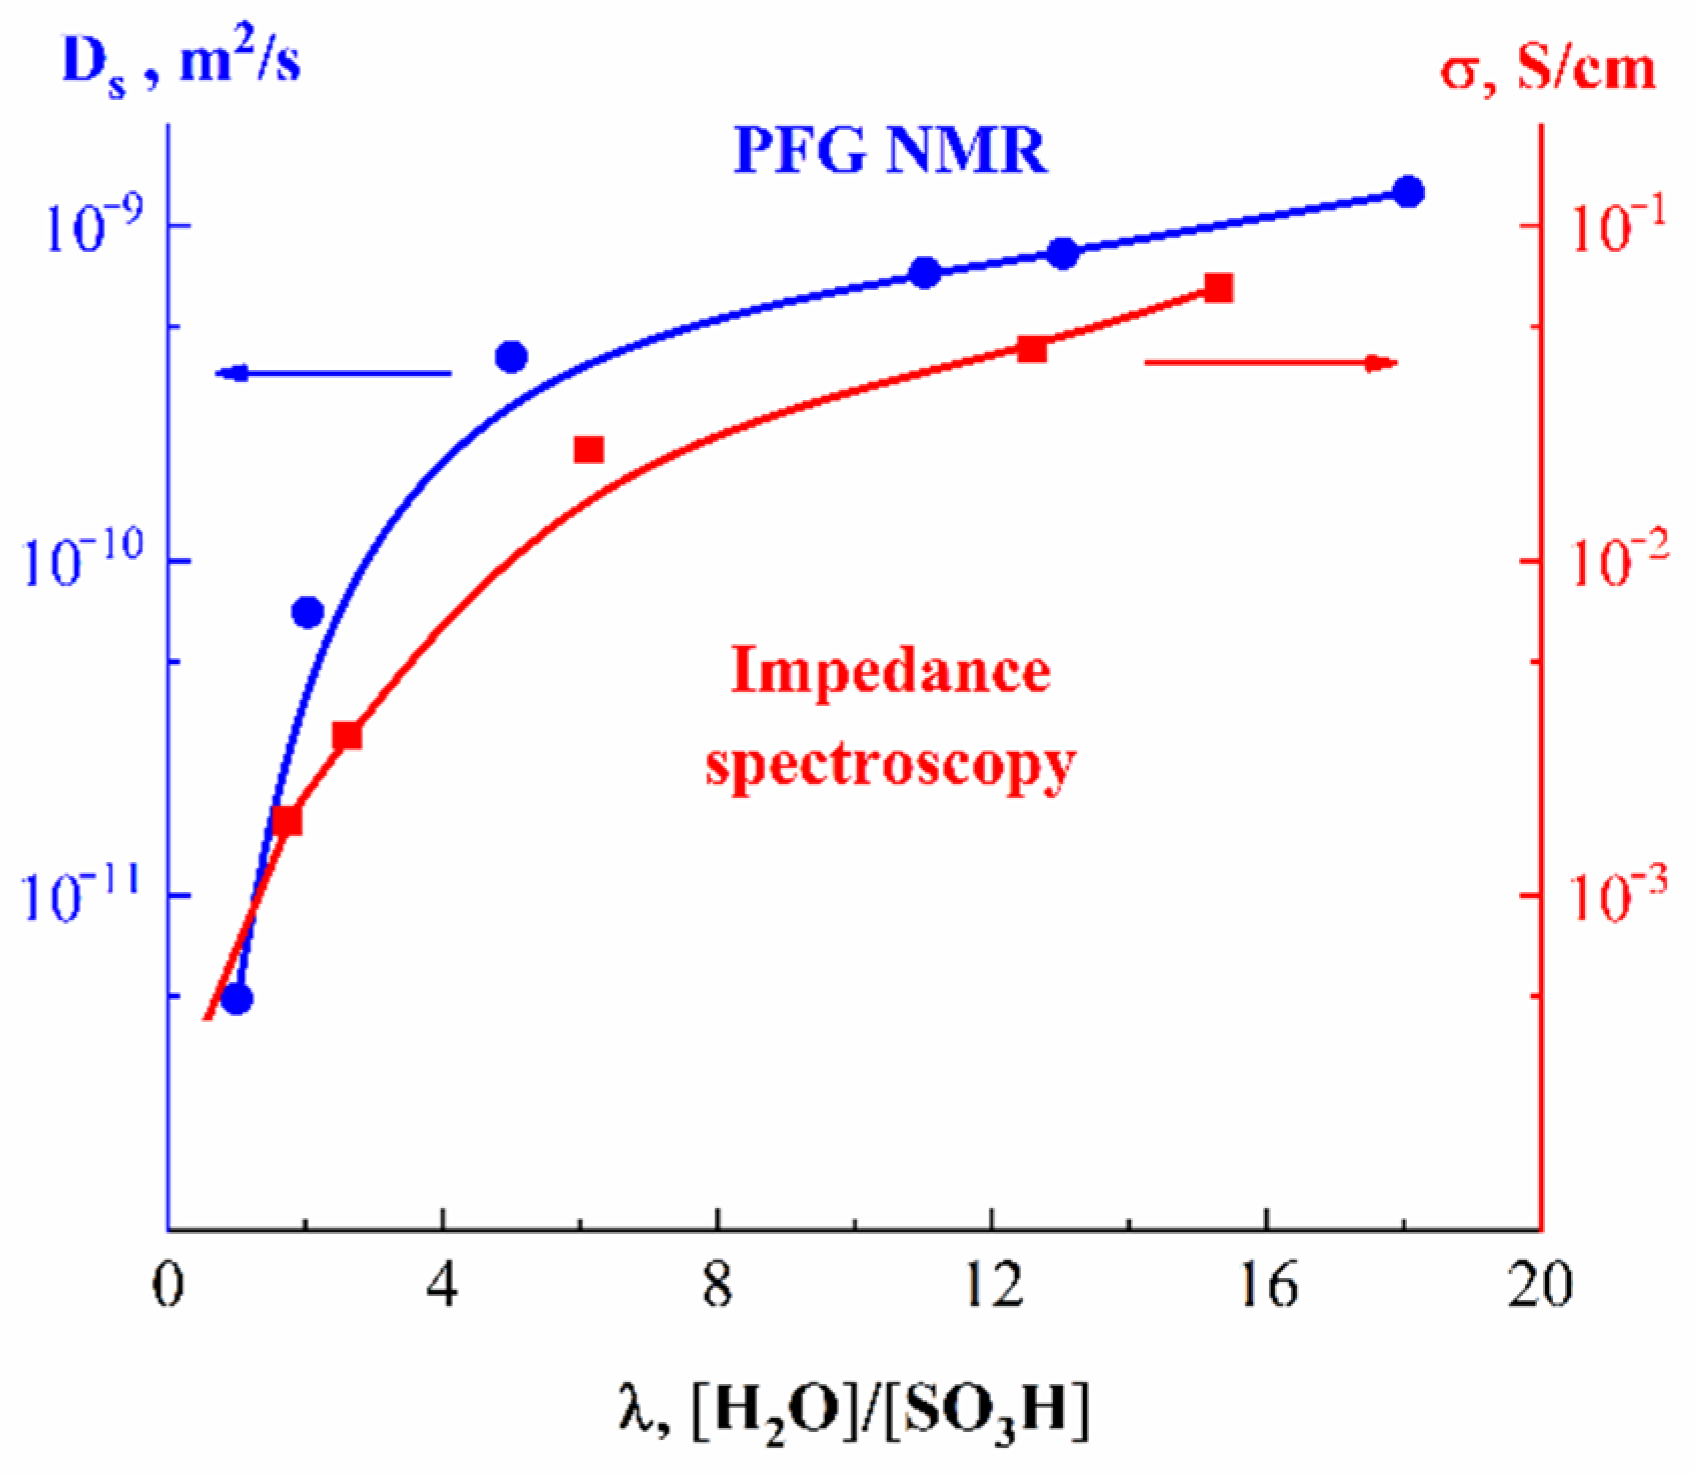
In
Figure 19, the humidity dependences of the water self-diffusion coefficients measured by pulsed field gradient NMR and proton conductivity in the perfluorinated sulfo cation-exchange MF-4SC membrane are shown. These dependences are similar, indicating that the ionic transfer is controlled by the water translational mobility. The same character was observed for other membranes. In
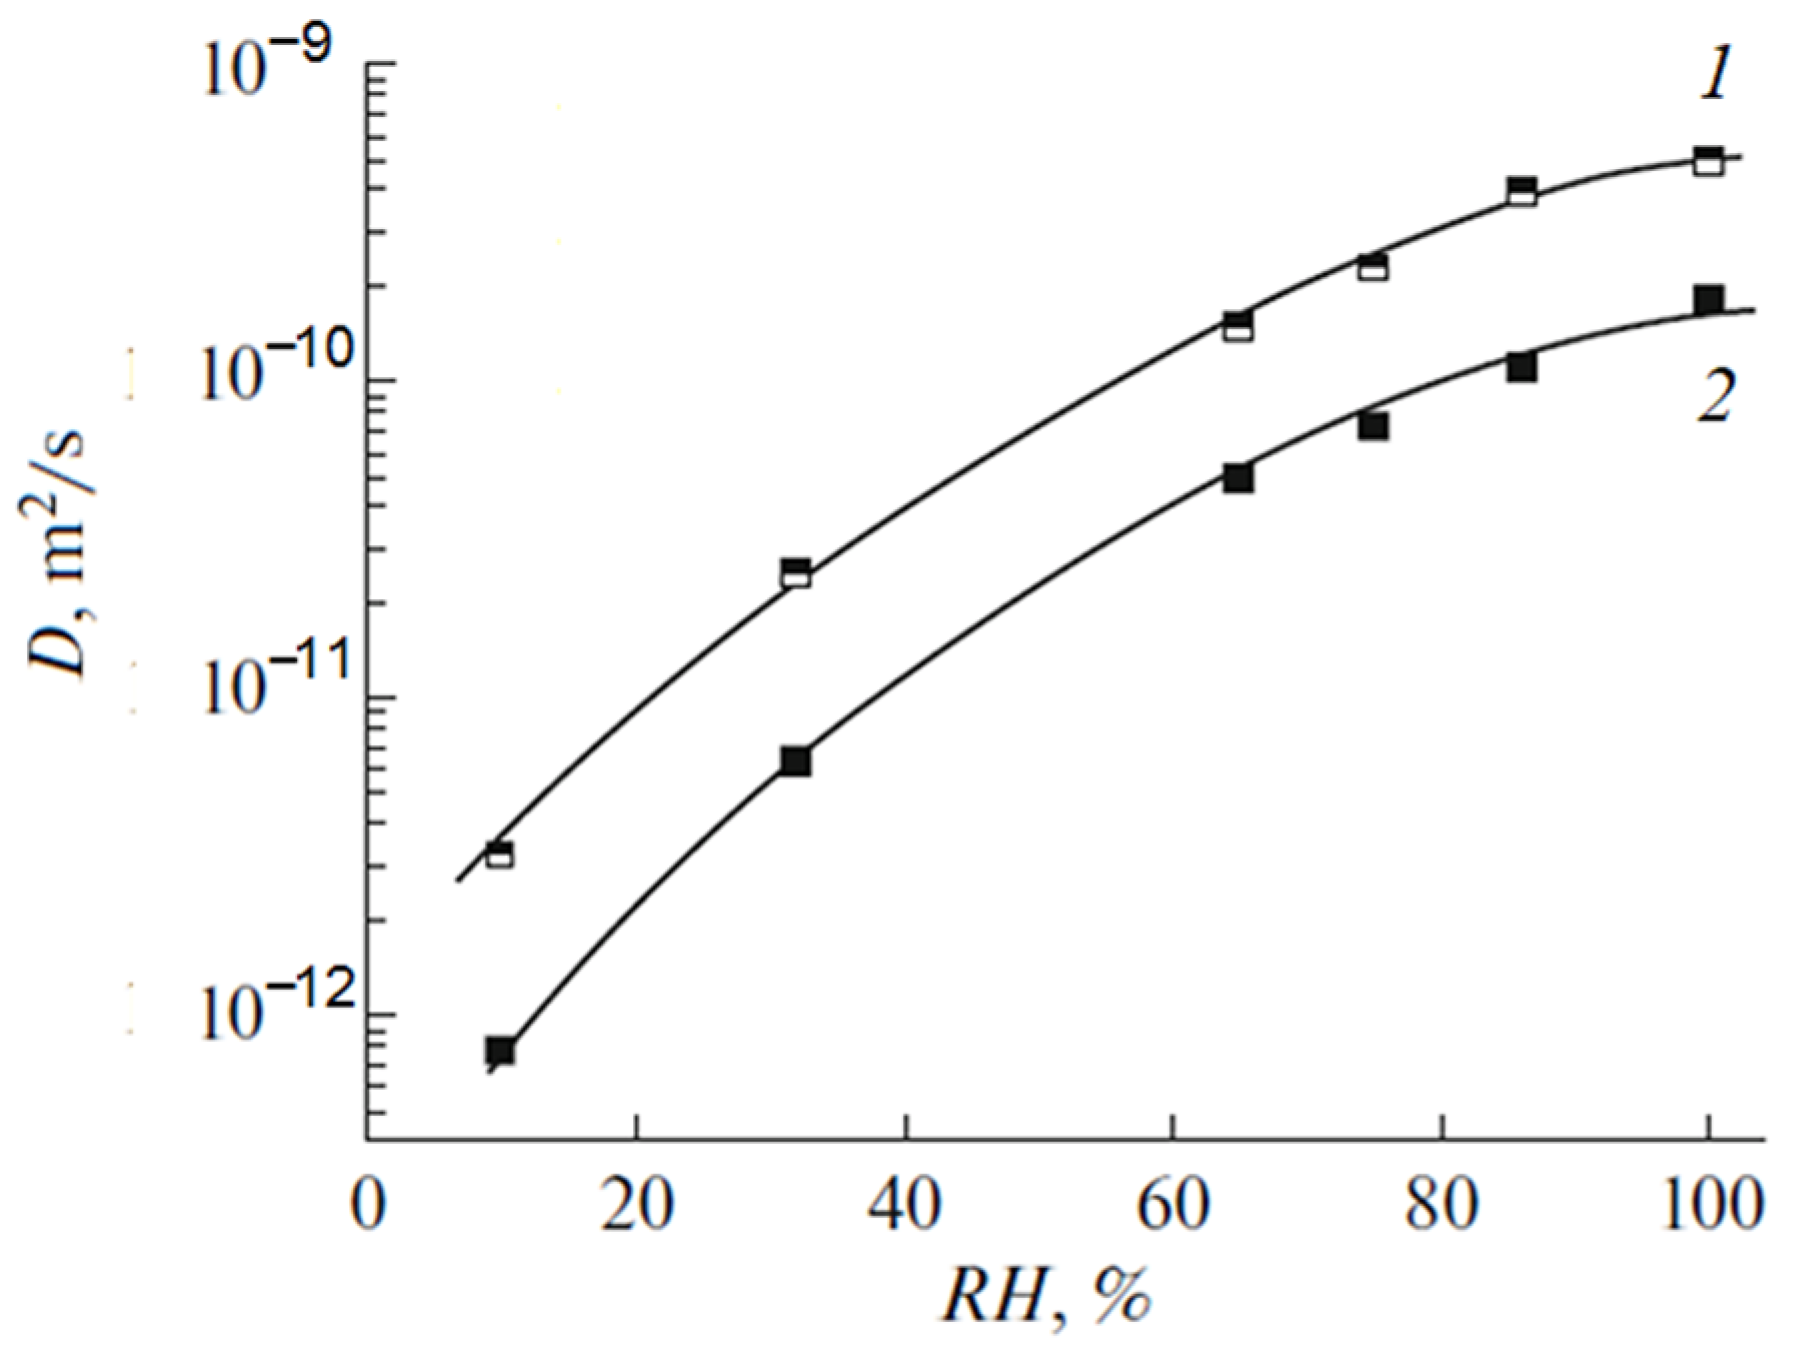
Figure 20, the average water self-diffusion coefficients and diffusion coefficients calculated from the Nernst–Einstein dependences (Equation (7)) on the relative humidity are given for the membrane based on polyethylene and grafted sulfonated polystyrene (MSC) [
109,
110,
111].
where
n is the number of charge carriers, cm
3;
D is the self-diffusion coefficient, m
2/s;
e is the electron charge, 1.9 × 10
–19 C;
k is the Boltzmann constant, 1.38 × 10
–23 J/K; and
T is the temperature.
These dependences are symbate. The ionic conductivity humidity dependence also shows the threshold character. The threshold shape dependences of the water self-diffusion coefficients on humidity are observed for all types of ion exchangers. For example, the water self-diffusion coefficient humidity dependences for a sulfo cation exchanger based on the copolymer of styrene and divinylbenzene MC-44, sulfonated polystyrene membrane MC-40, and macropore sulfo cation exchanger are shown in
Figure 21. These dependences are very similar for all ion exchangers.
The water self-diffusion coefficients are essentially higher compared with the calculated diffusion coefficients. This difference will be discussed below.
The direct measurement of the Li
+ cation self-diffusion has shown that the cation and water molecule self-diffusion coefficient humidity dependences are also similar (curve 1 and curve 2 in
Figure 22).
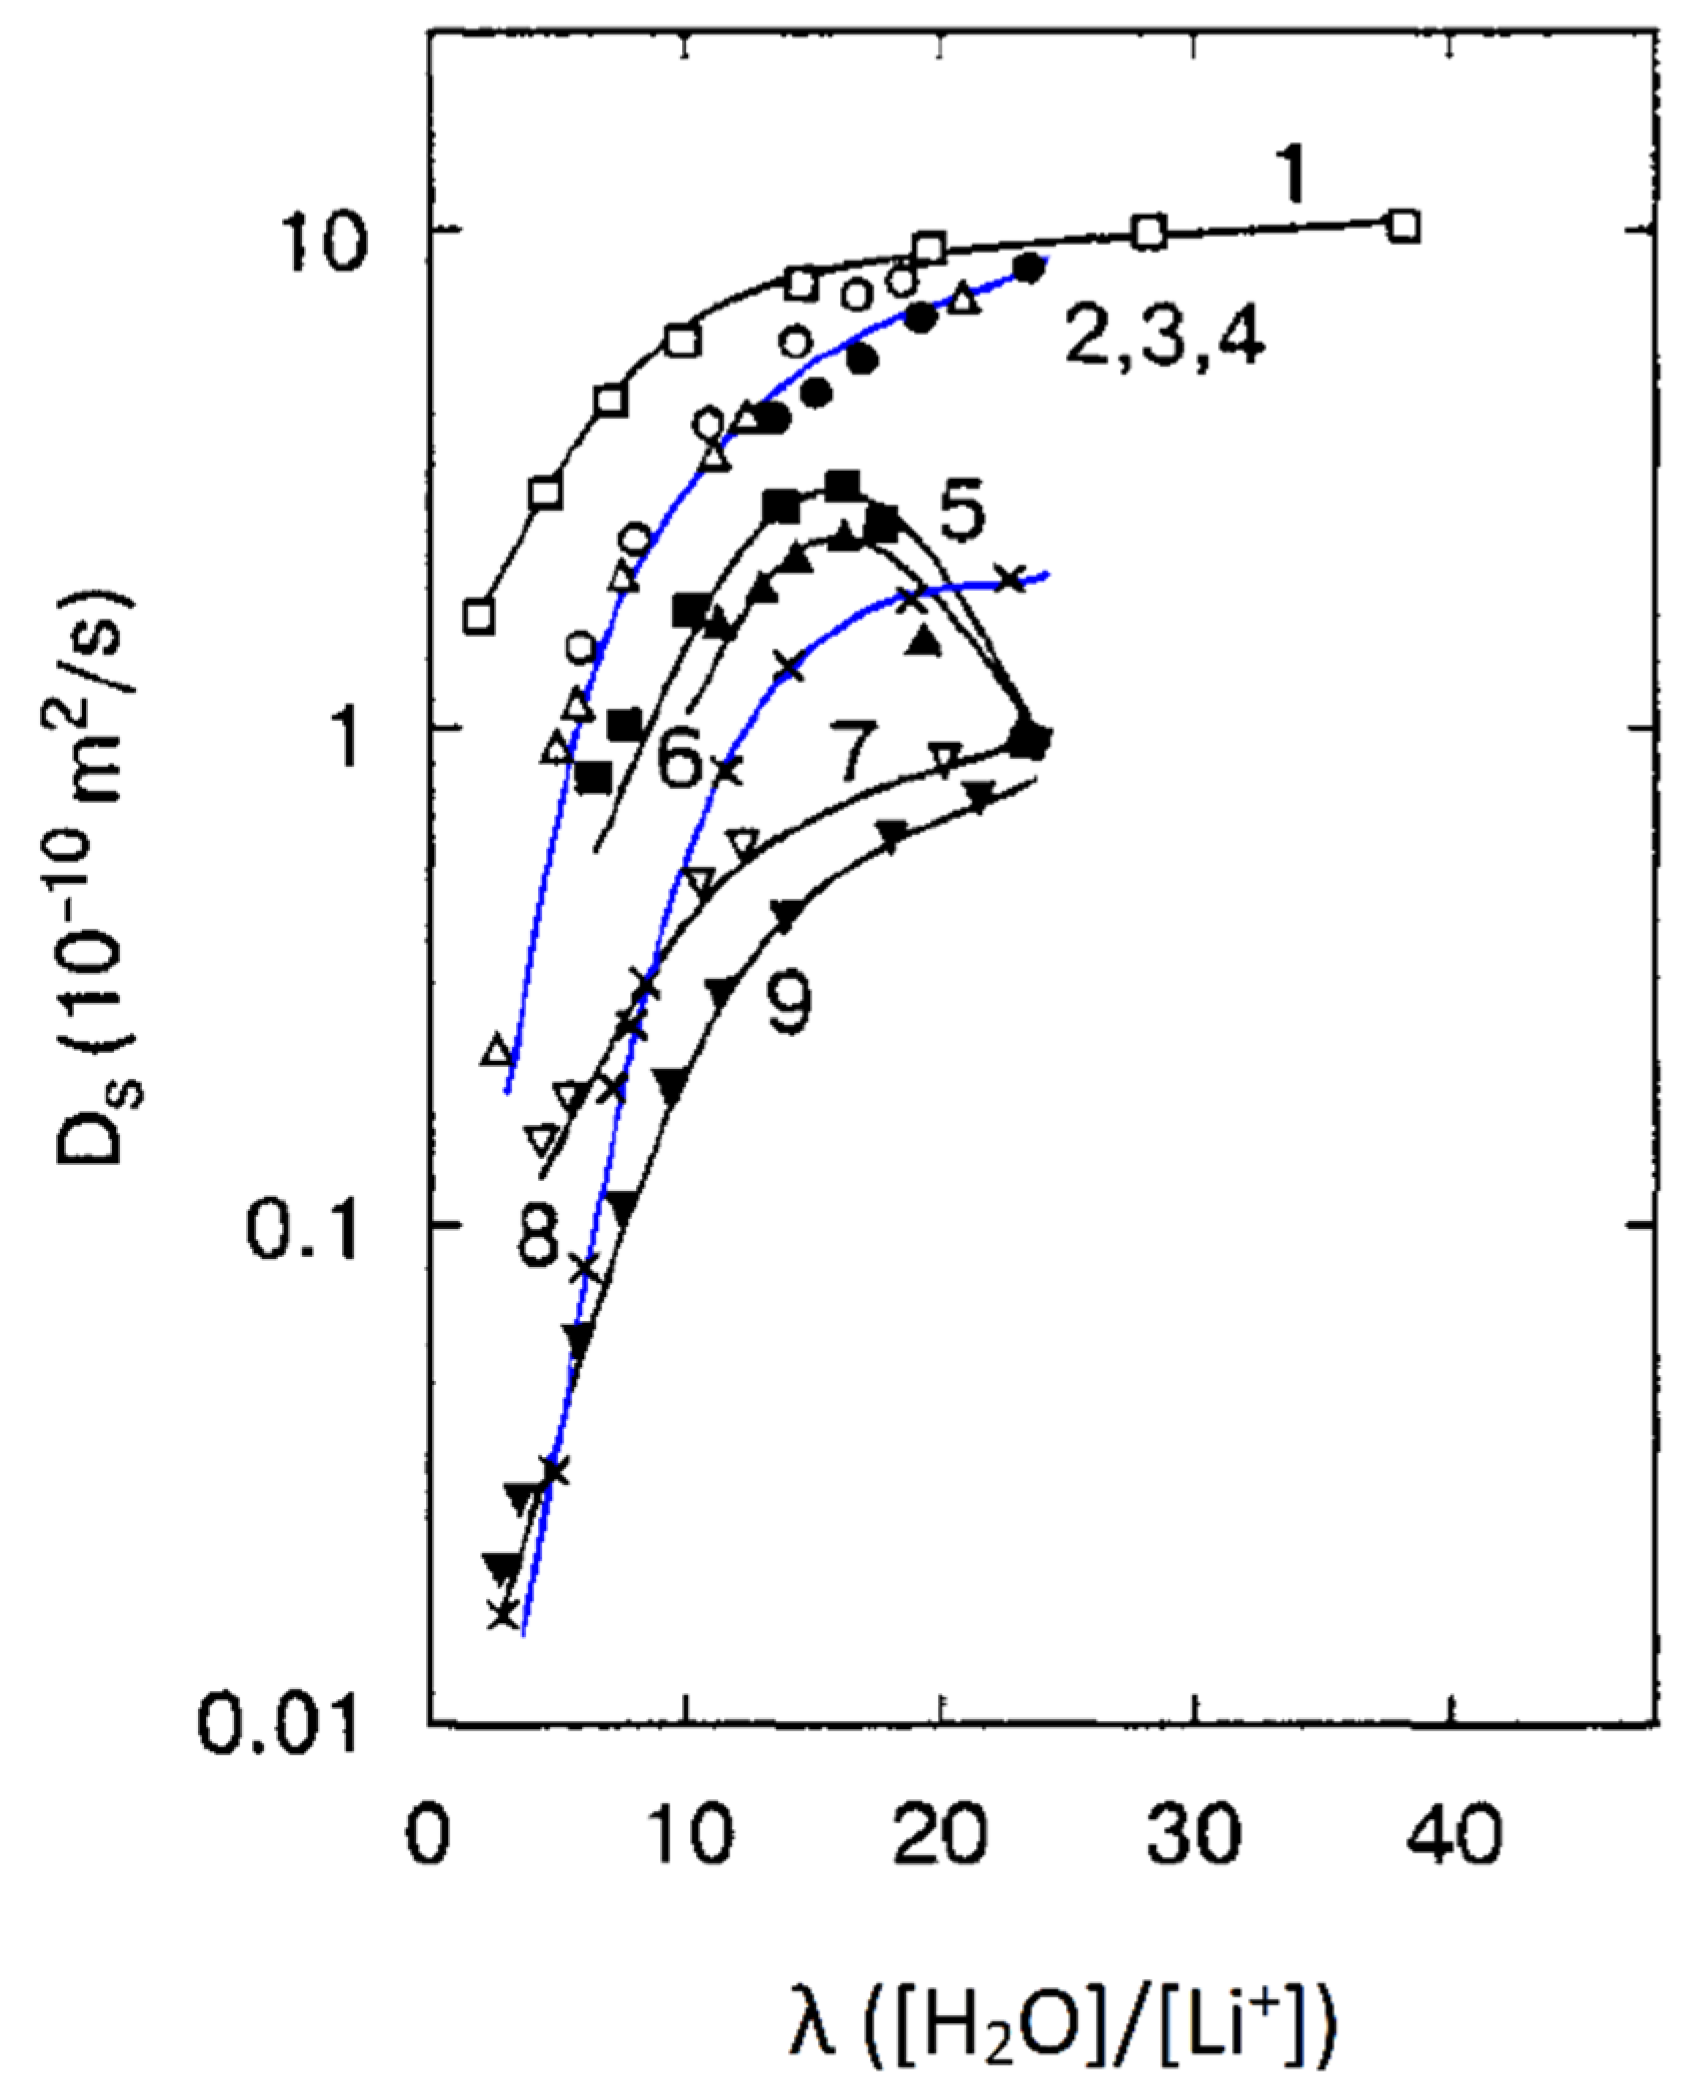
First of all, the results on the water and cation self-diffusion humidity dependences should be considered. The self-diffusion coefficients of water at different humidities are shown in
Figure 23 for acid forms and Li
+, Na
+, and Cs
+ ionic forms of sulfo MF-4SC and carboxylic F-4CF perfluorinated membranes. At the same λ self-diffusion coefficients of water in membrane MF-4SC and F-4CF salt forms are close to each other. In the Cs
+ ionic form, the water self-diffusion coefficients are higher compared to those for the Li
+ and Na
+ ionic forms. In the acid ionic form, the self-diffusion coefficient in the sulfo-containing membrane is two to three orders of magnitude higher than that in the carboxylic membrane (curve 1 and curve 5,
Figure 23). The restriction diffusion (decreasing self-diffusion coefficient with increasing diffusion time) occurs and the size of the restriction region is about 1 µm (
Figure 24). It may be evidence for internal hydrogen bond formation between carboxyl groups.
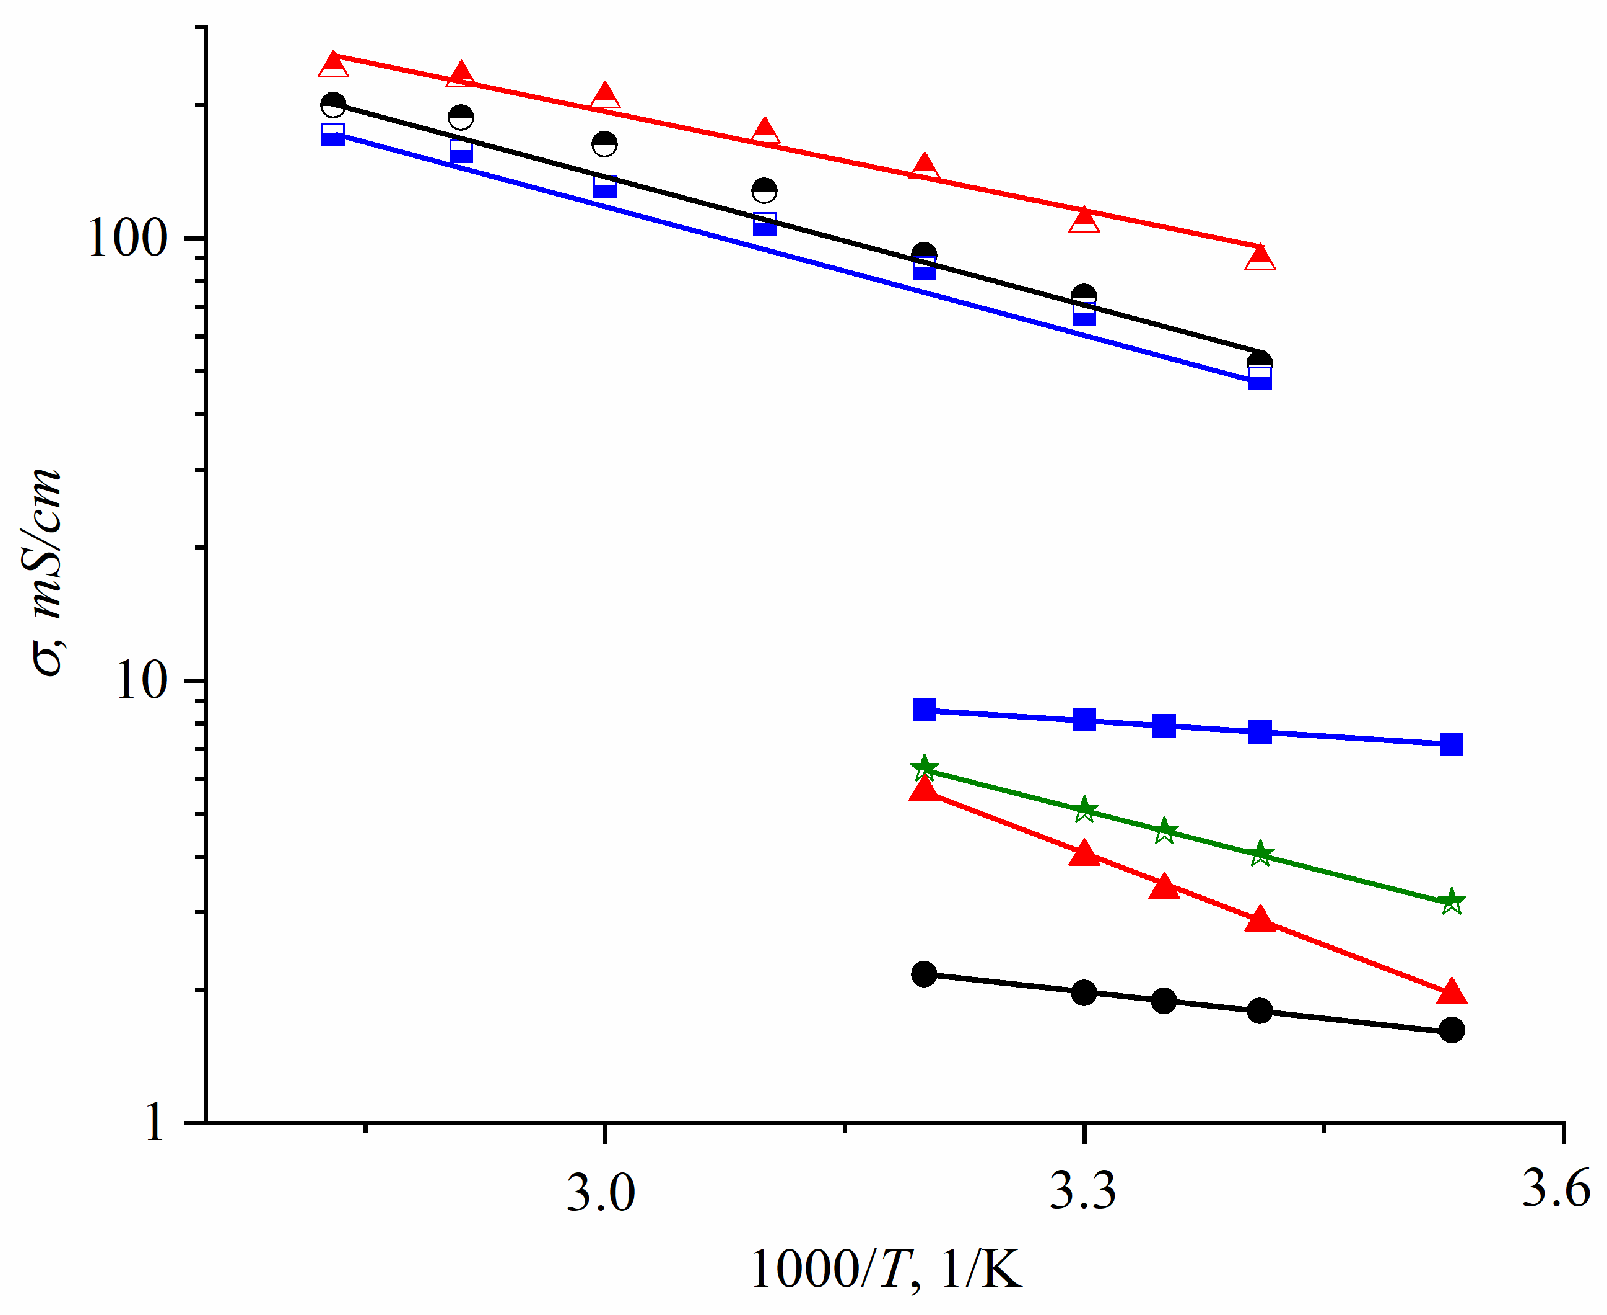
The ionic conductivity humidity dependences are quite similar to the water self-diffusion coefficient temperature dependences (
Figure 25).
In
Table 5, the experimental ionic conductivities are compared with the conductivities calculated from Equation (7). These values are very close to each other, indicating the correlation character of water and cation translational mobility. The better agreement of NMR diffusion and conductivity data was obtained for Li
+, Na
+, and Cs
+ cations, whose self-diffusion coefficients were measured.
As shown in
Table 6, the calculated conductivities are slightly higher compared to the measured values. There is a principal reason for this difference. In the PFG NMR experiment, all cation translational motions are fixed, which is not obligatory, and accompanied by transfer along an applied electric field, such as it takes place in conductivity measurements. It should be expected that the agreement will be better in an electrophoretic NMR experiment with the application of an external electric field [
25]. As indicated in
Table 6, at relative humidity
RH = 98%
λ are 12, 10, and 4 for the Li
+, Na, and Cs
+ ionic forms, respectively, and the cation self-diffusion coefficients have changed in the following sequence: Li
+ ≈ Na
+ > Cs
+.
In the MSC membrane with a higher water capacity, the inverse sequence is observed, Li
+ < Na
+ < Cs
+, which is of the same order as that in salt aqueous solutions. The cation self-diffusion activation energy increases from Li to Cs in the Nafion membrane, but is independent of the cation type in MSC and chloride aqueous solutions (
Table 7). The sequence Li
+ < Na
+ < Cs
+ indicates that the cation hydration radius, hydration enthalpy, and ionization energy decrease in this row (
Figure 26 and
Figure 27) [
35,
112].
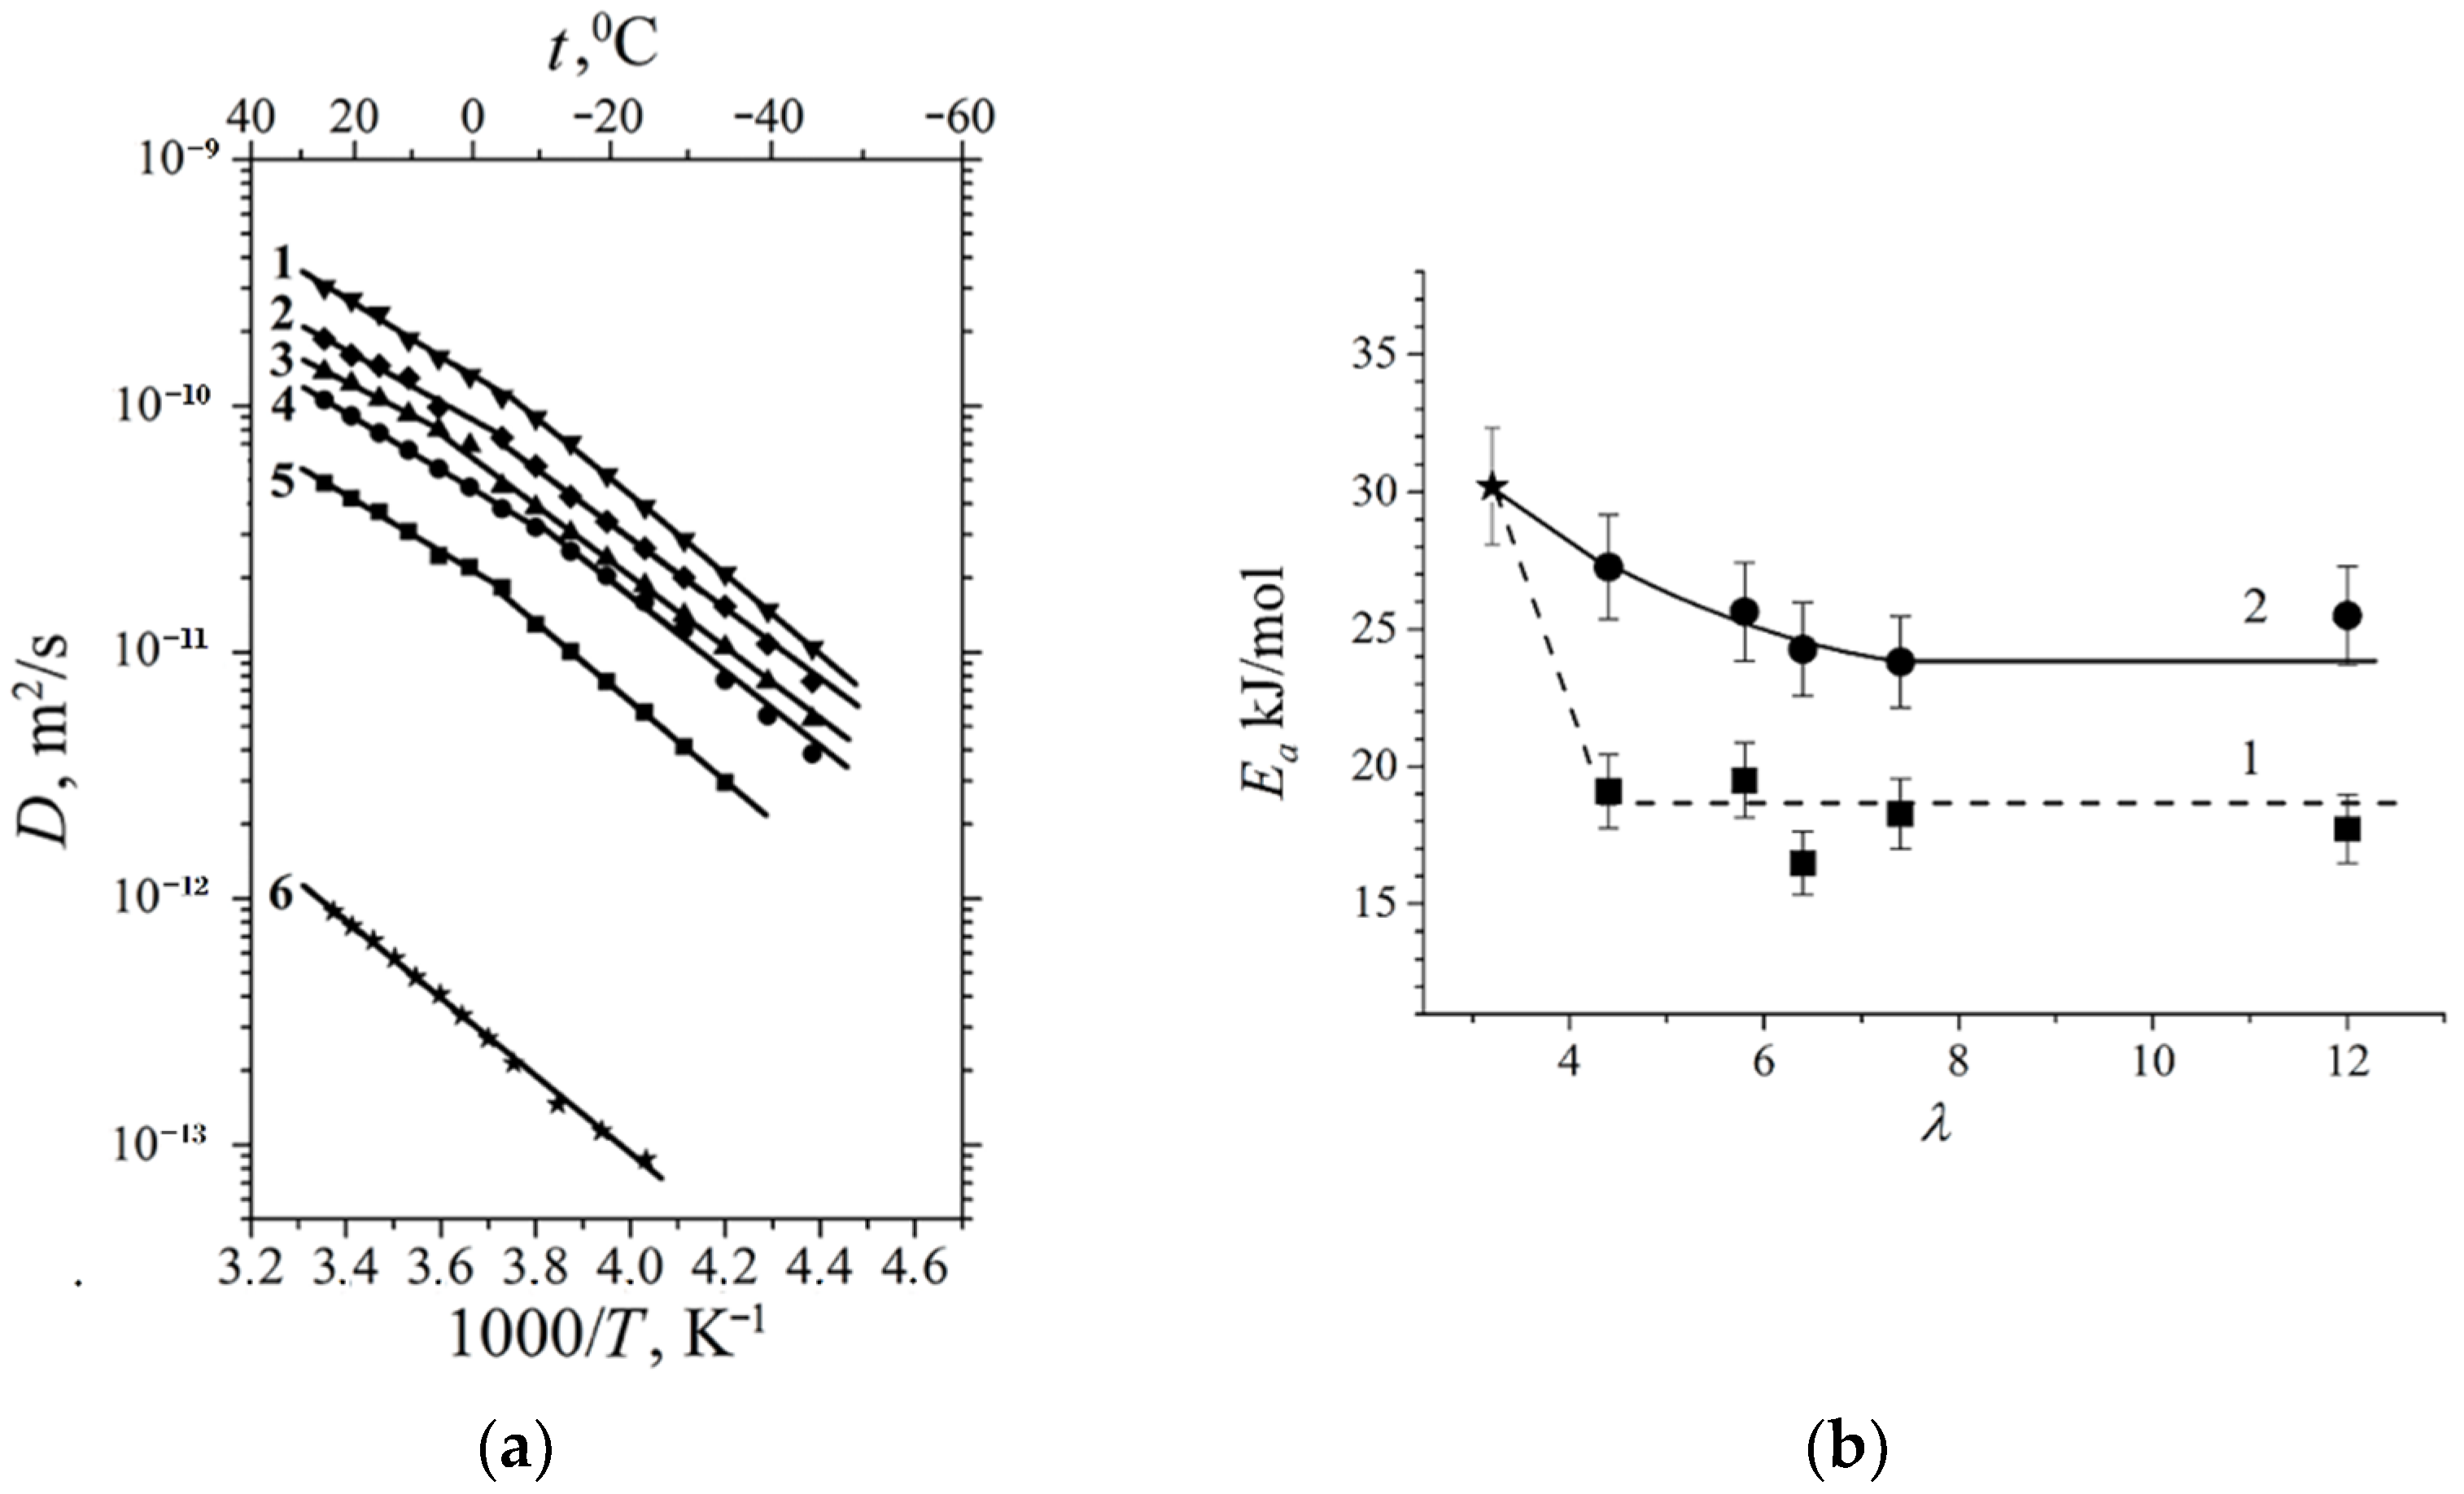
The temperature dependences of the water and cation self-diffusion coefficients are approximated by the Arrhenius equation:
where
D0 is temperature independent,
R is the gas constant,
T is absolute temperature, and
Ea is the self-diffusion activation energy.
The water molecule and cation self-diffusion activation energies increase with membrane dehydration, and the cation activation energy is higher than that of water (
Table 8).
At a high-water content, the slope of the self-diffusion and conductivity temperature dependences have changed and are characterized by two activation energies (high- and low-temperature ranges in
Figure 28).
At a low water content (
λ ≤
h), the slope of the temperature curve does not change in the whole temperature range (curve 6,
Figure 28a,b,
Figure 29 and
Figure 30). The same peculiarity of the temperature dependence is observed for other types of membranes (
Figure 29 and
Figure 30) and for the ionic conductivity temperature dependence (
Figure 31).
Usually, the change in the temperature curve slope is explained by frozen unbounded water, which forms a separate ice phase. This is equivalent to decreasing hydrated water content
λ and increasing activation energy. As shown in
Figure 28a, the slope change is observed at lower
λ compared to the value when water is still mobile below 0 °C. From our point of view, the reason for this rupture is the association of water molecules at the freezing temperature. The associated molecule self-diffusion activation energy is higher in the low-temperature range compared to bulk-like molecules at high temperatures. At a low humidity, all water molecules are fixed and the hydrogen bond network and activation energy are the same in the whole temperature range.
In cation-exchange membranes based on polyethylene and sulfonated grafted polystyrene (MSC), the experimental ionic conductivities are an order of magnitude lower compared to the values calculated from Equation (7) (
Figure 32) [
35].
This distinction is typical of membranes based on sulfonated polystyrene.
As mentioned above for these types of ion exchangers, the cluster-channel nanostructural model is suitable for the ion and molecular transfer. A version of this model, similar to the Gierke model, is shown in
Figure 2. The pulsed field gradient NMR-measured self-diffusion coefficient is an average value of particles moving rapidly in clusters and slowly in channels, whereas the ionic conductivity is limited by slow passing through narrow channels.
The main disadvantage of all sulfo cation-exchange membranes is a low ion and water translational mobility and, consequently, conductivity at a low humidity. According to the ion transport mechanism discussed above, a continuous hydrogen bond network is necessary in order to accelerate cation and water molecule motions. This network is destroyed at a low humidity and, therefore, some fragments, which could form additional hydrogen bonds, should be involved in membranes. Inorganic dopants inserted into perfluorinated membranes increase the water mobility and ionic conductivity essentially [
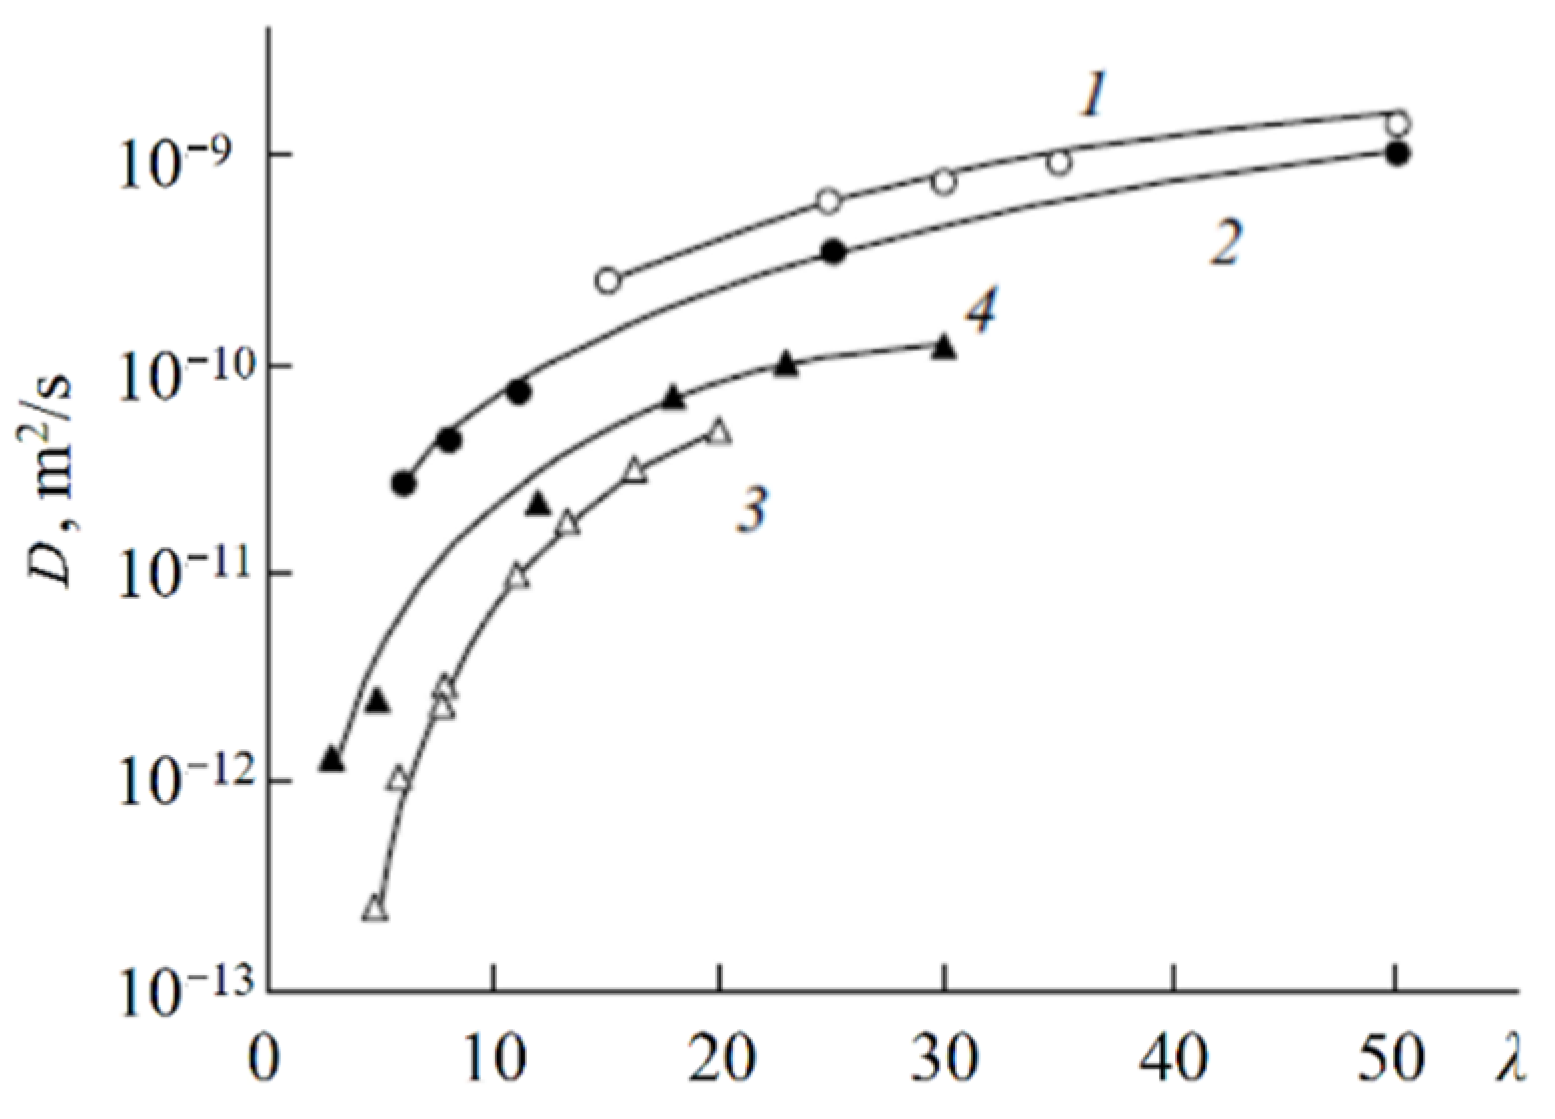
113]. Another way is a membrane synthesis with intermediate oxygen atoms (bridges), such as sulfo-containing aromatic polyamides. In
Figure 33, the dependence of Li
+ self-diffusion coefficients on λ are shown. Compared to perfluorinated membrane MF-4SC in polyamides, the lithium cation self-diffusion coefficient at a low water content is two to three orders of magnitude higher.
Figure 33.
Diffusion coefficients of lithium cations in the system of lithium salt–disulfophthalic acid–water (1 is terephthalic PA-1 in
Figure 34; 2 is isophthalic PA-2 in
Figure 34) as a function of the moisture content in macroporous sulfonate cation-exchange CU-23 (4) and perfluorinated sulfonate cation-exchange membrane MF-4SC (3) [
47]. Exchange capacity, mg-equiv/g: 0.86 for MF-4SC, 5 for macroporous cation exchanger CU-23, 2 for aromatic disulfo-containing polyamides [
24].
Figure 34.
Chemical structure of sulfo-containing aromatic polyamides PA-1 and PA-2.
Figure 34.
Chemical structure of sulfo-containing aromatic polyamides PA-1 and PA-2.
As mentioned above, the nanostructure of homogeneous ion exchangers based on sulfonated polystyrenes contains alternating cluster and channels. Diffusion in heterogeneous systems is more complicated. In [
77] self-diffusion of Li
+ cations and water molecules in macroporous sulfonic cation-exchange resin CU-23 was studied. Macropores fill up with water and contain sulfonate groups on the wall surface only. Therefore, the Li
+ cation moves in the polymer phase through the system of cluster and channels. If a non-exchangeable electrolyte is involved in the macropore, the additional way for cation diffusion appears as a result of Li
+ exchange between the polymer phase and an aqueous solution in a macropore. The dependences of self-diffusion coefficients on the water content
λ and the concentration of external electrolyte LiCl and LiOH aqueous solutions were investigated.
With increasing solution concentration, some part of non-exchangeable sorption electrolytes LiCl or LiOH becomes involved with ion exchangers and the water content
λ decreases. These
λ values were calculated depending on the electrolyte solution concentration. Therefore, in
Figure 35 (curve 6) the dependences of the water and lithium cation self-diffusion coefficients on
λ are shown, where
λ is the amount of water molecules per Li
+ cation. Some rather interesting results were obtained. The water self-diffusion coefficients decreased with decreasing
λ, and these dependences for the samples without an external electrolyte and for water contacting with the electrolytes were confirmed (curves 2, 3, and 4 in
Figure 35). The lithium cation self-diffusion coefficient dependence in the samples without an external electrolyte solution is similar to that for water self-diffusion (curves 2, 3, 4, and 7,
Figure 35). This result looks like the analogous dependence in the Nafion 117 membrane. In the samples equilibrated with electrolyte solutions, the Li
+ self-diffusion coefficients reach a maximum. The maximum of Li+ self-diffusion coefficients is observed at
q/
qo = 0.19 for LiCl and at
q/
qo = 0.43 for LiOH aqueous solutions, where
q is the solution concentration relative to
qo and
qo is the concentration of sulfonate groups (ion-exchange capacity), which is 5 meq/g. The water content
λ was calculated at different concentrations of external electrolyte solutions. It turned out that the self-diffusion coefficients show maxima at the same
λ regardless of the electrolyte type (curves 5, 6,
Figure 35). These extreme dependences are explained in
Figure 36 for a LiCl solution as an example. If the samples are swollen in pure water, the Li
+ cation moves in the gel fraction of the ion exchanger through the cluster-channel network, which is similar to the cation transfer in homogeneous membranes. If the sample contacts with an electrolyte aqueous solution, the additional way for lithium cation translation appears as a result of Li
+ exchange with Li
+ cations sorbed in the macropore. An exchange rate increases with increasing concentration of the Li
+ self-diffusion coefficient. With increasing electrolyte concentration, the
λ value decreases, which is accompanied by decreasing of the self-diffusion coefficient. These two alternating factors are summarized and become a reason for maxima in the dependences.
6. Self-Diffusion of Molecules and Anions in Anion Exchangers
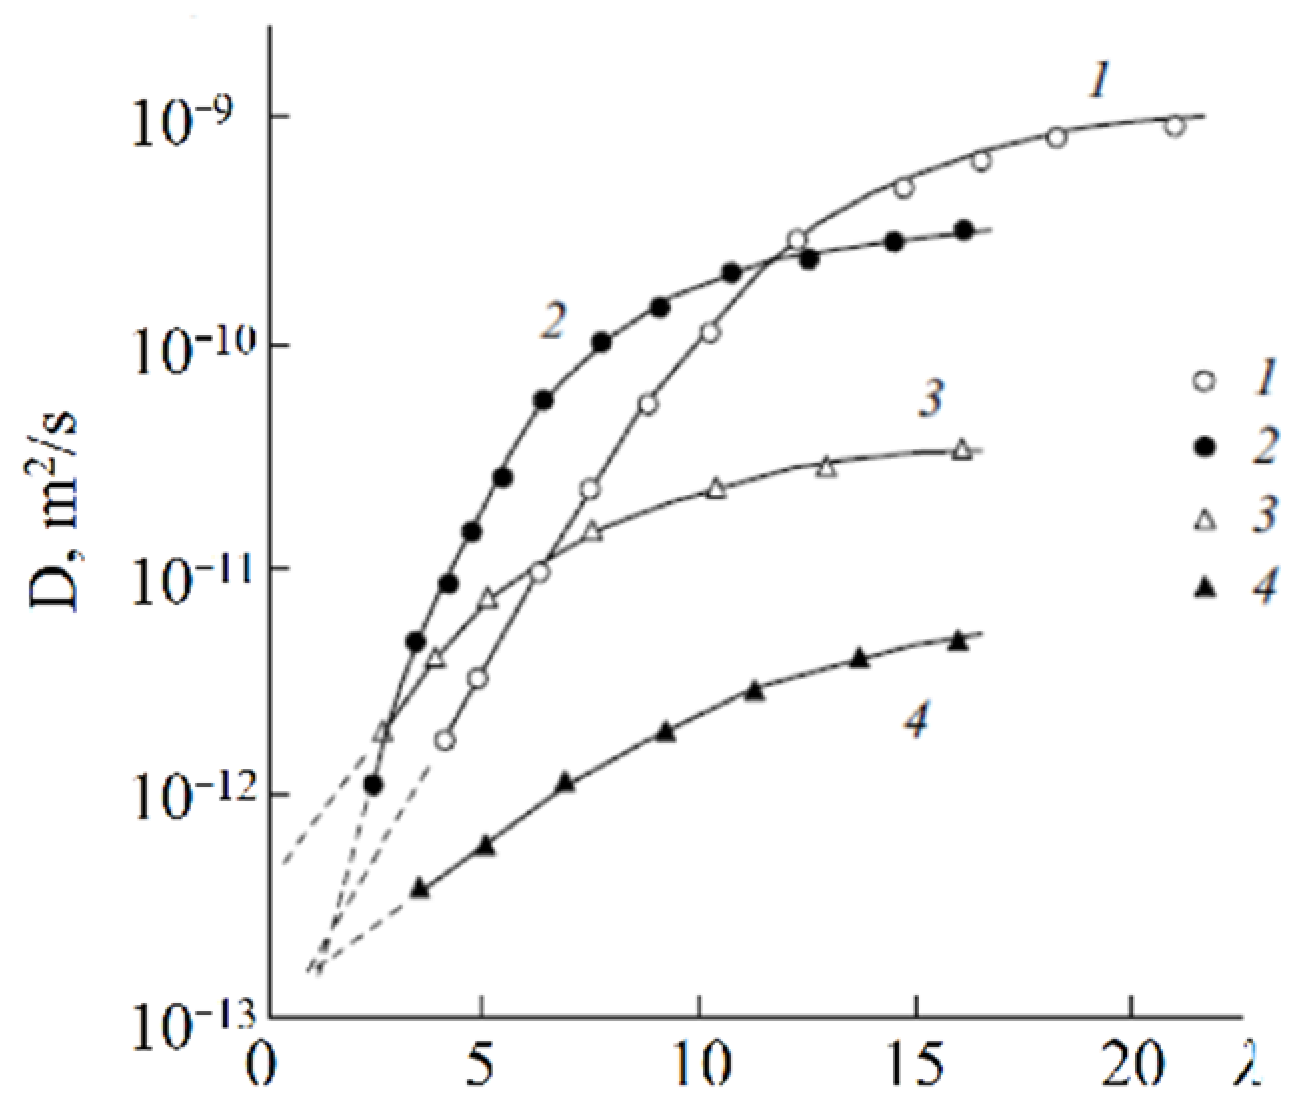
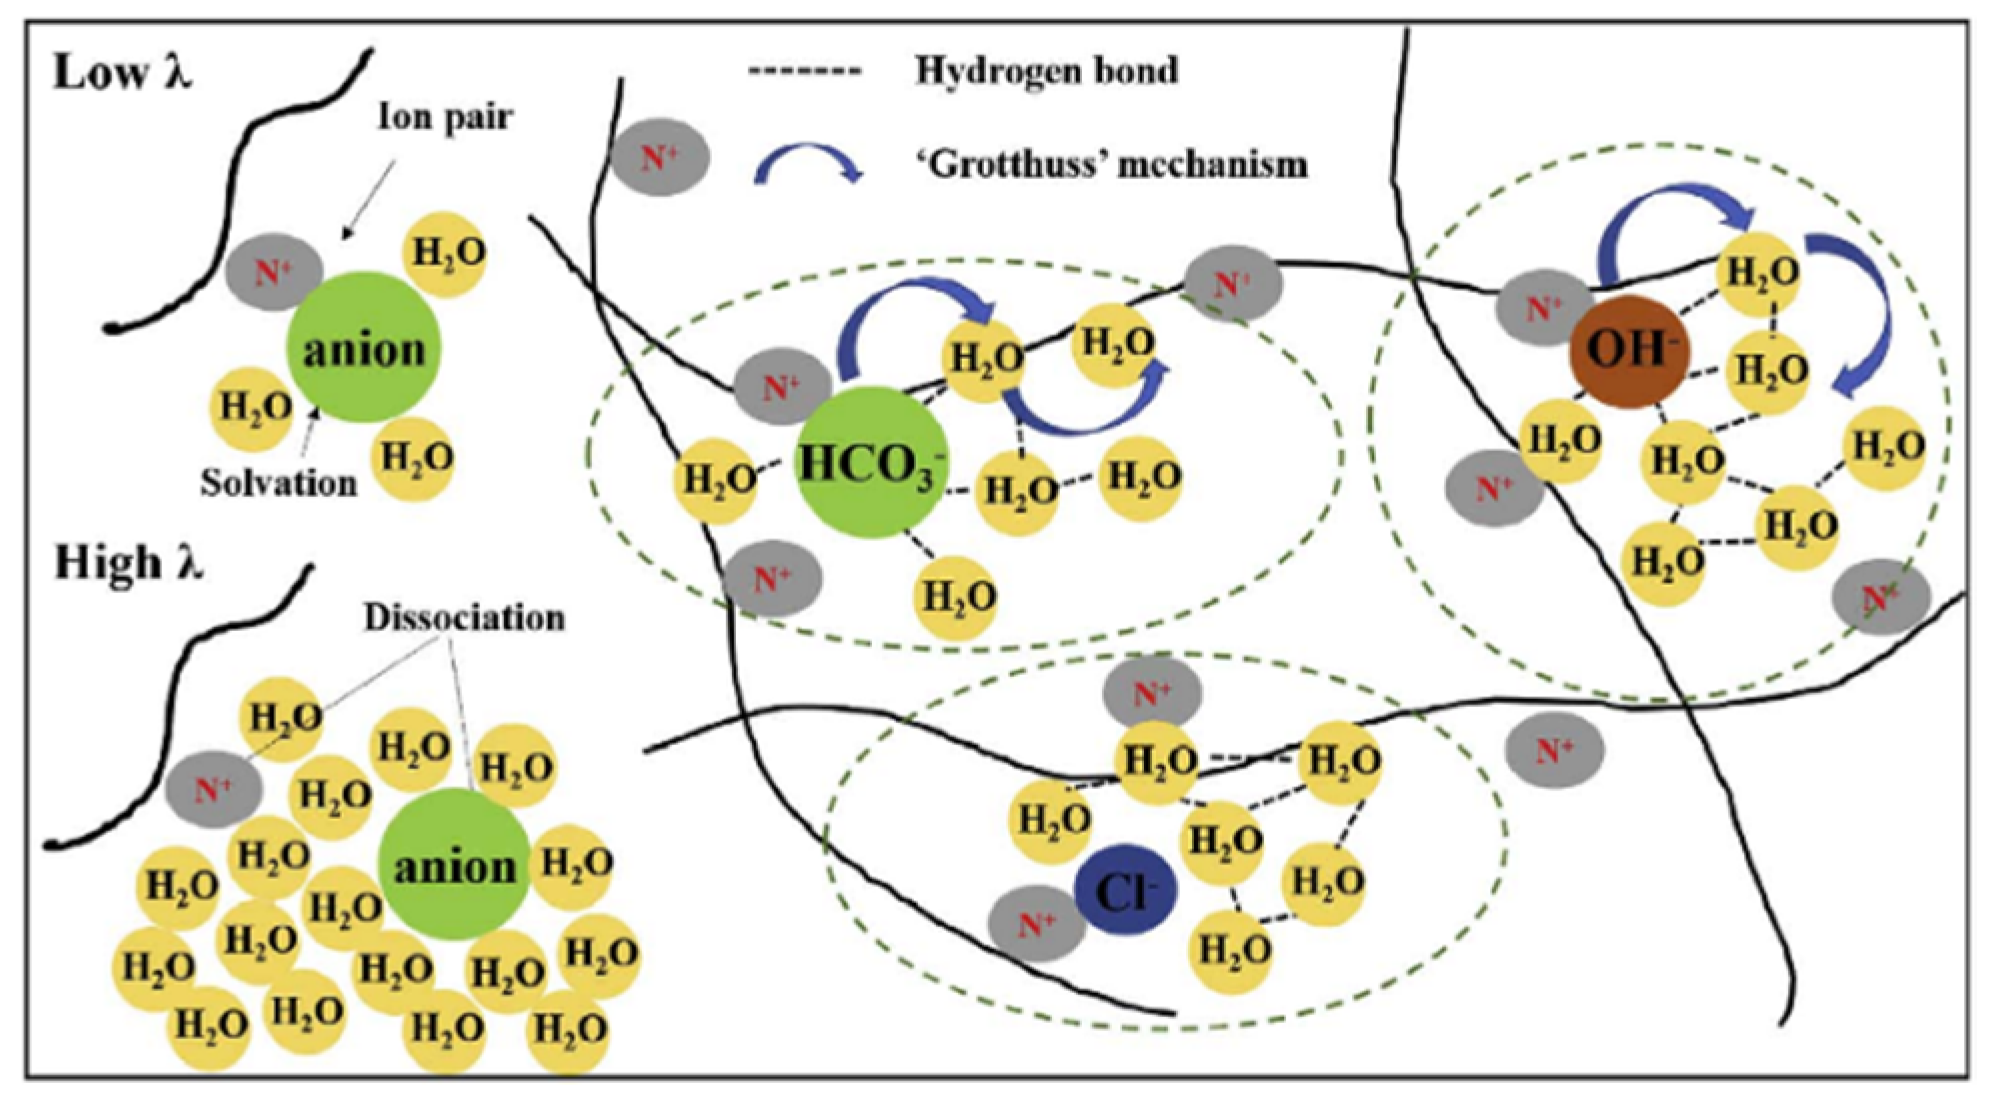
In recent years, anion-exchange membrane fuel cells have attracted attention. As compared to cation-exchange membranes, hydroxide ions are exchanged through the membrane rather than protons. In
Figure 39, the ion and water transport in a Tokuyama A201 membrane in the OH
−, HCO
3−, and Cl
− forms is shown [
78]. There are similar water and ion mobilities in anion and cation-exchange membranes, especially in the OH
− and H
+ forms of Tokuyama A201 and Nafion membranes, respectively. Anion transport is controlled by ion hydration, and the hydration energy decreases with an increasing anion radius. As shown in
Figure 40, the water self-diffusion coefficient strongly depends on the membrane water content. Self-diffusion of water, methanol, and anions was investigated in detail on
1H,
19F, and
13C (
13C labeled bicarbonate and methanol) nuclei in a polyethylene-b-poly(vinylbenzyl trimethyl ammonium) copolymer anion-exchange membrane [
114].
The highest self-diffusion coefficient was observed for the F− anion. The diffusion activation energy of water is lower than that for anions. The measured conductivity of the HCO3− anion is higher compared to the value calculated from the Nernst–Einstein Equation (7), indicating the presence of OH− ions increasing the measured conductivity.
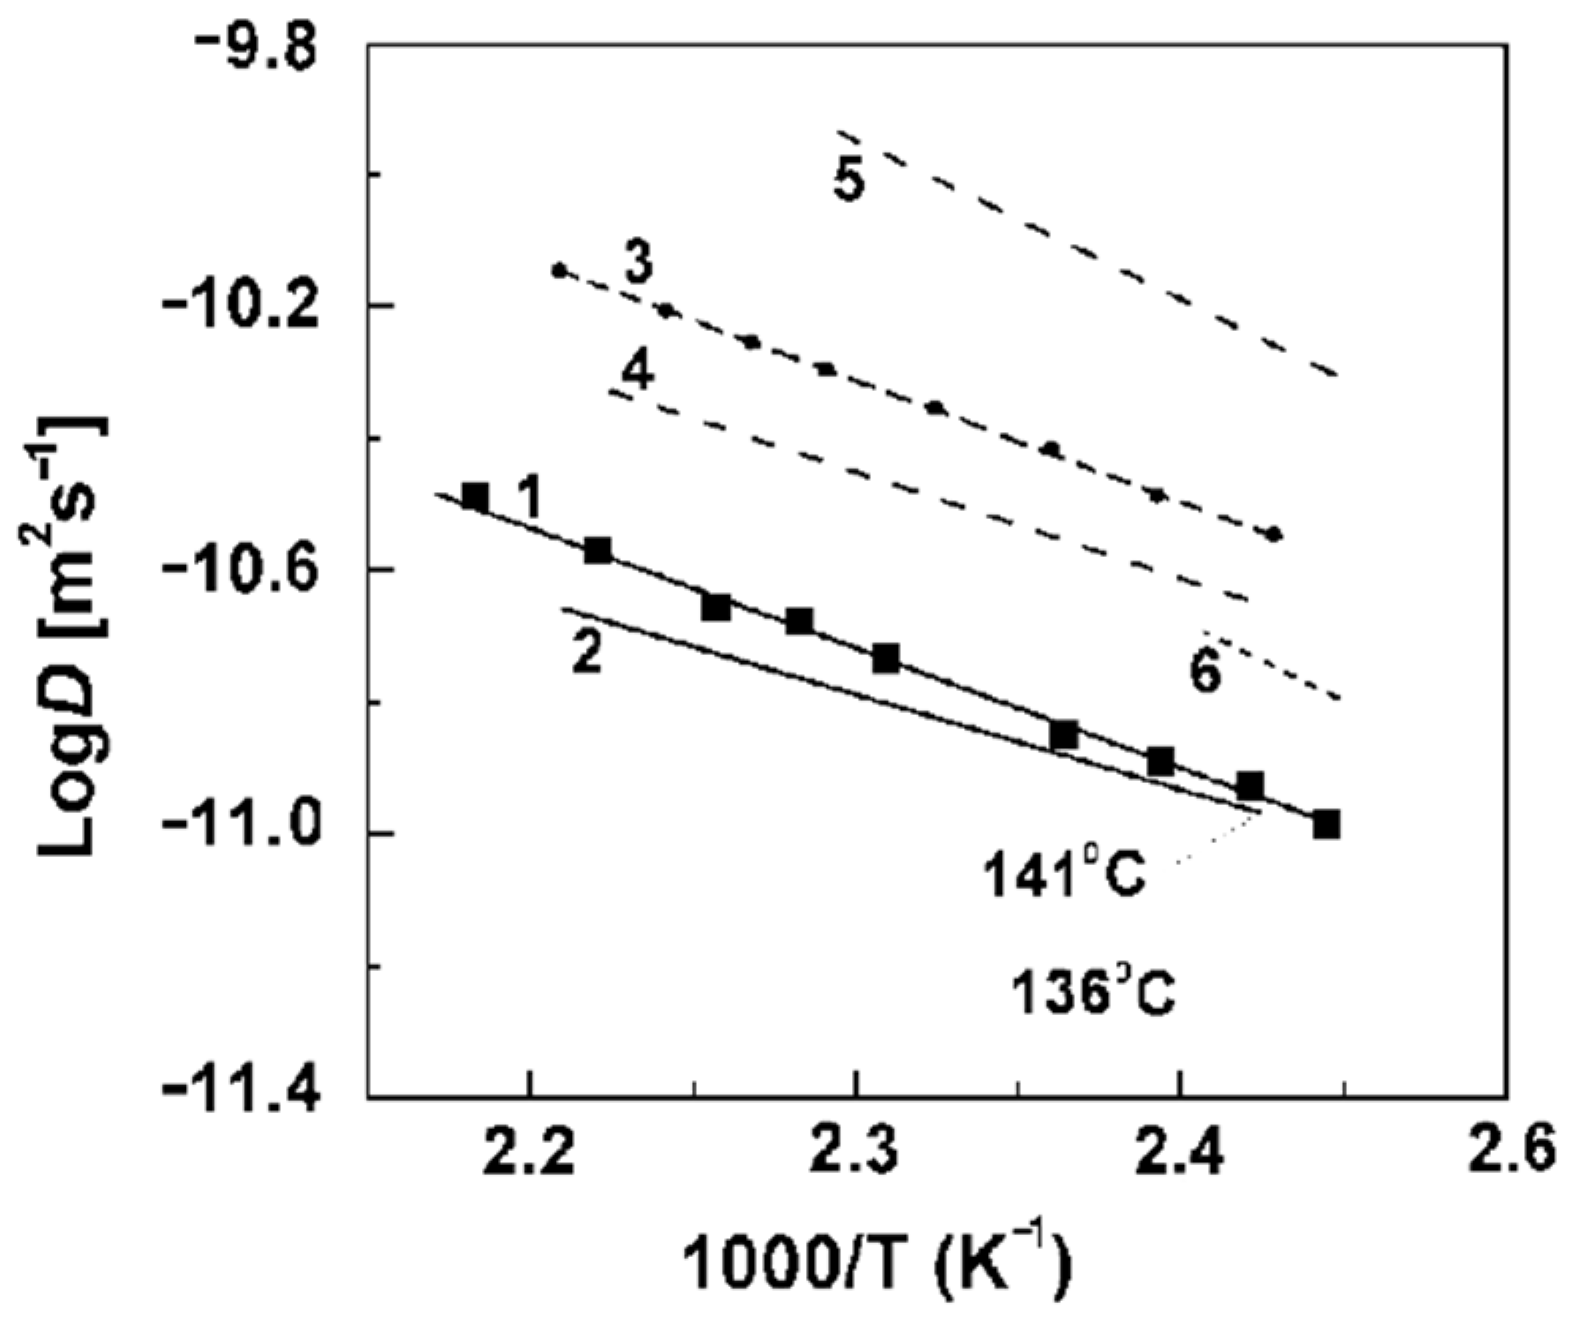
Self-diffusion of water, ethanol, and F
− ions was studied by PFG NMR in Neosepta ACLE-5P, Selemion ASV, and MAP-1 membranes and the anion-exchange resin AV-17 was based on styrene/divinylbenzene (DVB) copolymer containing quaternary amine functional groups [
46]. The samples in contact with water and an NH
4F × HF aqueous solution were measured. The self-diffusion temperature dependences were approximated by the Arrhenius Equation (8). The average self-diffusion coefficients and activation energies are given in
Table 9. The water self-diffusion activation energies are approximately equal for all anion exchangers and are about 6 kcal/mol (25 kJ/mol). The self-diffusion coefficients are low for the samples in an NH
4F × HF aqueous solution, which explains the decreasing membrane water content compared to the samples swelling in pure water.
The water self-diffusion coefficients decrease if the crosslinking agent (DVB) amount increases, due to the water content decreasing. The self-diffusion coefficients measured by PFG NMR are higher compared to those obtained by the radioactive tracer technique (
Table 10).
In contrast to water, ethanol is distributed non-homogeneously in anion exchangers. Two regions with different partial self-diffusion coefficients were observed. These coefficients
Di and relative parts
pi of absorbed ethanol molecules are shown in
Table 11. The self-diffusion coefficient of the main part of ethanol (76%) is slightly lower than that of water, but about a quarter of ethanol molecules (24%) are moving more slowly by an order of magnitude. It may be supposed that alcohol molecules are situated not only near the charge groups but also interact with the polymer matrix.
The self-diffusion coefficients and activation energies of the F
− anion for the samples swelling in pure water and in an aqueous solution of NH
4F × HF are given in
Table 12. The self-diffusion coefficients are low, but the activation energies are higher for the fluorine anion than those for water molecules.
The dependences of the water and F
− self-diffusion coefficients on the NH
4F × HF aqueous solution concentration in the anion exchanger AV-17 are shown in
Figure 41. In solution, the self-diffusion coefficients decrease with increasing concentration (decreasing water molecule amount per anion F
−), as shown bycurves 1′ and 2′. The same tendency is observed for water in AV-17 (curve 2), but the fluorine anion self-diffusion coefficient shows a maximum (curve 1). The maximum originates from two opposite factors. On the one hand, decreasing water content and increasing concentration facilitates the contact of ionic pairs of F
− with anion groups, resulting in a decrease in the fluorine anion translational mobility. On the other hand, an increase in the amount of F
− anions due to a non-exchangeable adsorbed electrolyte results in an easier counterion transfer between ion-exchange sites (increasing translational mobility). Owing to these two factors acting in opposite directions, the maximum is observed. It is important to mention that the ionic conductivity also shows the maximum.


 is a SO3− group,
  is a water molecule,
  is a Na+ cation,
  is a Cs+ cation, and L1 is the channel width [105].


