
Expression of NGF/proNGF and Their Receptors TrkA, p75NTR and Sortilin in Melanoma


 , and
, and 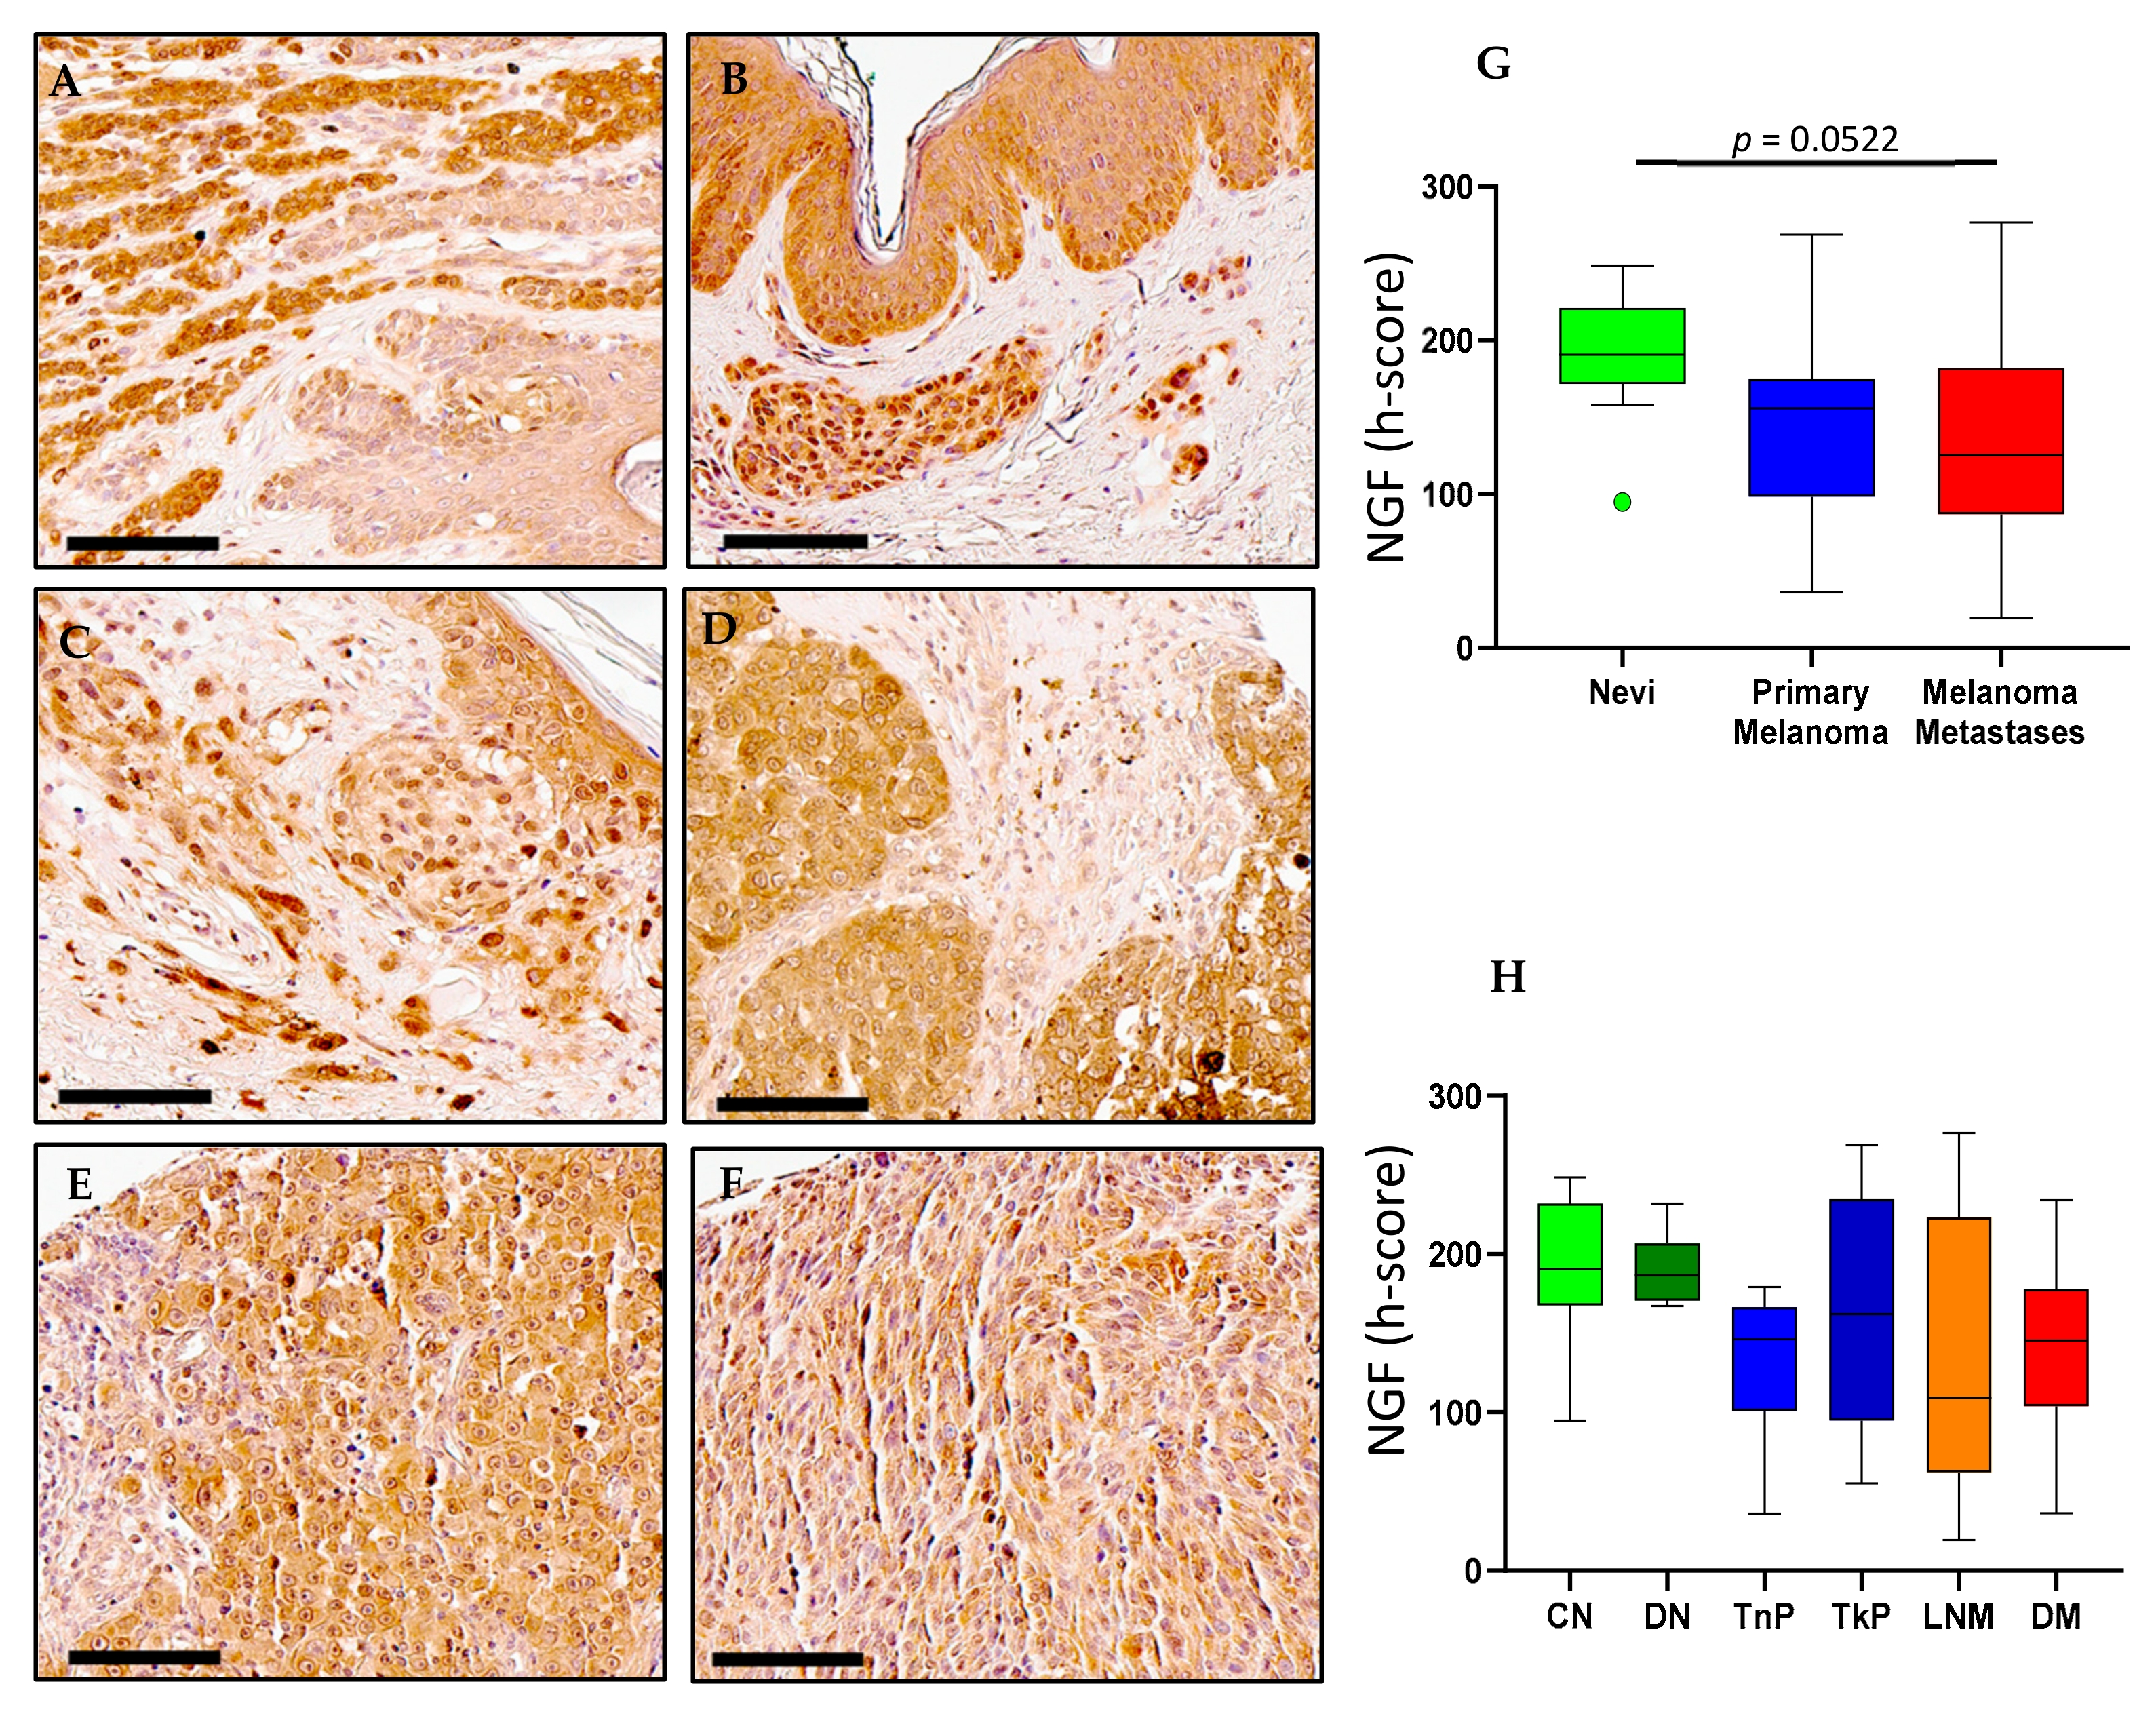
Abstract
:1. Introduction
2. Results
2.1. NGF Expression in Melanoma
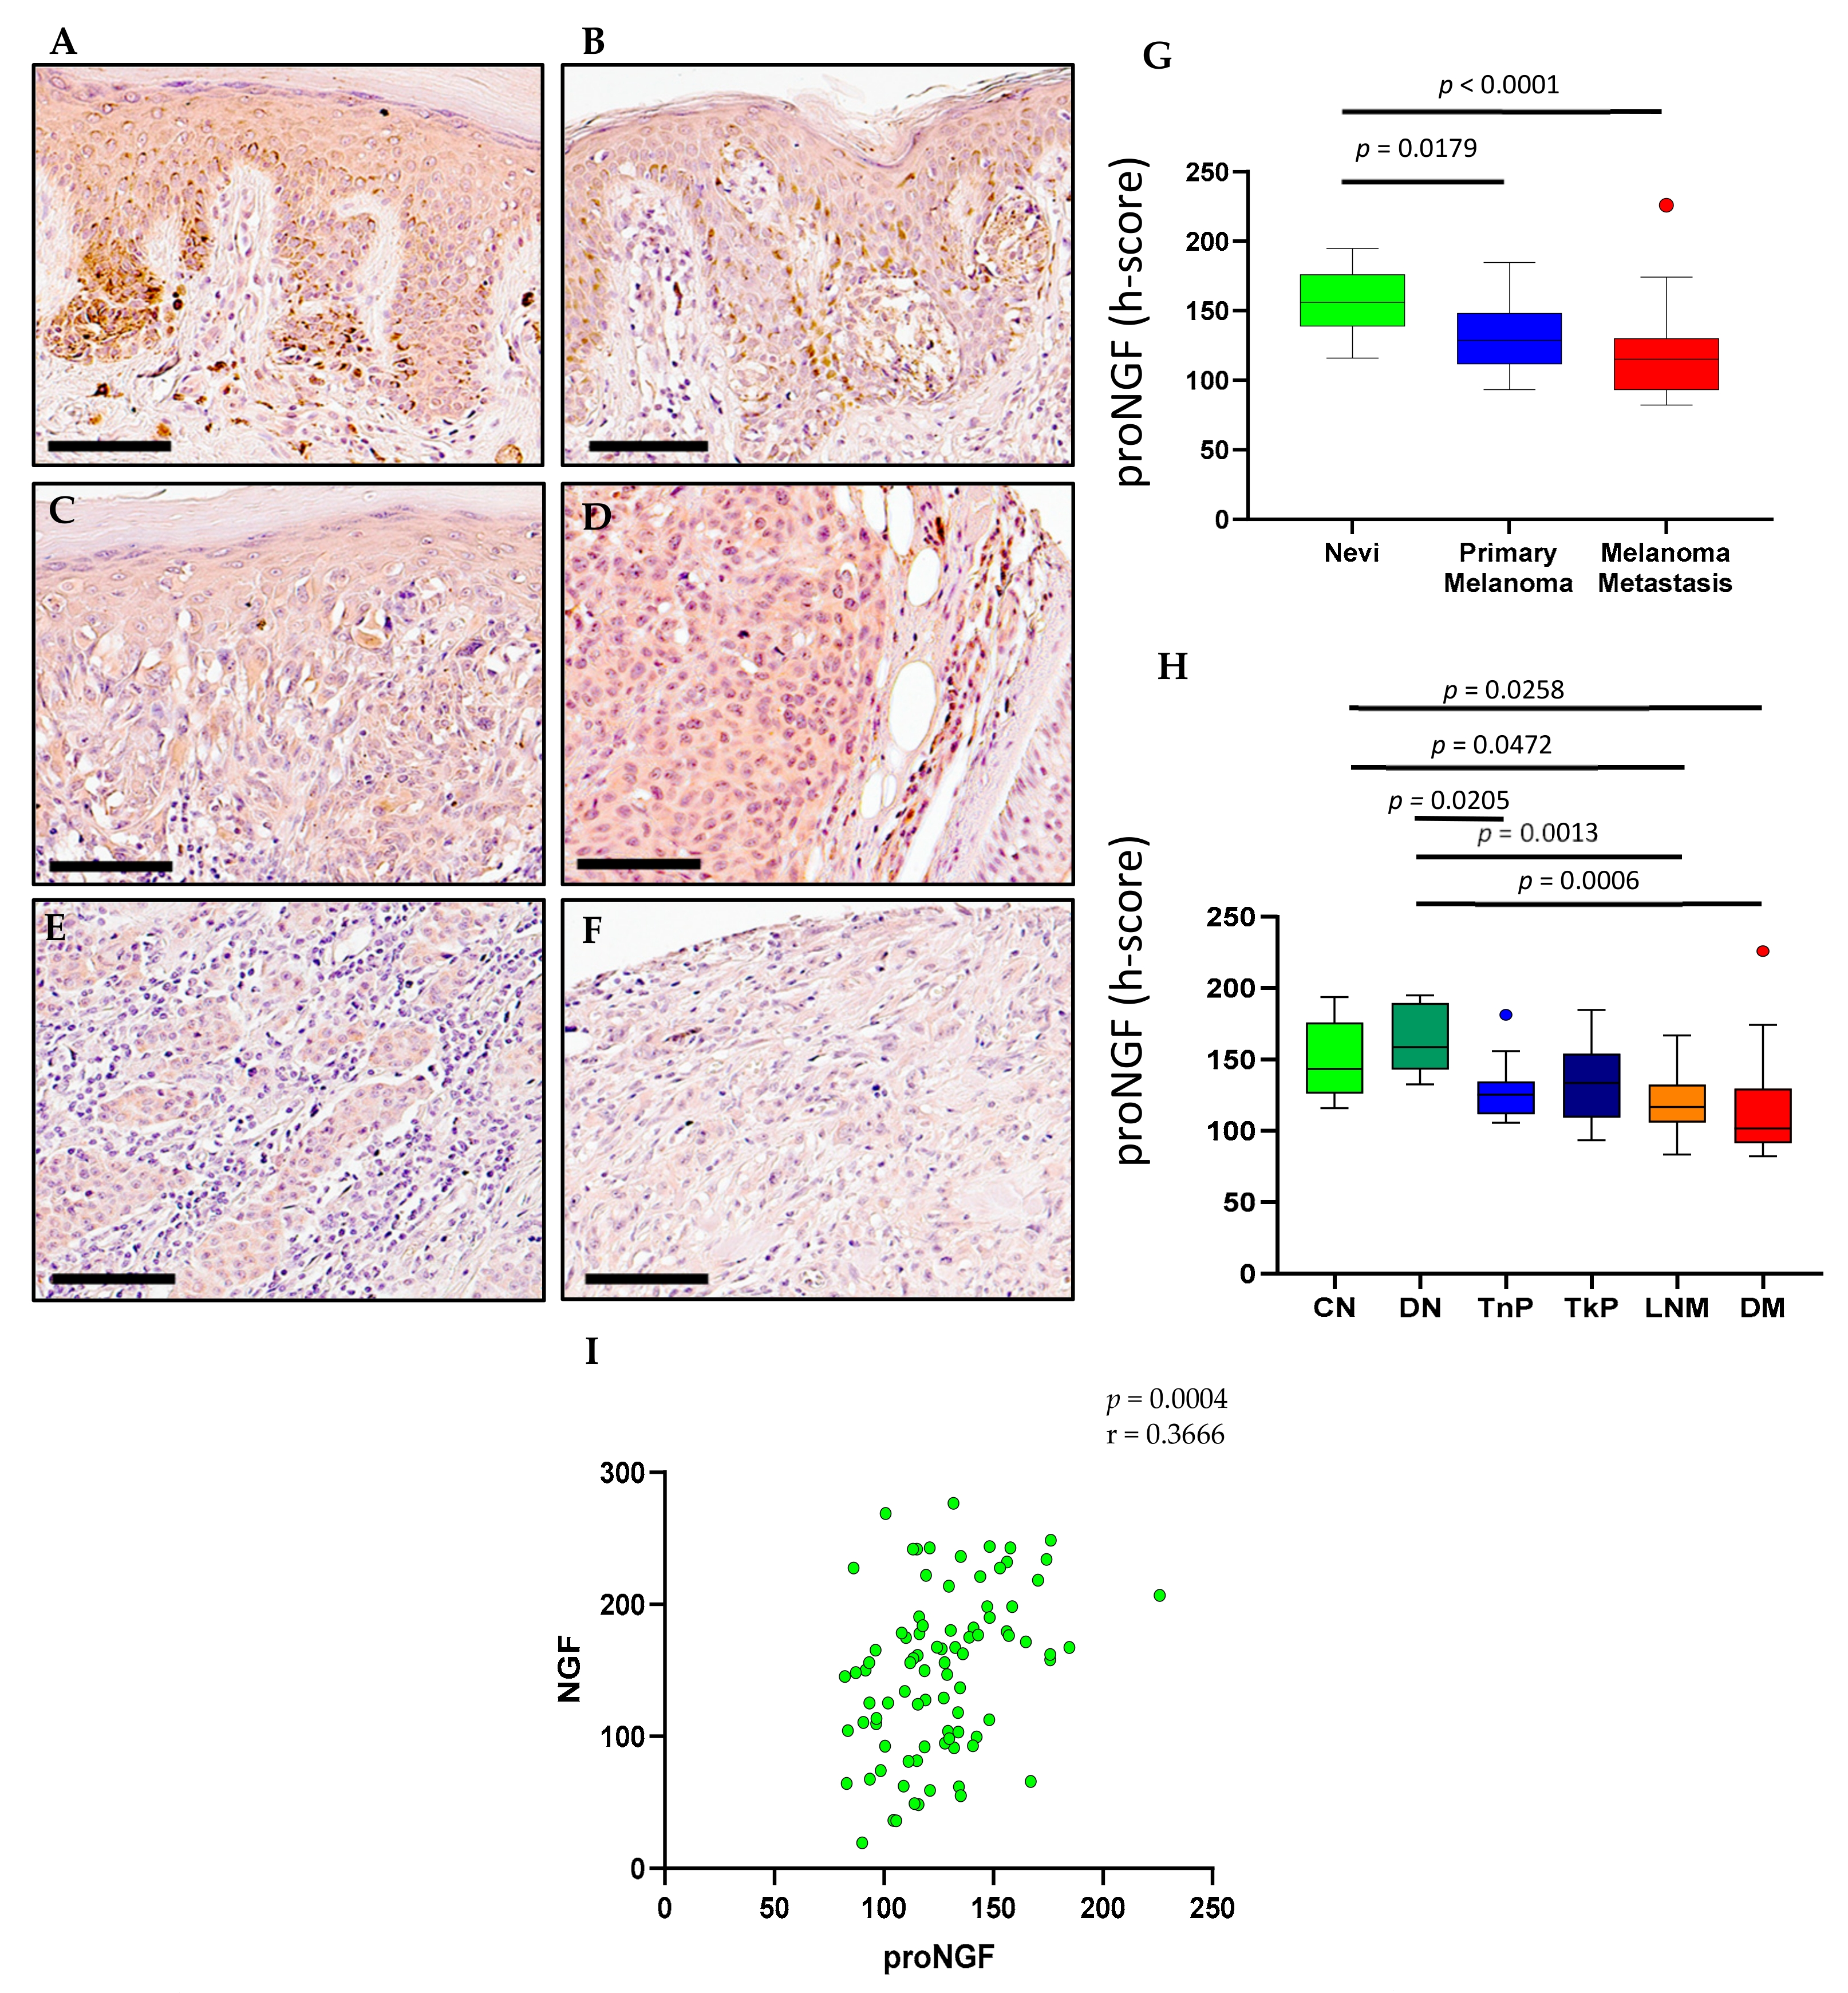
2.2. ProNGF Expression in Melanoma
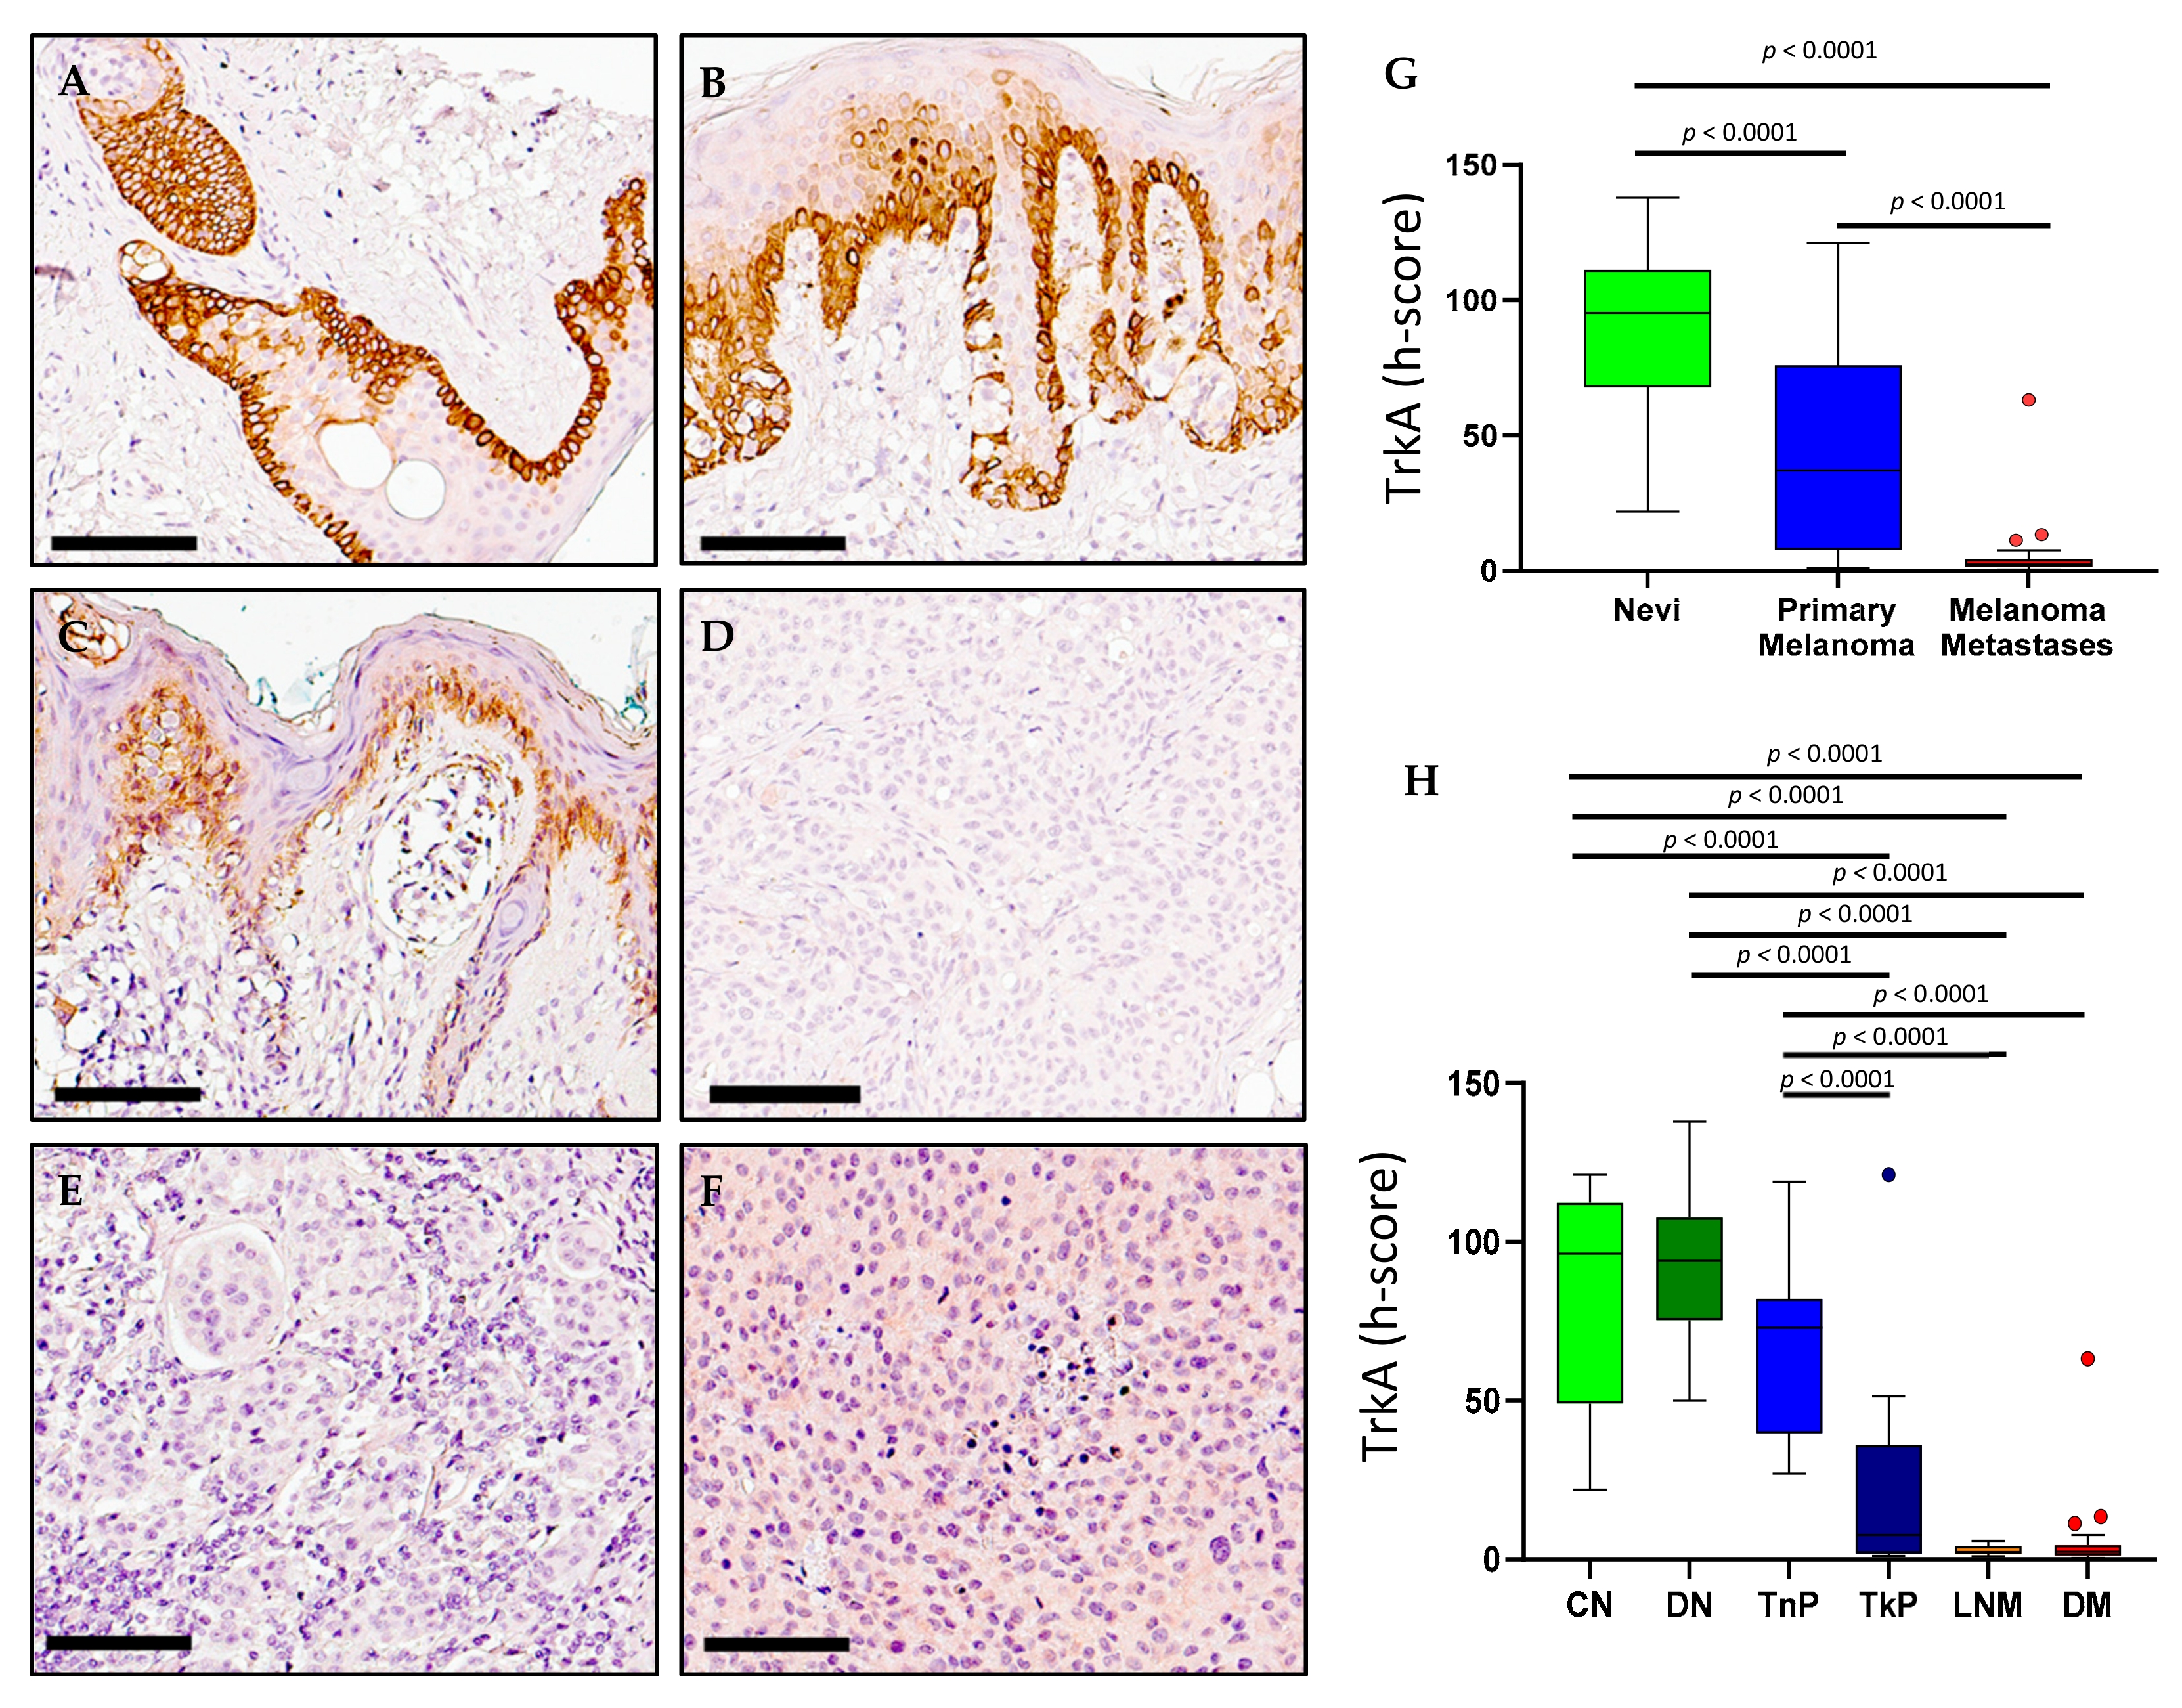
2.3. TrkA Expression in Melanoma
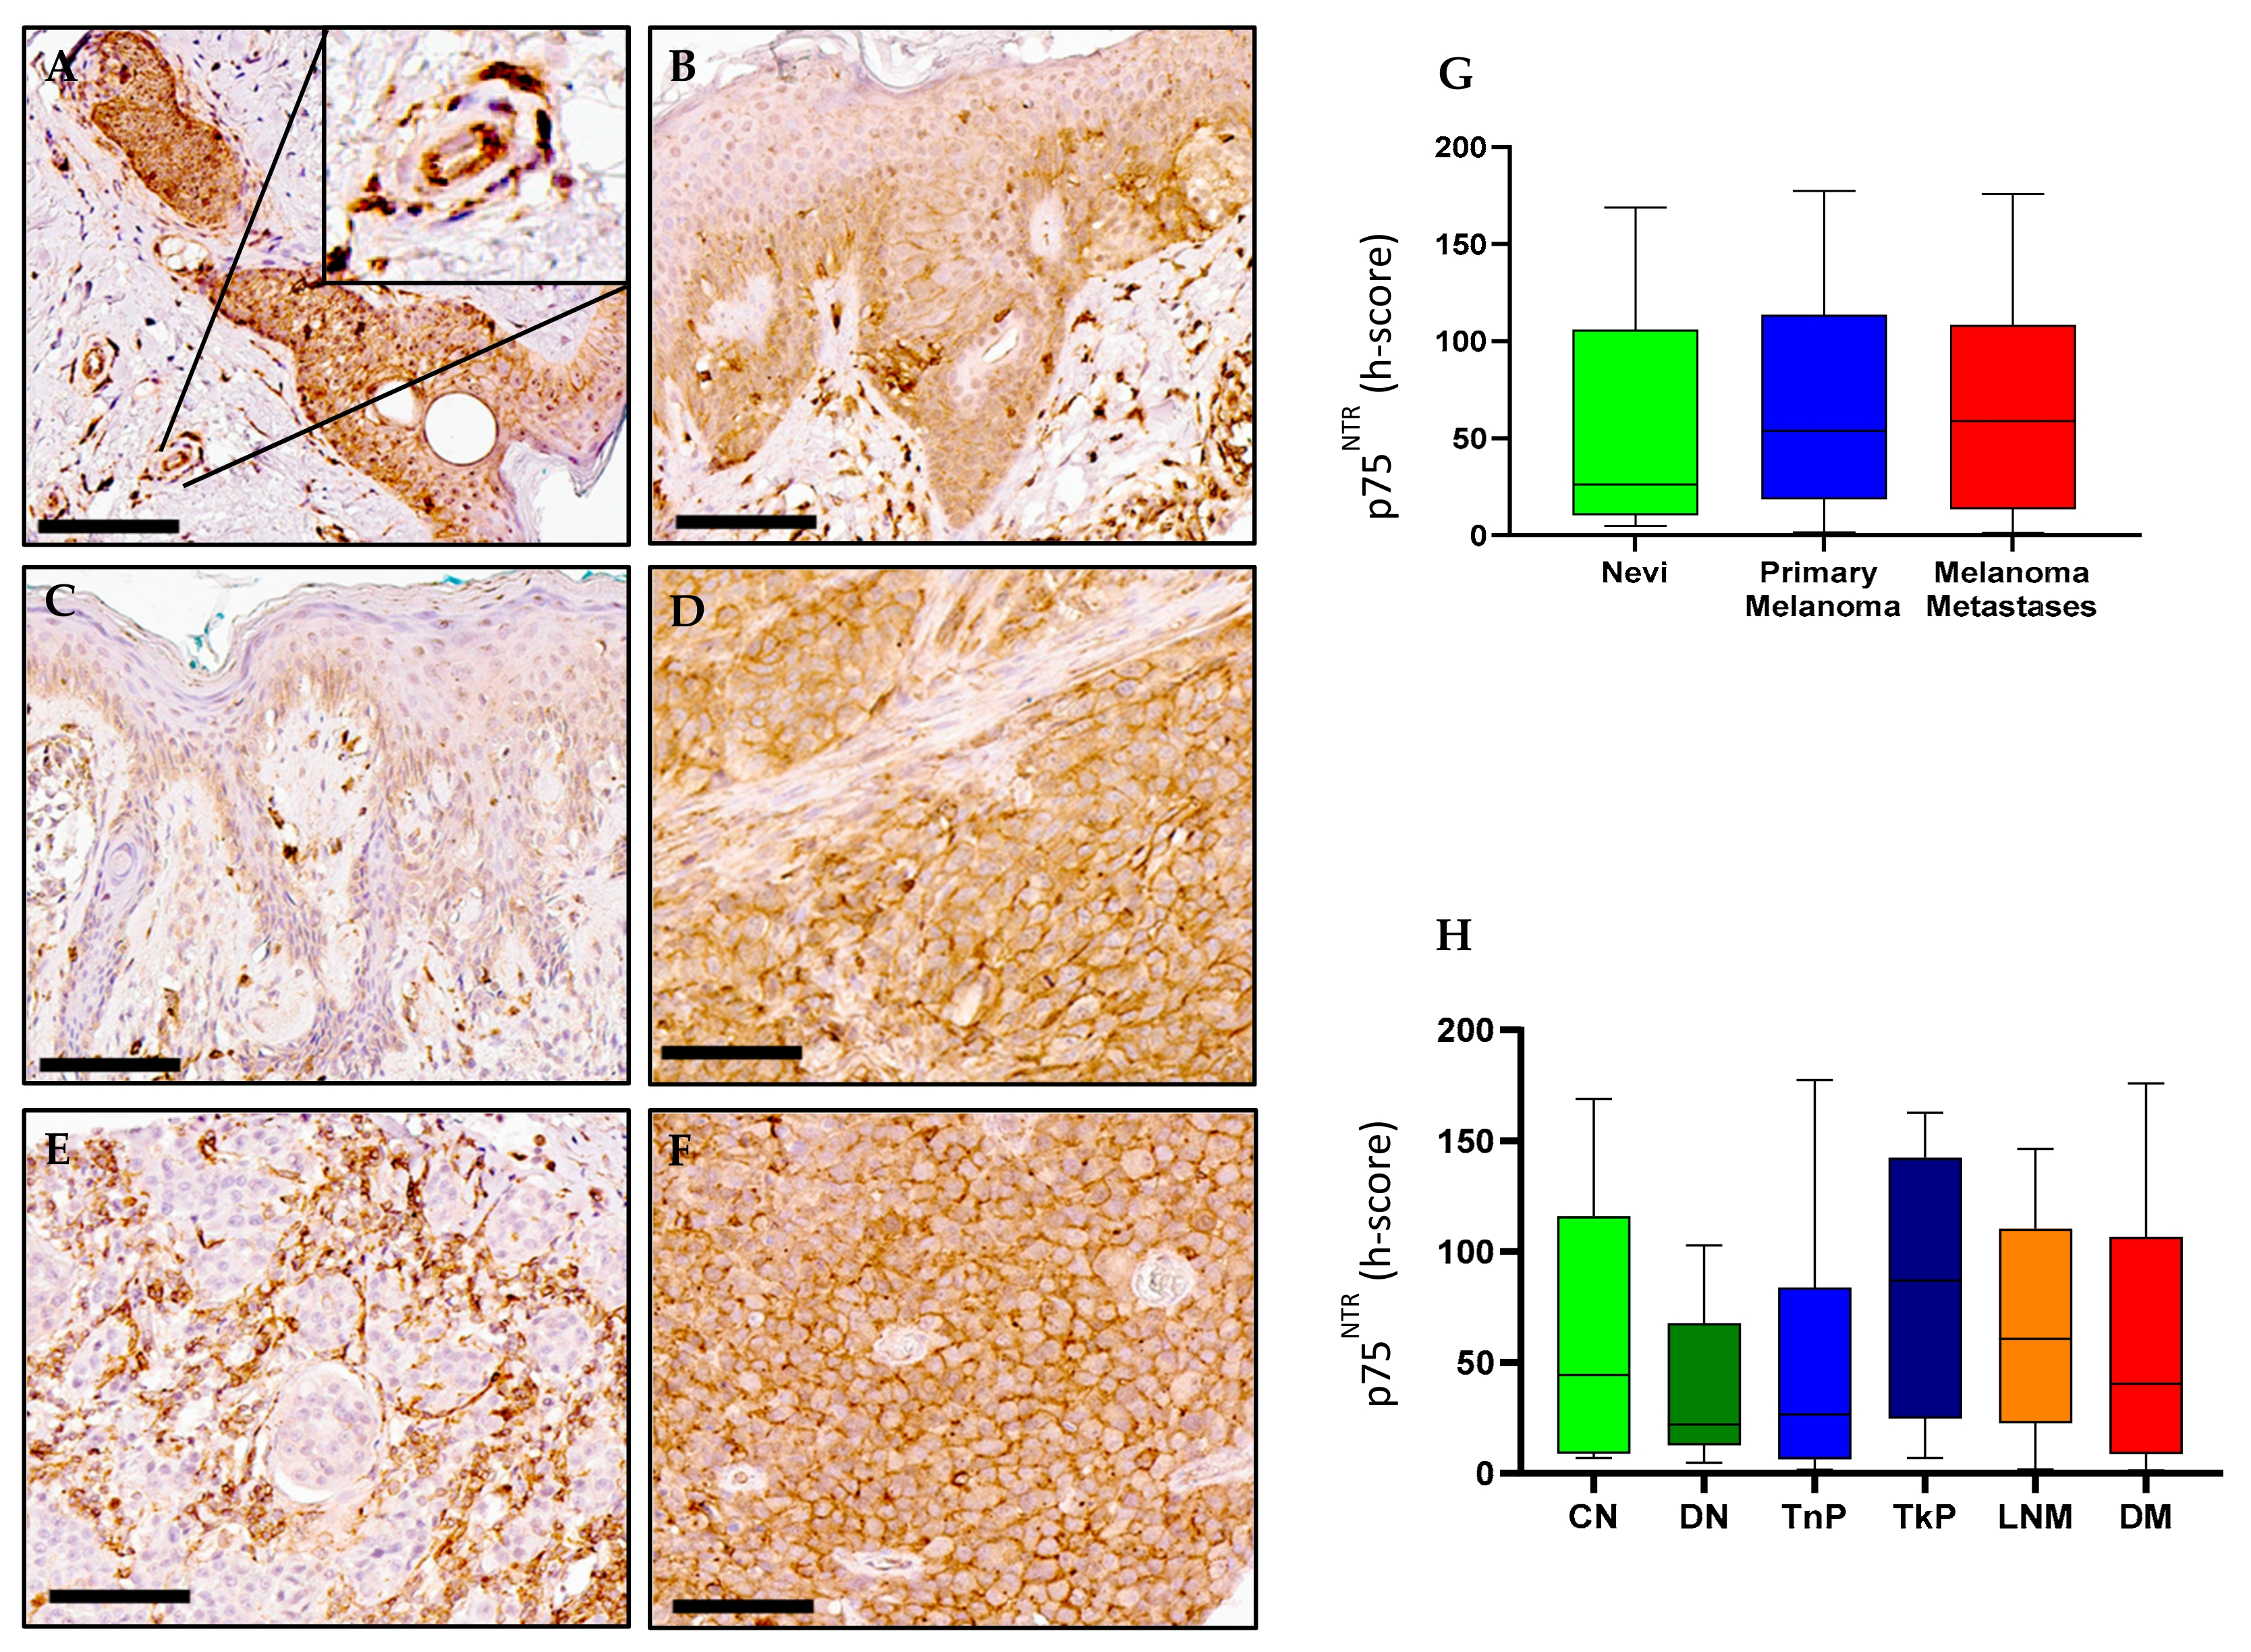
2.4. p75NTR Expression in Melanoma
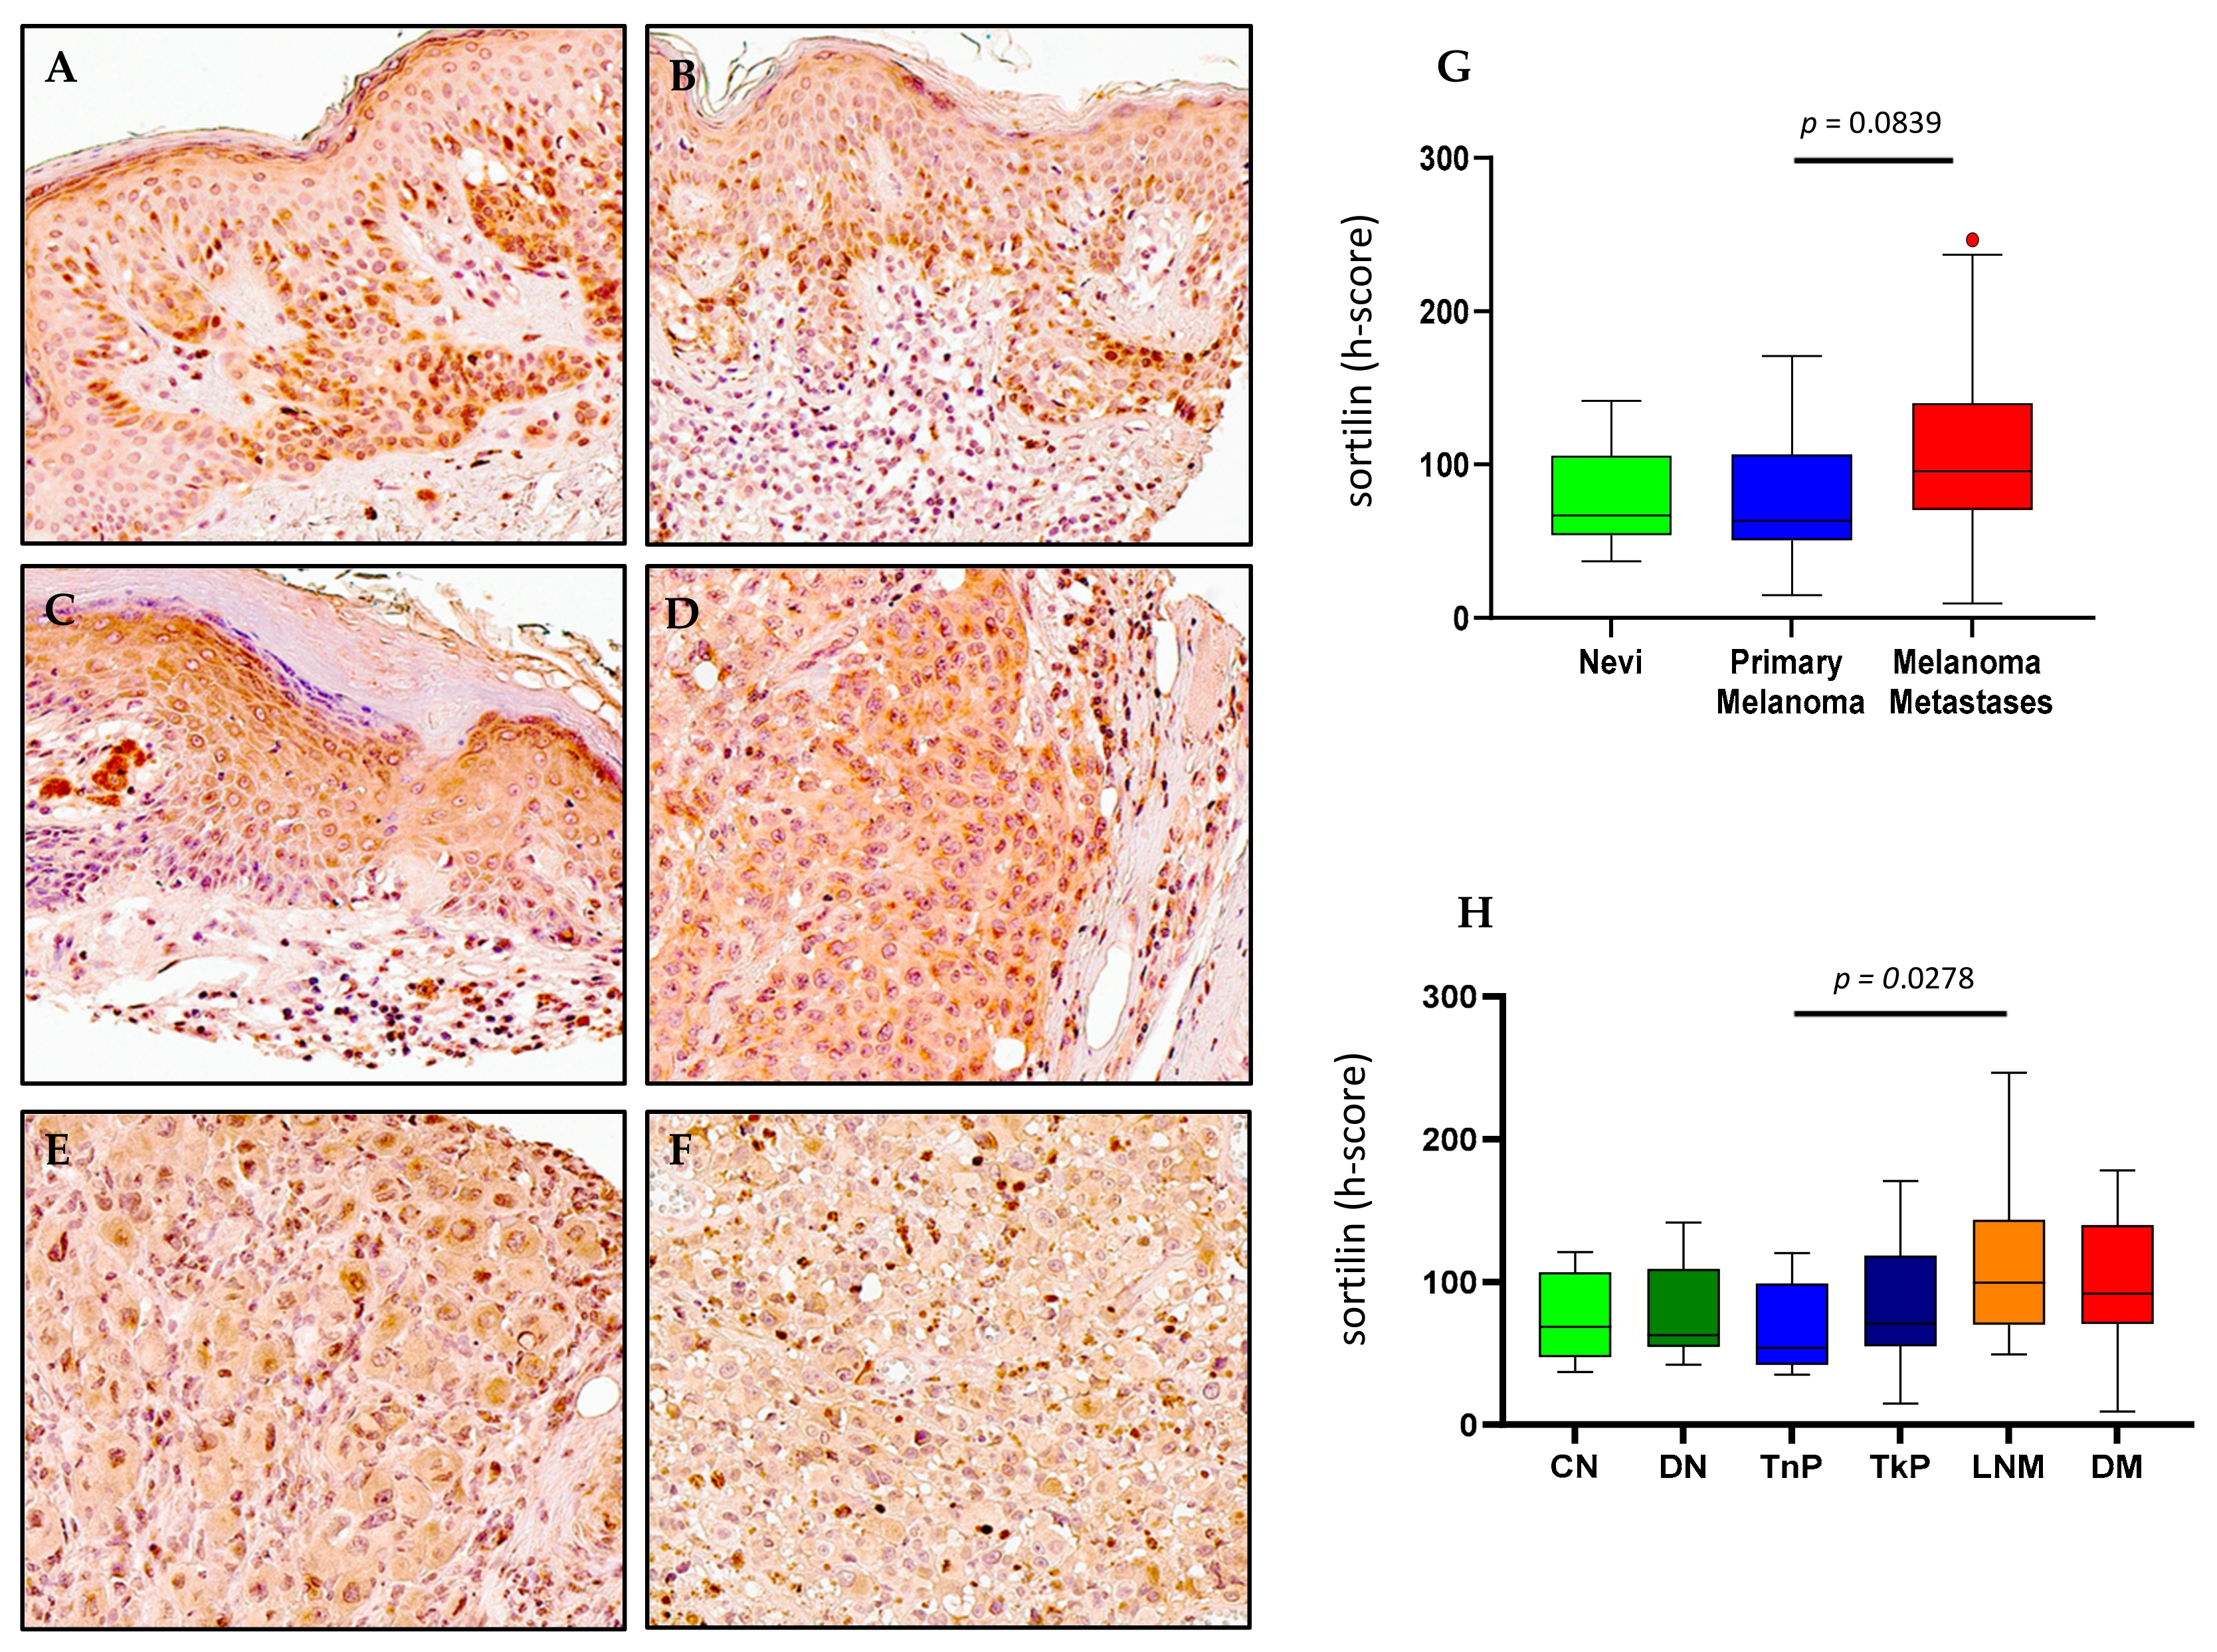
2.5. Sortilin Expression in Melanoma
3. Discussion
4. Materials and Methods
4.1. Skin and Melanoma Tissue Samples
4.2. Immunohistochemistry
4.3. Digital Quantification of Immunohistochemistry
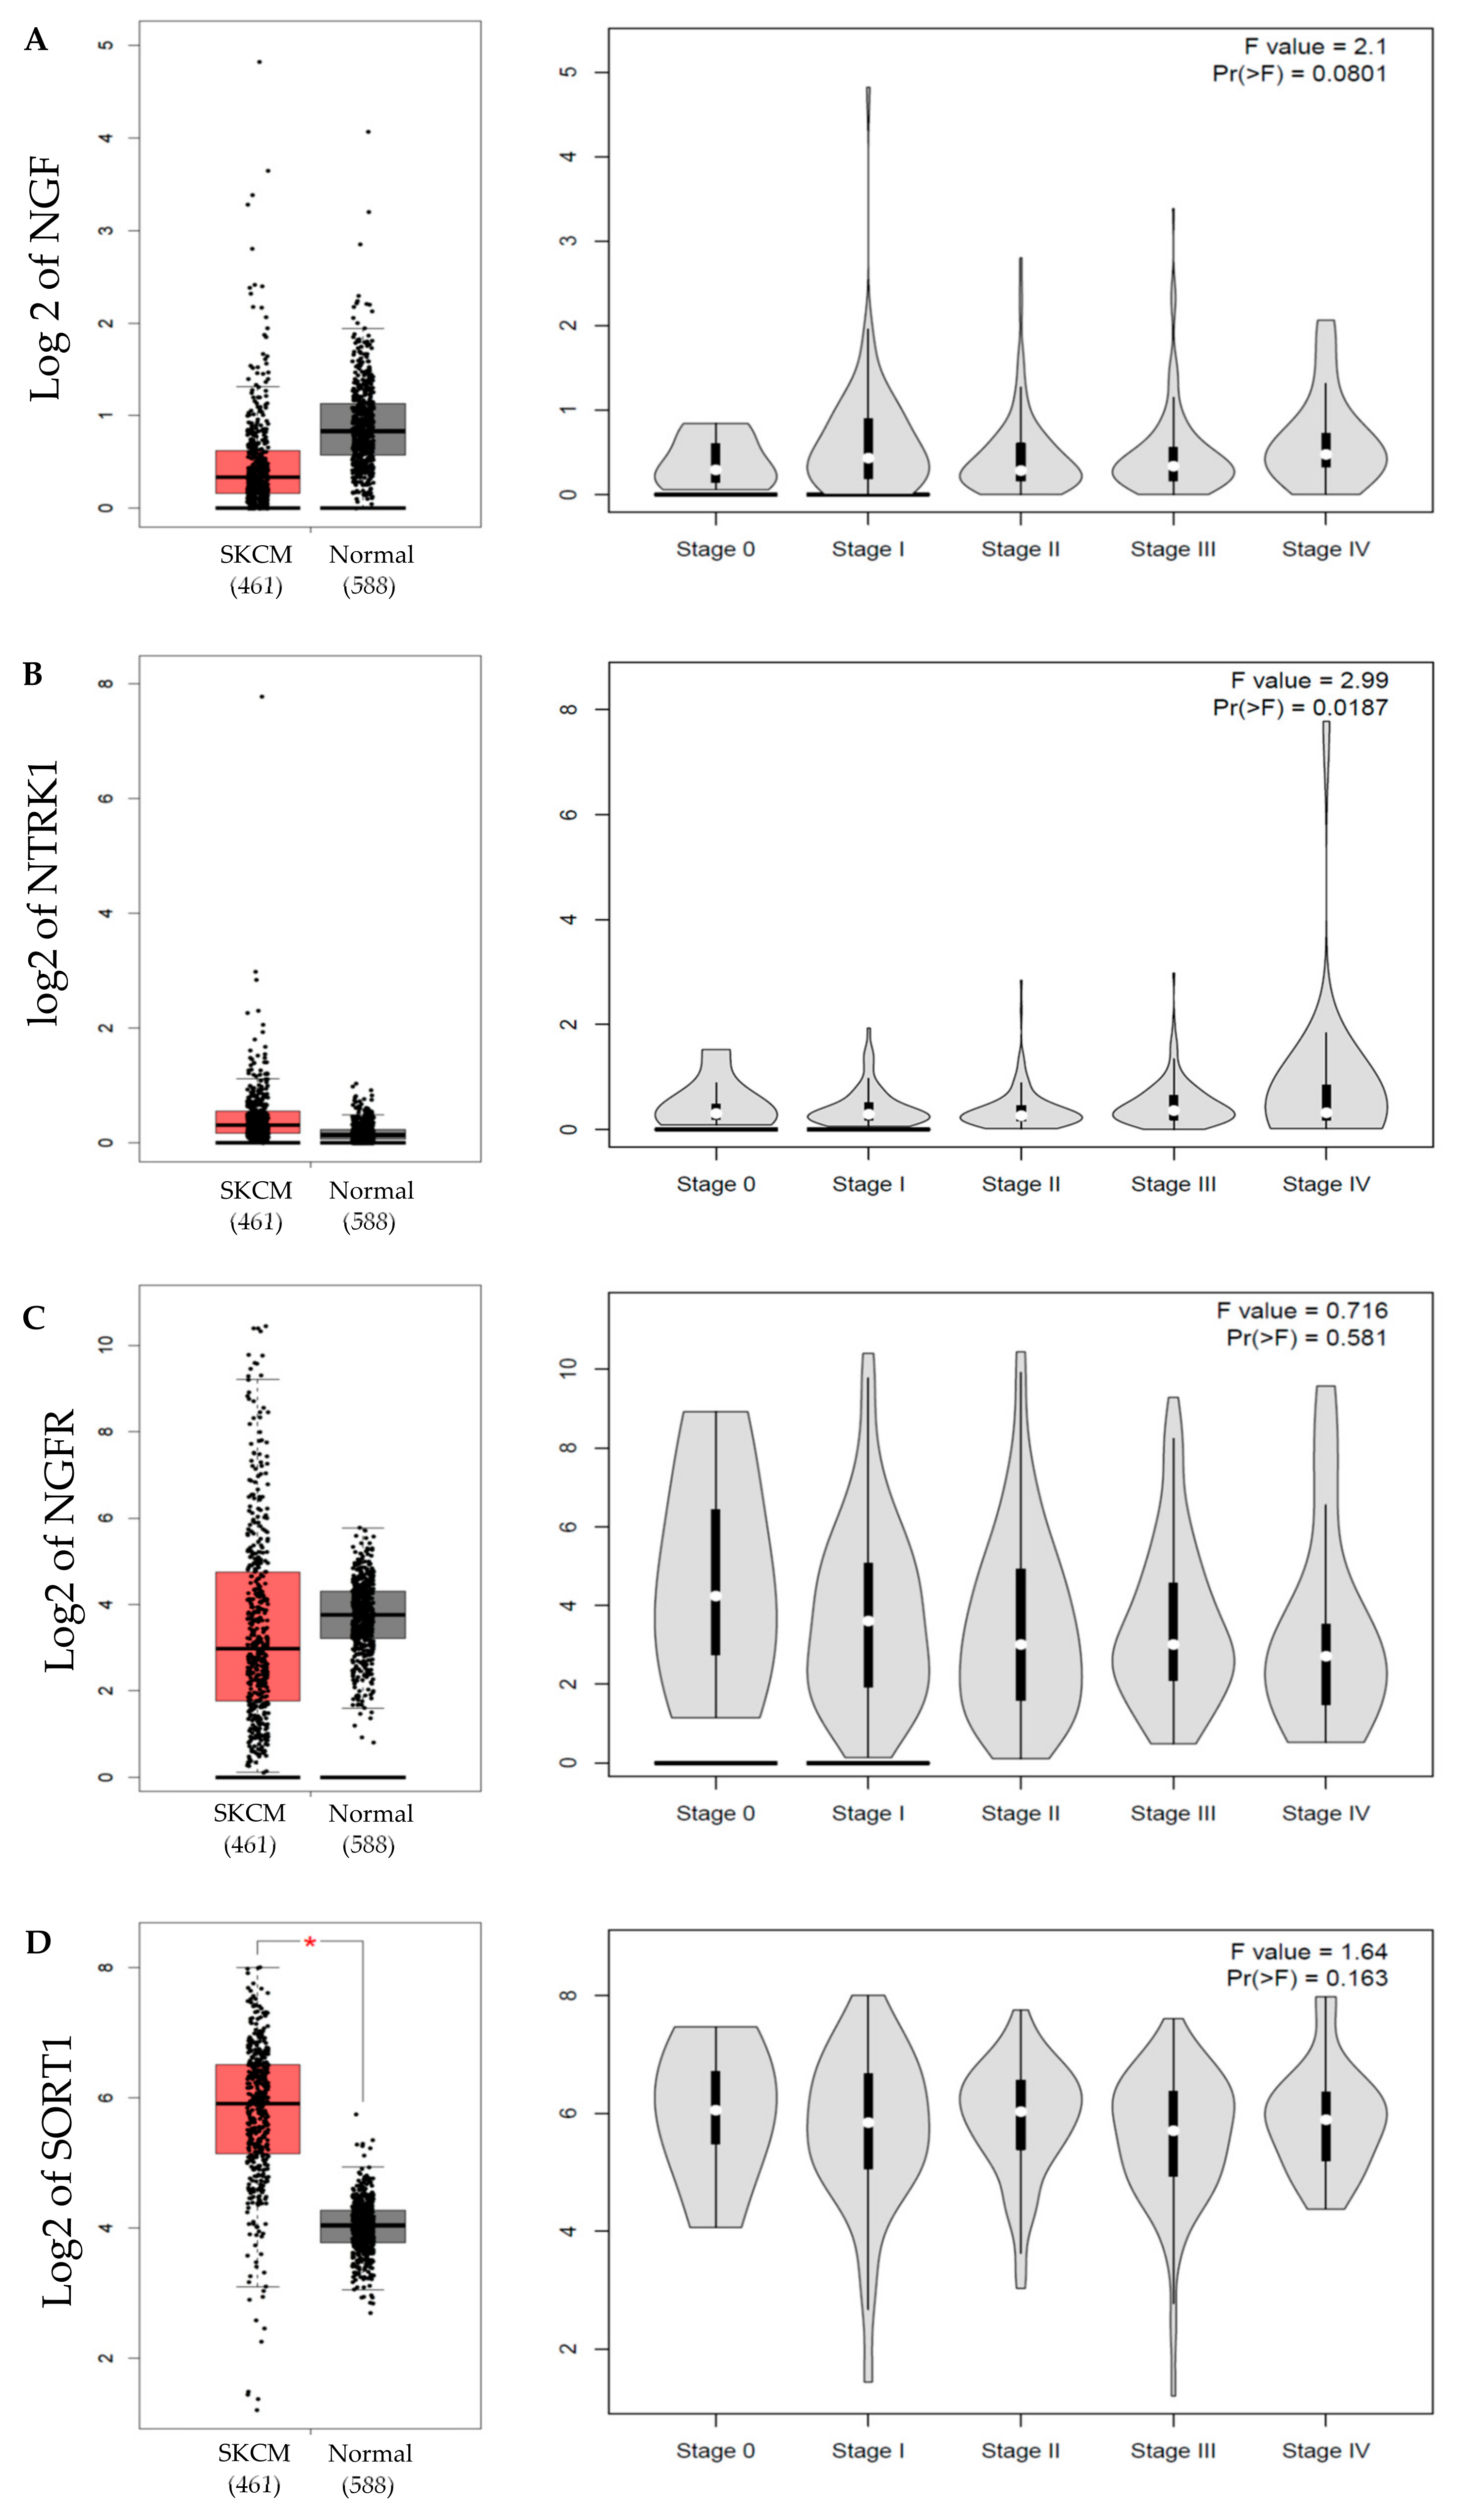
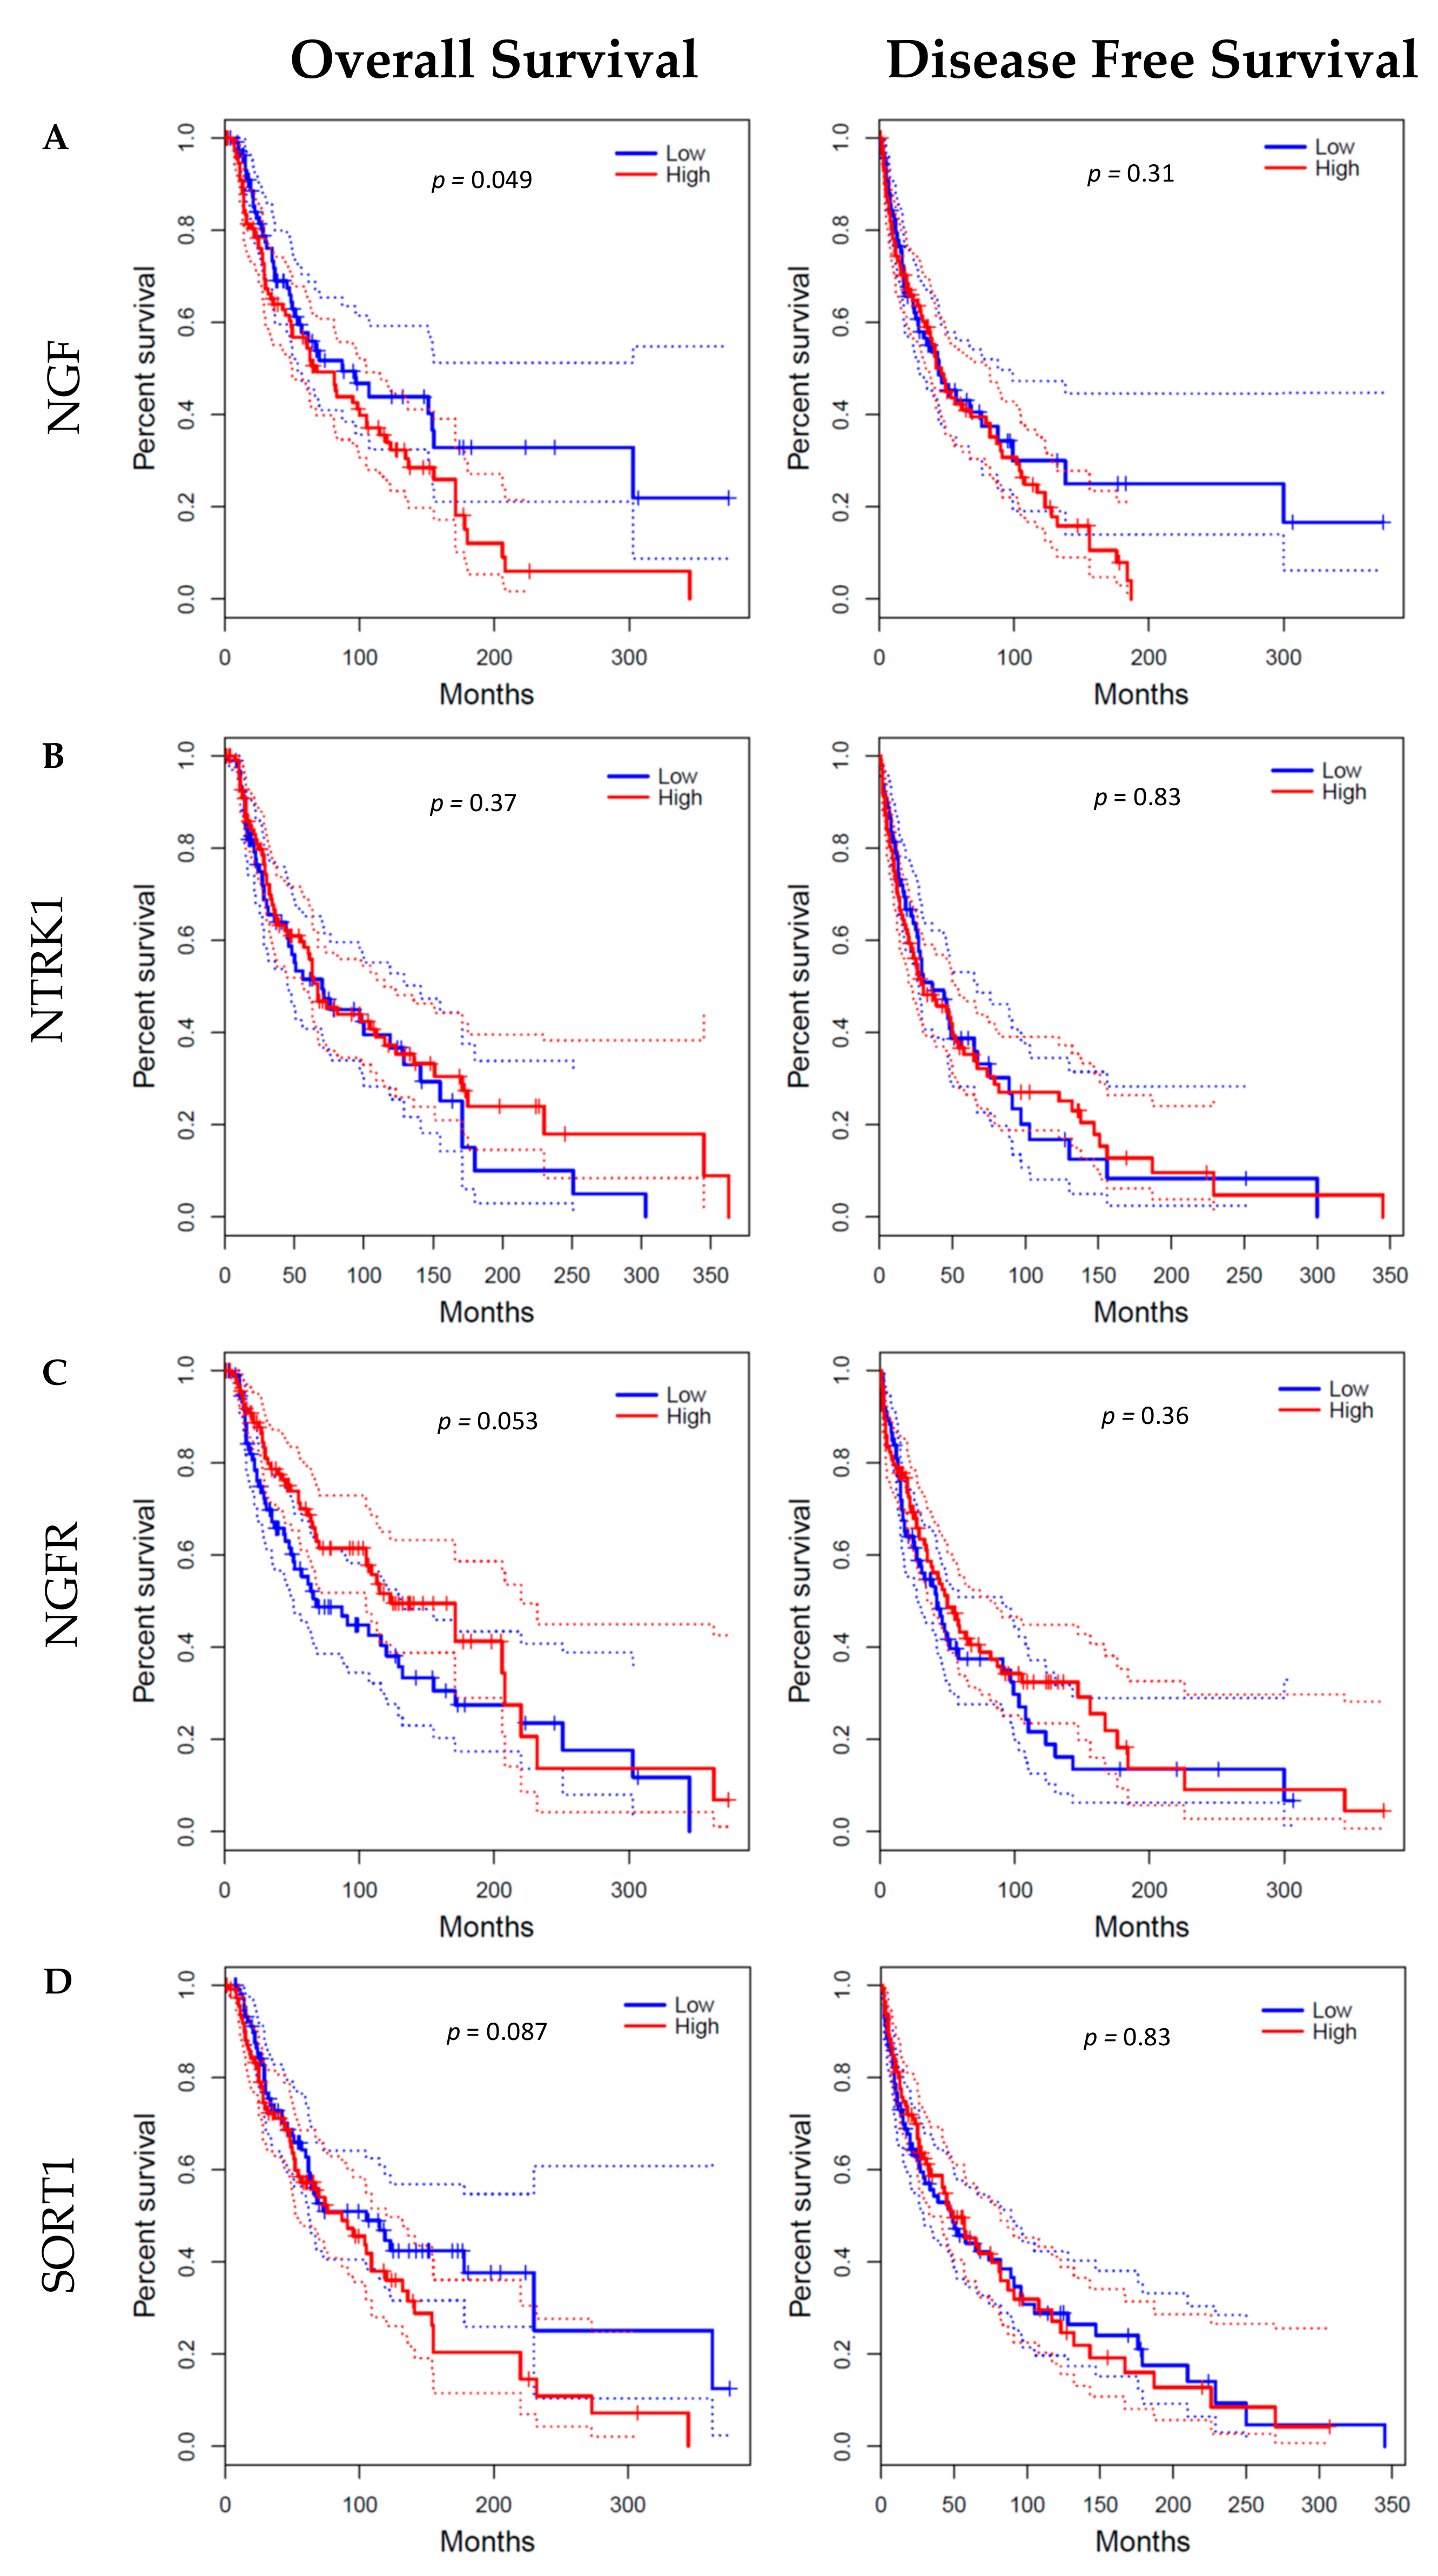
4.4. GEPIA Database
5. Conclusions
Supplementary Materials
Author Contributions
Funding
Institutional Review Board Statement
Informed Consent Statement
Data Availability Statement
Conflicts of Interest
References
- Miller, A.J.; Mihm, M.C., Jr. Melanoma. N. Engl. J. Med. 2006, 355, 51–65. [Google Scholar] [CrossRef]
- Tang, W.; Bronner, M.E. Neural crest lineage analysis: From past to future trajectory. Development 2020, 147, dev193193. [Google Scholar] [CrossRef]
- Truzzi, F.; Marconi, A.; Lotti, R.; Dallaglio, K.; French, L.E.; Hempstead, B.L.; Pincelli, C. Neurotrophins and Their Receptors Stimulate Melanoma Cell Proliferation and Migration. J. Investig. Dermatol. 2008, 128, 2031–2040. [Google Scholar] [CrossRef] [Green Version]
- Bradshaw, R.A.; Pundavela, J.; Biarc, J.; Chalkley, R.J.; Burlingame, A.L.; Hondermarck, H. NGF and ProNGF: Regulation of neuronal and neoplastic responses through receptor signaling. Adv. Biol. Regul. 2015, 58, 16–27. [Google Scholar] [CrossRef] [Green Version]
- Yaar, M.; Grossman, K.; Eller, M.; Gilchrest, B.A. Evidence for nerve growth factor-mediated paracrine effects in human epidermis. J. Cell Biol. 1991, 115, 821–828. [Google Scholar] [CrossRef]
- Herrmann, J.L.; Menter, D.G.; Hamada, J.; Marchetti, D.; Nakajima, M.; Nicolson, G.L. Mediation of NGF-stimulated extracellular matrix invasion by the human melanoma low-affinity p75 neurotrophin receptor: Melanoma p75 functions independently of trkA. Mol. Biol. Cell 1993, 4, 1205–1216. [Google Scholar] [CrossRef] [Green Version]
- Kasemeier-Kulesa, J.C.; Kulesa, P.M. The convergent roles of CD271/p75 in neural crest-derived melanoma plasticity. Dev. Biol. 2018, 444 (Suppl. 1), S352–S355. [Google Scholar] [CrossRef]
- Walch, E.T.; Albino, A.P.; Marchetti, D. Correlation of overexpression of the low-affinity p75 neurotrophin receptor with augmented invasion and heparanase production in human malignant melanoma cells. Int. J. Cancer 1999, 82, 112–120. [Google Scholar] [CrossRef]
- Flørenes, V.A.; Mælandsmo, G.M.; Holm, R.; Reich, R.; Lazarovici, P.; Davidson, B. Expression of Activated TrkA Protein in Melanocytic Tumors: Relationship to Cell Proliferation and Clinical Outcome. Am. J. Clin. Pathol. 2004, 122, 412–420. [Google Scholar] [CrossRef]
- Pasini, L.; Re, A.; Tebaldi, T.; Ricci, G.; Boi, S.; Adami, V.; Barbareschi, M.; Quattrone, A. TrkA is amplified in malignant melanoma patients and induces an anti-proliferative response in cell lines. BMC Cancer 2015, 15, 777. [Google Scholar] [CrossRef] [Green Version]
- Drilon, A.; Siena, S.; Ou, S.-H.I.; Patel, M.; Ahn, M.J.; Lee, J.; Bauer, T.M.; Farago, A.F.; Wheler, J.J.; Liu, S.V.; et al. Safety and Antitumor Activity of the Multitargeted Pan-TRK, ROS1, and ALK Inhibitor Entrectinib: Combined Results from Two Phase I Trials (ALKA-372-001 and STARTRK-1). Cancer Discov. 2017, 7, 400–409. [Google Scholar] [CrossRef] [Green Version]
- Ardini, E.; Menichincheri, M.; Banfi, P.; Bosotti, R.; De Ponti, C.; Pulci, R.; Ballinari, D.; Ciomei, M.; Texido, G.; Degrassi, A.; et al. Entrectinib, a Pan–TRK, ROS1, and ALK Inhibitor with Activity in Multiple Molecularly Defined Cancer Indications. Mol. Cancer Ther. 2016, 15, 628–639. [Google Scholar] [CrossRef] [Green Version]
- Forschner, A.; Forchhammer, S.; Bonzheim, I. NTRK gene fusions in melanoma: Detection, prevalence and potential therapeutic implications. JDDG J. Dtsch. Dermatol. Ges. 2020, 18, 1387–1392. [Google Scholar] [CrossRef]
- Griffin, N.; Faulkner, S.; Jobling, P.; Hondermarck, H. Targeting neurotrophin signaling in cancer: The renaissance. Pharmacol. Res. 2018, 135, 12–17. [Google Scholar] [CrossRef]
- Adriaenssens, E.; Vanhecke, E.; Saule, P.; Mougel, A.; Page, A.; Romon, R.; Nurcombe, V.; Le Bourhis, X.; Hondermarck, H. Nerve Growth Factor Is a Potential Therapeutic Target in Breast Cancer. Cancer Res. 2008, 68, 346–351. [Google Scholar] [CrossRef] [Green Version]
- Faulkner, S.; Jobling, P.; Rowe, C.W.; Oliveira, S.R.; Roselli, S.; Thorne, R.F.; Oldmeadow, C.; Attia, J.; Jiang, C.C.; Zhang, X.D.; et al. Neurotrophin Receptors TrkA, p75NTR, and Sortilin Are Increased and Targetable in Thyroid Cancer. Am. J. Pathol. 2018, 188, 229–241. [Google Scholar] [CrossRef] [Green Version]
- Renz, B.W.; Takahashi, R.; Tanaka, T.; Macchini, M.; Hayakawa, Y.; Dantes, Z.; Maurer, H.C.; Chen, X.; Jiang, Z.; Westphalen, C.B.; et al. β2 Adrenergic-Neurotrophin Feedforward Loop Promotes Pancreatic Cancer. Cancer Cell 2018, 33, 75–90e7. [Google Scholar] [CrossRef] [Green Version]
- Hayakawa, Y.; Sakitani, K.; Konishi, M.; Asfaha, S.; Niikura, R.; Tomita, H.; Renz, B.W.; Tailor, Y.; Macchini, M.; Middelhoff, M.; et al. Nerve Growth Factor Promotes Gastric Tumorigenesis through Aberrant Cholinergic Signaling. Cancer Cell 2017, 31, 21–34. [Google Scholar] [CrossRef] [Green Version]
- Lagadec, C.; Meignan, S.; Adriaenssens, E.; Foveau, B.; Vanhecke, E.; Romon, R.; Toillon, R.-A.; Oxombre, B.; Hondermarck, H.; Le Bourhis, X. TrkA overexpression enhances growth and metastasis of breast cancer cells. Oncogene 2009, 28, 1960–1970. [Google Scholar] [CrossRef] [Green Version]
- Vogel, C.; Marcotte, E.M. Insights into the regulation of protein abundance from proteomic and transcriptomic analyses. Nat. Rev. Genet. 2012, 13, 227–232. [Google Scholar] [CrossRef]
- Zhang, B.; Wang, J.; Wang, X.; Zhu, J.; Liu, Q.; Shi, Z.; Chambers, M.C.; Zimmerman, L.J.; Shaddox, K.F.; Kim, S. Proteogenomic characterization of human colon and rectal cancer. Nature 2014, 513, 382–387. [Google Scholar] [CrossRef] [Green Version]
- Liao, W.; Zhang, H.; Feng, C.; Wang, T.; Zhang, Y.; Tang, S. Downregulation of TrkA protein expression by miRNA-92a promotes the proliferation and migration of human neuroblastoma cells. Mol. Med. Rep. 2014, 10, 778–784. [Google Scholar] [CrossRef] [Green Version]
- Griffin, N.; Gao, F.; Jobling, P.; Oldmeadow, C.; Wills, V.; Walker, M.M.; Faulkner, S.; Hondermarck, H. The neurotrophic tyrosine kinase receptor 1 (TrkA) is overexpressed in oesophageal squamous cell carcinoma. Pathology 2021, 53, 470–477. [Google Scholar] [CrossRef]
- Couts, K.L.; McCoach, C.E.; Murphy, D.; Christiansen, J.; Turner, J.; Lewis, K.D.; Robinson, W.A.; Doebele, R.C. Acral Lentiginous Melanoma Harboring a ROS1 Gene Fusion With Clinical Response to Entrectinib. JCO Precis. Oncol. 2017, 1, 1–7. [Google Scholar] [CrossRef] [Green Version]
- Wiesner, T.; Lee, W.; Obenauf, A.C.; Ran, L.; Murali, R.; Zhang, Q.F.; Wong, E.W.P.; Hu, W.; Scott, S.N.; Shah, R.H.; et al. Alternative transcription initiation leads to expression of a novel ALK isoform in cancer. Nature 2015, 526, 453–457. [Google Scholar] [CrossRef]
- Schrøder, T.J.; Christensen, S.; Lindberg, S.; Langgård, M.; David, L.; Maltas, P.J.; Eskildsen, J.; Jacobsen, J.; Tagmose, L.; Simonsen, K.B.; et al. The identification of AF38469: An orally bioavailable inhibitor of the VPS10P family sorting receptor Sortilin. Bioorgan. Med. Chem. Lett. 2014, 24, 177–180. [Google Scholar] [CrossRef]
- Roselli, S.; Pundavela, J.; Demont, Y.; Faulkner, S.; Keene, S.; Attia, J.; Jiang, C.C.; Zhang, X.D.; Walker, M.M.; Hondermarck, H. Sortilin is associated with breast cancer aggressiveness and contributes to tumor cell adhesion and invasion. Oncotarget 2015, 6, 10473–10486. [Google Scholar] [CrossRef] [Green Version]
- Gao, F.; Griffin, N.; Faulkner, S.; Li, X.; King, S.J.; Jobling, P.; Denham, J.W.; Jiang, C.C.; Hondermarck, H. The Membrane Protein Sortilin Can Be Targeted to Inhibit Pancreatic Cancer Cell Invasion. Am. J. Pathol. 2020, 190, 1931–1942. [Google Scholar] [CrossRef]
- Faulkner, S.; Roselli, S.; Demont, Y.; Pundavela, J.; Choquet, G.; Leissner, P.; Oldmeadow, C.; Attia, J.; Walker, M.M.; Hondermarck, H. ProNGF is a potential diagnostic biomarker for thyroid cancer. Oncotarget 2016, 7, 28488–28497. [Google Scholar] [CrossRef]
- Horai, Y.; Mizukawa, M.; Nishina, H.; Nishikawa, S.; Ono, Y.; Takemoto, K.; Baba, N. Quantification of histopathological findings using a novel image analysis platform. J. Toxicol. Pathol. 2019, 32, 319–327. [Google Scholar] [CrossRef] [Green Version]
- The Cancer Genome Atlas Research Network; Weinstein, J.N.; Collisson, E.A.; Mills, G.B.; Shaw, K.R.M.; Ozenberger, B.A.; Ellrott, K.; Shmulevich, I.; Sander, C.; Stuart, J.M. The Cancer Genome Atlas Pan-Cancer analysis project. Nat. Genet. 2013, 45, 1113–1120. [Google Scholar] [CrossRef]
- Carithers, L.J.; Moore, H.M. The Genotype-Tissue Expression (GTEx) Project. Biopreserv. Biobank. 2015, 13, 307–308. [Google Scholar] [CrossRef] [PubMed]
- Tang, Z.; Li, C.; Kang, B.; Gao, G.; Li, C.; Zhang, Z. GEPIA: A web server for cancer and normal gene expression profiling and interactive analyses. Nucleic Acids Res. 2017, 45, W98–W102. [Google Scholar] [CrossRef] [PubMed] [Green Version]


Publisher’s Note: MDPI stays neutral with regard to jurisdictional claims in published maps and institutional affiliations. |
© 2022 by the authors. Licensee MDPI, Basel, Switzerland. This article is an open access article distributed under the terms and conditions of the Creative Commons Attribution (CC BY) license (https://creativecommons.org/licenses/by/4.0/).
Share and Cite
Marsland, M.; Dowdell, A.; Jiang, C.C.; Wilmott, J.S.; Scolyer, R.A.; Zhang, X.D.; Hondermarck, H.; Faulkner, S. Expression of NGF/proNGF and Their Receptors TrkA, p75NTR and Sortilin in Melanoma. Int. J. Mol. Sci. 2022, 23, 4260. https://doi.org/10.3390/ijms23084260
Marsland M, Dowdell A, Jiang CC, Wilmott JS, Scolyer RA, Zhang XD, Hondermarck H, Faulkner S. Expression of NGF/proNGF and Their Receptors TrkA, p75NTR and Sortilin in Melanoma. International Journal of Molecular Sciences. 2022; 23(8):4260. https://doi.org/10.3390/ijms23084260
Chicago/Turabian StyleMarsland, Mark, Amiee Dowdell, Chen Chen Jiang, James S. Wilmott, Richard A. Scolyer, Xu Dong Zhang, Hubert Hondermarck, and Sam Faulkner. 2022. "Expression of NGF/proNGF and Their Receptors TrkA, p75NTR and Sortilin in Melanoma" International Journal of Molecular Sciences 23, no. 8: 4260. https://doi.org/10.3390/ijms23084260