
Interactions between Nanoclay, CTAB and Linear/Star Shaped Polymers

 , , ,
, , ,  and
and
Abstract
:
1. Introduction
- -
- studying the interactions between CTAB and PAA of different molecular weights and structures
- -
- determination of the influence of the PAA structure, its molecular weight and the presence of CTAB on the stabilizing and adsorptive properties of the PAA/N-SM system
- -
- studying the structure of the adsorption layer in the PAA/N-SM and PAA/CTAB/N-SM systems, determination of the shapes of the formed lamellae and precise indication where exactly the adsorption process takes place
- -
- an indication of the best conditions to obtain the most stable PAA/N-SM system.
2. Results and Discussion
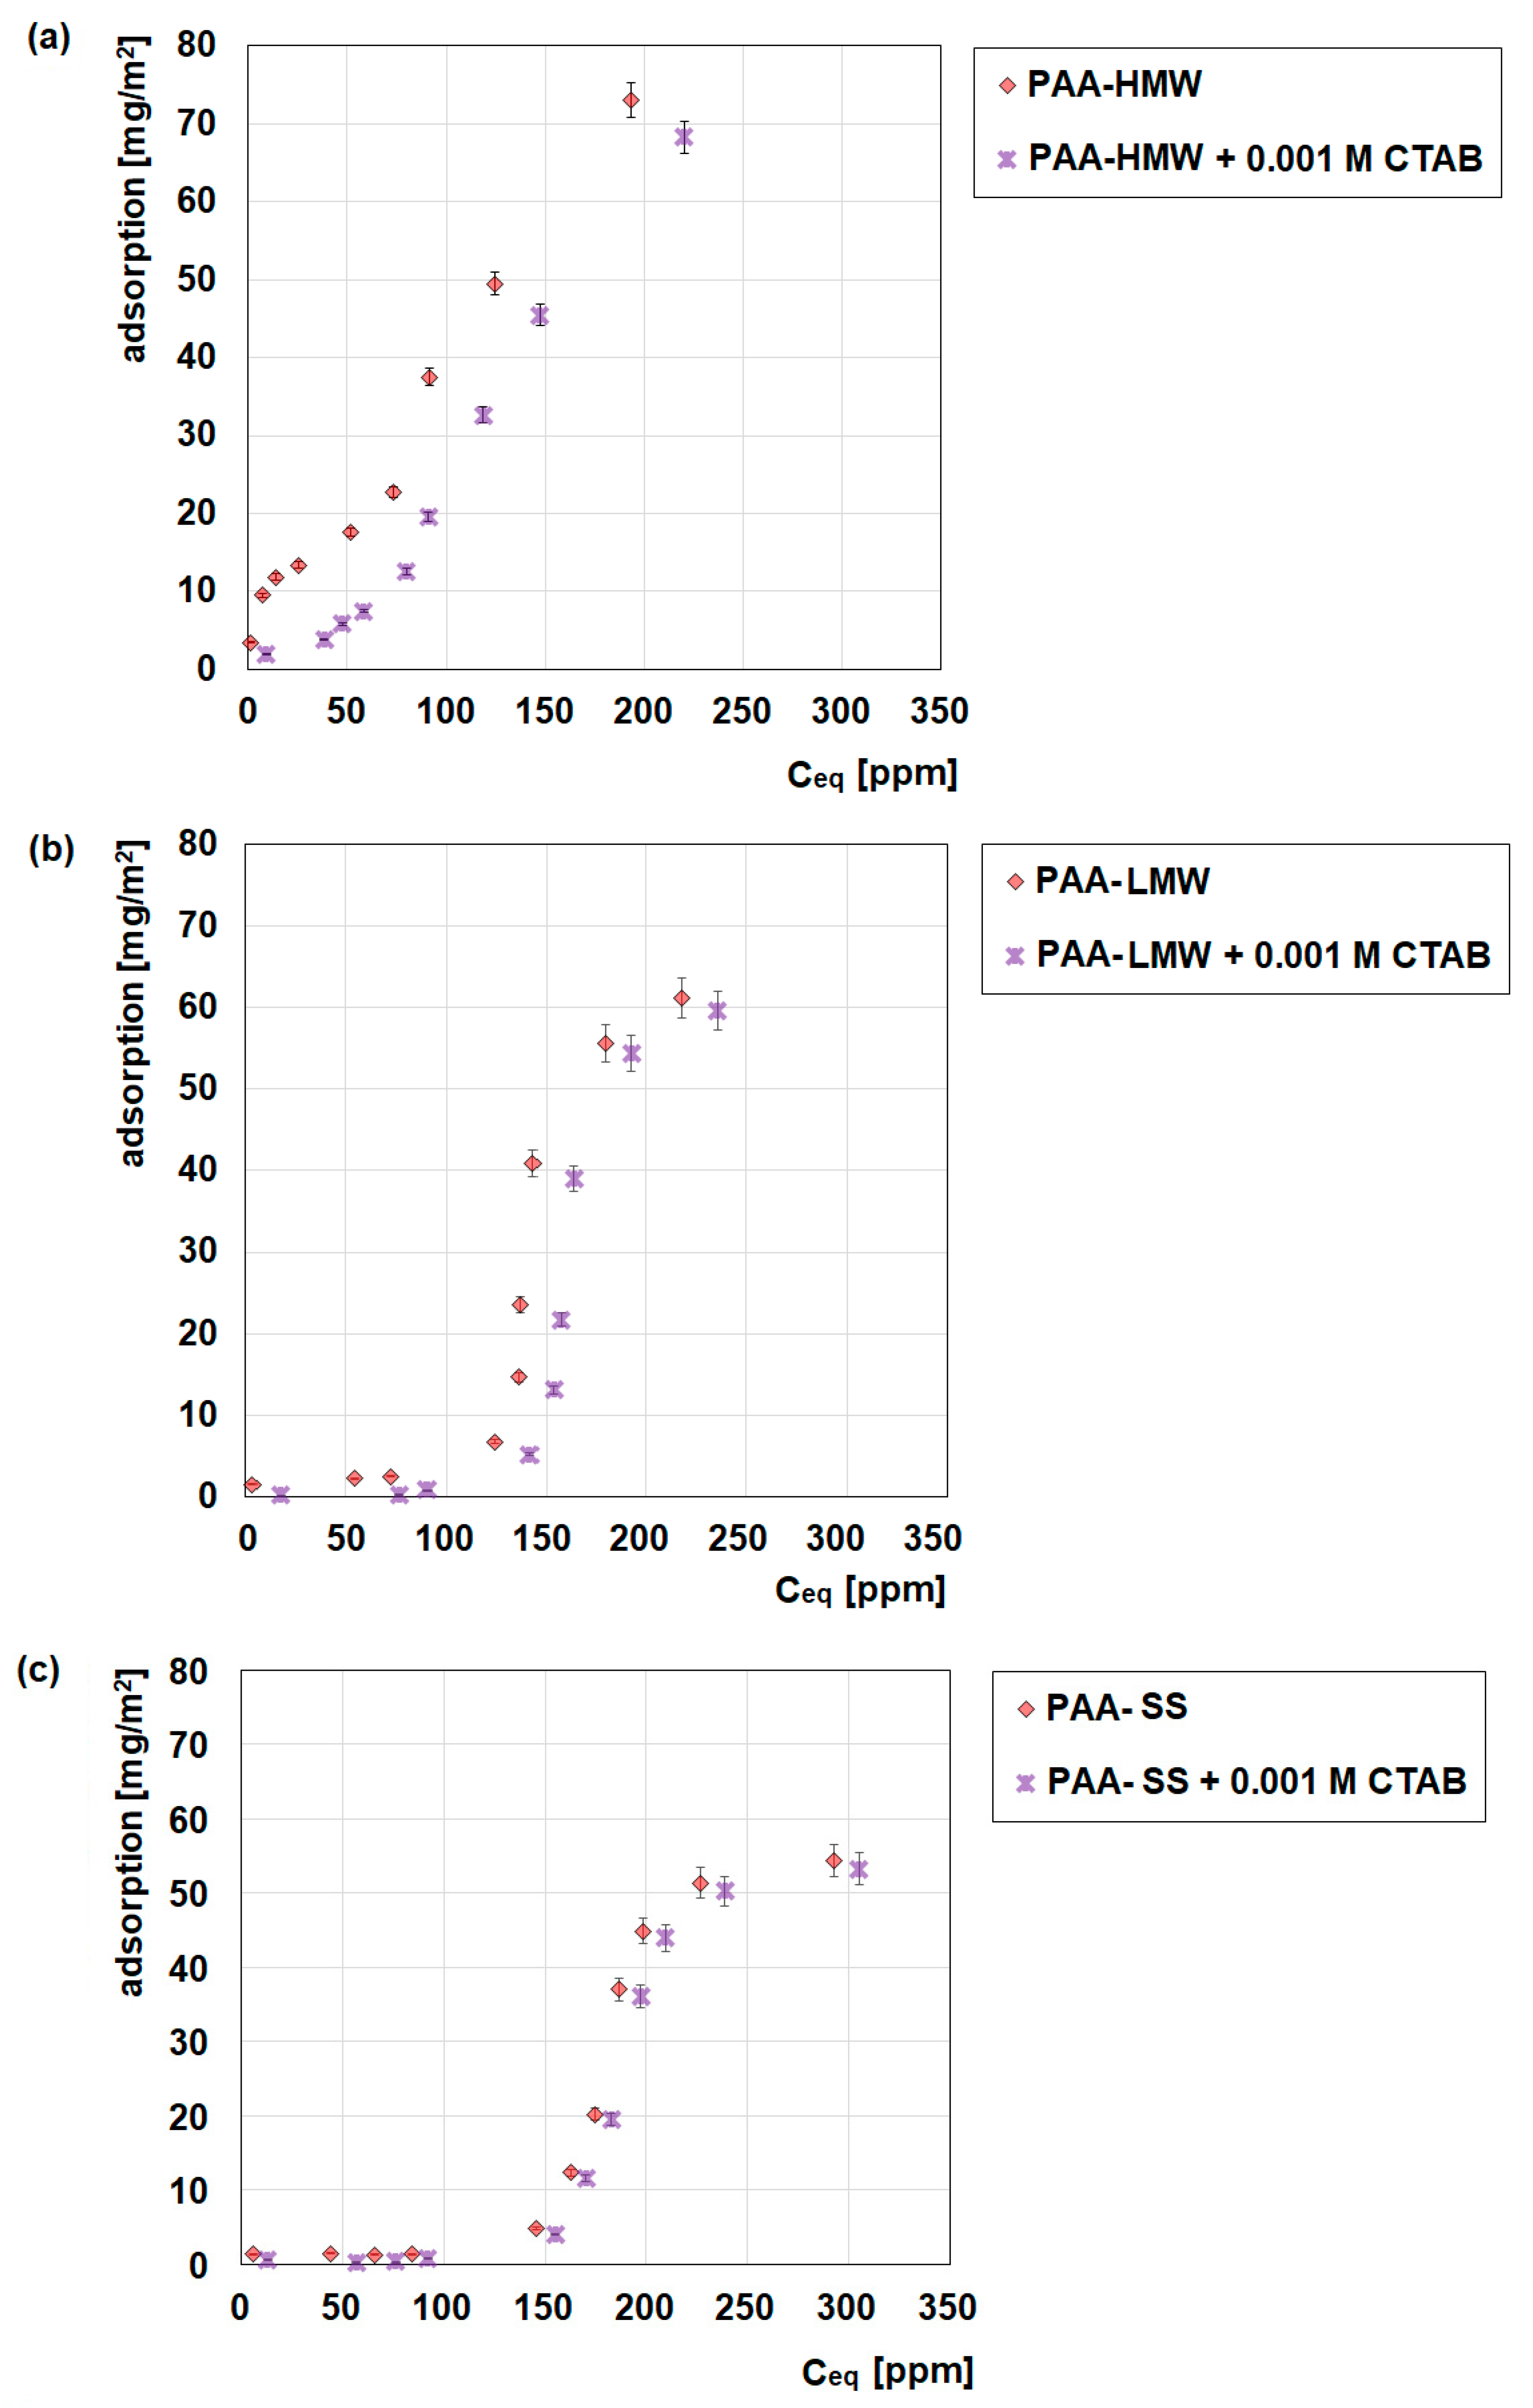
2.1. Adsorption Measurements
2.2. Polymer-Surfactant Complexes in Solutions
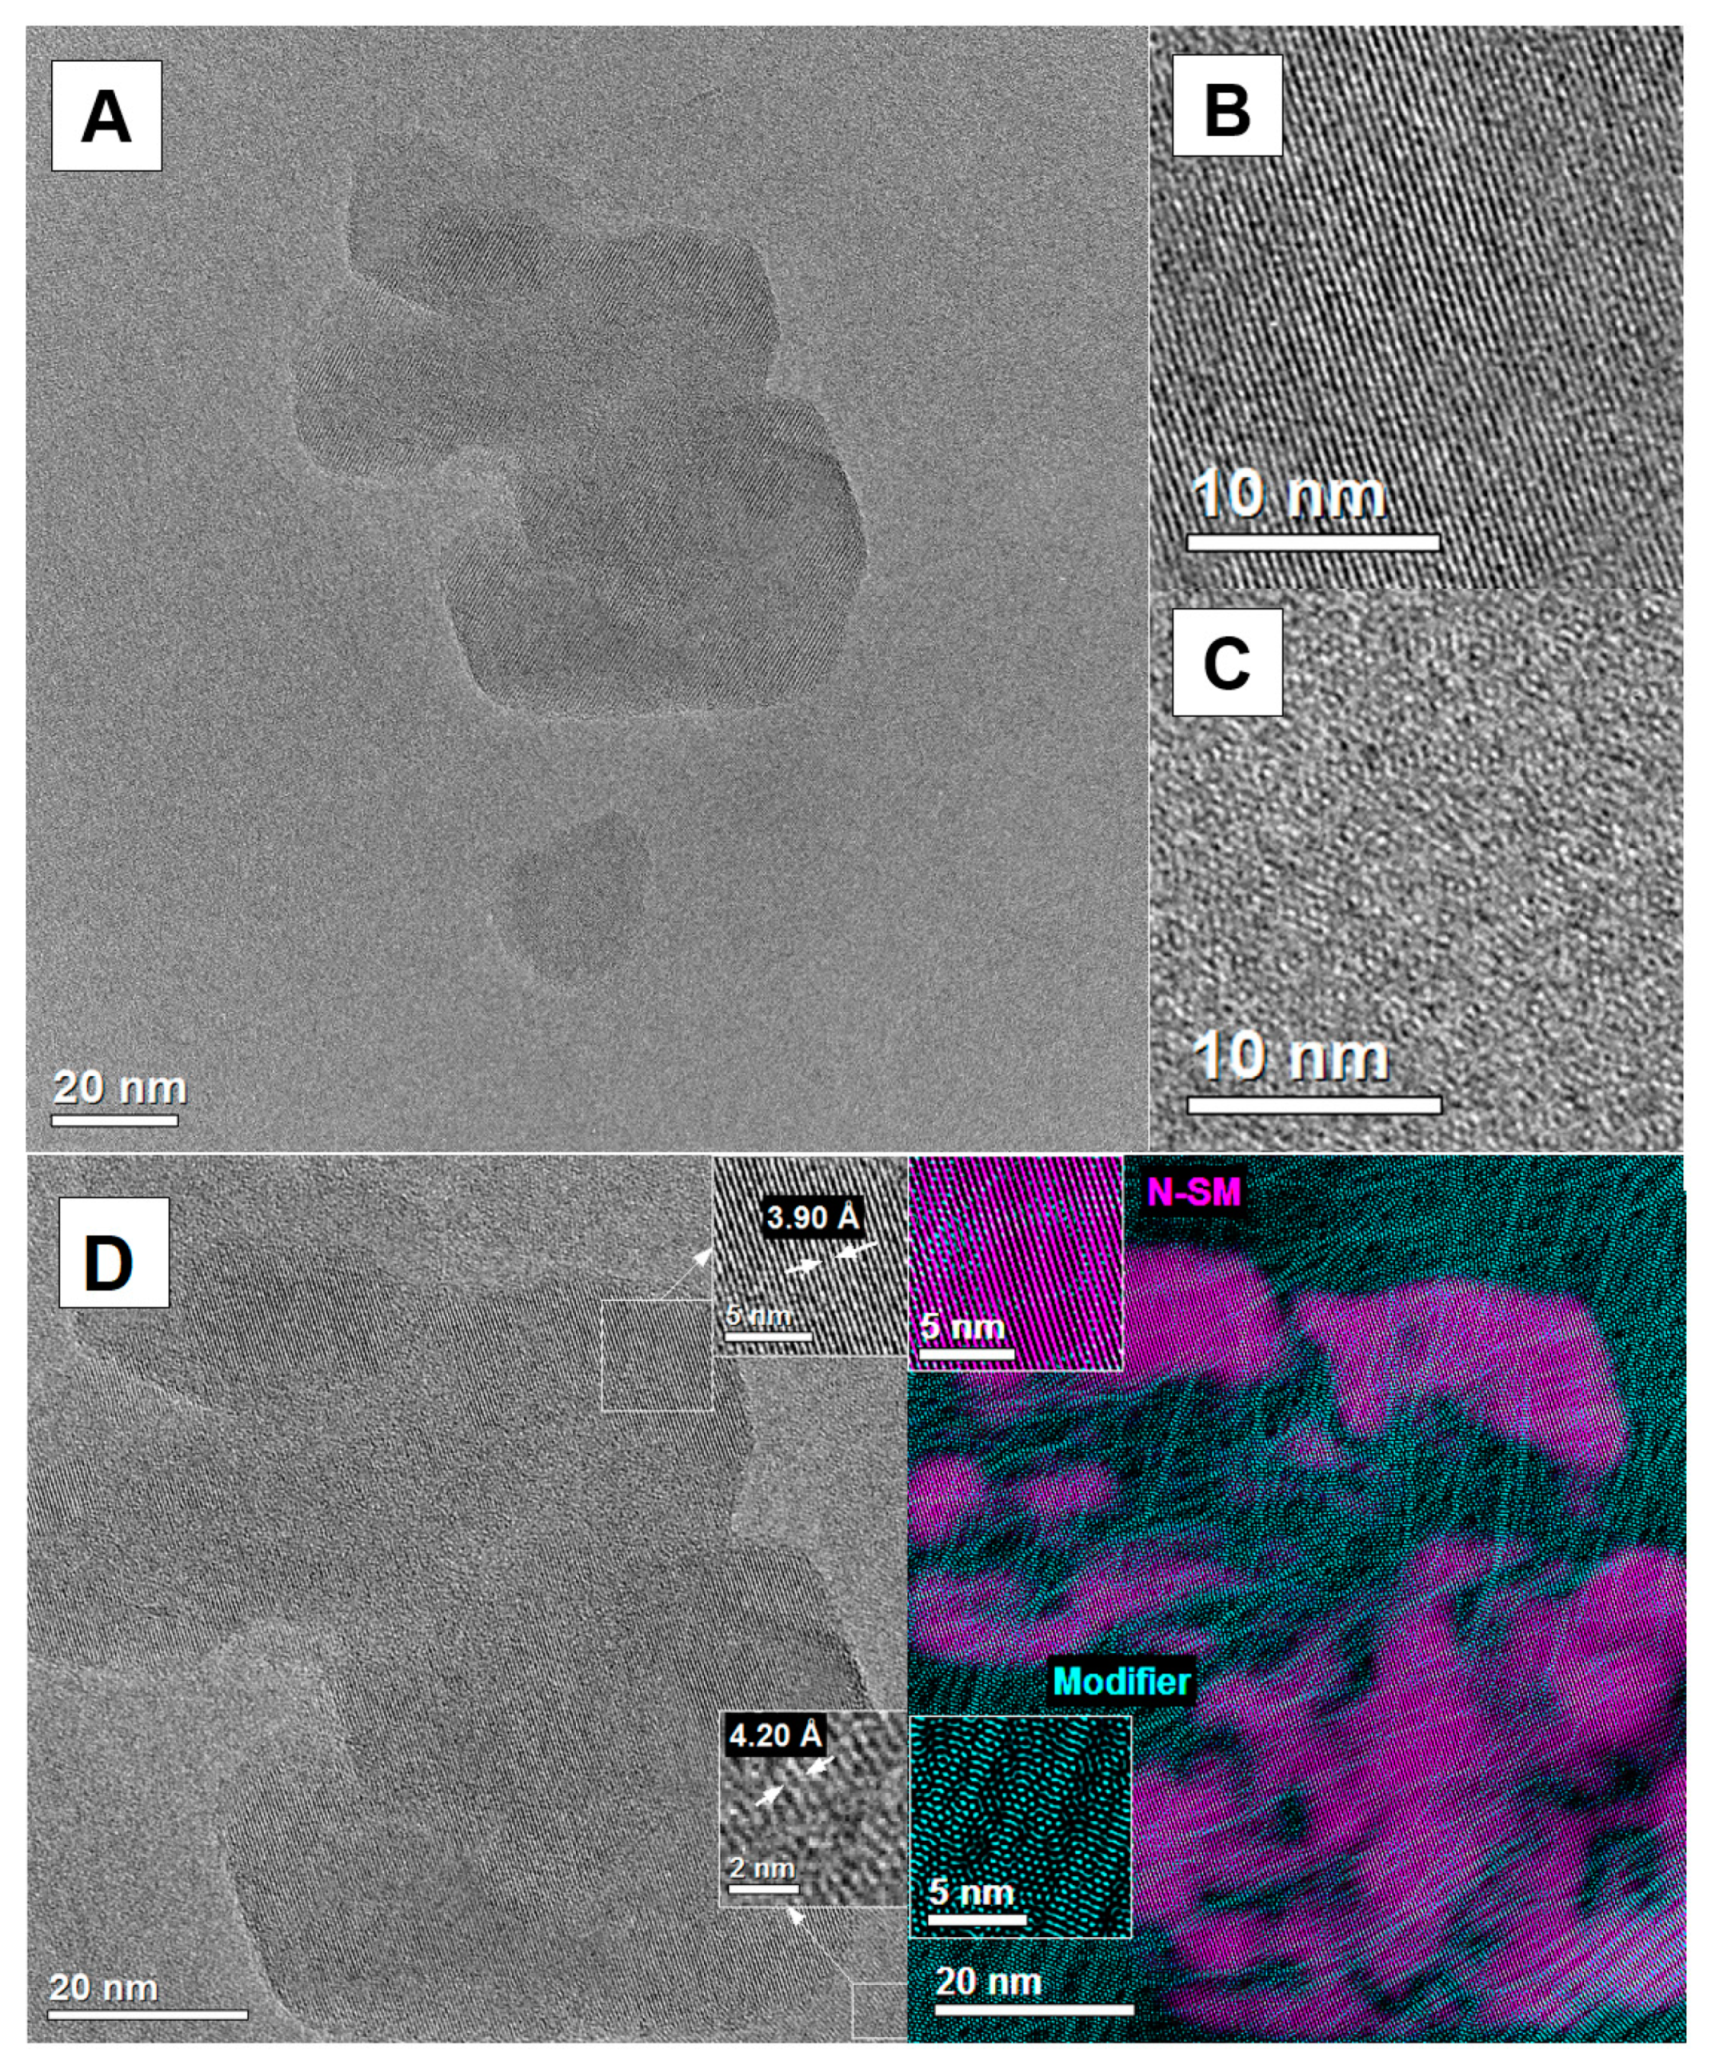
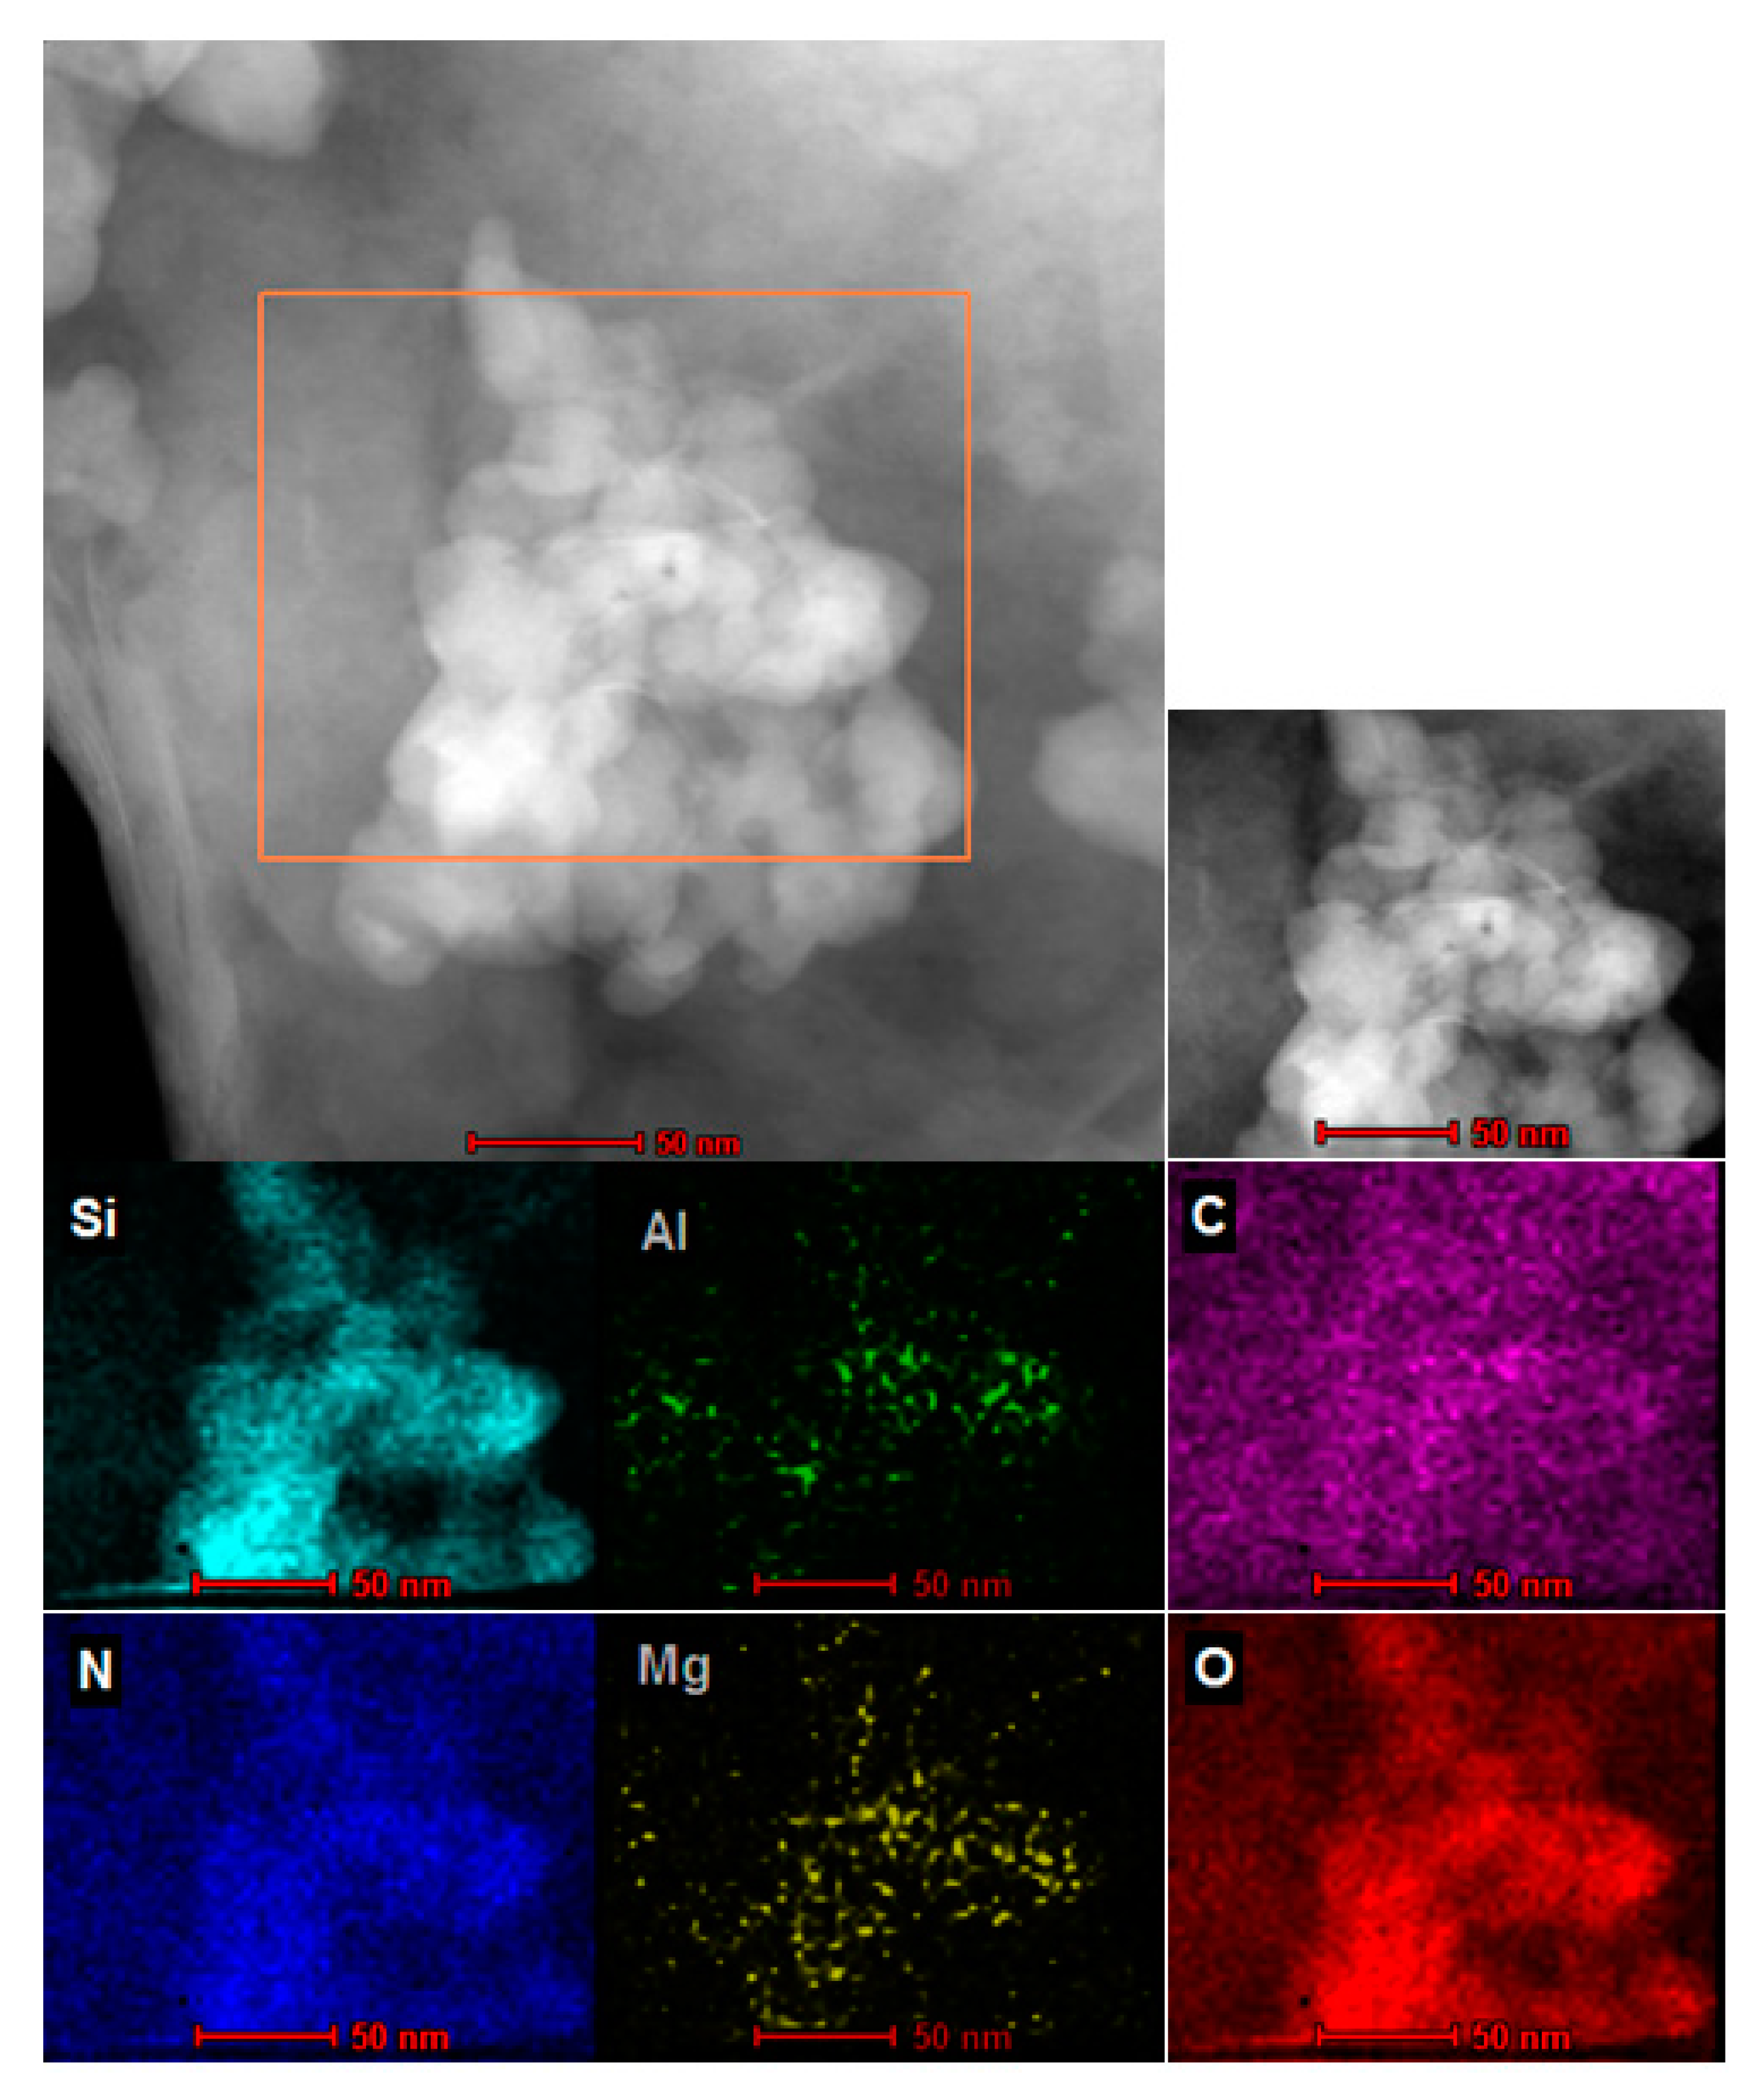
2.3. HRTEM
2.4. IR Spectroscopy
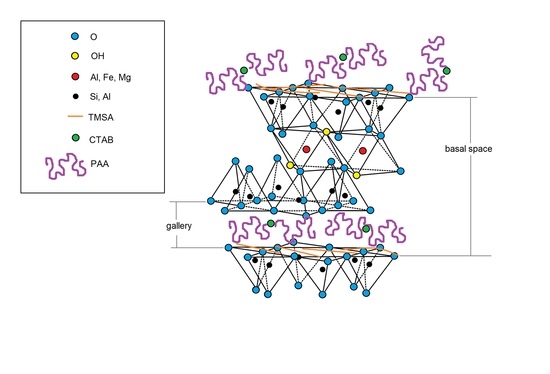
2.5. XRD Analysis
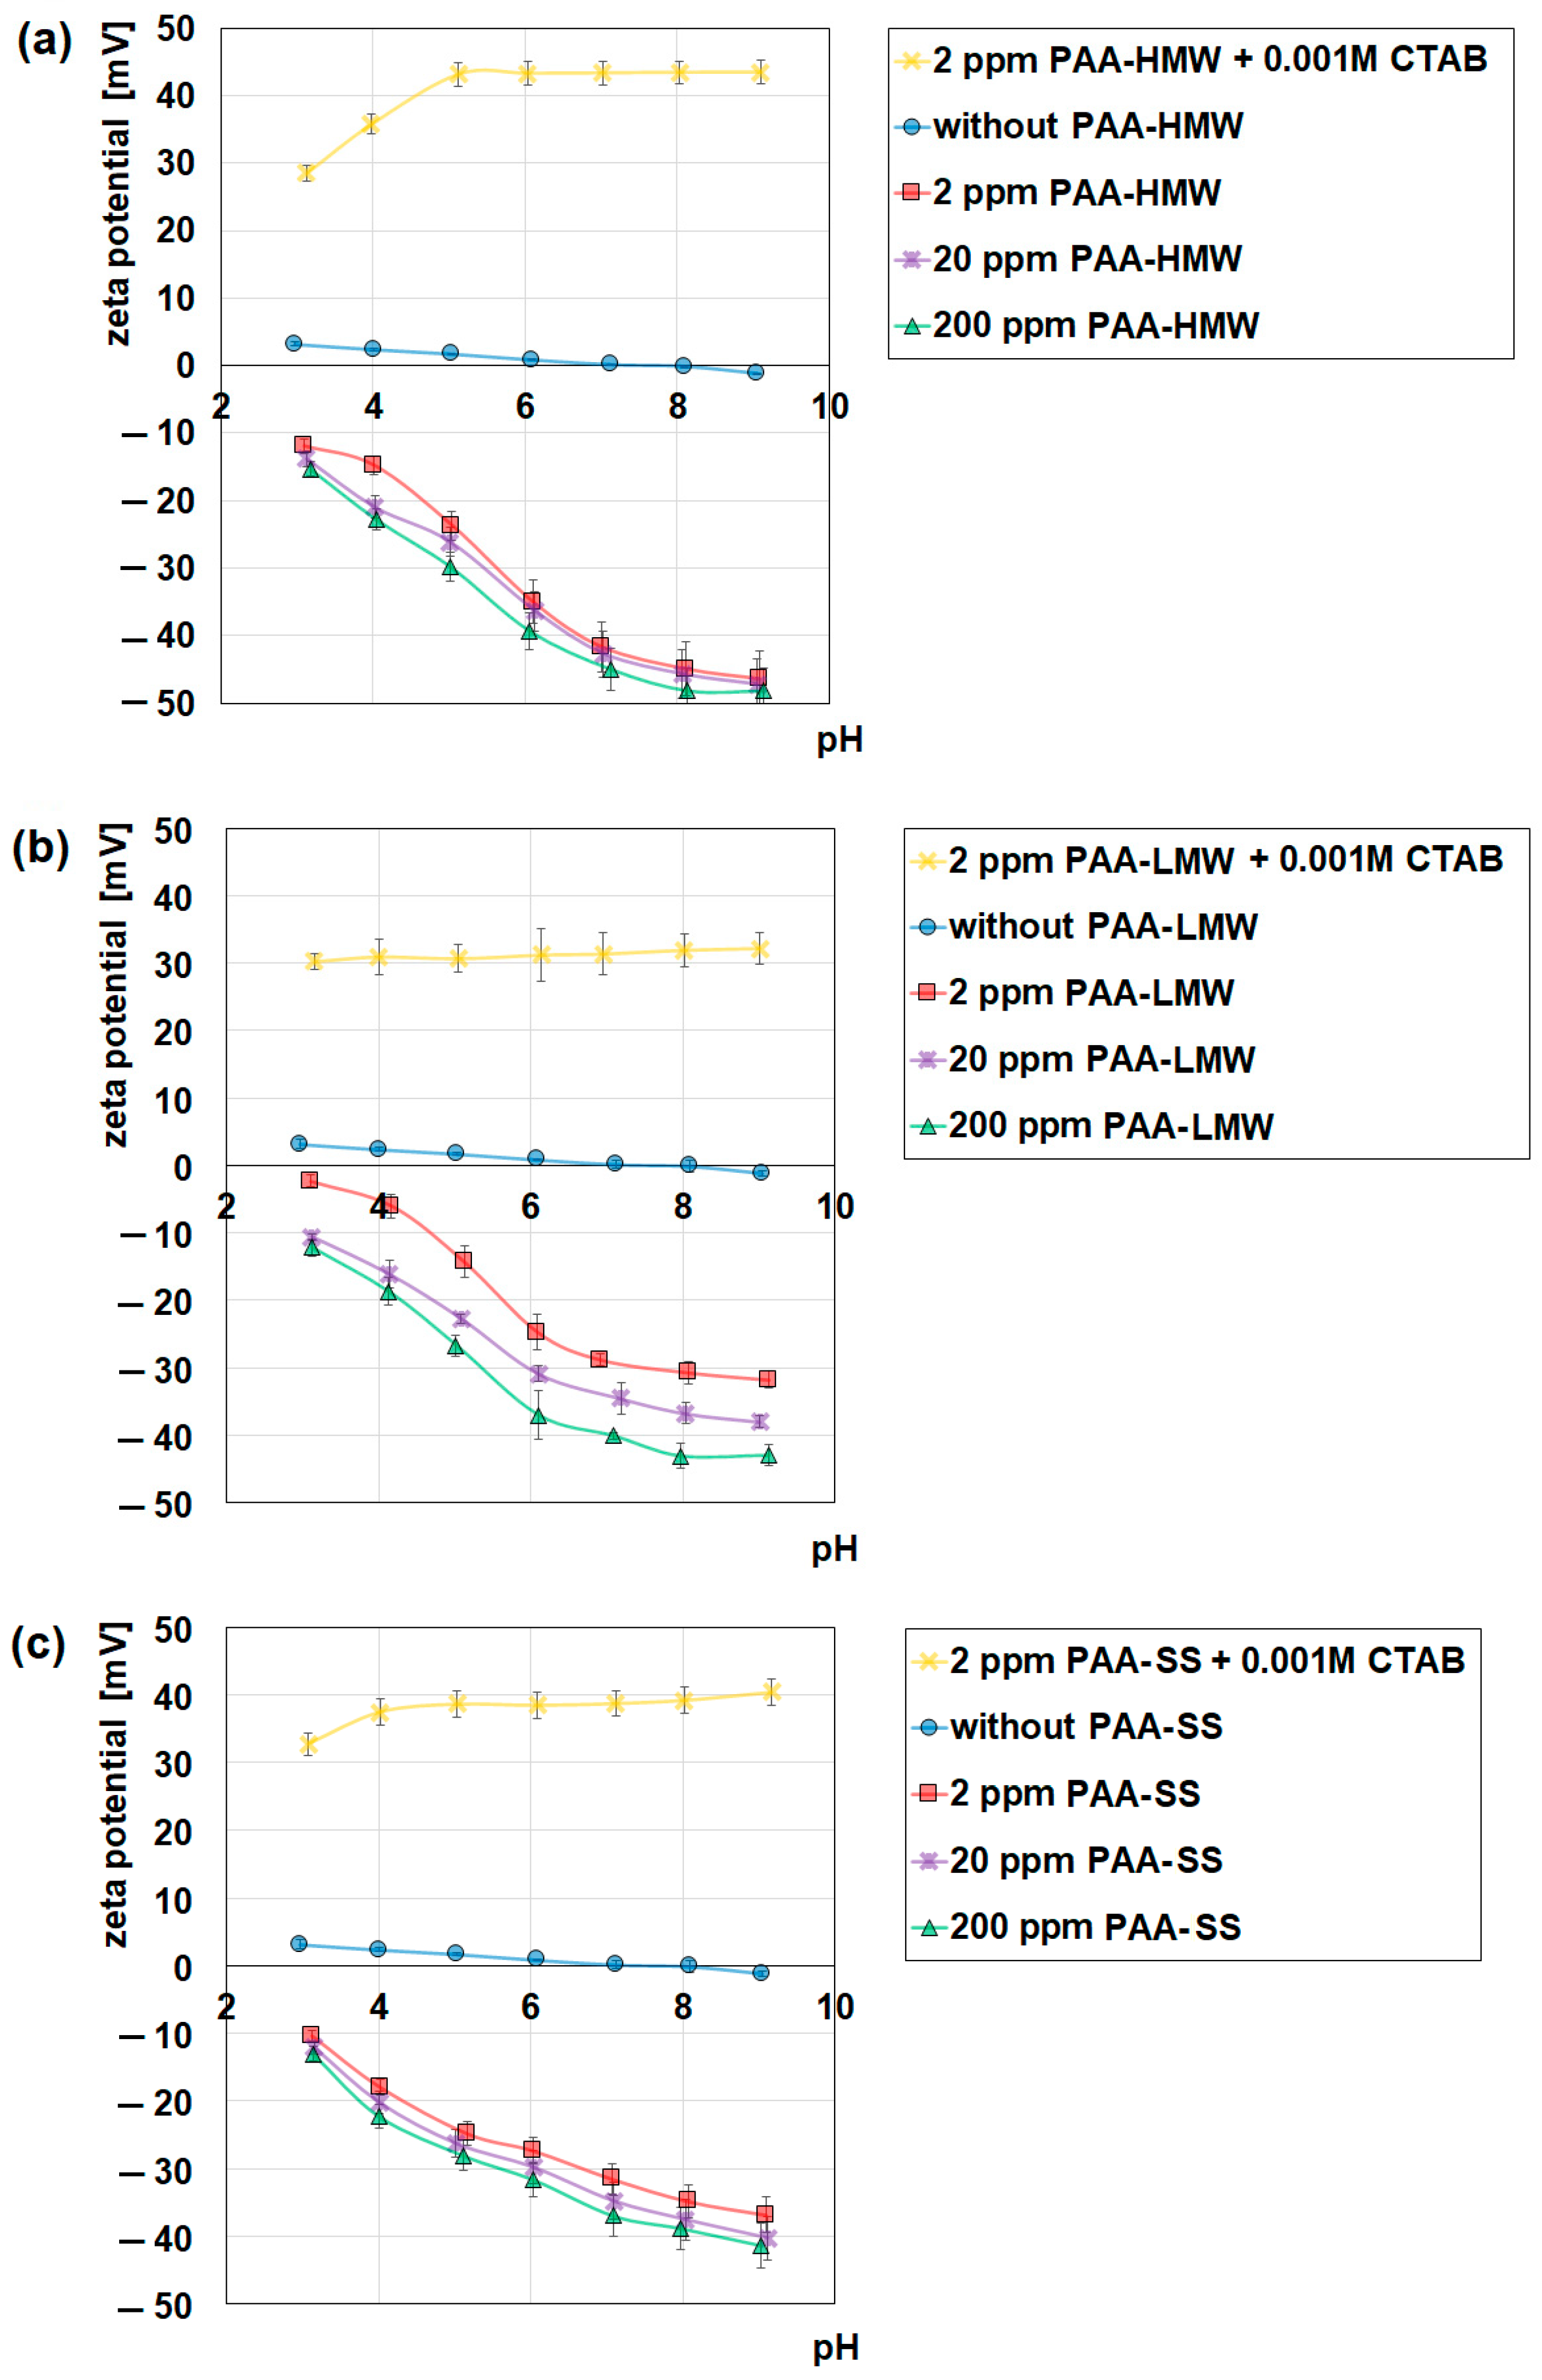
2.6. Zeta Potential Measurements
2.7. Stability Measurements
3. Materials and Methods
3.1. Materials
Synthesis of the Star Polymer with the Poly[p-(iodomethyl)styrene] Core and Poly(acrylic acid) Arms
3.2. Methods
3.2.1. Adsorption Measurements
3.2.2. Surface Tension Measurements
3.2.3. High Resolution Transmission Electron Microscopy (HRTEM)
3.2.4. FT-IR Spectroscopy
3.2.5. XRD Studies
3.2.6. Zeta Potential Measurements
3.2.7. Stability Measurements
4. Conclusions
Author Contributions
Funding
Institutional Review Board Statement
Informed Consent Statement
Data Availability Statement
Acknowledgments
Conflicts of Interest
Appendix A


References
- Pandey, S. A comprehensive review on recent developments in bentonite-based materials used as adsorbents for wastewater treatment. J. Mol. Liq. 2017, 241, 1091–1113. [Google Scholar] [CrossRef]
- Unuabonah, E.I.; Taubert, A. Clay-polymer nanocomposites (CPNs): Adsorbents of the future for water treatment. Appl. Clay Sci. 2014, 99, 83–92. [Google Scholar] [CrossRef]
- Niu, X.J.; Li, Q.B.; Hu, Y.; Tan, Y.S.; Liu, C.F. Properties of cement-based materials incorporating nano-clay and calcined nano-clay: A review. Constr. Build. Mater. 2021, 284, 122820. [Google Scholar] [CrossRef]
- Martins, J.P.; Ferreira, M.P.A.; Ezazi, N.Z.; Hirvonen, J.T.; Santos, H.A. Chapter 4—3D printing: Prospects and challenges. In Nanotechnologies in Preventive and Regenerative Medicine; Uskokovic, V., Ed.; Elsevier: Amsterdam, The Netherlands, 2018; pp. 299–379. [Google Scholar] [CrossRef]
- Montazer, M.; Harifi, T. Chapter 6—Nanosoftening. In Nanofinishing of Textile Materials; Elsevier: Amsterdam, The Netherlands, 2018; pp. 83–94. [Google Scholar] [CrossRef]
- Harraz, H.Z. Nano clay and it’s applications. Appl. Mineral. 2016. [CrossRef]
- Al-Mistarehi, B.; Al-Omari, A.; Taamneh, M.; Imamem, R.; Al-Deen Khafaja, D. The effects of adding nano clay and nano zinc oxide on asphalt cement rheology. J. King Saud Univ. Eng. Sci. 2021, in press. [CrossRef]
- Khajeh, M.; Ghaemi, A. Exploiting response surface methodology for experimental modeling and optimization of CO2 adsorption onto NaOH-modified nanoclay montmorillonite. J. Environ. Chem. Eng. 2020, 8, 103663. [Google Scholar] [CrossRef]
- Felbeck, T.; Moss, S.; Botas, A.M.P.; Lezhnina, M.M.; Ferreira, R.A.S.; Carlos, L.D.; Kynast, U.H. Monitoring of nanoclay–protein adsorption isotherms via fluorescence techniques. Colloids Surf. B Biointerfaces 2017, 157, 373–380. [Google Scholar] [CrossRef]
- Djamaa, Z.; Lerari, D.; Mesli, A.; Bachari, K. Poly (acrylic acid-co-styrene)/ clay nanocomposites: Efficient adsorbent for methylene blue dye pollutant. Int. J. Plast. Technol. 2019, 23, 110–121. [Google Scholar] [CrossRef]
- Huang, G.; Liang, H.; Wang, X.; Gao, J. Poly (acrylic acid)/ Clay Thin Films Assembled by Layer-by-Layer Deposition for Improving the Flame Retardancy Properties of Cotton. Ind. Eng. Chem. Res. 2012, 51, 12299–12309. [Google Scholar] [CrossRef]
- Wu, T.; Xie, T.; Yang, G. Preparation of exfoliated polyacrylic clay nanocomposites with high loading: An investigation into the intercalation of ammonium-terminated polyacrylic acid and polyacrylates. J. Polym. Sci. Part. B Polym. Phys. 2008, 46, 2335–2340. [Google Scholar] [CrossRef]
- Zhang, J.; Wang, L.; Wang, A. Preparation and Properties of Chitosan-g-poly (acrylic acid)/Montmorillonite Superabsorbent Nanocomposite via in Situ Intercalative Polymerization. Ind. Eng. Chem. Res. 2007, 46, 2497–2502. [Google Scholar] [CrossRef]
- Liu, P.S.; Li, L.; Zhou, N.L.; Zhang, J.; Wei, S.H.; Shen, J. Synthesis and properties of a poly (acrylic acid)/montmorillonite superabsorbent nanocomposite. J. Appl. Polym. Sci. 2006, 102, 5725–5730. [Google Scholar] [CrossRef]
- Elliott, J.E.; MacDonald, M.; Nie, J.; Bowman, C.N. Structure and swelling of poly (acrylic acid) hydrogels: Effect of pH, ionic strength, and dilution on the crosslinked polymer structure. Polymer 2004, 45, 1503–1510. [Google Scholar] [CrossRef]
- Fuhrer, L.M.; Sun, S.; Boyko, V.; Kellermeier, M.; Cölfen, H. Tuning the properties of hydrogels made from poly (acrylic acid) and calcium salts. Phys. Chem. Chem. Phys. 2020, 22, 18631–18638. [Google Scholar] [CrossRef] [PubMed]
- Du, W.; Slaný, M.; Wang, X.; Chen, G.; Zhang, J. The inhibition property and mechanism of a novel low molecular weight zwitterionic copolymer for improving wellbore stability. Polymers 2020, 12, 708. [Google Scholar] [CrossRef] [PubMed] [Green Version]
- Grabowska, B.; Sitarz, M.; Olejnik, E.; Kaczmarska, K.; Tyliszczak, B. FT-IR and FT-Raman studies of cross-linking processes with Ca2+ ions, glutaraldehyde and microwave radiation for polymer composition of poly (acrylic acid)/ sodium salt of carboxymethyl starch—in moulding sands, part II. Spectrochim. Acta Part A Mol. Biomol. 2015, 151, 27–33. [Google Scholar] [CrossRef] [PubMed]
- Terao, K. Poly (acrylic acid) (PAA); Springer: Berlin/Heidelberg, Germany, 2014; pp. 1654–1658. [Google Scholar] [CrossRef]
- Wang, L.; Zhang, J.; Wang, A. Fast removal of methylene blue from aqueous solution by adsorption onto chitosan-g-poly (acrylic acid)/ attapulgite composite. Desalination 2011, 266, 33–39. [Google Scholar] [CrossRef]
- Gupta, V.K.; Agarwal, S.; Singh, P.; Pathania, D. Acrylic acid grafted cellulosic Luffa cylindrical fiber for the removal of dye and metal ions. Carbohydr. Polym. 2013, 98, 1214–1221. [Google Scholar] [CrossRef]
- Rahman, M.M.; Rimu, S.H.; Biswas, S.; Rashid, T.U.; Chisty, A.H.; Rahman, A.; Murad, S.; Haque, P. Preparation of poly (acrylic acid) exfoliated clay composite by in-situ polymerisation for decolouration of methylene blue from wastewater. Int. J. Environ. Anal. Chem. 2020, 1, 1–17. [Google Scholar] [CrossRef]
- Liu, J.; Liu, G.; Liu, W. Preparation of water-soluble β-cyclodextrin/poly (acrylic acid)/ graphene oxide nanocomposites as new adsorbents to remove cationic dyes from aqueous solutions. Chem. Eng. J. 2014, 257, 299–308. [Google Scholar] [CrossRef]
- Atefeh, S.; Alipour, E.; Sadeghi, M. Superabsorbent magnetic Fe3O4-based starch-poly (acrylic acid) nanocomposite hydrogel for efficient removal of dyes and heavy metal ions from water. J. Polym. Res. 2019, 26, 1–14. [Google Scholar] [CrossRef]
- Islam, M.M.; Khan, M.N.; Biswas, S.; Choudhury, T.R.; Haque, P.; Rashid, T.U.; Rahman, M.M. Preparation and characterization of bijoypur clay-crystalline cellulose composite for application as an adsorbent. Adv. Mater. Sci. Eng. 2017, 2, 3–7. [Google Scholar] [CrossRef] [Green Version]
- Biswas, S.; Rashid, T.U.; Mallik, A.K.; Islam, M.; Khan, M.N.; Haque, P.; Khan, M.; Rahman, M.M. Facile preparation of biocomposite from prawn shell derived chitosan and kaolinite-rich locally available clay. Int. J. Polym. Sci. 2017, 2017, 1–8. [Google Scholar] [CrossRef] [Green Version]
- Biswas, S.; Rashid, T.U.; Debnath, T.; Haque, P.; Rahman, M.M. Application of Chitosan-Clay Biocomposite Beads for Removal of Heavy Metal and Dye from Industrial Effluent. J. Compos. Sci. 2020, 4, 16. [Google Scholar] [CrossRef] [Green Version]
- Matusiak, J.; Grządka, E. Cationic Starch as the effective floculant of silica in the presence of different surfactants. Sep. Purif. Technol. 2020, 234, 116132. [Google Scholar] [CrossRef]
- Saigal, T.; Riley, J.K.; Golas, P.L.; Bodvik, R.; Claesson, P.M.; Matyjaszewski, K.; Tilton, R.D. Poly (ethylene oxide) star polymer adsorption at the silica/aqueous interface and displacement by linear poly (ethylene oxide). Langumir 2013, 29, 3999–4007. [Google Scholar] [CrossRef] [PubMed]
- Hadjichristidis, N.; Pitsikalis, M.; Iatrou, H.; Driva, P.; Sakellariou, S.; Chatzichristidi, M. Polymers with Star-Related Structures: Synthesis, Properties, and Applications. In Polymer Science: A Comprehensive Reference; Elsevier: Amsterdam, The Netherlands, 2012; pp. 29–111. [Google Scholar]
- Ren, J.; McKenzie, T.; Fu, Q.; Wong, E.; Xu, J.; An, Z.; Shanmugam, S.; Davis, T.; Boyer, C.; Qiao, G. Star polymers. Chem. Rev. 2016, 116, 6743–6836. [Google Scholar] [CrossRef]
- Xie, H.Q.; Xie, D. Molecular design, synthesis and properties of block and graft copolymers containing polyoxyethylene segments. Prog. Polym. Sci. 1999, 24, 275–313. [Google Scholar] [CrossRef]
- Ba-Gia, H.; Jerome, R.; Teyssie, P. Star-shaped block copolymers. J. Appl. Sci. 1981, 26, 343–351. [Google Scholar] [CrossRef]
- Sheridan, J.; Sonebi, M.; Taylor, S.; Amziane, S. The effect of a polyacrylic acid viscosity modifying agent on the mechanical, thermal and transport properties of hemp and rapeseed straw concrete. Constr. Build. Mater. 2020, 235, 117536. [Google Scholar] [CrossRef]
- Burchard, W. Solution Properties of Branched Macromolecules. Adv. Polym. Sci. 1999, 143, 113–194. [Google Scholar] [CrossRef]
- Wenli, L.; Dong, H.; Li, W.; Qingxia, L.; Jian, F. Synthesis and property evaluation of a salt- and alkali-resistant star-polymer. Pet. Explor. Dev. 2010, 37, 477–482. [Google Scholar] [CrossRef]
- Kowalczuk, A.; Kronek, J.; Bosowska, K.; Trzebicka, B.; Dworak, A. Star poly(2-ethyl-2-oxazoline)s-synthesis and thermosensitivity. Polym. Int. 2011, 60, 1001–1009. [Google Scholar] [CrossRef]
- Gebhardt, J.E.; Fuerstenau, D.W. Adsorption of polyacrylic acid at oxide/water interfaces. Colloids Surf. A Physicochem. Eng. Asp. 1983, 7, 221–231. [Google Scholar] [CrossRef]
- Inglezakis, V.J.; Poulopoulos, S.G.; Kazemian, H. Insights into the S-shaped sorption isotherms and their dimensionless forms. Microporous Mesoporous Mater. 2018, 272, 166–176. [Google Scholar] [CrossRef]
- Giles, C.H.; Smith, D.; Huitson, J. A general treatment and classification of the solute adsorption isotherm. J. Colloid Interface Sci. 1974, 47, 755–765. [Google Scholar] [CrossRef]
- Limousin, G.; Gaudet, J.P.; Charlet, L.; Szenknect, S.; Barthes, V.; Krimissa, M. Sorption isotherms: A review on physical bases, modeling and measurement. Appl. Geochem. 2007, 22, 249–275. [Google Scholar] [CrossRef]
- Napper, D.H. Polymeric Stabilization of Colloidal Dispersion; Academic Press: New York, NY, USA, 1983. [Google Scholar]
- Moudgil, B.M.; Prakash, T.S. Competitive adsorption of polymer and surfactants on solid substrates. Colloids Surf. A: Physicochem. Eng. Asp. 1998, 133, 93–97. [Google Scholar] [CrossRef]
- Grządka, E. Factors influencing the stability of the polysucrose/alumina system. Colloid Polym. Sci. 2015, 293, 2845–2853. [Google Scholar] [CrossRef]
- Li, W.; Zhang, M.; Zhang, J.; Han, Y. Self-assembly of cetyl trimethylammonium bromide in ethanol-water mixtures. Front. Chem. China 2006, 1, 438–442. [Google Scholar] [CrossRef]
- Kwak, J.C.T. Polymer-Surfactant Systems; CRC Press: New York, NY, USA, 1998. [Google Scholar]
- Nagarajan, R. Polymer-Surfactant Interactions. In New Horizons: Detergents for the New Millennium Conference Invited Papers; American Oil Chemists Society and Consumer Specialty Products Association: Fort Myers, FL, USA, 2001. [Google Scholar]
- Touhami, Y.; Rana, D.; Neale, G.H.; Hornof, V. Study of polymer-surfactant interactions via surface tension measurements. Colloid Polym. Sci. 2001, 279, 297–300. [Google Scholar] [CrossRef]
- Wangsakan, A.; Chinachoti, P.; McClements, D.J. Effect of Surfactant Type on Surfactant−Maltodextrin Interactions: Isothermal Titration Calorimetry, Surface Tensiometry, and Ultrasonic Velocimetry Study. Langmuir 2004, 20, 3913–3919. [Google Scholar] [CrossRef] [PubMed]
- Mohsenipour, A.A.; Pal, R. A Review of Polymer-surfactant Interactions. In Handbook of Surface and Colloid Chemistry; Birdi, K.S., Ed.; CRC Press: Boca Raton, FL, USA, 2015; pp. 639–684. [Google Scholar]
- Diamant, H.; Andelman, D. Onset of self-assembly in polymer-surfactant systems. Europhys. Lett. 1999, 48, 170–176. [Google Scholar] [CrossRef]
- Wang, Y.; Kimura, K.; Dubin, P.L.; Jaeger, W. Polyelectrolyte−Micelle Coacervation: Effects of Micelle Surface Charge Density, Polymer Molecular Weight, and Polymer/Surfactant Ratio. Macromolecules 2000, 33, 3324–3331. [Google Scholar] [CrossRef]
- Todica, M.; Stefan, R.; Popa, C.V.; Olar, L. IR and Raman Investigation of Some Poly(acrylic) Acid Gels in Aqueous and Neutralized State. Acta Phys. Pol. 2015, 128, 128–135. [Google Scholar] [CrossRef]
- Alvarez-Gayosso, C.; Canseco, M.; Estrada, R.; Palacios-Alquisira, J.; Hinojosa, J.; Castano, V. Preparation and microstructure of cobalt(III) poly (acrylate) hybrid materials. Int. J. Basic Appl. Sci. 2015, 4, 255–263. [Google Scholar] [CrossRef] [Green Version]
- Cukrowicz, S.; Sitarz, M.; Kornaus, K.; Kaczmarska, K.; Bobrowski, A.; Gubernat, A.; Grabowska, B. Organobentonites modified with poly (acrylic acid) and its sodium salt for foundry applications. Materials 2021, 14, 1947. [Google Scholar] [CrossRef]
- Hoerter, M.; Oprea, A.; Bârsan, N.; Weimar, U. Chemical interaction of gaseous ammonia and water vapour with polyacrylic acid layers. Sens. Actuators B Chem. 2008, 134, 743–749. [Google Scholar] [CrossRef]
- Chen, H.; Li, J.; Shao, D.; Ren, X.; Wang, X. Poly(acrylic acid) grafted multiwall carbon nanotubes by plasma techniques for Co(II) removal from aqueous solution. Chem. Eng. J. 2012, 210, 475–481. [Google Scholar] [CrossRef]
- Itoh, K.; Yaita, M.; Hasegawa, T.; Fujii, S.; Misono, Y. Temperature-induced structural changes of 1,3-butadiene and acrylic acid on coldly evaporated silver films: Surface-enhanced Raman scattering study. J. Electron. Spectrosc. Relat. Phenom. 1990, 923, 54–55. [Google Scholar] [CrossRef]
- Davidovich-Pinhas, M.; Danin-Poleg, Y.; Kashi, Y.; Bianco-Peled, H. Modified chitosan: A step toward improving the properties antibacterial food packages. Food Packag. Shelf Life 2014, 1, 160–169. [Google Scholar] [CrossRef]
- Espinosa-Andrews, H.; Sandoval-Castilla, O.; Vázquez-Torres, H.; Vernon-Carter, E.J.; Lobato-Calleros, C. Determination of the gum Arabic–chitosan interactions by Fourier Transform Infrared Spectroscopy and characterization of the microstructure and rheological features of their coacervates. Carbohydr. Polym. 2010, 79, 541–546. [Google Scholar] [CrossRef]
- Tang, J.; Huang, J.; Man, S.Q. Preparation of gold nanoparticles by surfactant-promoted reductive reaction without extra reducing agent. Spectrochim. Acta Part A Mol. Biomol. 2013, 103, 349–355. [Google Scholar] [CrossRef]
- Anastassopoulou, J.D. Mass and FT-IR Spectra of Quaternary Ammonium Surfactants. In Chemistry and Properties of Biomolecular Systems; Springer: Dordrecht, The Netherlands, 1991; pp. 1–9. [Google Scholar] [CrossRef]
- De Barros, H.R.; Piovan, L.; Sassaki, G.L.; de Araujo Sabry, D.; Mattoso, N.; Nunes, Á.M.; Meneghetti, M.R.; Riegel-Vidotti, I.C. Surface interactions of gold nanorods and polysaccharides: From clusters to individual nanoparticles. Carbohydr. Polym. 2016, 152, 479–486. [Google Scholar] [CrossRef] [PubMed]
- Kozak, M.; Domka, L. Adsorption of the quaternary ammonium salts on montmorillonite. J. Phys. Chem. Solids 2004, 65, 441–445. [Google Scholar] [CrossRef]
- Zhou, C.; Tong, D.; Yu, W. Smectite Nanomaterials: Preparation, Properties, and Functional Applications. In Nanomaterials from Clay Minerals; Wang, A., Wang, W., Eds.; Elsevier: Amsterdam, The Netherlands, 2019; pp. 335–364. [Google Scholar] [CrossRef]
- Alexandre, M.; Dubois, P. Polymer-layered silicate nanocomposites: Preparation, properties and uses of a new class of materials. Mater. Sci. Eng. 2000, 28, 1–63. [Google Scholar] [CrossRef]
- LeBaron, P.C.; Wang, Z.; Pinnavaia, T.J. Polymer—layered silicate nanocomposites: An overview. Appl. Clay Sci. 1999, 15, 11–29. [Google Scholar] [CrossRef]
- Pavlidou, S.; Papaspyrides, C.D. A review on polymer—layered silicate nanocomposites. Prog. Polym. Sci. 2008, 33, 1119–1198. [Google Scholar] [CrossRef]
- Ltifi, I.; Ayari, F.; Chehimi, D.B.H.; Ayadi, M.T. Physicochemical characteristics of organophilic clays prepared using two organo-modifiers: Alkylammonium cation arrangement models. Appl. Water Sci. 2018, 8, 91. [Google Scholar] [CrossRef]
- Vaia, R.A.; Giannelis, E.P. Polymer melt intercalation in organically modified layered silicates: Model predictions and experiment. Macromolecules 1997, 30, 8000–8009. [Google Scholar] [CrossRef]
- Zhou, Q.; Frost, R.L.; He, H.; Xi, Y.; Zbik, M. TEM, XRD, and thermal stability of adsorbed paranitrophenol on DDOAB organoclay. J. Colloid Interface Sci. 2007, 311, 24–37. [Google Scholar] [CrossRef] [PubMed] [Green Version]
- Varma, R.S. Clay and Clay-Supported Reagents in Organic Synthesis. Tetrahedron 2002, 58, 1235–1255. [Google Scholar] [CrossRef]
- Kumar, B.S.; Dhakshinamoorthy, A.; Pitchumani, K. K10 montmorillonite clays as environmentally benign catalysts for organic reactions. Catal. Sci. Technol. 2014, 4, 2378–2396. [Google Scholar] [CrossRef]
- Suslin, M.; Nedilko, O.; Mishurov, D. The influence of alkylammonium modified clays on the fungal resistance and biodeterioration of epoxy-clay nanocomposites. Int. Biodeterior. Biodegrad. 2016, 110, 136–140. [Google Scholar] [CrossRef]
- Zhivkov, A.M.; Hristov, R.P. Stability of aqueous suspensions of alumina particles with adsorbed (carboxymethyl)cellulose. Colloids Surf. A Physicochem. Eng. Asp. 2017, 529, 523–530. [Google Scholar] [CrossRef]
- Zawrah, M.F.; Kattab, R.M.; Saad, E.M.; Gado, R.A. Effect of surfactant types and their concentration on thr structural characteristics of nanoclay. Spectrochim. Acta Part A 2014, 122, 616–623. [Google Scholar] [CrossRef]
- Shirzad-Siboni, A.; Khataee, A.; Hassani, A.; Karaca, S. Preparation, characterization and application of a CTAB-modified nanoclay for the adsorption of an herbicide from aqueous solutions: Kinetic and qquilibrium studies. Comptes Rendus Chim. 2015, 18, 204–214. [Google Scholar] [CrossRef]
- García, Á.G.; Nagelkerke, N.M.B.; Tuinier, R.; Vis, M. Polymer-mediated colloidal stability: On the transition between adsorption and depletion. Adv. Colloid Interface Sci. 2020, 275, 102077. [Google Scholar] [CrossRef]
- Kowalczuk-Bleja, A.; Sierocka, B.; Muszyński, J.; Trzebicka, B.; Dworak, A. Core-shell polyacrylate and polystyrene-block-polyacrylate stars. Polymers 2005, 46, 8555–8564. [Google Scholar] [CrossRef]
- Kowalczuk, A.; Stoyanova, E.; Mitova, V.; Shestakova, P.; Momekov, G.; Momekova, D.; Koseva, N. Star-shaped nano-conjugates of cisplatin with high drug payload. Int. J. Pharm. 2011, 404, 220–230. [Google Scholar] [CrossRef]
- Crummett, W.B.; Hummel, R.A. The determination of traces of polyacrylamides in water. J. Am. Water Work. Assoc. 1963, 55, 209–220. [Google Scholar] [CrossRef]


| Assignment a | Wavenumber [cm−1] |
|---|---|
| Symmetric stretching of C–H of N+(CH3)3 moiety | 3018 |
| Symmetric and asymmetric stretching of –CH3 and –CH2– in the chain | 2944, 2918, 2871, 2849 |
| Symmetric and asymmetric C–H scissoring of N+(CH3)3 moiety | 1487,1473,1463 |
| Symmetric and asymmetric C–H scissoring of –CH2– and –CH3 | 1431, 1408,1396, 1383 |
| C–N+ stretching | 982, 960, 937, 912 |
| Rocking mode of the –CH2– in the chains for n > 4 | 730, 719 |
Publisher’s Note: MDPI stays neutral with regard to jurisdictional claims in published maps and institutional affiliations. |
© 2022 by the authors. Licensee MDPI, Basel, Switzerland. This article is an open access article distributed under the terms and conditions of the Creative Commons Attribution (CC BY) license (https://creativecommons.org/licenses/by/4.0/).
Share and Cite
Grządka, E.; Godek, E.; Słowik, G.; Kowalczuk, A.; Matusiak, J.; Maciołek, U. Interactions between Nanoclay, CTAB and Linear/Star Shaped Polymers. Int. J. Mol. Sci. 2022, 23, 3051. https://doi.org/10.3390/ijms23063051
Grządka E, Godek E, Słowik G, Kowalczuk A, Matusiak J, Maciołek U. Interactions between Nanoclay, CTAB and Linear/Star Shaped Polymers. International Journal of Molecular Sciences. 2022; 23(6):3051. https://doi.org/10.3390/ijms23063051
Chicago/Turabian StyleGrządka, Elżbieta, Ewelina Godek, Grzegorz Słowik, Agnieszka Kowalczuk, Jakub Matusiak, and Urszula Maciołek. 2022. "Interactions between Nanoclay, CTAB and Linear/Star Shaped Polymers" International Journal of Molecular Sciences 23, no. 6: 3051. https://doi.org/10.3390/ijms23063051