Article

Genome-Wide Identification of the CER Gene Family and Significant Features in Climate Adaptation of Castanea mollissima

College of Plant Science and Technology, Beijing Key Laboratory for Agricultural Application and New Technique, Beijing University of Agriculture, Beijing 102206, China
*
Authors to whom correspondence should be addressed.
Int. J. Mol. Sci. 2022, 23(24), 16202; https://doi.org/10.3390/ijms232416202
Submission received: 31 October 2022 / Revised: 24 November 2022 / Accepted: 13 December 2022 / Published: 19 December 2022

Abstract

:
The plant cuticle is the outermost layer of the aerial organs and an important barrier against biotic and abiotic stresses. The climate varies greatly between the north and south of China, with large differences in temperature and humidity, but Chinese chestnut is found in both regions. This study investigated the relationship between the wax layer of chestnut leaves and environmental adaptation. Firstly, semi-thin sections were used to verify that there is a significant difference in the thickness of the epicuticular wax layer between wild chestnut leaves in northwest and southeast China. Secondly, a whole-genome selective sweep was used to resequence wild chestnut samples from two typical regional populations, and significant genetic divergence was identified between the two populations in the CmCER1-1, CmCER1-5 and CmCER3 genes. Thirty-four CER genes were identified in the whole chestnut genome, and a series of predictive analyses were performed on the identified CmCER genes. The expression patterns of CmCER genes were classified into three trends—upregulation, upregulation followed by downregulation and continuous downregulation—when chestnut seedlings were treated with drought stress. Analysis of cultivars from two resource beds in Beijing and Liyang showed that the wax layer of the northern variety was thicker than that of the southern variety. For the Y-2 (Castanea mollissima genome sequencing material) cultivar, there were significant differences in the expression of CmCER1-1, CmCER1-5 and CmCER3 between the southern variety and the northern one-year-grafted variety. Therefore, this study suggests that the CER family genes play a role in environmental adaptations in chestnut, laying the foundation for further exploration of CmCER genes. It also demonstrates the importance of studying the adaptation of Chinese chestnut wax biosynthesis to the southern and northern environments.

1. Introduction

Drought has become a global problem, with models predicting that drought conditions will increase over the next 90 years due to decreasing precipitation and evaporation of water [1,2]. China’s complex topography, diverse climate types and large zonal differences also make drought disasters more severe. It is generally believed that the Qinling–Huaihe line is the dividing line between the subtropical monsoon climate/region (south) and the warm temperate monsoon climate/region (north). The average annual precipitation is 400–800 mm in the north, and the annual average precipitation in the south is above 800 mm, with a drier and colder climate in the northern area than in the southern area [3]. The Chinese chestnut (Castanea mollissima Bl.) is widely distributed in China and exists in various ecological types [4] from Jilin province in the north to Hainan province in the south. Compared with Castanea seguinii and Castanea henryi, the Chinese chestnut is cultivated in the north of the Qinling mountains in China for its excellent fruit quality, adaptability and comprehensive edible value.
The plant cuticle is a composite structure consisting of a keratinous macromolecular scaffold and a variety of organic solvent soluble lipids, collectively known as waxes [5]. The biosynthesis of waxes consists of three stages: the first stage is the ab initio synthesis of C16 and C18 fatty acids from plastids, which act as central intermediates for all lipids. The second stage is the extension of C16 and C18 fatty acids into very-long-chain fatty acids (VLCFAs) with C20–C34 in the endoplasmic reticulum (ER). Following extension, the VLCFAs are modified to create major waxy components, including esters, aldehydes, alkanes, ketones and alcohols, via the decarbonylation pathway and the acyl reduction pathway [6]. It has been demonstrated in previous studies that wax synthesis in plants is controlled by the CER (eceriferum) family of genes.
Members of the CER family genes have been extensively studied. There are 17 known CER family genes in the Arabidopsis thaliana Information Resource (TAIR) database. CER family genes have been identified in the genomes of sunflower (Helianthus annuus) [7], Ziziphus jujube [8], apple (Malus domestica) [9] and passion fruit (Passiflora edulis) [10]. The CER1 gene encodes decarbonylase, an enzyme that converts long-chain aldehydes into alkanes, a key step in wax biosynthesis [11]. The complex of CER3 and CER1 together catalyze the formation of alkanes from VLCFA-CoA [12]. CER3 expression is associated with CER16, and inactivation of CER16 inhibits CER3 expression [13]. The CER2 protein is a regulatory protein of the fatty acid elongase complex. CER2 accumulates in a variety of organs and cell types. CER2 expression is epidermis-specific and CER2 acts on C28 elongation [14,15,16]. CER2 and CER6 act together on C30 synthesis [17]. Both CER26 and CER2 are involved in the formation of extra-long-chain fatty acids and act as mechanisms of fatty acid elongation in wax synthesis [18]. CER4 encodes the alcohol-forming fatty acyl coenzyme A reductase (FAR) and is expressed in leaves, stems, flowers and roots [19]. CER4 and CER17 share a role in the synthesis of ultra-long chain monounsaturated alcohols [20]. CER5 plays a role in surface wax secretion by working with WBC11 [21]. CER6 is a key enzyme in the biosynthesis of straight lipids in the pollen shell and in the stem cuticle [22]. CER60 is highly similar to CER6 nucleotides and amino acids and is involved in saturated ultra-long-chain fatty acid biosynthesis [22,23]. Cuticular wax loading is regulated by enzymes encoded by CER7 and CER9, with CER7 regulating the exosomal core subunit of wax production during inflorescence development and the CER9 gene encoding an E3 ubiquitin ligase that is a negative regulator of wax and keratin monomers [24,25]. CER8 encodes acyl coenzyme A synthase, an enzyme that preferentially modifies the VLCFA of wax synthesis and keratin synthesis of long-chain (C(16)) fatty acids [26]. CER10 plays an important role in the biosynthesis of C26–C30 fatty acids, primary alcohols and aldehydes [27]. CER11 encodes a protein that catalyzes the dephosphorylation step in the secretion of extracellular matrix components in epidermal cells [28]. CER13 is involved in the enzyme-specific message of wax ester formation [29].
When plants changed from an aquatic to terrestrial environment 450 million years ago, terrestrial plants were exposed to a variety of new environmental challenges, including desiccation, temperature changes, UV radiation exposure and mechanical damage [30,31]. To adapt to terrestrial life, terrestrial plants form cuticles on the surface of their aerial organs, unique structures that are the result of the ability of plants to evolve morphological and physiological traits to maintain water [5,30]. Drought is a major abiotic stress that affects plant growth and productivity and causes yield losses [32,33]. Studies have shown that epidermal waxes act as a protective barrier against environmental stresses and that various environmental factors also influence the biosynthesis, composition and morphology of waxes [34]. The accumulation of waxes is associated with the prevention of water loss and contributes to the drought tolerance of plants [35,36]. Under drought conditions, the wax content of A. thaliana leaves and stems increases [37]. Additionally, biochemically, changes in the ultra-long-chain fatty acid derivatives of A. thaliana have also been observed [38]. Drought significantly increases the alkane content in wheat lines [39]. Expression of SlCER1 and SlCER3 was significantly upregulated in one-month-old tomato plants under drought stress, and overexpression of SlCER1-1 significantly increased very-long-chain (VLC) alkane biosynthesis and wax accumulation [40]. Total wax esters were significantly elevated in grapes under water deficit conditions and CER1, CER3, CER2, CER4, CER10 and WSD1 were upregulated in the grape wax biosynthesis pathway [41]. MYB96 induced the transcription of genes involved in VLCFA biosynthesis such as KCS1, KCS2 and KCS6, and was also secondary to CER1 and WBC11 transcription [36]. In a study on dinoflagellates, it was shown that alkanes are more sensitive to drought stress than other waxes and that the BdCER1 gene plays different roles in different emergency pathways [42]. In transgenic cucumber, CsCER1 influences the biosynthesis and drought resistance of VLC alkanes [42]. In apple, MdCER1, MdCER2, MdCER3, MdCER4 and MdCER8 are able to respond to drought in response to PEG induction [9].
A significant relationship between drought and CER genes has been confirmed in species such as tomato and grape, where CER genes influence wax biosynthesis, and in species such as apple, passion fruit and sunflower, for which the CER family was analyzed; however, the relationship between chestnut CER genes and drought stress has been less studied, and there is no systematic analysis of CER genes in Chinese chestnut. In the investigation of wild chestnut samples, we found that the thicknesses of the cuticles of the leaves in the north and south were different. At the same time, genes related to cuticle synthesis were found through genome-wide selective sweep analysis between the northern and southern populations of wild chestnut. Therefore, in this study, 34 CER genes from the C. mollissima genome were systematically characterized and analyzed through comparative bioinformatics. It was found that CER gene expression was induced by drought stress. This study provides a basis for further research on wax biosynthesis in chestnut leaves. We explored the importance of the C. mollissima CER gene family in adaptation to northern and southern climates.

2. Results

2.1. Analysis of the Thickness of the Cuticle in Wild Chinese Chestnut Samples Collected from Northern and Southern China

A total of 146 wild Chinese chestnut samples collected in Gansu, Shaanxi, Sichuan, Hubei, Anhui, Zhejiang, Jiangxi and Hunan were used to produce semi-thin sections, which were stained using oil red and then examined under a microscope. The staining results of all samples were measured using ImageJ and Graphpad Prism software. The wild samples were divided into two categories—northern and southern—according to the eight provinces where they were collected, to obtain box line plots of the epicuticular wax layer thickness of the wild species. For the wild Chinese chestnut samples, the epicuticular wax layer thickness of the northern samples was significantly (p < 0.0001) thicker than that of the southern samples (Figure 1a). The epicuticular wax layer thickness of the sample collected from Gansu was 2.56 times that of the sample collected from the Tianmu Mountains, Zhejiang (Figure 1b,c).

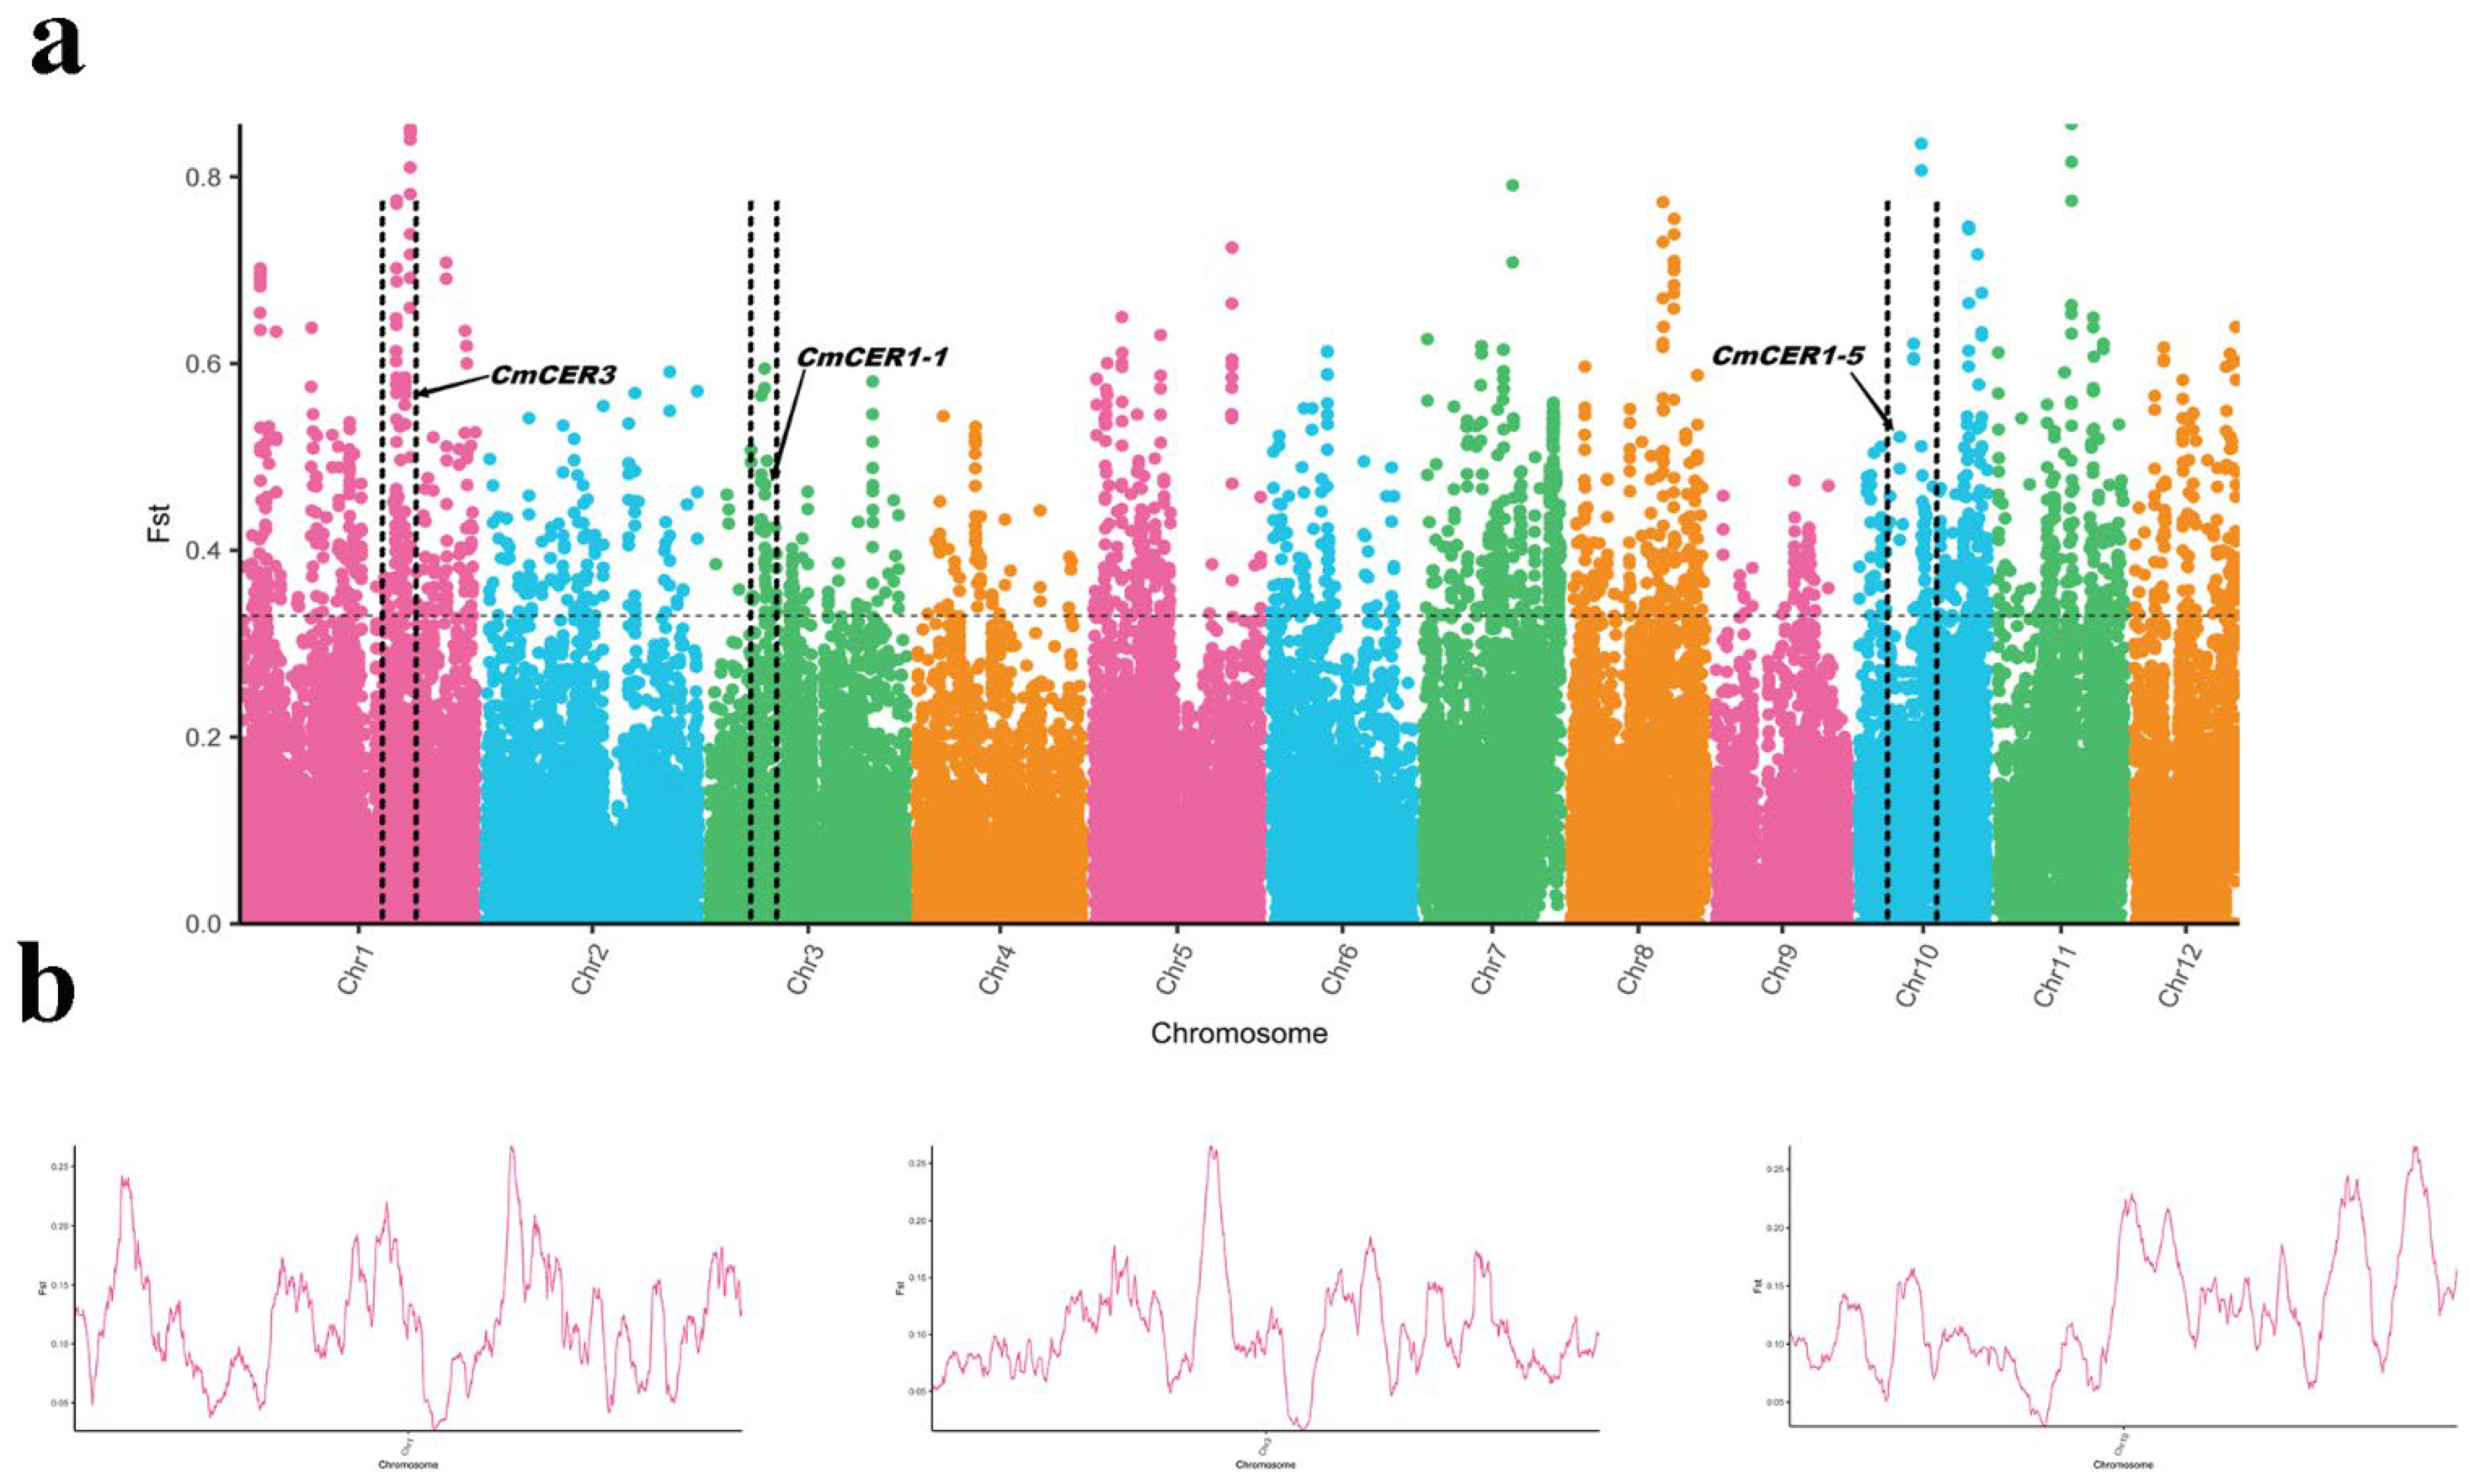
2.2. Genome-Wide Selective Sweep Analysis between the Populations of Wild Chinese Chestnut Collected from Northern and Southern China

To further explore the difference between the two populations, samples of wild Chinese chestnut from two typical regions (10 from Gansu and 10 from Tianmu Mountains) were collected and scanned by genome-wide selection sweeps (Figure 2). We identified three CER genes (CmCER1-1, CmCER1-5 and CmCER3) with significant genetic differentiation between the two populations, suggesting their potential contribution to the adaptation of Chinese chestnut to different climates. Therefore, we speculate that the CmCER gene family plays an important role in adaptation to northern and southern climates.

2.3. Identification of CmCER Family Genes in Chinese Chestnut

We searched for 17 AtCER genes in A. thaliana and identified 34 CmCER gene family members in the Chinese chestnut genome. Furthermore, the physicochemical properties of 34 CmCER gene proteins were analyzed.
According to the analysis, the number of amino acids in CmCER genes ranged from 142 (CmCER1-9) to 1853 (CmCER13-1). The predicted molecular weights ranged from 16.50 (CmCER1-9) to 206.05 (CmCER13) kD, and the isoelectric points ranged from 5.28 (CmCER2-1) to 9.71 (CmCER60-5) (Table 1).
Subcellular localization showed that CmCER1-1, CmCER1-2, CmCER1-3, CmCER1-4, CmCER1-6, CmCER1-7, CmCER1-8 and CmCER1-9 were localized in vacuoles. CmCER1-5 was localized to cell membranes and vacuoles. CmCER2, CmCER6-1, CmCER6-2, CmCER60-2, CmCER60-3, CmCER60-4, CmCER60-5, CmCER60-7 and CmCER60-8 were localized to the cytoplasm. CmCER60-1 and CmCER60-6 were localized to chloroplasts and cytoplasm. CmCER4 was localized to the Golgi apparatus, and CmCER5-1, CmCER5-2 and CmCER9-2 were localized to the cell membrane. CmCER7 was localized in chloroplasts and mitochondria. CmCER8 was localized to peroxisomes. CmCER9-1 was localized to cell membranes and nuclei. CmCER10-1, CmCER11-1 and CmCER13 were localized to cell nuclei. CmCER17 was localized to mitochondria and the endoplasmic reticulum. CmCER9-1 was localized to cell membranes and nuclei. CmCER10-2 was localized to cell membranes and the Golgi apparatus. CmCER11-2 was localized to mitochondria and cell nuclei (Table 1).

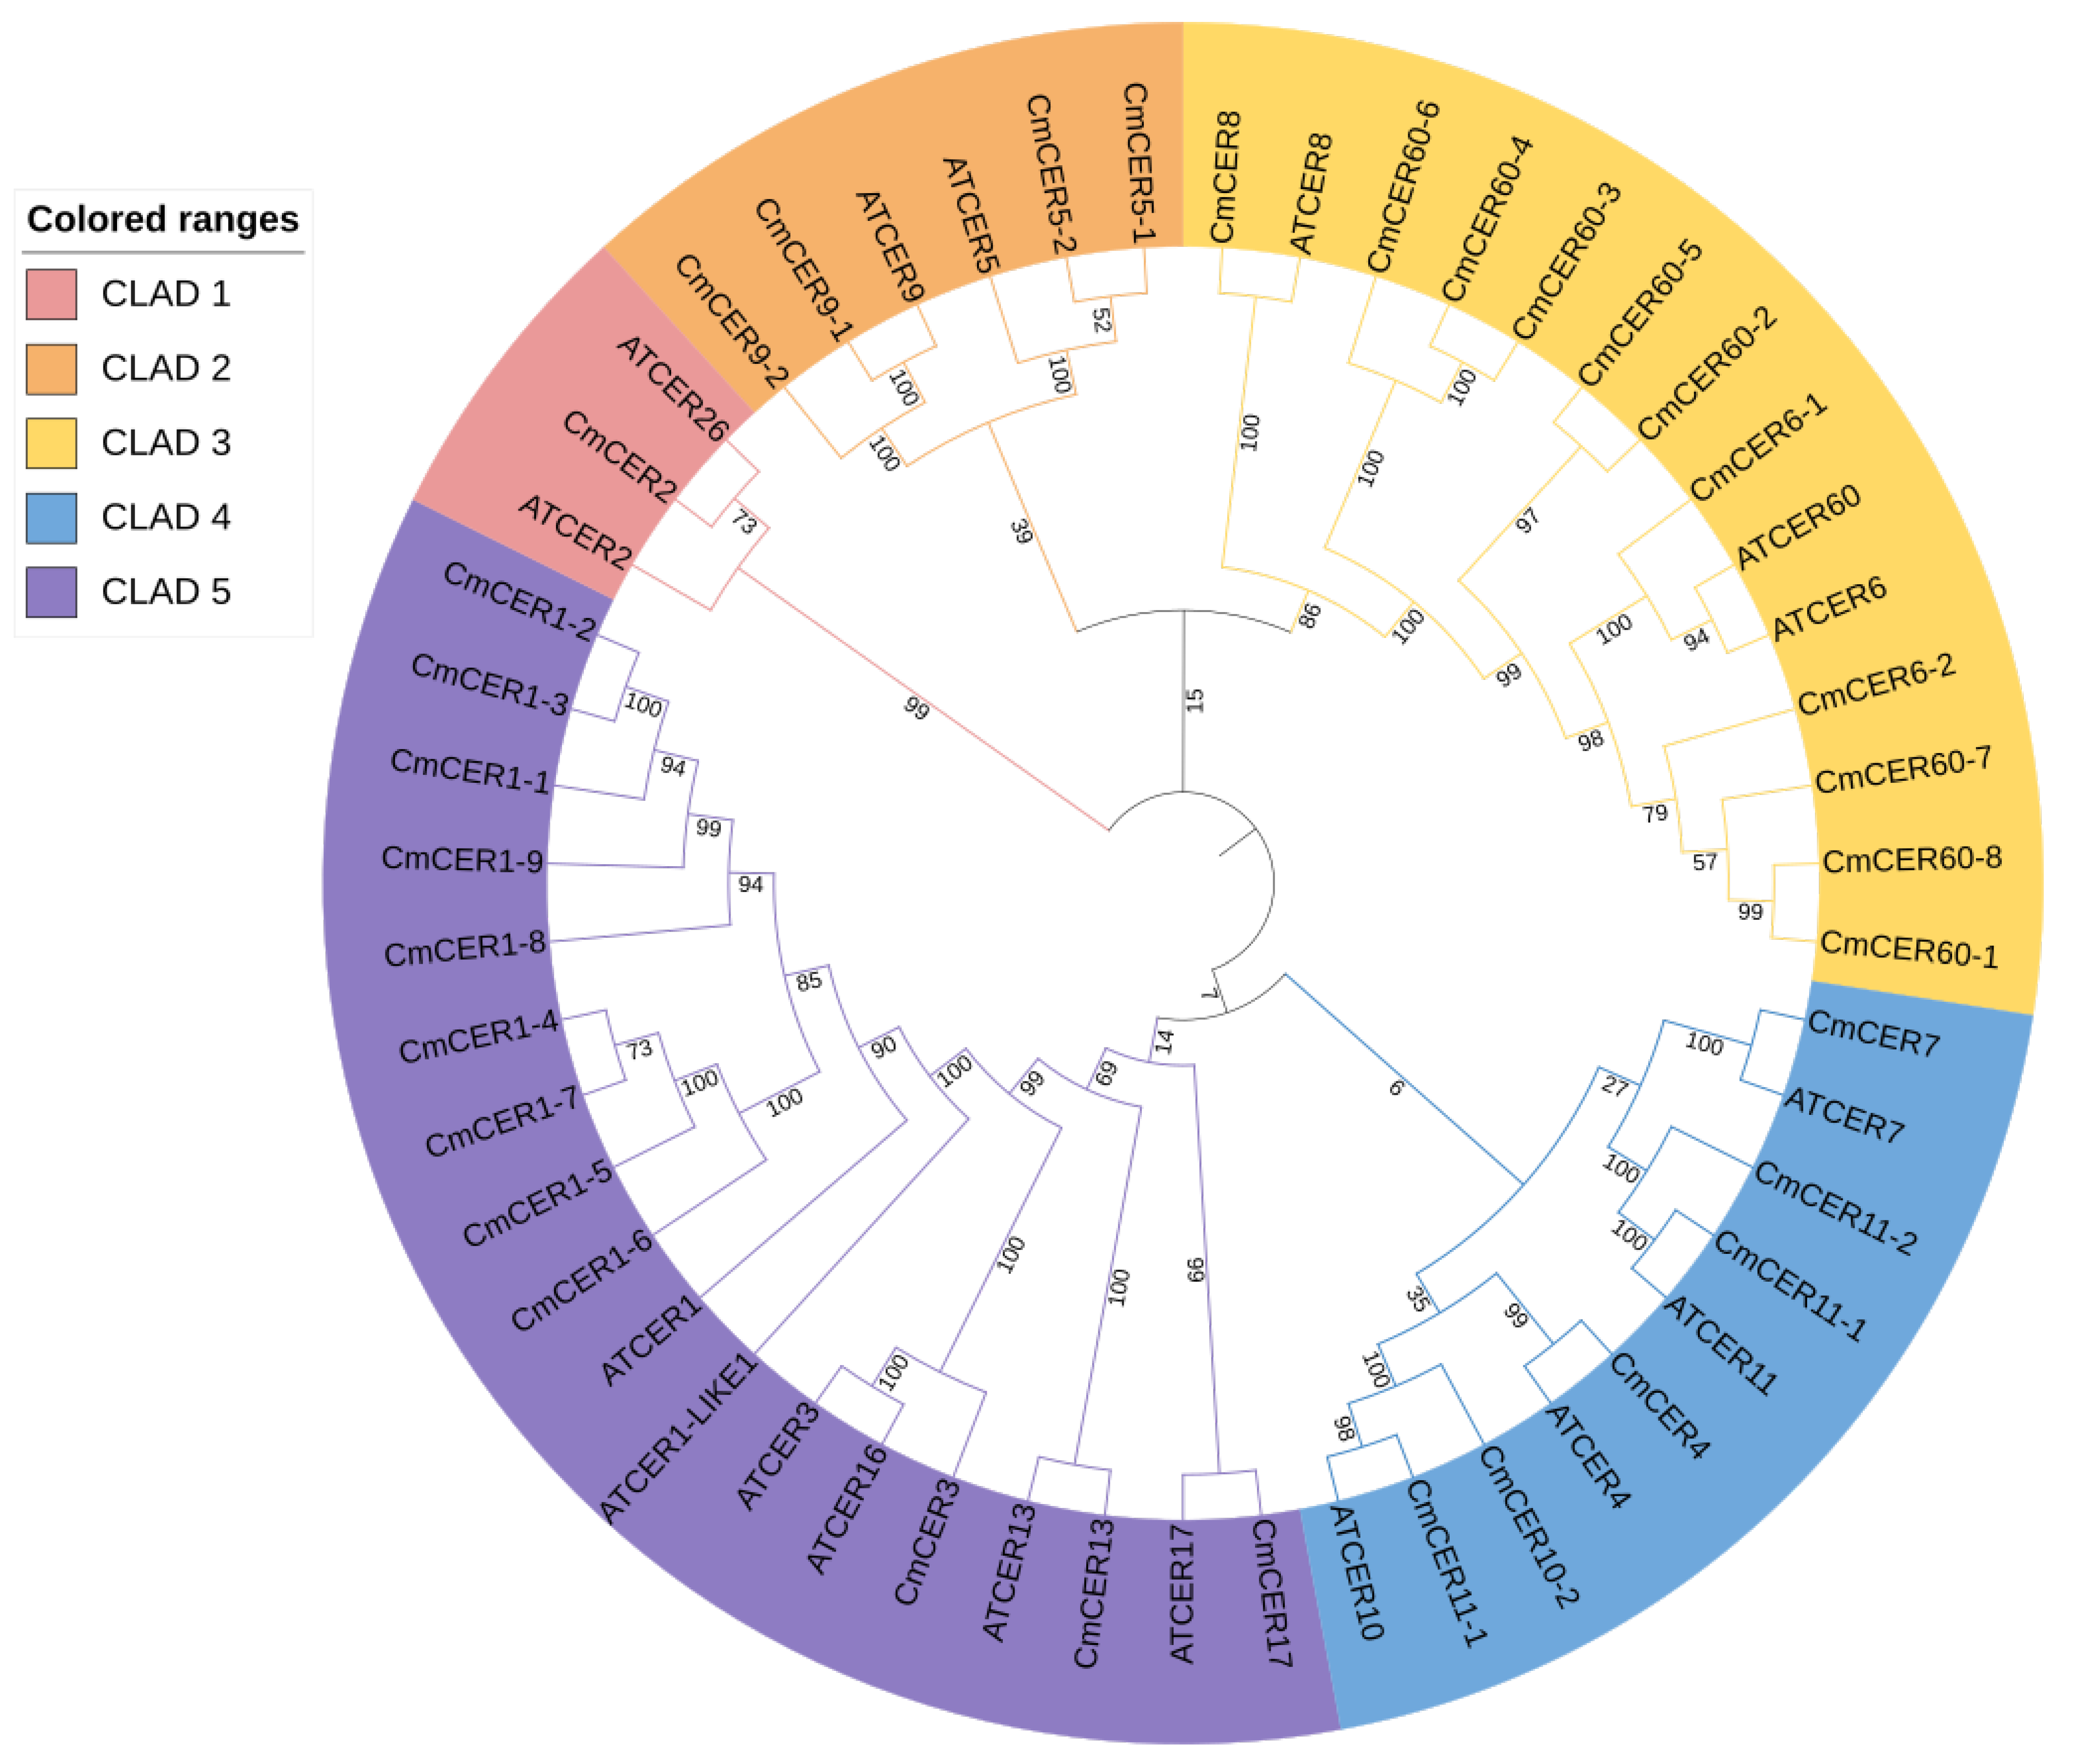
2.4. Phylogenetic Analysis of CmCER Proteins in Chinese Chestnut

In order to evaluate the functional characteristics and evolutionary relationships of the CmCER gene family, this study used 17 A. thaliana and 34 C. mollissima CmCER genes encoding protein sequences for multiple comparisons, and constructed a phylogenetic tree using the MEGA11 software. Five genetically related groups were identified and the CmCER genes were named. The relationships between genes in the same cluster showing homologous CER protein sequences are shown. There is one CmCER gene (CmCER2) in CLAD1. There are six genes in CLAD2, including four CmCER genes, namely, CmCER5-1, CmCER5-2, CmCER9-1 and CmCER9-2. There are 14 genes in CLAD3, including 11 CmCER genes, namely, CmCER6-1, CmCER6-2, CmCER8, CmCER60-1, CmCER60-2, CmCER60-3, CmCER60-4, CmCER60-5, CmCER60-6, CmCER60-7 and CmCER60-8. There are 10 genes in CLAD4, including six CmCER genes: CmCER4, CmCER7, CmCER10-1, CmCER10-2, CmCER11-1 and CmCER11-2. There are 18 genes in CLAD5, including 12 CmCER genes: CmCER1-1, CmCER1-2, CmCER1-3, CmCER1-4, CmCER1-5, CmCER1-6, CmCER1-7, CmCER1-8, CmCER1-9, CmCER3, CmCER13 and CmCER17 (Figure 3). CmCER1 and CmCER60 showed more gene expansion (Figure 3).

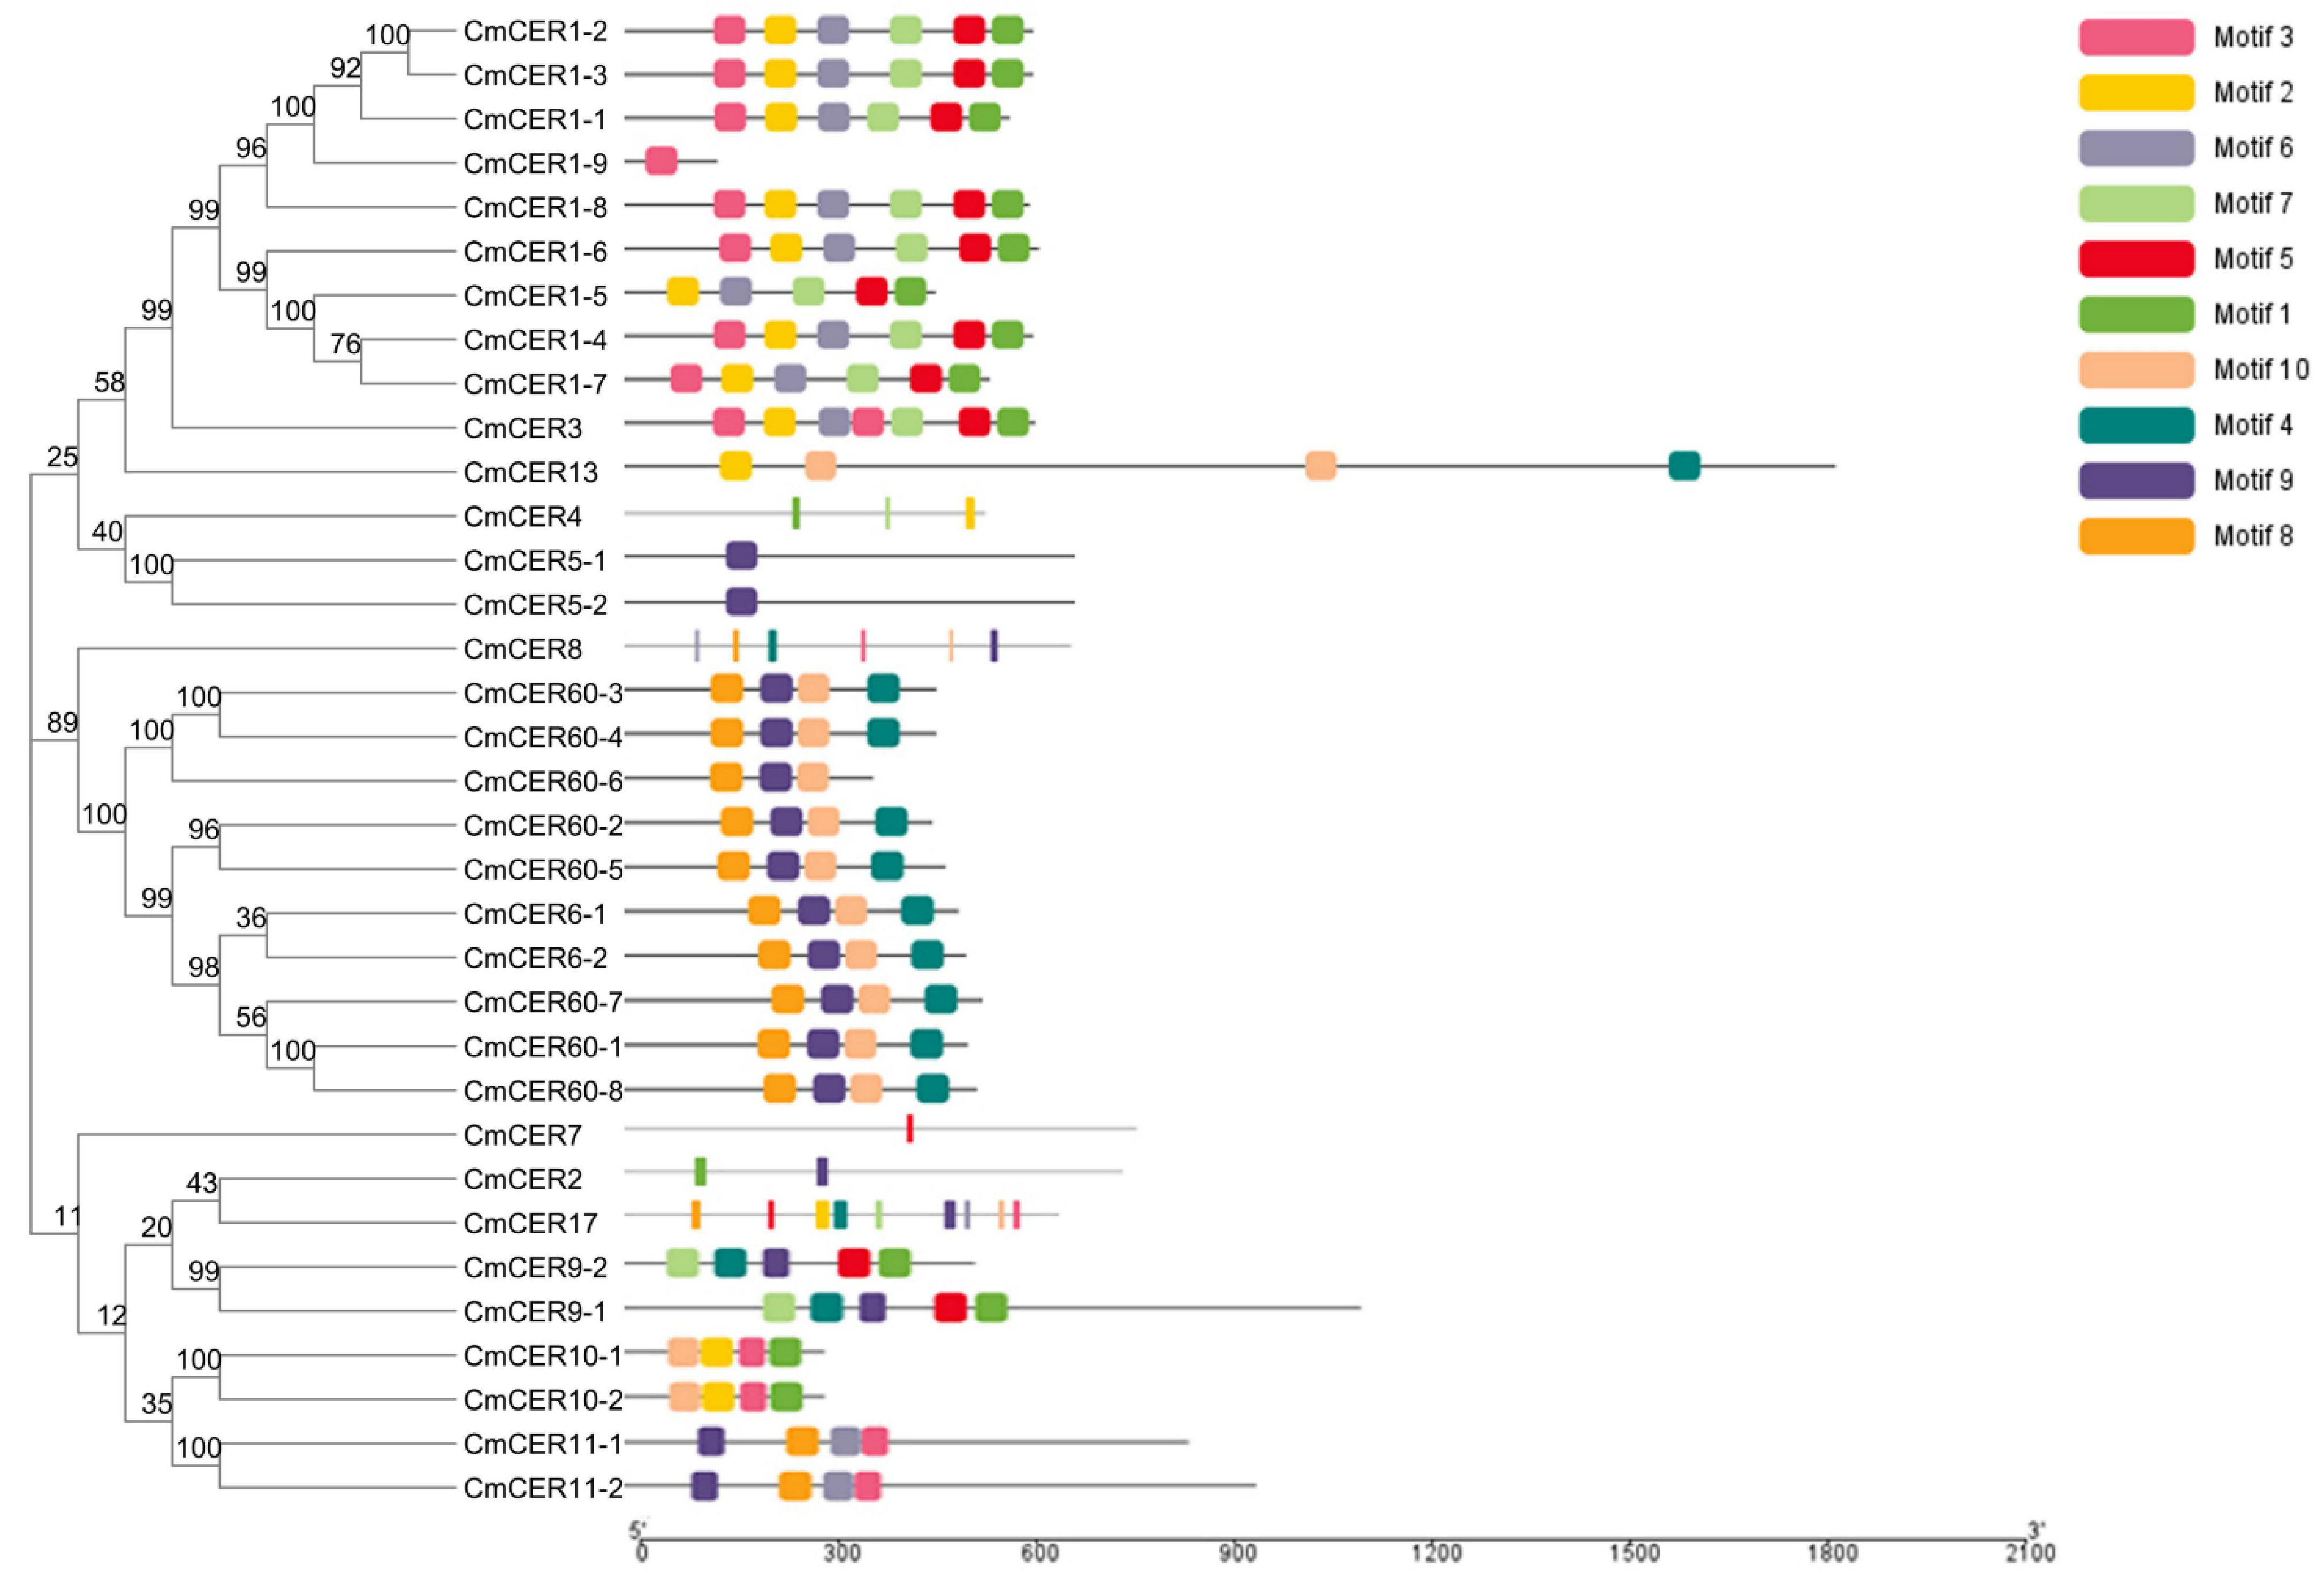
2.5. Analysis of Gene Motifs of CmCER Gene Family in Chinese Chestnut

Ten protein motifs were predicted in the CmCER genome based on CmCER gene phylogenetic relationships. CmCER1-1, CmCER1-2, CmCER1-3, CmCER1-4, CmCER1-5, CmCER1-6, CmCER1-7, CmCER1-8, CmCER1-9 and CmCER3 share six motifs. CmCER6-1, CmCER6-2, CmCER60-1, CmCER60-2, CmCER60-3, CmCER60-4, CmCER60-5, CmCER60-6, CmCER60-7 and CmCER60-8 share four motifs (Figure 4). The results indicate that there is a conserved motif similarity between each group, and that these specific conserved motifs are associated with the CERs’ functions.

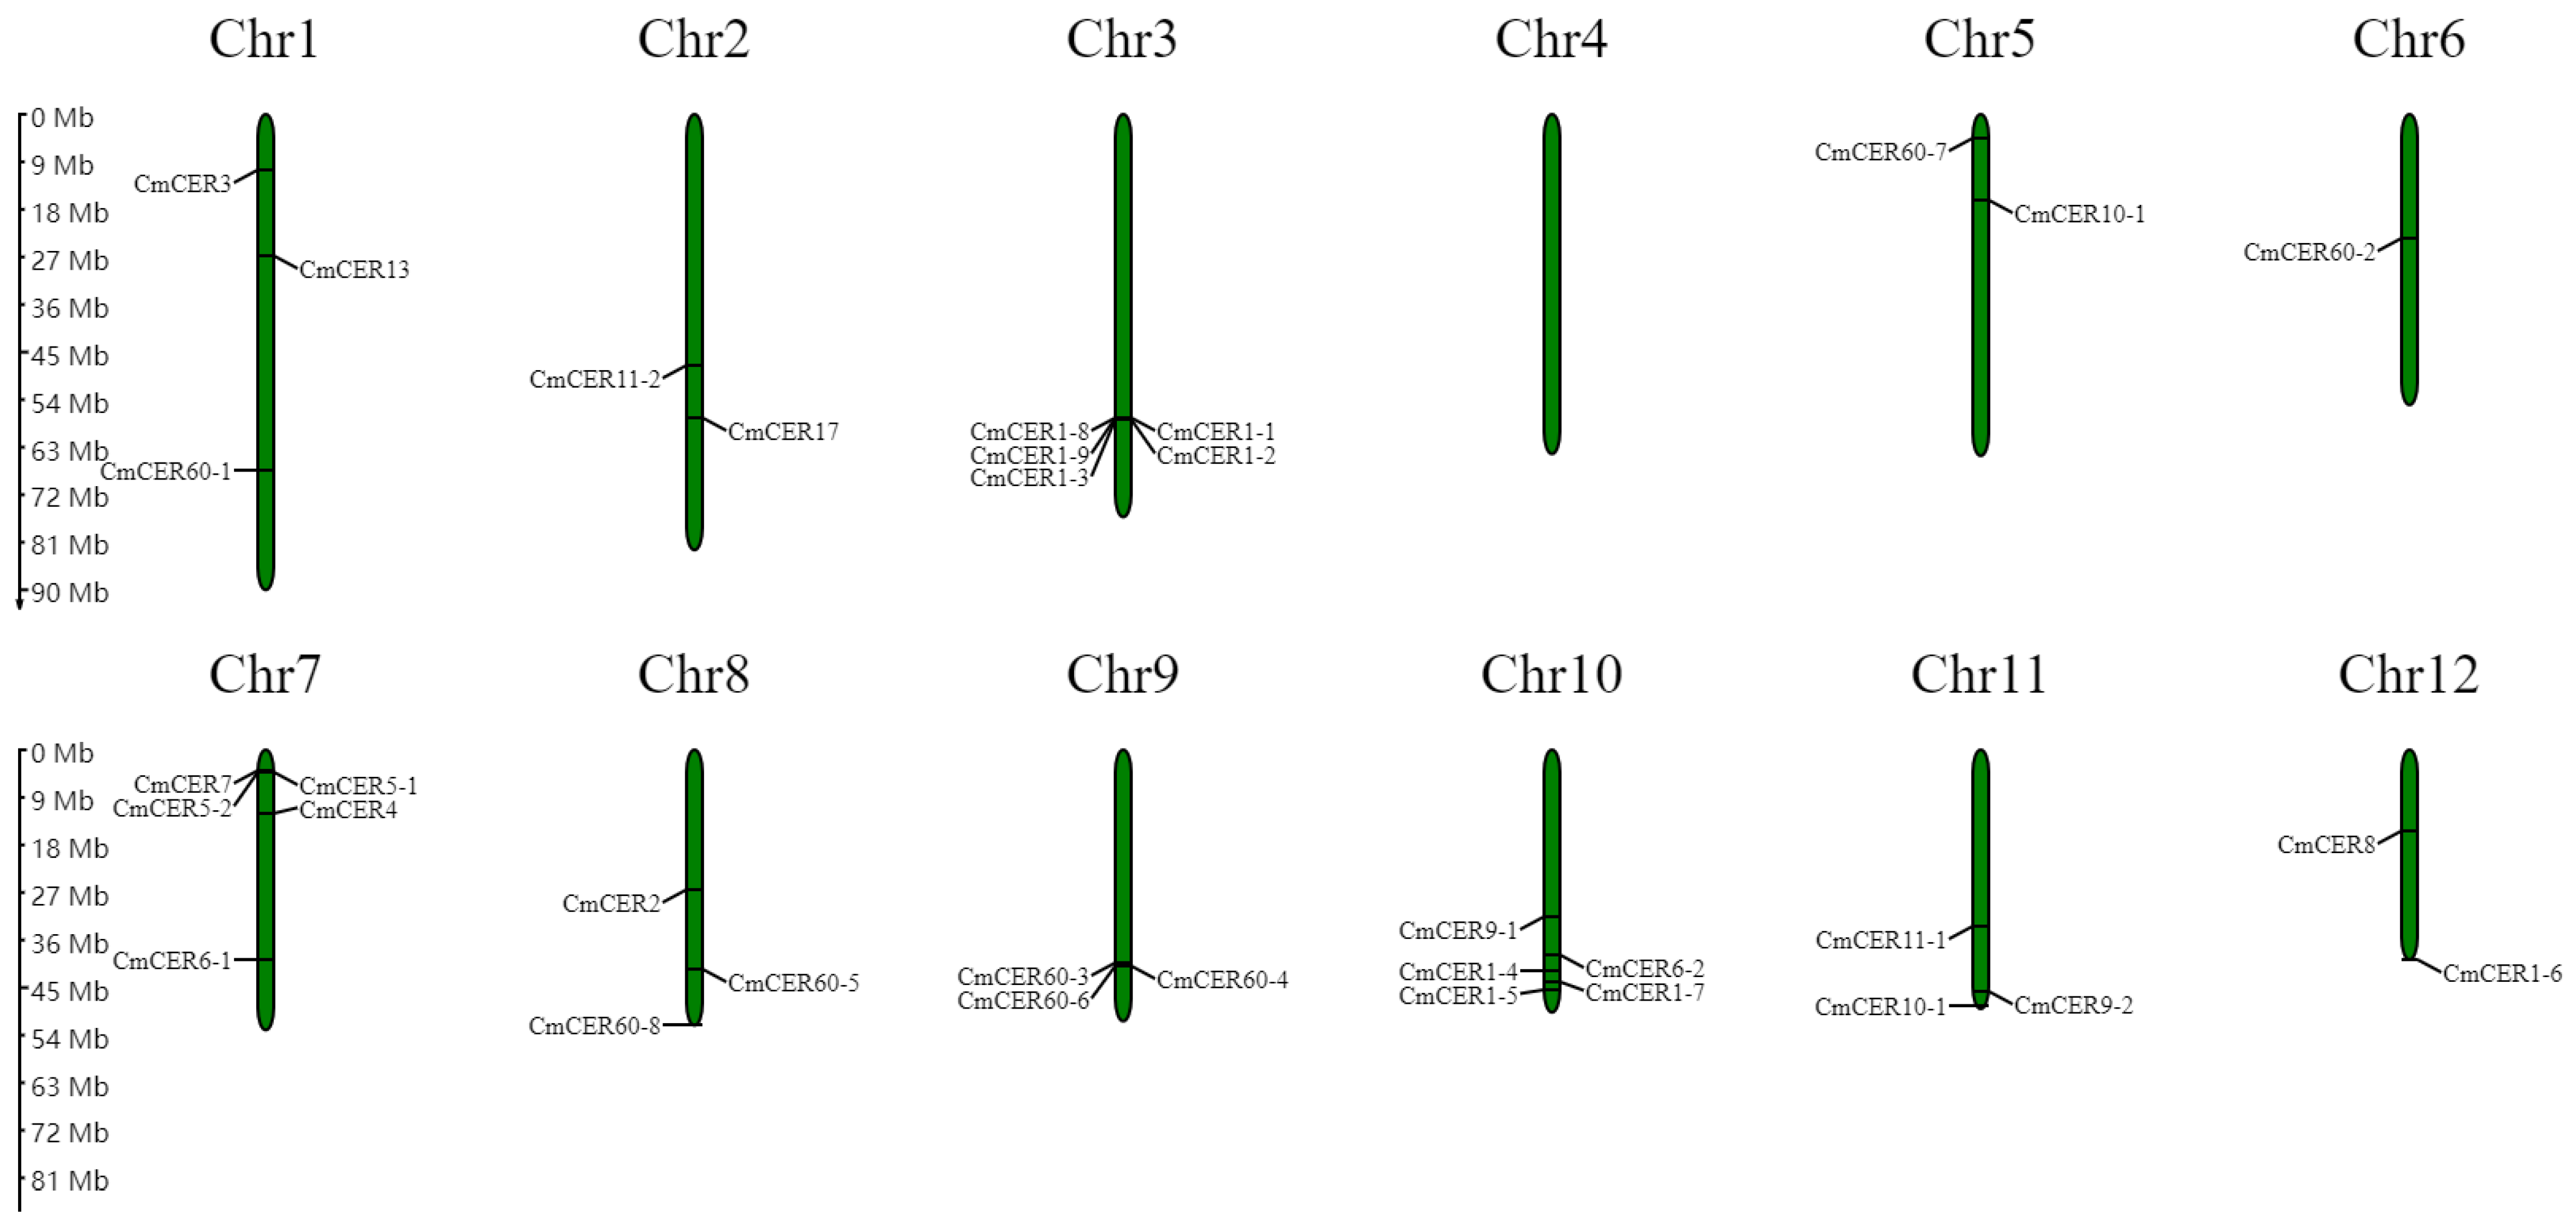
2.6. Chromosomal Localization of CmCER Gene in Chinese Chestnut

Analysis of the location of CmCER genes on Chinese Chestnut chromosomes showed that the 34 CmCER genes were unevenly distributed among the 12 chromosomes of Chinese Chestnut. Specifically, chromosomes 3, 7 and 10 contained five CmCER genes, chromosomes 1, 8, 9 and 11 contained three CmCER genes, chromosomes 2, 5 and 12 contained two CmCER genes, chromosome 6 contained only one CmCER gene and chromosome 4 contained no CmCER genes (Figure 5).

2.7. Chromosomal Localization of CmCER Gene in Chinese Chestnut

The base sequence of the first 2000 bp of the Chinese Chestnut start codon was selected to predict cis-acting elements. The results showed that 34 CmCER genes contained multiple cis-acting elements. Three cis-elements were analyzed. The first was hormone-response elements, including abscisic acid response, auxin response, gibberellin response, MeJA response and salicylic acid response. Among the 34 members, 7 were induced by one hormone and 7 by four hormones, 8 were induced by two hormones and 12 were induced by three hormones. Secondly, stress-response elements, including light induction, low-temperature induction and stress defense mechanism were analyzed. Thirty-four CmCER genes contain light-response elements, 12 CmCER genes respond to the stress defense mechanism, and 12 CmCER genes respond to low temperature. Finally, MYB binding was analyzed, including the flavonoid biosynthesis binding site, drought inducibility and the MYBHv1 binding site. Only 22 genes have MYB binding sites (Figure 6 and Table S1). These cis-acting elements may directly determine the ability of CmCER gene family members to respond to stress conditions.

2.8. Changes of CmCER Gene Expression Level in Chinese Chestnut Seedlings under Drought Treatment

To investigate how the CmCER family genes respond to drought changes, Chinese chestnut seedlings were treated under drought conditions for different lengths of time. Expression levels of the CmCER family genes were determined by qPT-PCR. Thirty-two genes were activated under drought treatment. The expression levels of most CmCER genes increased with increasing drought treatment time. The expression level of three CmCER genes showed a trend of rising first and then decreasing. Eight CmCER genes showed a continuous downward trend in their expression levels (Figure 7a). The results showed that the expression levels of most CER genes were upregulated in response to drought stress.
In relation to evolutionary kinship analysis, five genes in the three expression patterns showing a rising and falling trend are in CLAD 2 and CLAD 5 of the evolutionary tree. The seven genes in the continuously decreasing expression pattern are in CLAD 1, CLAD 3, CLAD 4 and CLAD 5. The other genes are in CLAD 2, CLAD 3, CLAD 4 and CLAD 5 of the evolutionary tree.
In order to test whether the climate in the south and north has an impact on the epicuticular wax layer thickness, we selected varieties to compare the cuticle thickness from two germplasm repositories in the south (Longtan forestry nursery, Liyang, Jiangsu 119°27′10.106″ E 31°19′55.320″ N) and north (Chestnut Experiment Station, Huairou, Beijing 116°28′26.821″ E 40°25′14.614″ N). The varieties from the two germplasm repositories in Beijing and Liyang were divided into two major categories according to their places of origin, and box line diagrams of cuticle thicknesses of the northern and southern varieties were obtained. The samples from both the Beijing and Liyang germplasm repositories showed that the epicuticular wax layer thickness of the northern varieties was significantly (p < 0.01) thicker than that of the southern types (Figure 7b). Climatic differences between the north and the south result in different degrees of drought faced by Chinese chestnut. To compare the phenotypes of epicuticular wax layer thickness of the same variety under different climates (north and south), we used the same rootstock selected from wild Chinese chestnut Y-2 (Castanea mollissima genome sequencing material) for simultaneous grafting in both Hubei (where the variety originated) and Beijing, and took annual grafting material from both locations. The results showed that the thickness of the epicuticular wax layer of the grafted Y-2 leaves in Beijing (north) was significantly (p < 0.05) thicker than that of the Y-2 leaves in Hubei (south) (Figure 7c). The expression of CmCER1-1, CmCER1-5 and CmCER3 was significantly different, and the expression of the grafted Y-2 in the north was significantly higher than that in the south (Figure 7d).

3. Discussion

The cuticle is an important barrier that covers the aerial epidermis of terrestrial plants and protects them from external environmental stresses [5]. In addition to enabling plants to survive in a dry environment, the cuticle also resists other biotic and abiotic stresses [43]. In a study of yellowhorn (Xanthoceras sorbifolium Bunge), a comprehensive analysis of leaf anatomy and cuticle properties was conducted on germplasm samples, revealing marked differences in leaf wax content and indicating that epidermal wax content is related to drought resistance. Thus, wax content is used as an important indicator for the screening of drought-resistant germplasm [44]. The differences in temperature and humidity between the south and north of China and the wide distribution of chestnut in China are also related to the drought tolerance of chestnut. By post-staining analysis of sections of Chinese chestnut samples from the north and south, it was determined that there were differences in cuticle thickness between the two regions due to their differing degrees of drought. A genome-wide selective sweep of wild Chinese chestnut samples from two population classes—NW and SE—led to the hypothesis that the CmCERs family of genes plays an important role in adaptation to northern and southern climates.
Drought tolerance is the ability of a plant to tolerate low water potential and maintain a certain level of physiological activity, growth and development. It is a complex quantitative trait in which the plant interacts with the drought environment. Drought tolerance in plants is influenced by several gene families; the ERECTA proteins belong to the protein kinase superfamily and the serine/threonine protein kinase family, which influence plant drought tolerance by affecting stomatal development, pathogen defense and phytohormone perception [45]. The DREB genes, which belong to the AP2/EREBP family, are involved in the control of non-ABA-dependent drought stress responses in combination with plant-specific, stress-regulated transcription factors [46]. The Asr gene family plays an important role in plant adaptation to drought, especially the Asr1 gene, which is expressed in a housekeeping manner, and small changes in the protein can have a serious impact on plant adaptation [47]. Although other gene families have also been associated with drought tolerance, in this study the focus on the CER gene family was due to the significant divergence of CERs genes between the NW and SE populations identified in the whole-genome resequencing sweep analysis.
Genome-wide identification of CER family genes has been reported in different plants, including the identification of 37 CER genes and their homologs in the sunflower genome [7], 29 ZjCER genes in the date palm genome [8], 10 AtCER genes in the apple MdCER family analysis [9], and 10 MdCER genes in the passion fruit; in the PeCER gene family, 34 PeCER genes have been identified [10]. In this study, 34 CmCER genes were identified in the Chinese chestnut genome. CER family genes have shown varying degrees of gene expansion in sunflower, sour date, passion fruit and chestnut (the species of this study), influenced by different genetic replication events to evolve in a species-specific manner. We constructed a phylogenetic tree of the AtCER gene family and the CmCER gene family and identified five genetically related groups, with CmCER1 showing more gene expansions. This may be due to tandem and dispersed duplication, with segmentation and tandem duplication playing an important role in the generation and maintenance of gene families. Gene duplication underlies the functional divergence that occurs in homologous genes and is influenced by different genetic duplication events to evolve in a species-specific manner, with CER homologs in different species receiving strong purifying selection and being functionally conserved. For example, in the crustacean Mongolian oak (Quercus mongolica), the evolutionary relationship between the CER1 gene and drought stress response was analyzed. The homologous gene copy numbers of different genes identified in the epidermal wax biosynthetic pathway were species-specific, and it was found that the CER1 homologous gene was significantly amplified in the wax biosynthetic pathway. The Mongolian oak has a wide distribution range and the amplification of the CER1 homologous gene contributes to an improved response to drought stress [48]. The replication pattern of CER genes in Chinese chestnut needs further analysis.
The CER family genes of sunflower, date palm, apple and passion fruit are all located on different chromosomes, which may be due to their involvement in various functions, resulting in genes from the same family being distributed on different chromosomes. Conservative motif analysis of differences in protein function predicted 10 protein motifs. The CmCER gene family is highly conserved throughout evolution and plays an important role in wax biosynthesis. Our results are not consistent with Rizwan et al. Predictions of cis-acting elements of the chestnut CmCER gene family were made, mainly predicting hormone-response elements, stress-response elements and MYB-binding progenitors. The results of the prediction analysis showed an abundance of cis-acting elements in the chestnut CmCER gene family, which may determine the ability of CmCER genes to respond under stress conditions.
Chinese chestnut seedlings of different lengths treated under drought conditions were tested by qRT-PCR; 32 genes were activated, with the expression pattern of CmCER genes divided into three trends: upregulation, upregulation followed by downregulation, and then continuous downregulation. However, Qi et al. found that the expression of MdCER3, MdCER5, MdCER6 and MdCER9 showed downregulation followed by upregulation trends at 0 H, 3 H and 12 H in apple tissue culture seedlings treated with PEG. Drought treatment of three sunflower genotypes to study the expression pattern of HanCER10 and HanCER60 showed that plants with different genotypes have different drought tolerance. In passion fruit, the expression profiles of PeCERs were explored mainly in terms of different fruit developmental stages and different genes in the tissues. Similarly, Rizwan et al. found that the expression of PeCERs in the two passion fruit varieties was upregulated in the roots, stocks and leaves under drought stress. For the semi-thin section analysis of varieties in both the Beijing and Jiangsu germplasm repositories, results from the wild samples showed that the cuticle thickness of the northern samples was thicker than that of the southern samples, which may be due to long-term environmental selection resulting in different genotypes in the southern and northern samples. The expression results of wild Y-2 varieties in the south and Y-2 material grafted for one year in the north showed significant differences, with the more arid northern environment causing environmental induction of CER gene expression and promotion of wax biosynthesis, resulting in thicker cuticle thickness.
Developments in plant genomics have revealed the genetic basis of traits, combining genome-wide association studies (GWAS), genome–environment associations (GEA), genome-wide selection scans (GWSS) and other modern analytical approaches to infer the genetic basis of adaptation to abiotic stresses using environmental variables. Genome–environmental association analyses can use gradient forest models to detect adaptive signals in species. Genome-wide association studies use phenotypic and genomic data to identify the genetic causes of variation in phenotypes. The combination of histology and a variety of modern analytical methods allows for the prediction of chestnut adaptation to climate change, and it may even be applied to genetic breeding for chestnut tolerance to abiotic stresses.

4. Materials and Methods

4.1. Plant Materials

This study collected wild Chinese chestnut leaves from Gansu, Shaanxi, Sichuan, Hubei, Anhui, Zhejiang, Jiangxi and Hunan and varieties of Chinese chestnut leaves were collected from Beijing Chestnut Experiment Station and Liyang Longtan forestry nursery. The wild Y-2 variety from Hubei was grafted onto the variety in the Beijing germplasm repository, and the leaves were collected. After the leaves were collected, they were washed before being placed in a fixative solution for making semi-thin sections. All samples were frozen in liquid nitrogen and stored at −80 °C.

4.2. Thickness Statistics of Wax on the Surface of Leaves of Wild and Cultivated Chestnut Species

Preparation of semi-thin sections of Chinese chestnut leaves was as follows: Chinese chestnut leaves were cut to the correct size, placed in fixative and vacuumed for 40 min. They were washed with PBS buffer solution four times and soaked once in deionized water for 30 min each. The leaves were dehydrated with gradients of 10%, 30%, 50%, 70%, 90% and 100% alcohol for 30 min each at room temperature. SolutionA: 100% ethanol was infiltrated at volume ratios of 1:3, 1:1 and 3:1, for 12 h for each step, and then the leaves were placed in pure SolutionA overnight at 4 °C. The samples were then placed in a mold to create a plastic block and glued to the base. The slides were cleaned and put on a film dryer heated to a temperature of 57 °C. Then, 1–2 drops of water were added to the glass slides and they were sliced with a slicer (Reichert-Jung, Leica microsystems, Netherlands) to a thickness of 5 μm. The slices were placed on the slides, unfolded naturally and dried on the dryer. Finally, the sections were stained with Oil Red O dye [43] according to the instructions and photographed under a Leica (LeicaAu5500B) microscope. This was replicated for each variety three times; the epicuticular wax thickness was measured using ImageJ software, and analysis of significant differences was carried out using prism6 software. For quantitative data tests, one-way ANOVA was used, and Bonferroni’s multiple comparisons test was used for multiple comparisons between groups.

4.3. Sample Sequencing

The 22 samples sequenced in this study are listed in Supplementary Table S1. Genomic DNA was extracted from leaf samples using CTAB method. Libraries were constructed using 2.5 ug of high-quality DNA per sample. Sequencing libraries were generated using the Truseq Nano DNA HT Sample Prep Kit (Illumina, San Diego, CA, USA) and genome-wide paired-end reads were generated using the Illumina platform (HiSeq2000, Illumina, San Diego, CA, USA).

4.4. Selective Sweep

First, SNPs with minor allele frequency below 5% were removed from this analysis. To identify potential selective sweeps between northern samples and southern samples, FST was calculated using VCFtools with a 50 kb sliding window and a step size of 10 kb.

4.5. Identification of CER Gene Family Members and Analysis of Physicochemical Properties of Protein Sequences in Chinese Chestnut

The annotated CER sequences of A. thaliana were downloaded from the Arabidopsis genome annotation website (https://www.arabidopsis.org/, accessed on 11 June 2022), and the Chinese chestnut genome data were blasted with BioEdit software, and the E value threshold was 0.001 for candidate gene family. Then, the candidate genes domain sequences were obtained from CER protein sequence alignment analysis using NCBI-CDD database (https://www.ncbi.nlm.nih.gov/Structure/cdd/wrpsb.cgi, accessed on 11 June 2022).
On-line analysis software ExPASy (https://web.expasy.org/protparam/, accessed on 16 June 2022) was used for analysis of CER genes encoding amino acid number, isoelectric point (pI), molecular weight (MW), and other physical and chemical information. Then, the protein subcellular localization prediction software Cell-PLoc2.0 (http://www.csbio.sjtu.edu.cn/bioinf/Cell-PLoc-2/, accessed on 16 June 2022) was used for the CmCER family protein sequence analysis of subcellular localization prediction.

4.6. Phylogenetic Analysis

Multiple sequence alignment of CER amino acid sequences for A. thaliana and C. mollissima was performed using DNAMAN software, and the repeated sequences were removed. Then, MEGA11.0 software was used to determine the optimal conformational tree model of the CER gene family for A. thaliana and C. mollissima. Bootstrap = 1000 to construct the evolutionary tree. The iTOL online website (https://itol.embl.de/itol.cgi, accessed on 16 June 2022) was used to beautify the evolutionary tree.

4.7. Gene Structure and Motif Analysis

The Chinese chestnut CER gene protein sequences into NCBI-CDD database website (https://www.ncbi.nlm.nih.gov/Structure/cdd/wrpsb.cgi, accessed on 16 June 2022) to obtain the results file, and we then used the TBtools software for structure visualization with domain analysis.
The MEME (https://meme-suite.org/meme/tools/meme, accessed on 16 June 2022) website was used for Chinese chestnut CER genes encoding protein sequences with the conservative base sequence analysis. The gene structure and motifs of Chinese chestnut CER genes were visualized using TBtools software.

4.8. Chromosome Localization and Cis-Acting Element Analysis

The location of CER genes on the chromosomes of A. thaliana and C. mollissima was studied using the MapGene2Chromosome V2 website (http://mg2c.iask.in/mg2c_v2.1/, accessed on 22 June 2022)by gene ID, start position, stop position, chromosome length, etc.
To analyze the cis-acting elements contained in the promoter region, the upstream 2000 bp sequences of 34 Chinese chestnut CER genes were extracted using TBtools. The online software PlantCARE (http://bioinformatics.psb.ugent.be/webtools/plantcare/html/, accessed on 27 June 2022)was used to predict the cis function components.

4.9. qRT-PCR Assay

For the drought treatment, Chinese chestnut seedlings were removed from the pot, cleaned and gently wiped with paper towels for moisture, and placed on dry filter paper. Samples were collected at 0, 1, 3, 6, 9 and 12 h of treatment, and then flash-frozen in liquid nitrogen and stored at −80 °C for later use.
RNA was extracted from the samples using the RNA extraction kit Plant RNA Kit (Omega, Norcross, GA, USA). The elimination of genomic DNA was through treatment with RapidOut DNA Removal Kit (Thermo Scientific, Vilnius, Lithuania). The cDNA was synthesized using reverse transcriptase M-MLV (TaKaRa, Dalian, China). Primers were designed using Primer 5 software (Table S2) and analyzed by real-time PCR using Super Real Pre MixPlus Kit (TaKaRa, Dalian, China) with SYBR Green. The reaction system was performed according to the instructions. The reaction instrument was CFX (Bio-Rad, Roche Diagnostics GmbH, Mannheim, Germany). The reaction system was as follows: template 2 μL, 10 μmol/L primer 0.5 μL, SYBR 5 μL, RNase free H2O 2.5 μL. Procedure: pre-denaturation at 95 °C for 2 min; denaturation at 95 °C for 15 s, annealing at 60 °C for 30 s, extension at 72 °C for 30 s, 40 cycles in total. CmActin was used as the reference gene, and for each sample this was performed in triplicate. The relative expression of CmCERs was calculated using the 2−ΔΔCt method.

5. Conclusions

In this study, a significant difference in wax thickness in Chinese chestnut between northern and southern China was identified. Through genome-wide selective sweep analysis of two populations in the northwest and southeast, significant genetic differentiation was identified for CmCER1-1, CmCER1-5 and CmCER3. We then identified 34 CER genes in the Chinese chestnut genome and analyzed their physicochemical properties, evolutionary relationships, gene structure and expression patterns. Drought treatment of Chinese chestnut seedlings affected the expression of CmCER genes. The expression of CmCER1-1, CmCER1-5 and CmCER3 differed significantly in the same Chinese chestnut variety cultivated in different locations. This provides a basis for functional studies on Chinese chestnut wax biosynthesis in relation to environmental adaptation.

Supplementary Materials

The following supporting information can be downloaded at: https://www.mdpi.com/article/10.3390/ijms232416202/s1.

Author Contributions

Conceptualization, S.Z. and Y.X.; methodology, S.Z. and X.N.; software, S.Z. and X.N.; validation, L.Q. and Y.X.; formal analysis, X.L., B.W. and S.L.; investigation, S.Z. and X.N.; resources, L.Q. and Y.X.; data curation, S.Z.; writing—original draft preparation, S.Z., X.N. and Y.X.; writing—review and editing, S.Z., X.N. and Y.X.; visualization, S.Z., X.N. and B.W.; supervision, Y.X.; project administration, Y.X.; funding acquisition, L.Q. and Y.X. All authors have read and agreed to the published version of the manuscript.

Funding

This work was supported by the National Key Research & Development Program of China (2018YFD1000605).

Acknowledgments

The authors thank Runlin Li for helping with the collection of materials used in this experiment, and Xuefeng Wang (Longtan forestry nursery, Liyang, Jiangsu) and Jianling Liu (Chestnut Experiment Station, Huairou, Beijing) for managing and providing the materials. The authors also thank Kefeng Fang for helping with the semi-thin slices.

Conflicts of Interest

The authors declare no conflict of interest.

References

  1. Dai, A. Increasing Drought under Global Warming in Observations and Models. Nat. Clim. Chang. 2013, 3, 52–58. [Google Scholar] [CrossRef]
  2. Zhang, Q.; Han, L.; Jia, J.; Song, L.; Wang, J. Management of Drought Risk under Global Warming. Appl. Clim. 2016, 125, 187–196. [Google Scholar] [CrossRef]
  3. Tsuwamoto, R.; Yokoi, S.; Takahata, Y. Arabidopsis EMBRYOMAKER Encoding an AP2 Domain Transcription Factor Plays a Key Role in Developmental Change from Vegetative to Embryonic Phase. Plant Mol. Biol. 2010, 73, 481–492. [Google Scholar] [CrossRef] [PubMed]
  4. Pfister, B.; Zeeman, S.C. Formation of Starch in Plant Cells. Cell. Mol. Life Sci. 2016, 73, 2781–2807. [Google Scholar] [CrossRef] [Green Version]
  5. Yeats, T.H.; Rose, J.K.C. The Formation and Function of Plant Cuticles. Plant Physiol. 2013, 163, 5–20. [Google Scholar] [CrossRef] [PubMed] [Green Version]
  6. Samuels, L.; Kunst, L.; Jetter, R. Sealing Plant Surfaces: Cuticular Wax Formation by Epidermal Cells. Annu. Rev. Plant Biol. 2008, 59, 683–707. [Google Scholar] [CrossRef] [PubMed] [Green Version]
  7. Muhammad Ahmad, H.; Wang, X.; Fiaz, S.; Mahmood-Ur-Rahman; Azhar Nadeem, M.; Aslam Khan, S.; Ahmar, S.; Azeem, F.; Shaheen, T.; Mora-Poblete, F. Comprehensive Genomics and Expression Analysis of Eceriferum (CER) Genes in Sunflower (Helianthus Annuus). Saudi J. Biol. Sci. 2021, 28, 6884–6896. [Google Scholar] [CrossRef]
  8. Li, N.; Li, X.Z.; Song, Y.Q.; Yang, S.T.; Li, L.L. Genome-Wide Identification, Characterization, and Expression Profiling of the ECERIFERUM (CER) Gene Family in Ziziphus Jujube. Russ. J. Plant Physiol. 2021, 68, 828–837. [Google Scholar] [CrossRef]
  9. Qi, C.; Jiang, H.; Zhao, X.; Mao, K.; Liu, H.; Li, Y.; Hao, Y. The Characterization, Authentication, and Gene Expression Pattern of the MdCER Family in Malus Domestica. Hortic. Plant J. 2019, 5, 1–9. [Google Scholar] [CrossRef]
  10. Rizwan, H.M.; Waheed, A.; Ma, S.; Li, J.; Arshad, M.B.; Irshad, M.; Li, B.; Yang, X.; Ali, A.; Ahmed, M.A.A.; et al. Comprehensive Genome-Wide Identification and Expression Profiling of Eceriferum (CER) Gene Family in Passion Fruit (Passiflora Edulis) Under Fusarium Kyushuense and Drought Stress Conditions. Front. Plant Sci. 2022, 13, 898307. [Google Scholar] [CrossRef]
  11. Aarts, M.G.M. Molecular Characterization of the CER1 Gene of Arabidopsis Lnvolved in Epicuticular Wax Biosynthesis and Pollen Fertility. Plant Cell 1995, 7, 2115–2127. [Google Scholar] [CrossRef] [PubMed] [Green Version]
  12. Bernard, A.; Joubès, J. Arabidopsis Cuticular Waxes: Advances in Synthesis, Export and Regulation. Prog. Lipid Res. 2013, 52, 110–129. [Google Scholar] [CrossRef] [PubMed]
  13. Yang, X.; Feng, T.; Li, S.; Zhao, H.; Zhao, S.; Ma, C.; Jenks, M.A.; Lü, S. CER16 Inhibits Post-Transcriptional Gene Silencing of CER3 to Regulate Alkane Biosynthesis. Plant Physiol. 2020, 182, 1211–1221. [Google Scholar] [CrossRef] [PubMed] [Green Version]
  14. Xia, Y.; Nikolau, B.J. Cloning and Characterization of CER2, an Arabidopsis Gene That Affects Cuticular Wax Accumulation. Plant Cell 1996, 8, 1291–1304. [Google Scholar] [CrossRef]
  15. Xia, Y.; Nikolau, B.J.; Schnable, P.S. Developmental and Hormonal Regulation of the Arabidopsis CER2 Gene That Codes for a Nuclear-Localized Protein Required for the Normal Accumulation of Cuticular Waxes. Plant Physiol. 1997, 115, 925–937. [Google Scholar] [CrossRef] [Green Version]
  16. Haslam, T.M.; Mañas-Fernández, A.; Zhao, L.; Kunst, L. Arabidopsis ECERIFERUM2 Is a Component of the Fatty Acid Elongation Machinery Required for Fatty Acid Extension to Exceptional Lengths. Plant Physiol. 2012, 160, 1164–1174. [Google Scholar] [CrossRef] [Green Version]
  17. Haslam, T.M.; Haslam, R.; Thoraval, D.; Pascal, S.; Delude, C.; Domergue, F.; Fernández, A.M.; Beaudoin, F.; Napier, J.A.; Kunst, L.; et al. ECERIFERUM2-LIKE Proteins Have Unique Biochemical and Physiological Functions in Very-Long-Chain Fatty Acid Elongation. Plant Physiol. 2015, 167, 682–692. [Google Scholar] [CrossRef] [Green Version]
  18. Pascal, S.; Bernard, A.; Sorel, M.; Pervent, M.; Vile, D.; Haslam, R.P.; Napier, J.A.; Lessire, R.; Domergue, F.; Joubès, J. The Arabidopsis Cer26 Mutant, like the Cer2 Mutant, Is Specifically Affected in the Very Long Chain Fatty Acid Elongation Process. Plant J. 2013, 73, 733–746. [Google Scholar] [CrossRef] [Green Version]
  19. Rowland, O.; Zheng, H.; Hepworth, S.R.; Lam, P.; Jetter, R.; Kunst, L. CER4 Encodes an Alcohol-Forming Fatty Acyl-Coenzyme A Reductase Involved in Cuticular Wax Production in Arabidopsis. Plant Physiol. 2006, 142, 866–877. [Google Scholar] [CrossRef] [Green Version]
  20. Yang, X.; Zhao, H.; Kosma, D.K.; Tomasi, P.; Dyer, J.M.; Li, R.; Liu, X.; Wang, Z.; Parsons, E.P.; Jenks, M.A.; et al. The Acyl Desaturase CER17 Is Involved in Producing Wax Unsaturated Primary Alcohols and Cutin Monomers. Plant Physiol. 2017, 173, 1109–1124. [Google Scholar] [CrossRef]
  21. Bird, D.; Beisson, F.; Brigham, A.; Shin, J.; Greer, S.; Jetter, R.; Kunst, L.; Wu, X.; Yephremov, A.; Samuels, L. Characterization of Arabidopsis ABCG11/WBC11, an ATP Binding Cassette (ABC) Transporter That Is Required for Cuticular Lipid Secretion†: WBC11 Is Required for Cuticular Lipid Transport. Plant J. 2007, 52, 485–498. [Google Scholar] [CrossRef] [PubMed]
  22. Fiebig, A.; Mayfield, J.A.; Miley, N.L.; Chau, S.; Fischer, R.L.; Preuss, D. Alterations in CER6, a Gene Identical to CUT1, Differentially Affect Long-Chain Lipid Content on the Surface of Pollen and Stems. Plant Cell 2000, 12, 2001–2008. [Google Scholar] [CrossRef] [PubMed] [Green Version]
  23. Tresch, T.; Heilmann, M.; Christiansen, N.; Looser, R.; Grossmann, K. Inhibition of Saturated Very-Long-Chain Fatty Acid Biosynthesis by Mefluidide and Perfluidone, Selective Inhibitors of 3-Ketoacyl-CoA Synthases. Phytochemistry 2012, 76, 162–1771. [Google Scholar] [CrossRef] [PubMed]
  24. Zhao, L.; Kunst, L. SUPERKILLER Complex Components Are Required for the RNA Exosome-Mediated Control of Cuticular Wax Biosynthesis in Arabidopsis Inflorescence Stems. Plant Physiol. 2016, 121, 960–973. [Google Scholar] [CrossRef] [Green Version]
  25. Lü, S.; Zhao, H.; Des Marais, D.L.; Parsons, E.P.; Wen, X.; Xu, X.; Bangarusamy, D.K.; Wang, G.; Rowland, O.; Juenger, T.; et al. Arabidopsis ECERIFERUM9 Involvement in Cuticle Formation and Maintenance of Plant Water Status. Plant Physiol. 2012, 159, 930–944. [Google Scholar] [CrossRef] [Green Version]
  26. Lu, S.Y.; Song, t.; Kosma, D.K.; Parsons, E.P.; Rowland, O.; Jenks, M.A. Arabidopsis CER8 Encodes LONG-CHAIN ACYL-COA SYNTHETASE 1 (LACS1) That Has Overlapping Functions with LACS2 in Plant Wax and Cutin Synthesis. Plant Cell 2009, 59, 553–564. [Google Scholar] [CrossRef]
  27. Sandalio, L.M.; Yu, L.; Taji, T. ECERIFERUM 10 Encoding an Enoyl-CoA Reductase Plays a Crucial Role in Osmotolerance and Cuticular Wax Loading in Arabidopsis. Front. Plant Sci. 2022, 13, 12. [Google Scholar] [CrossRef]
  28. Shi, L.; Dean, G.H.; Zheng, H.; Meents, M.J.; Haslam, T.M.; Haughn, G.W.; Kunst, L. ECERIFERUM11/C-TERMINAL DOMAIN PHOSPHATASE-LIKE2 Affects Secretory Trafficking. Plant Physiol. 2019, 181, 901–915. [Google Scholar] [CrossRef] [Green Version]
  29. Lai, C.; Kunst, L.; Jetter, R. Composition of Alkyl Esters in the Cuticular Wax on Inflorescence Stems of Arabidopsis Thaliana Cer Mutants: Esters in Stem Waxes of Arabidopsis Cer Mutants. Plant J. 2007, 50, 189–196. [Google Scholar] [CrossRef]
  30. Kenrick, P.; Crane, P.R. The Origin and Early Evolution of Plants on Land. Nature 1997, 389, 33–39. [Google Scholar] [CrossRef]
  31. Waters, E.R. Molecular Adaptation and the Origin of Land Plants. Mol. Phylogenetics Evol. 2003, 29, 456–463. [Google Scholar] [CrossRef]
  32. Pennisi, E. The Blue Revolution, Drop by Drop, Gene by Gene. Science 2008, 320, 5873. [Google Scholar] [CrossRef] [PubMed]
  33. Zhang, J. China’s Success in Increasing per Capita Food Production. J. Exp. Bot. 2011, 62, 3707–3711. [Google Scholar] [CrossRef] [PubMed]
  34. Shepherd, T.; Wynne Griffiths, D. The Effects of Stress on Plant Cuticular Waxes. New Phytol. 2006, 171, 469–499. [Google Scholar] [CrossRef] [PubMed]
  35. Lee, S.B.; Kim, H.U.; Suh, M.C. MYB94 and MYB96 Additively Activate Cuticular Wax Biosynthesis in Arabidopsis. Plant Cell Physiol. 2016, 57, 2300–2311. [Google Scholar] [CrossRef] [PubMed] [Green Version]
  36. Seo, P.J.; Lee, S.B.; Suh, M.C.; Park, M.-J.; Go, Y.S.; Park, C.-M. The MYB96 Transcription Factor Regulates Cuticular Wax Biosynthesis under Drought Conditions in Arabidopsis. Plant Cell 2011, 23, 1138–1152. [Google Scholar] [CrossRef] [Green Version]
  37. Patwari, P.; Salewski, V.; Gutbrod, K.; Kreszies, T.; Dresen-Scholz, B.; Peisker, H.; Steiner, U.; Meyer, A.J.; Schreiber, L.; Dörmann, P. Surface Wax Esters Contribute to Drought Tolerance in Arabidopsis. Plant J. 2019, 98, 727–744. [Google Scholar] [CrossRef]
  38. Aharoni, A.; Dixit, S.; Jetter, R.; Thoenes, E.; van Arkel, G.; Pereira, A. The SHINE Clade of AP2 Domain Transcription Factors Activates Wax Biosynthesis, Alters Cuticle Properties, and Confers Drought Tolerance When Overexpressed in Arabidopsis[W]. Plant Cell 2004, 16, 2463–2480. [Google Scholar] [CrossRef] [Green Version]
  39. Bi, H.; Kovalchuk, N.; Langridge, P.; Tricker, P.J.; Lopato, S.; Borisjuk, N. The Impact of Drought on Wheat Leaf Cuticle Properties. BMC Plant Biol. 2017, 17, 85. [Google Scholar] [CrossRef] [Green Version]
  40. Wu, H.; Liu, L.; Chen, Y.; Liu, T.; Jiang, Q.; Wei, Z.; Li, C.; Wang, Z. Tomato SlCER1–1 Catalyzes the Synthesis of Wax Alkanes, Increasing Drought Tolerance and Fruit Storability. Hortic. Res. 2022, 9, uhac004. [Google Scholar] [CrossRef]
  41. Dimopoulos, N.; Tindjau, R.; Wong, D.C.J.; Matzat, T.; Haslam, T.; Song, C.; Gambetta, G.A.; Kunst, L.; Castellarin, S.D. Drought Stress Modulates Cuticular Wax Composition of the Grape Berry. J. Exp. Bot. 2020, 71, 3126–3141. [Google Scholar] [CrossRef] [PubMed]
  42. Wu, H.; Shi, S.; Lu, X.; Li, T.; Wang, J.; Liu, T.; Zhang, Q.; Sun, W.; Li, C.; Wang, Z.; et al. Expression Analysis and Functional Characterization of CER1 Family Genes Involved in Very-Long-Chain Alkanes Biosynthesis in Brachypodium Distachyon. Front. Plant Sci. 2019, 10, 1389. [Google Scholar] [CrossRef] [PubMed]
  43. Arya, G.C.; Sarkar, S.; Manasherova, E.; Aharoni, A.; Cohen, H. The Plant Cuticle: An Ancient Guardian Barrier Set Against Long-Standing Rivals. Front. Plant Sci. 2021, 12, 663165. [Google Scholar] [CrossRef] [PubMed]
  44. Zhao, Y.; Liu, X.; Wang, M.; Bi, Q.; Cui, Y.; Wang, L. Transcriptome and Physiological Analyses Provide Insights into the Leaf Epicuticular Wax Accumulation Mechanism in Yellowhorn. Hortic. Res. 2021, 8, 134. [Google Scholar] [CrossRef]
  45. Blair, M.W.; Cortés, A.J.; This, D. Identification of an ERECTA Gene and Its Drought Adaptation Associations with Wild and Cultivated Common Bean. Plant Sci. 2016, 242, 250–259. [Google Scholar] [CrossRef]
  46. Cortés, A.J.; This, D.; Chavarro, C.; Madriñán, S.; Blair, M.W. Nucleotide Diversity Patterns at the Drought-Related DREB2 Encoding Genes in Wild and Cultivated Common Bean (Phaseolus Vulgaris L.). Appl. Genet. 2012, 125, 1069–1085. [Google Scholar] [CrossRef]
  47. Fischer, I.; Camus-Kulandaivelu, L.; Allal, F.; Stephan, W. Adaptation to Drought in Two Wild Tomato Species: The Evolution of the Asr Gene Family. New Phytol. 2011, 190, 1032–1044. [Google Scholar] [CrossRef]
  48. Ai, W.; Liu, Y.; Mei, M.; Zhang, X.; Tan, E.; Liu, H.; Han, X.; Zhan, H.; Lu, X. A Chromosome-scale Genome Assembly of the Mongolian Oak (Quercus Mongolica). Mol. Ecol. Resour. 2022, 22, 2396–2410. [Google Scholar] [CrossRef]
Figure 1. (a) Comparison of differences in leaf epicuticular wax layer thickness between northern and southern wild samples. Error bars indicate standard errors. ‘****’ on error bar indicates a significant difference between the two groups at p < 0.0001. (b) Characterization of the anatomical structures of Gansu and Tianmu Mountains samples. The length of the scale is 20μm. The complete semi-thin section is shown in Figure S1. (c) Leaf epicuticular wax layer thickness analysis of Gansu and Tianmu Mountains samples. Error bars indicate standard errors. ‘****’ on error bar indicates a significant difference between the two groups at p < 0.0001.
Ijms 23 16202 g001
Figure 2. (a) Genomic landscape of the population differentiation in groups I (Gansu) and II (Tianmu Mountains) of wild Chinese chestnut, as measured by the fixation index (FST). (b) Sliding window analysis for further presentation.
Ijms 23 16202 g002
Figure 3. Phylogenetic trees of 17 CERs in A. thaliana and 34 CERs in C. mollissima. MEGA11 was applied to construct the maximum-likelihood (ML) tree using the WAG with Freqs. (+F) model with 1000 bootstrap replicates. The number on the branch indicates the bootstrap value. The different groups are color-coded as indicated in the top left panel.
Ijms 23 16202 g003
Figure 4. Distribution of conserved motifs in CmCERs. Individual motifs are indicated in different-colored horizontal bars below each figure. Numbers on the X-axis indicate amino-acid positions of the proteins.
Ijms 23 16202 g004
Figure 5. Chromosomal location of CmCERs.
Ijms 23 16202 g005
Figure 6. Cis-regulatory element analysis on CmCER genes.
Ijms 23 16202 g006
Figure 7. (a) Expression levels of CmCER genes in drought-treated Chinese chestnut seedlings. (b) Comparison of differences in leaf epicuticular wax layer thickness between northern and southern varieties in the Beijing and Liyang germplasm repositories. Repository 1: Chestnut Experiment Station in the Huairou District of Beijing, China. Repository 2: Liyang Longtan Linchang. Error bars indicate standard errors. ‘**’ on the error bar indicates a significant difference between the two groups at p < 0.01. (c) Results of semi-thin sections of wild Y-2 leaves in Hubei and grafted Y-2 leaves in the north. Error bars indicate standard errors. ‘*’ on the error bar indicates a significant difference between the two groups at p < 0.05. The length of the scale is 20μm. The complete semi-thin section is shown in Figure S2. (d) Expression of CmCER1-1, CmCER1-5 and CmCER3 in grafted Y-2 varieties in the north and wild Y-2 varieties in the south. Error bars indicate standard errors. ‘*’ or ‘**’ on the error bar indicates a significant difference between the two groups at p < 0.05 or p < 0.01, respectively.
Ijms 23 16202 g007
Table 1. Physicochemical properties of CER genes identified in C. mollissima.
Gene NameGene IDNumber of Amino AcidsMolecular Weight/kDTheoretical pIInstability Index (II)Aliphatic IndexSubcellular Localization
CmCER1-1Cm03G0198358868.888.9733.5294.18Vacuole
CmCER1-2Cm03G0198762372.828.5834.9996.42Vacuole
CmCER1-3Cm03G0199262372.778.5834.4296.26Vacuole
CmCER1-4Cm10G0189062371.858.7234.7299.49Vacuole
CmCER1-5Cm10G0207647454.379.0235.8696.22Cell membrane Vacuole
CmCER1-6Cm12G0216163273.088.0331.5197.74Vacuole
CmCER1-7Cm10G0198055763.698.8533.9598.13Vacuole
CmCER1-8Cm03G0197661972.199.1834.2393.51Vacuole
CmCER1-9Cm03G01984 14216.50 6.6842.997.61Vacuole
CmCER2Cm08G0133344649.80 5.2832.0388.25Cytoplasm
CmCER3Cm01G00496 62871.948.4731.96102.72Vacuole
CmCER4Cm07G0073749055.198.3625.77104.22Golgi apparatus
CmCER5-1Cm07G0026369677.799.3548.1193.99Cell membrane
CmCER5-2Cm07G0026468275.888.6743.9899.5Cell membrane
CmCER6-1Cm07G01950 49655.859.0140.1499.11Cytoplasm
CmCER6-2Cm10G0169750757.079.2937.4994.97Cytoplasm
CmCER7Cm07G0025945749.885.9453.1876.21Chloroplast Mitochondrion
CmCER8Cm12G0078865473.856.3629.4286.73Peroxisome
CmCER9-1Cm10G013511109123.645.8536.29109.1Cell membrane Nucleus
CmCER9-2Cm11G0222453458.976.1135.25106.84Cell membrane
CmCER10-1Cm05G0091430836.049.6141.5286.66Nucleus
CmCER10-2Cm11G0238531036.319.6148.6690.23Cell membrane Golgi apparatus
CmCER11-1Cm11G0150785495.40 6.3551.8480.68Nucleus
CmCER11-2Cm02G02052952106.285.9356.9780.09Chloroplast Nucleus
CmCER13Cm01G014261852206.055.8446.55111.02Nucleus
CmCER17Cm02G0232638944.479.6446.7186.97Chloroplast Endoplasmic reticulum
CmCER60-1Cm01G0319051057.629.0842.3294.63Chloroplast Cytoplasm
CmCER60-2Cm06G0123145750.958.7437.5997.72Cytoplasm
CmCER60-3Cm09G0184846352.358.6943.4793.89Cytoplasm
CmCER60-4Cm09G0187246352.358.6943.4793.89Cytoplasm
CmCER60-5Cm08G0202347853.649.7134.4399.96Cytoplasm
CmCER60-6Cm09G0187337042.029.5840.1498.54Chloroplast Cytoplasm
CmCER60-7Cm05G0022053260.178.9932.6890.55Cytoplasm
CmCER60-8Cm08G0259452359.029.2739.3592.64Cytoplasm
Publisher’s Note: MDPI stays neutral with regard to jurisdictional claims in published maps and institutional affiliations.

