
Investigating SH-SY5Y Neuroblastoma Cell Surfaceome as a Model for Neuronal-Targeted Novel Therapeutic Modalities
 , and
, and 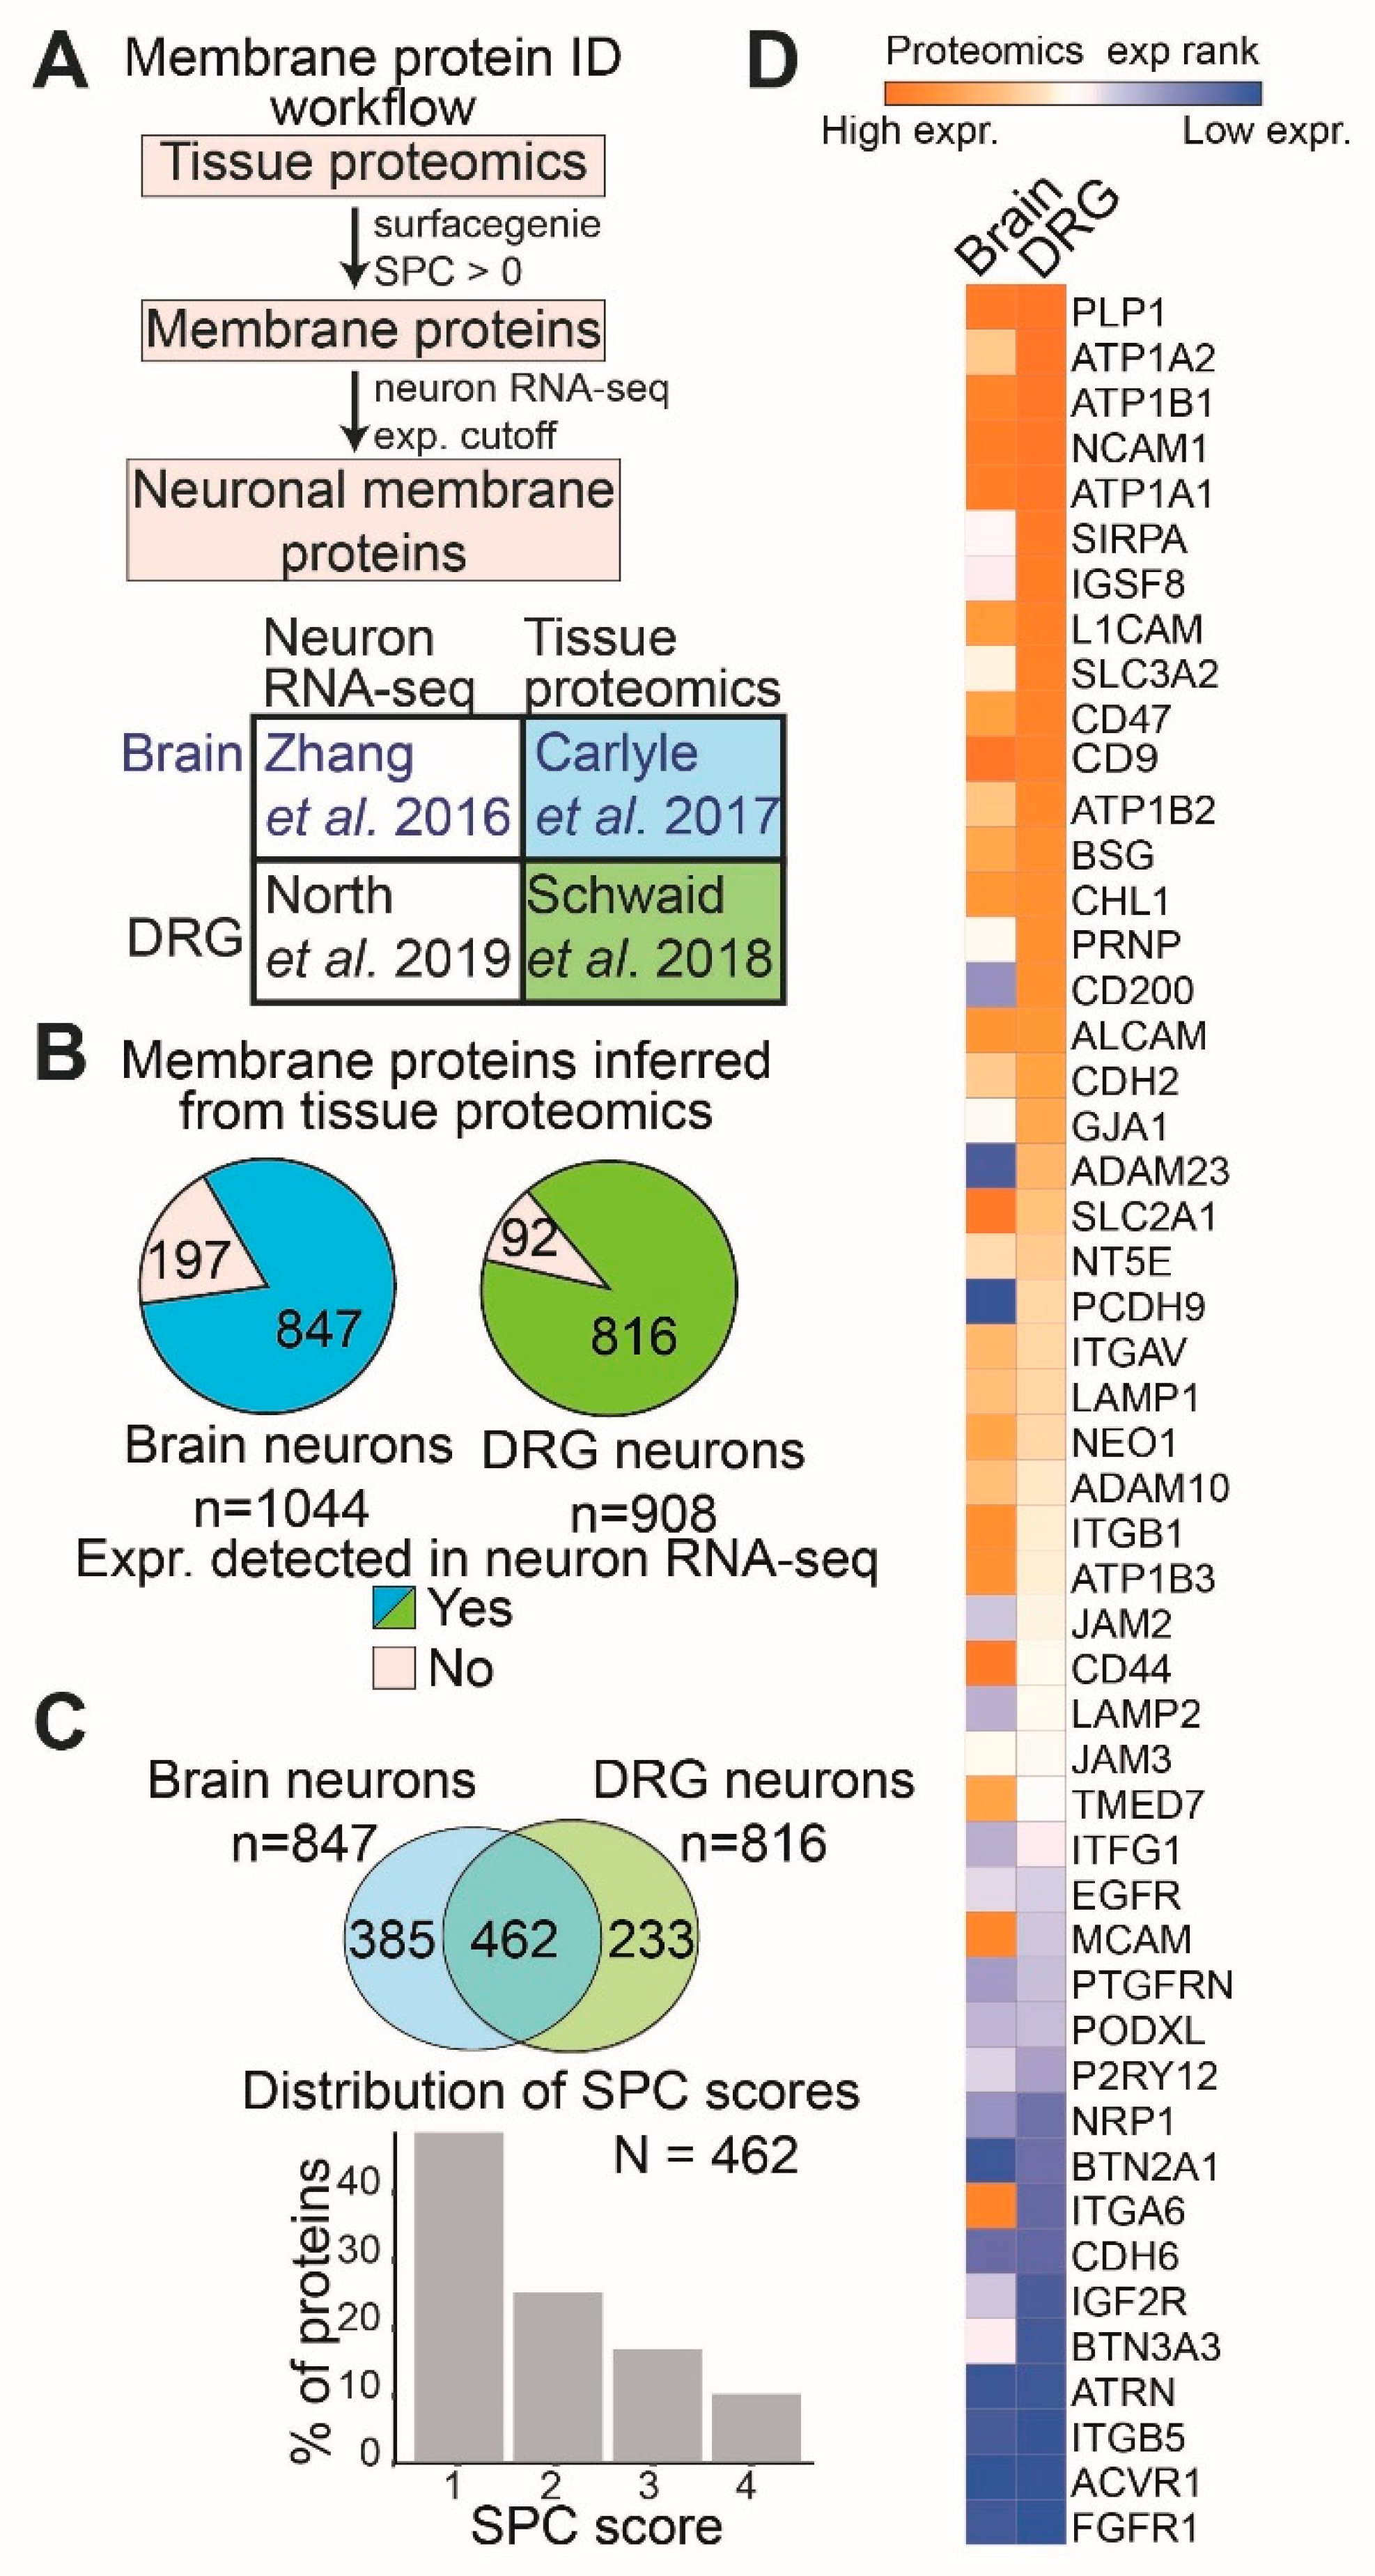
Abstract
:1. Introduction
2. Results
2.1. Bioinformatically Inferring Surface Proteins Expressed in Human Brain Neurons and DRG Neurons Using Proteomics and Transcriptomics Data
2.2. Investigation of the SH-SY5Y Neuroblastoma Cell Surfaceome and Its Comparison to the Inferred Brain and DRG Neuronal Surfaceome
2.3. Validation of SH-SY5Y Surface Proteomics by RNA Sequencing and Identification of SH-SY5Y Specific Surface Protein Major Isoforms
2.4. SH-SY5Y Cells Specifically Express an Alternatively Spliced Isoform of NRCAM
3. Discussion
3.1. Surface Proteins Shared between Brain and DRG Neurons Show Tissue-Specific Differences in Expression Levels
3.2. Using the SH-SY5Y Neuroblastoma Cell Line as a Model for Receptor-Targeted Drug Delivery Needs to Be Evaluated on a Receptor-by-Receptor Basis
3.3. Investigation of Alternatively Spliced Surface Protein Isoforms in SH-SY5Y Cells Reveals NRCAM as a Putative Delivery Target for Neuroblastoma
4. Materials and Methods
4.1. Cell Culture
4.2. Cell Surface Protein Labeling and Immunoprecipitation
4.3. Sample Preparation for Mass Spectrometry Analysis
4.4. Mass Spectrometry Peptide Analysis
4.5. Mass Spectrometry Bioinformatic Analysis
4.6. Western Blot Analysis
4.6.1. Primary Antibodies Used
4.6.2. Secondary Antibodies Used
4.7. SH-SY5Y RNA Sequencing Sample Preparation and Data Analysis
4.8. SH-SY5Y RNA Sequencing Library Preparation, Sequencing, and Data Analysis
4.9. Major Isoform Calculation and Membrane Topology Benchmarking
4.10. Brain and DRG Transcriptomic and Proteomic Datasets
4.11. Brain and DRG (Dorsal Root Ganglion) Tissue Datasets Analysis
4.12. Surface Protein Selection
4.13. GO Term Enrichment Analysis
Supplementary Materials
Author Contributions
Funding
Institutional Review Board Statement
Informed Consent Statement
Data Availability Statement
Acknowledgments
Conflicts of Interest
References
- Zhao, Z.; Ukidve, A.; Kim, J.; Mitragotri, S. Targeting Strategies for Tissue-Specific Drug Delivery. Cell 2020, 181, 151–167. [Google Scholar] [CrossRef] [PubMed]
- Adachi, H.; Hengesbach, M.; Yu, Y.-T.; Morais, P. From Antisense RNA to RNA Modification: Therapeutic Potential of RNA-Based Technologies. Biomedicines 2021, 9, 550. [Google Scholar] [CrossRef] [PubMed]
- Yan, Y.; Liu, X.-Y.; Lu, A.; Wang, X.-Y.; Jiang, L.-X.; Wang, J.-C. Non-Viral Vectors for RNA Delivery. J. Control. Release 2022, 342, 241–279. [Google Scholar] [CrossRef] [PubMed]
- O’Brien, K.; Breyne, K.; Ughetto, S.; Laurent, L.C.; Breakefield, X.O. RNA Delivery by Extracellular Vesicles in Mammalian Cells and Its Applications. Nat. Rev. Mol. Cell Biol. 2020, 21, 585–606. [Google Scholar] [CrossRef]
- Luan, X.; Sansanaphongpricha, K.; Myers, I.; Chen, H.; Yuan, H.; Sun, D. Engineering Exosomes as Refined Biological Nanoplatforms for Drug Delivery. Acta Pharmacol. Sin. 2017, 38, 754–763. [Google Scholar] [CrossRef] [Green Version]
- Chatzikleanthous, D.; O’Hagan, D.T.; Adamo, R. Lipid-Based Nanoparticles for Delivery of Vaccine Adjuvants and Antigens: Toward Multicomponent Vaccines. Mol. Pharm. 2021, 18, 2867–2888. [Google Scholar] [CrossRef]
- Biedler, J.L.; Roffler-Tarlov, S.; Schachner, M.; Freedman, L.S. Multiple Neurotransmitter Synthesis by Human Neuroblastoma Cell Lines and Clones. Cancer Res. 1978, 38, 3751–3757. [Google Scholar]
- Gordon, J.; Amini, S.; White, M.K. General Overview of Neuronal Cell Culture. Methods Mol. Biol. 2013, 1078, 1–8. [Google Scholar] [CrossRef] [Green Version]
- Slanzi, A.; Iannoto, G.; Rossi, B.; Zenaro, E.; Constantin, G. In Vitro Models of Neurodegenerative Diseases. Front. Cell Dev. Biol. 2020, 8, 328. [Google Scholar] [CrossRef]
- Yin, K.; Baillie, G.J.; Vetter, I. Neuronal Cell Lines as Model Dorsal Root Ganglion Neurons. Mol. Pain 2016, 12, 1744806916646111. [Google Scholar] [CrossRef] [Green Version]
- Krishna, A.; Biryukov, M.; Trefois, C.; Antony, P.M.; Hussong, R.; Lin, J.; Heinäniemi, M.; Glusman, G.; Köglsberger, S.; Boyd, O.; et al. Systems Genomics Evaluation of the SH-SY5Y Neuroblastoma Cell Line as a Model for Parkinson’s Disease. BMC Genom. 2014, 15, 1154. [Google Scholar] [CrossRef] [PubMed]
- Zhang, T.; Gygi, S.P.; Paulo, J.A. Temporal Proteomic Profiling of SH-SY5Y Differentiation with Retinoic Acid Using FAIMS and Real-Time Searching. J. Proteome Res. 2021, 20, 704–714. [Google Scholar] [CrossRef] [PubMed]
- Garcia, J.; Faca, V.; Jarzembowski, J.; Zhang, Q.; Park, J.; Hanash, S. Comprehensive Profiling of the Cell Surface Proteome of Sy5Y Neuroblastoma Cells Yields a Subset of Proteins Associated with Tumor Differentiation. J. Proteome Res. 2009, 8, 3791–3796. [Google Scholar] [CrossRef] [PubMed]
- Carlyle, B.C.; Kitchen, R.R.; Kanyo, J.E.; Voss, E.Z.; Pletikos, M.; Sousa, A.M.M.; Lam, T.T.; Gerstein, M.B.; Sestan, N.; Nairn, A.C. A Multiregional Proteomic Survey of the Postnatal Human Brain. Nat. Neurosci. 2017, 20, 1787–1795. [Google Scholar] [CrossRef] [PubMed] [Green Version]
- North, R.Y.; Li, Y.; Ray, P.; Rhines, L.D.; Tatsui, C.E.; Rao, G.; Johansson, C.A.; Zhang, H.; Kim, Y.H.; Zhang, B.; et al. Electrophysiological and Transcriptomic Correlates of Neuropathic Pain in Human Dorsal Root Ganglion Neurons. Brain 2019, 142, 1215–1226. [Google Scholar] [CrossRef]
- Schwaid, A.G.; Krasowka-Zoladek, A.; Chi, A.; Cornella-Taracido, I. Comparison of the Rat and Human Dorsal Root Ganglion Proteome. Sci. Rep. 2018, 8, 13469. [Google Scholar] [CrossRef] [Green Version]
- Zhang, Y.; Sloan, S.A.; Clarke, L.E.; Caneda, C.; Plaza, C.A.; Blumenthal, P.D.; Vogel, H.; Steinberg, G.K.; Edwards, M.S.B.; Li, G.; et al. Purification and Characterization of Progenitor and Mature Human Astrocytes Reveals Transcriptional and Functional Differences with Mouse. Neuron 2016, 89, 37–53. [Google Scholar] [CrossRef] [Green Version]
- Waas, M.; Snarrenberg, S.T.; Littrell, J.; Jones Lipinski, R.A.; Hansen, P.A.; Corbett, J.A.; Gundry, R.L. SurfaceGenie: A Web-Based Application for Prioritizing Cell-Type-Specific Marker Candidates. Bioinformatics 2020, 36, 3447–3456. [Google Scholar] [CrossRef]
- Smyth, G.K. Linear Models and Empirical Bayes Methods for Assessing Differential Expression in Microarray Experiments. Stat. Appl. Genet. Mol. Biol. 2004, 3, 3. [Google Scholar] [CrossRef]
- Mi, H.; Ebert, D.; Muruganujan, A.; Mills, C.; Albou, L.-P.; Mushayamaha, T.; Thomas, P.D. PANTHER Version 16: A Revised Family Classification, Tree-Based Classification Tool, Enhancer Regions and Extensive API. Nucleic Acids Res. 2021, 49, D394–D403. [Google Scholar] [CrossRef]
- Guo, X.; Chen, Q.-R.; Song, Y.K.; Wei, J.S.; Khan, J. Exon Array Analysis Reveals Neuroblastoma Tumors Have Distinct Alternative Splicing Patterns According to Stage and MYCN Amplification Status. BMC Med. Genom. 2011, 4, 35. [Google Scholar] [CrossRef] [PubMed]
- Shi, Y.; Yuan, J.; Rraklli, V.; Maxymovitz, E.; Cipullo, M.; Liu, M.; Li, S.; Westerlund, I.; Bedoya-Reina, O.C.; Bullova, P.; et al. Aberrant Splicing in Neuroblastoma Generates RNA-Fusion Transcripts and Provides Vulnerability to Spliceosome Inhibitors. Nucleic Acids Res. 2021, 49, 2509–2521. [Google Scholar] [CrossRef] [PubMed]
- Chen, J.; Hackett, C.S.; Zhang, S.; Song, Y.K.; Bell, R.J.A.; Molinaro, A.M.; Quigley, D.A.; Balmain, A.; Song, J.S.; Costello, J.F.; et al. The Genetics of Splicing in Neuroblastoma. Cancer Discov. 2015, 5, 380–395. [Google Scholar] [CrossRef] [Green Version]
- Harenza, J.L.; Diamond, M.A.; Adams, R.N.; Song, M.M.; Davidson, H.L.; Hart, L.S.; Dent, M.H.; Fortina, P.; Reynolds, C.P.; Maris, J.M. Transcriptomic Profiling of 39 Commonly-Used Neuroblastoma Cell Lines. Sci. Data 2017, 4, 170033. [Google Scholar] [CrossRef] [PubMed] [Green Version]
- Pezzini, F.; Bettinetti, L.; Di Leva, F.; Bianchi, M.; Zoratti, E.; Carrozzo, R.; Santorelli, F.M.; Delledonne, M.; Lalowski, M.; Simonati, A. Transcriptomic Profiling Discloses Molecular and Cellular Events Related to Neuronal Differentiation in SH-SY5Y Neuroblastoma Cells. Cell Mol. Neurobiol. 2017, 37, 665–682. [Google Scholar] [CrossRef] [Green Version]
- Gangras, P.; Merchant, A. Surfaltr: An R/Bioconductor Package to Benchmark Surface Protein Isoforms by Rapid Prediction and Visualization of Transmembrane Topologies. Proteomics 2022, e2200002. [Google Scholar] [CrossRef]
- Wachowiak, R.; Mayer, S.; Suttkus, A.; Martynov, I.; Lacher, M.; Melling, N.; Izbicki, J.R.; Tachezy, M. CHL1 and NrCAM are Primarily Expressed in Low Grade Pediatric Neuroblastoma. Open Med. 2019, 14, 920–927. [Google Scholar] [CrossRef] [Green Version]
- Sehgal, A.; Boynton, A.L.; Young, R.F.; Vermeulen, S.S.; Yonemura, K.S.; Kohler, E.P.; Aldape, H.C.; Simrell, C.R.; Murphy, G.P. Cell Adhesion Molecule Nr-CAM Is over-Expressed in Human Brain Tumors. Int. J. Cancer 1998, 76, 451–458. [Google Scholar] [CrossRef]
- Chan, J.Y.; Ong, C.W.; Salto-Tellez, M. Overexpression of Neurone Glial-Related Cell Adhesion Molecule Is an Independent Predictor of Poor Prognosis in Advanced Colorectal Cancer. Cancer Sci. 2011, 102, 1855–1861. [Google Scholar] [CrossRef]
- Liu, X.; Mazanek, P.; Dam, V.; Wang, Q.; Zhao, H.; Guo, R.; Jagannathan, J.; Cnaan, A.; Maris, J.M.; Hogarty, M.D. Deregulated Wnt/β-Catenin Program in High-Risk Neuroblastomas without MYCN Amplification. Oncogene 2008, 27, 1478–1488. [Google Scholar] [CrossRef] [Green Version]
- Neviani, P.; Wise, P.M.; Murtadha, M.; Liu, C.W.; Wu, C.-H.; Jong, A.Y.; Seeger, R.C.; Fabbri, M. Natural Killer-Derived Exosomal MiR-186 Inhibits Neuroblastoma Growth and Immune Escape Mechanisms. Cancer Res. 2019, 79, 1151–1164. [Google Scholar] [CrossRef] [PubMed]
- Ross, R.A.; Spengler, B.A.; Biedler, J.L. Coordinate Morphological and Biochemical Interconversion of Human Neuroblastoma Cells. J. Natl. Cancer Inst. 1983, 71, 741–747. [Google Scholar] [PubMed]
- Yeung, Y.G.; Stanley, E.R. Rapid detergent removal from peptide samples with ethyl acetate for mass spectrometry analysis. Curr. Protoc. Protein Sci. 2010, 59, 16. [Google Scholar] [CrossRef] [PubMed] [Green Version]
- Higgs, R.E.; Butler, J.P.; Han, B.; Knierman, M.D. Quantitative Proteomics via High Resolution MS Quantification: Capabilities and Limitations. Int. J. Proteom. 2013, 2013, e674282. [Google Scholar] [CrossRef]
- Schwämmle, V.; Hagensen, C.E.; Rogowska-Wrzesinska, A.; Jensen, O.N. PolySTest: Robust Statistical Testing of Proteomics Data with Missing Values Improves Detection of Biologically Relevant Features. Mol. Cell Proteom. 2020, 19, 1396–1408. [Google Scholar] [CrossRef]
- Bray, N.L.; Pimentel, H.; Melsted, P.; Pachter, L. Near-Optimal Probabilistic RNA-Seq Quantification. Nat. Biotechnol. 2016, 34, 525–527. [Google Scholar] [CrossRef]
- Sayols, S. rrvgo: Reduce + Visualize GO [Internet]. Bioconductor Version: Release (3.14). 2022. Available online: https://bioconductor.org/packages/rrvgo/ (accessed on 24 March 2022).


Publisher’s Note: MDPI stays neutral with regard to jurisdictional claims in published maps and institutional affiliations. |
© 2022 by the authors. Licensee MDPI, Basel, Switzerland. This article is an open access article distributed under the terms and conditions of the Creative Commons Attribution (CC BY) license (https://creativecommons.org/licenses/by/4.0/).
Share and Cite
Gangras, P.; Gelfanova, V.; Williams, G.D.; Handelman, S.K.; Smith, R.M.; Debets, M.F. Investigating SH-SY5Y Neuroblastoma Cell Surfaceome as a Model for Neuronal-Targeted Novel Therapeutic Modalities. Int. J. Mol. Sci. 2022, 23, 15062. https://doi.org/10.3390/ijms232315062
Gangras P, Gelfanova V, Williams GD, Handelman SK, Smith RM, Debets MF. Investigating SH-SY5Y Neuroblastoma Cell Surfaceome as a Model for Neuronal-Targeted Novel Therapeutic Modalities. International Journal of Molecular Sciences. 2022; 23(23):15062. https://doi.org/10.3390/ijms232315062
Chicago/Turabian StyleGangras, Pooja, Valentina Gelfanova, Graham D. Williams, Samuel K. Handelman, Ryan M. Smith, and Marjoke F. Debets. 2022. "Investigating SH-SY5Y Neuroblastoma Cell Surfaceome as a Model for Neuronal-Targeted Novel Therapeutic Modalities" International Journal of Molecular Sciences 23, no. 23: 15062. https://doi.org/10.3390/ijms232315062