
Snapshot into the Type-2-Diabetes-Associated Microbiome of a Romanian Cohort
 ,
,
Abstract
:1. Introduction
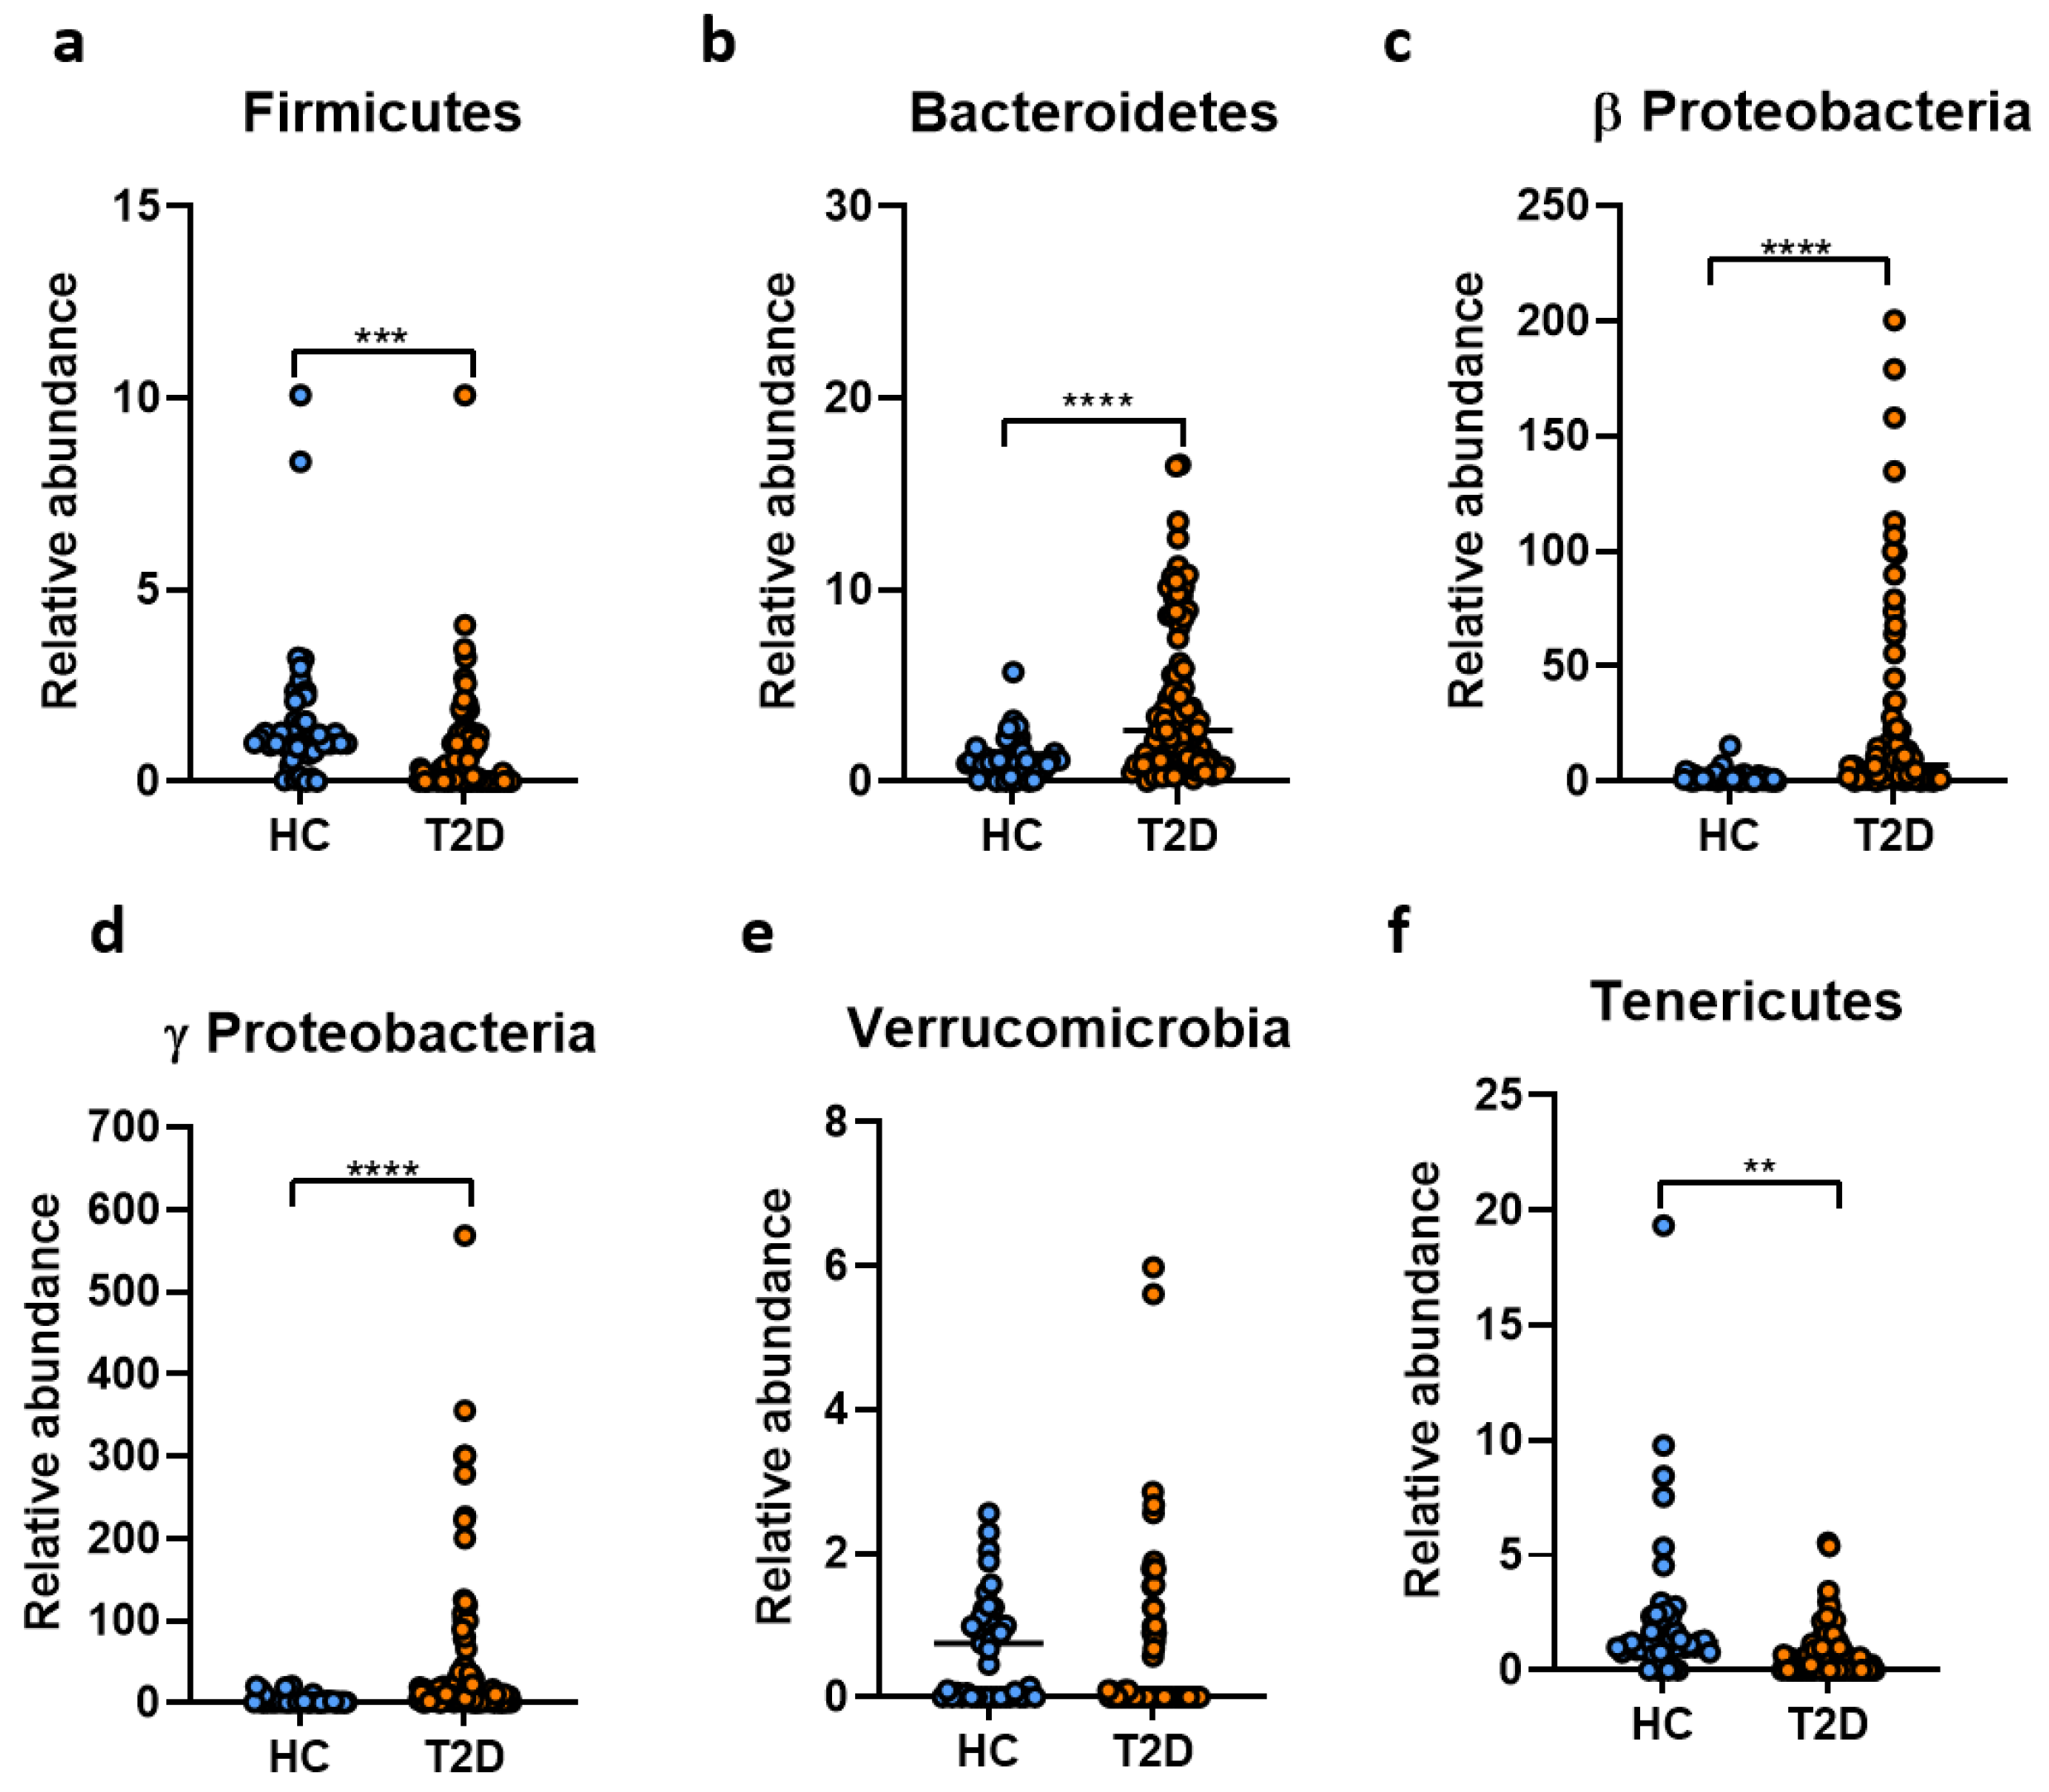
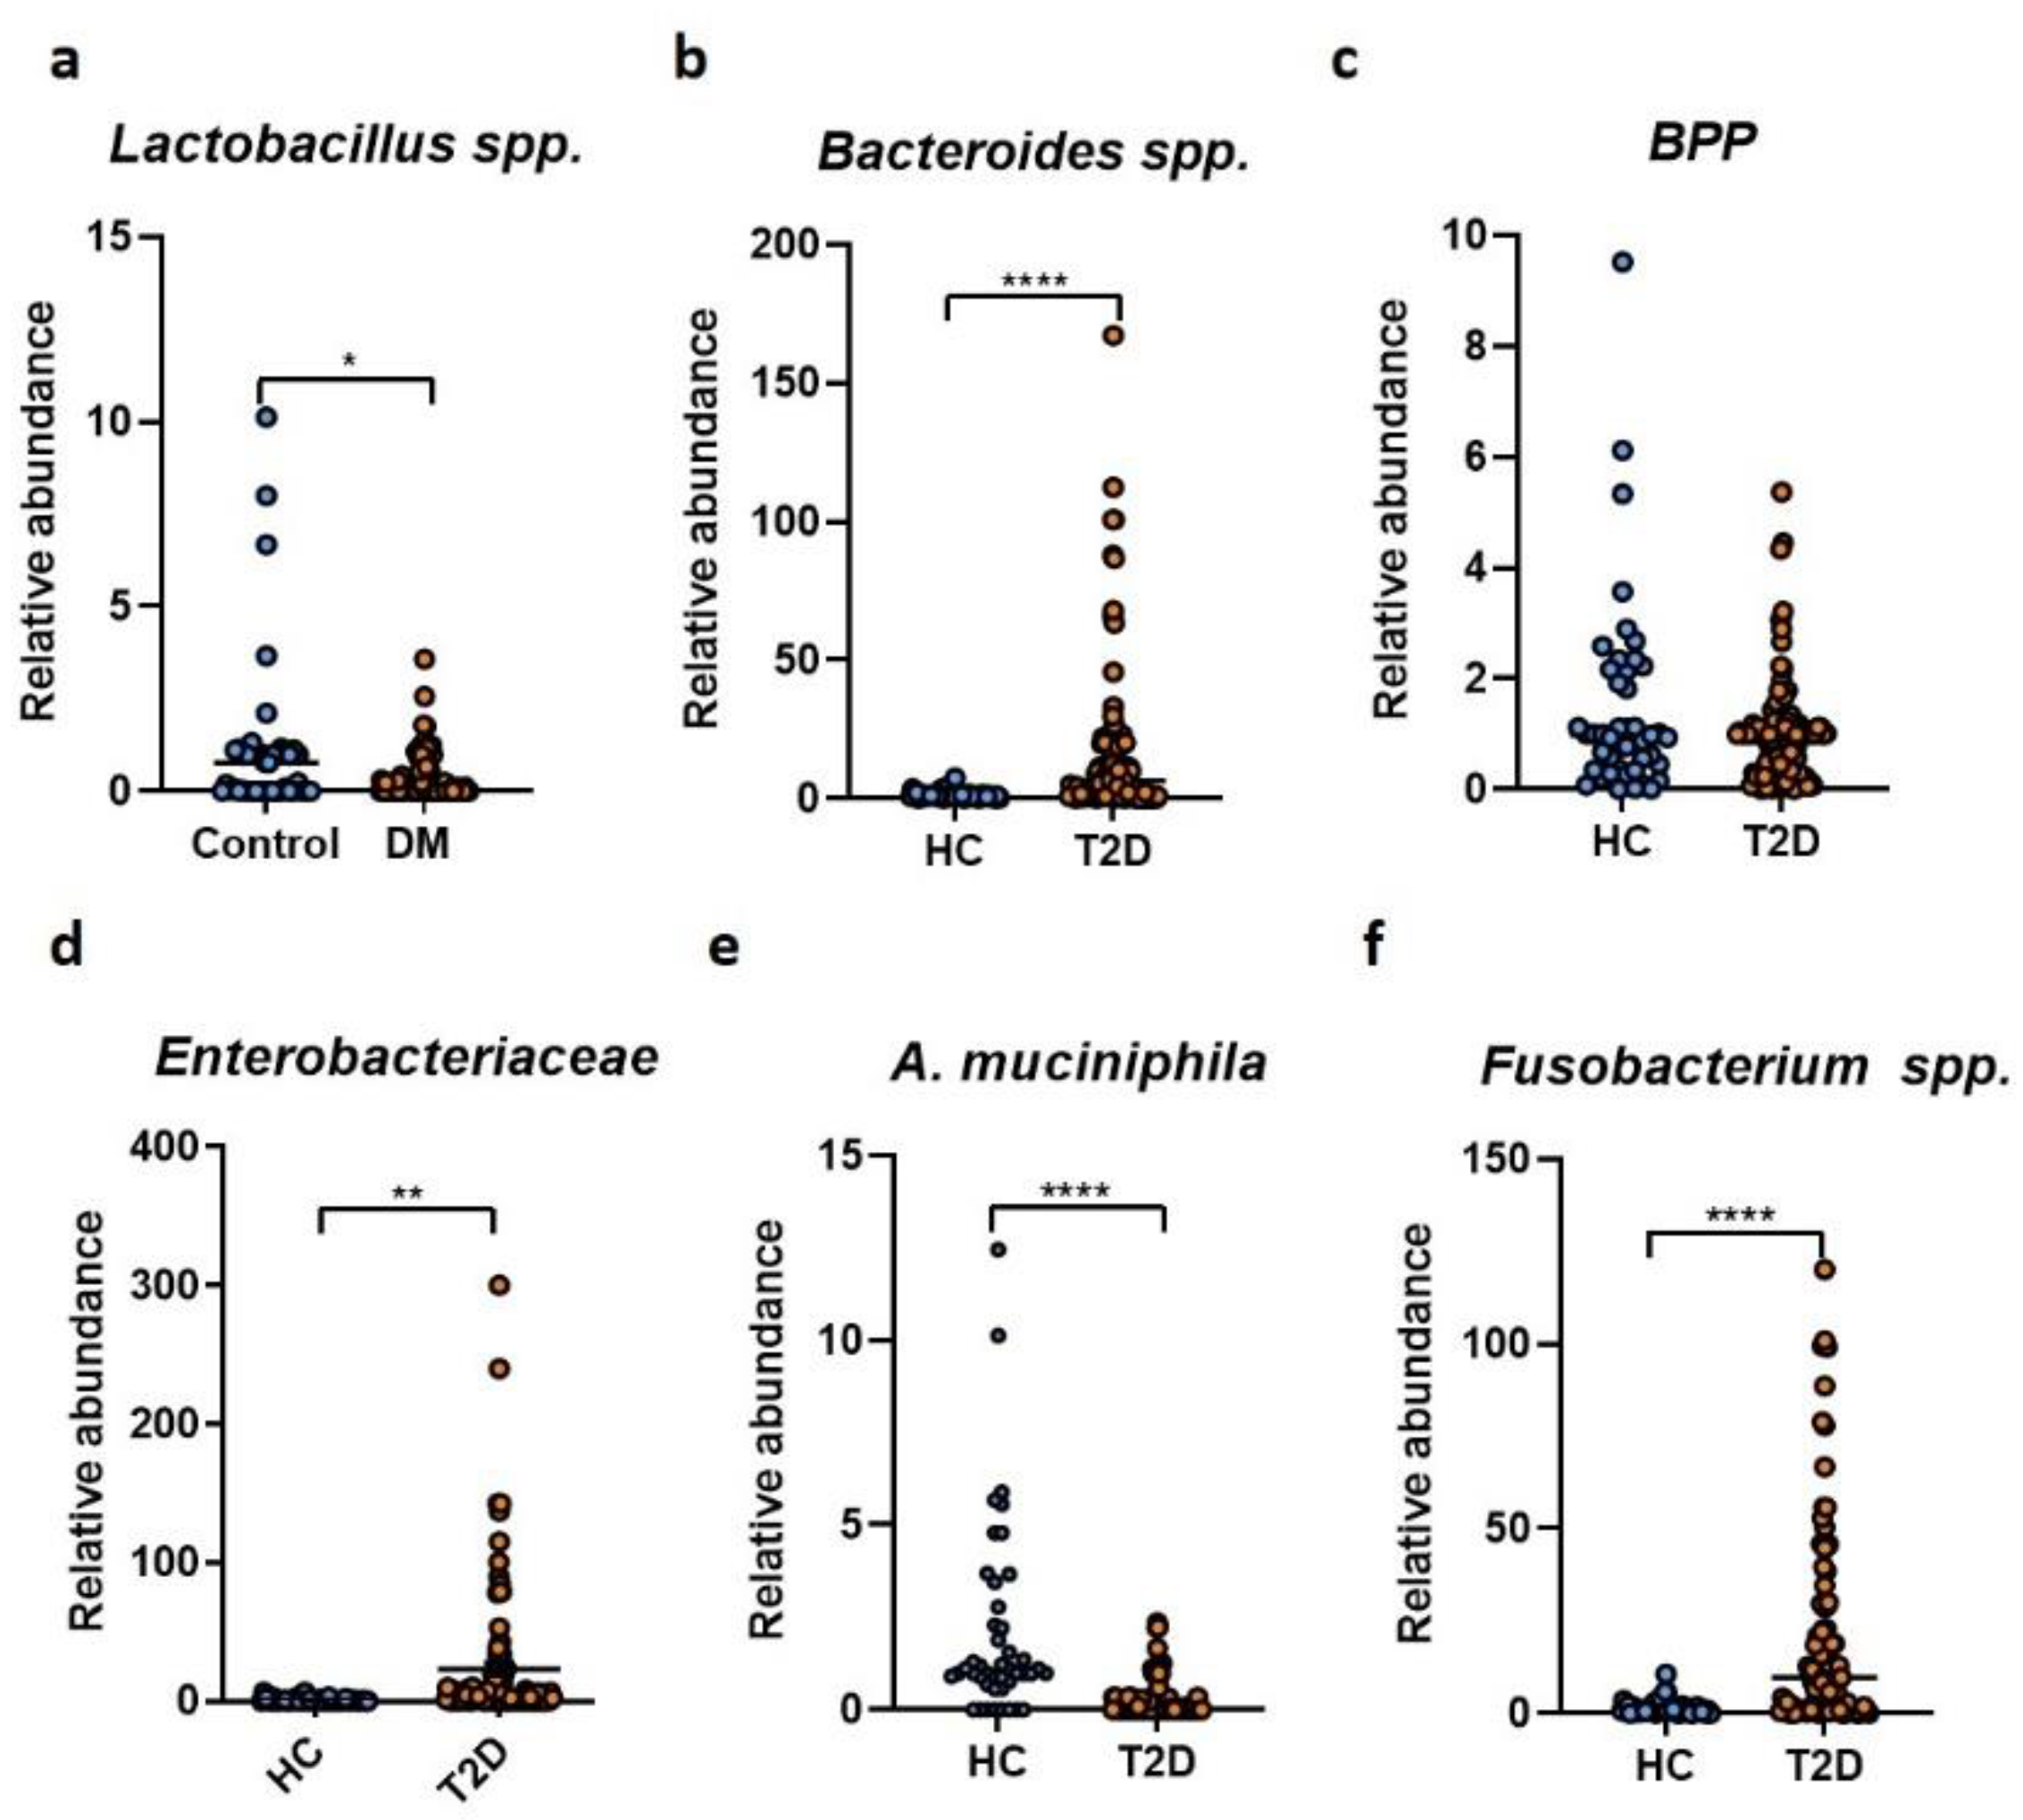
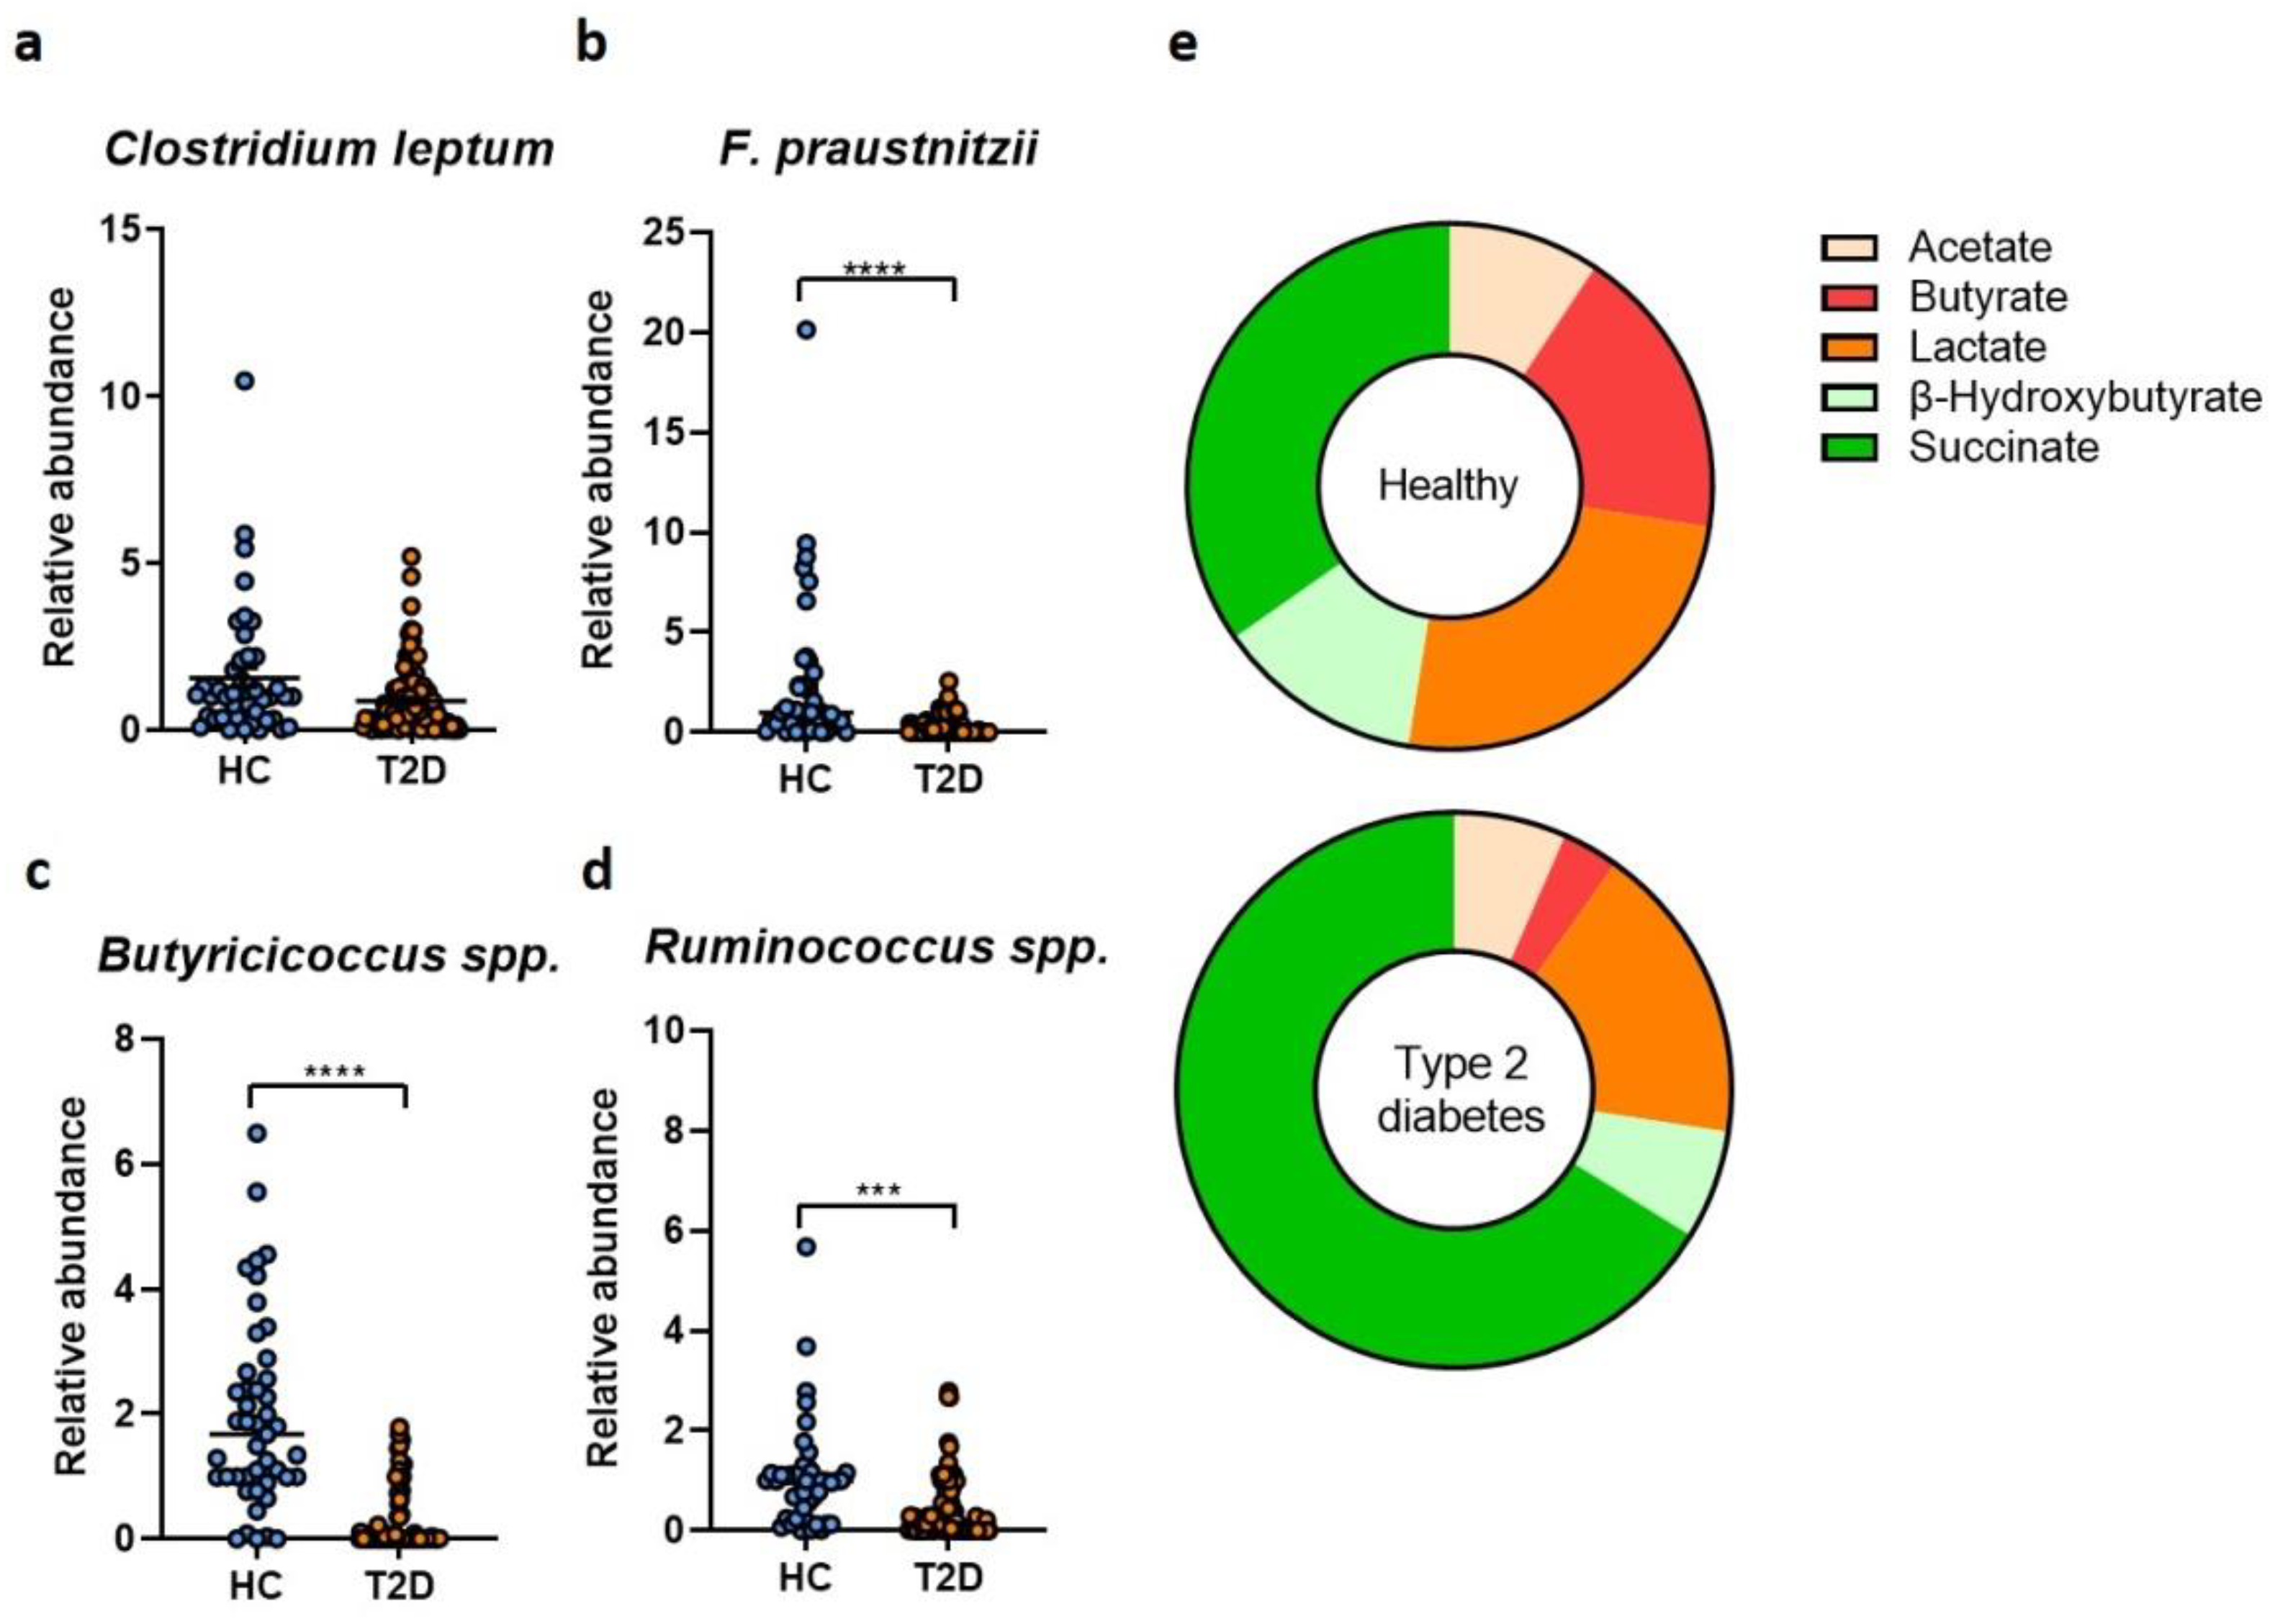
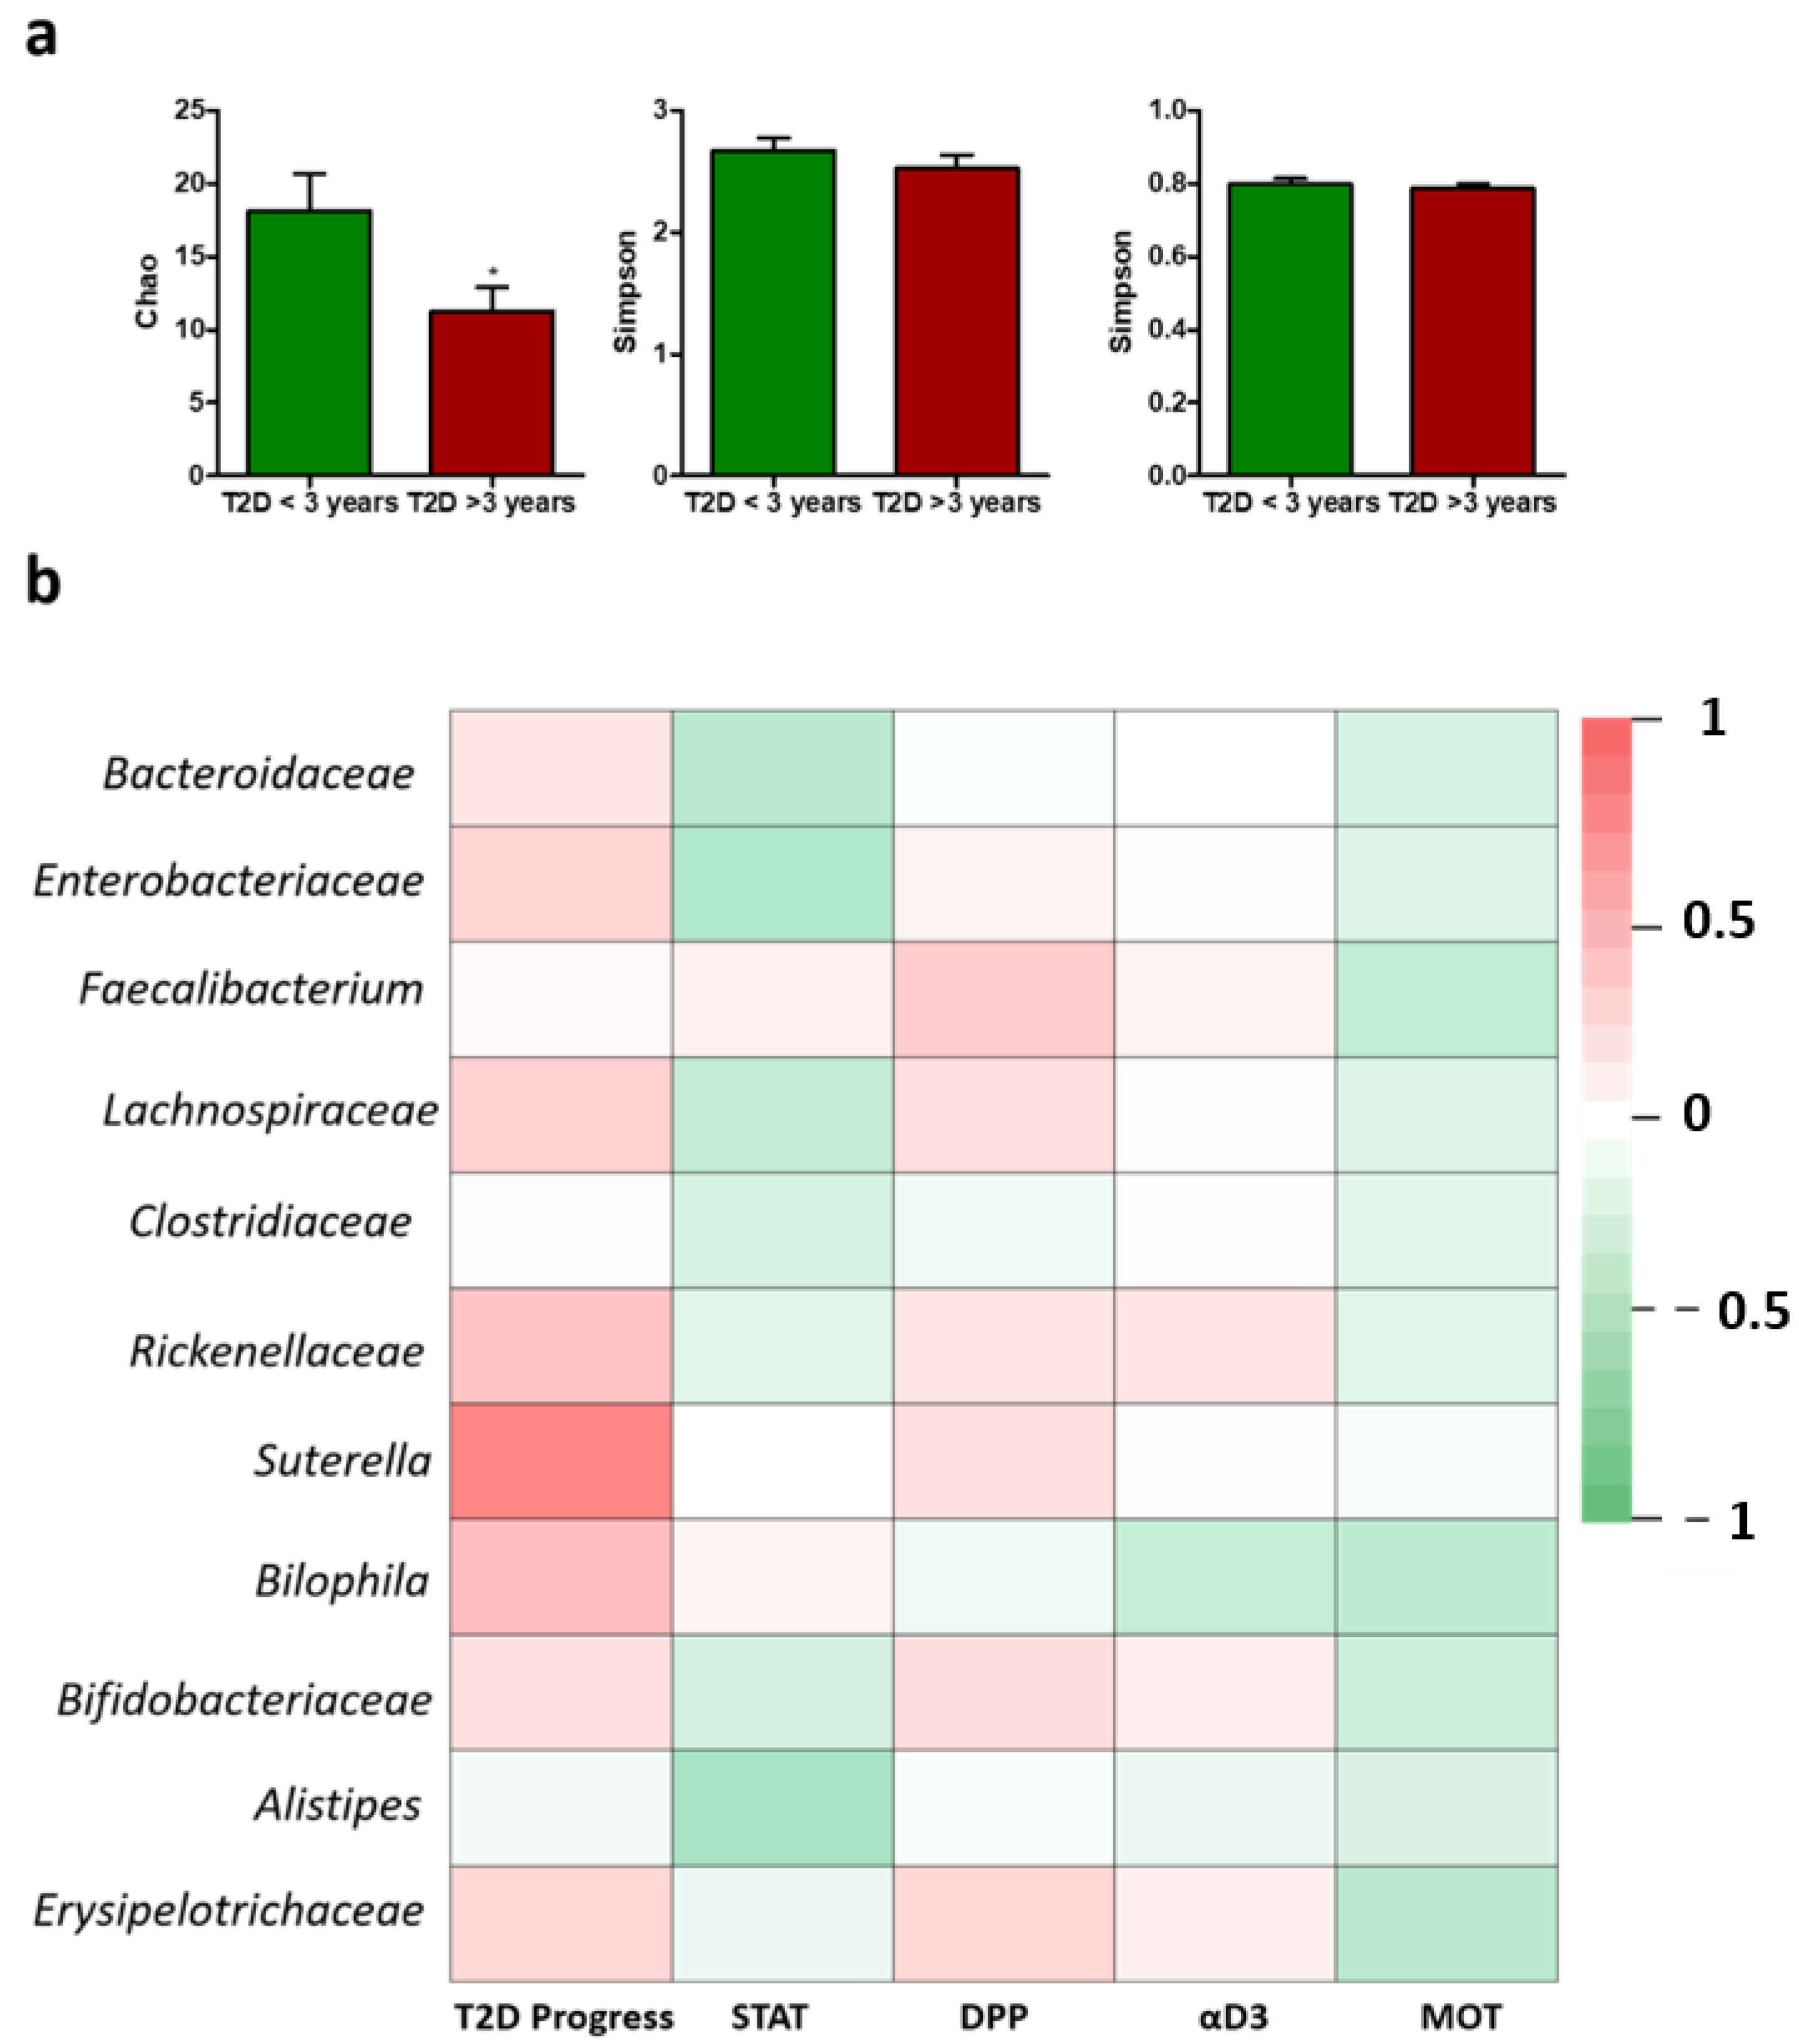
2. Results
3. Discussion
4. Materials and Methods
4.1. Study Group
4.2. Microbiota Analysis
4.3. Metabolite Analysis
4.4. Statistical Analysis
5. Conclusions
Supplementary Materials
Author Contributions
Funding
Institutional Review Board Statement
Informed Consent Statement
Data Availability Statement
Acknowledgments
Conflicts of Interest
References
- International Diabetes Federation. IDF Diabetes Atlas, Ninth Edition. 2019. Available online: https://www.diabetesatlas.org/en/ (accessed on 1 October 2022).
- Mota, M.; Popa, S.G.; Mota, E.; Mitrea, A.; Catrinoiu, D.; Cheta, D.M.; Guja, C.; Hancu, N.; Ionescu-Tirgoviste, C.; Lichiardopol, R.; et al. Prevalence of diabetes mellitus and prediabetes in the adult Romanian population: PREDATORR study. J. Diabetes 2015, 8, 336–344. [Google Scholar] [CrossRef] [PubMed]
- World Health Organisation. Global Report on Diabetes. 2016. Available online: https://www.who.int/publications/i/item/9789241565257 (accessed on 23 September 2022).
- United Nations General Assembly. Political Declaration of the High-Level Meeting of the General Assembly on the Prevention and Control of Non-Communicable Diseases. 2012. Available online: https://www.who.int/nmh/events/un_ncd_summit2011/political_declaration_en.pdf (accessed on 30 September 2022).
- Wang, L.; Xu, H.; Yang, H.; Zhou, J.; Zhao, L.; Zhang, F. Glucose metabolism and glycosylation link the gut microbiota to autoimmune diseases. Front. Immunol. 2022, 13, 952398. [Google Scholar] [CrossRef] [PubMed]
- Larsen, N.; Vogensen, F.K.; Van Den Berg, F.W.J.; Nielsen, D.S.; Andreasen, A.S.; Pedersen, B.K.; Al-Soud, W.A.; Sørensen, S.J.; Hansen, L.H.; Jakobsen, M. Gut Microbiota in Human Adults with Type 2 Diabetes Differs from Non-Diabetic Adults. PLoS ONE 2010, 5, e9085. [Google Scholar] [CrossRef] [PubMed]
- Sedighi, M.; Razavi, S.; Navab-Moghadam, F.; Khamseh, M.E.; Alaei-Shahmiri, F.; Mehrtash, A.; Amirmozafari, N. Comparison of gut microbiota in adult patients with type 2 diabetes and healthy individuals. Microb. Pathog. 2017, 111, 362–369. [Google Scholar] [CrossRef]
- Zhao, L.; Lou, H.; Peng, Y.; Chen, S.; Zhang, Y.; Li, X. Comprehensive relationships between gut microbiome and faecal metabolome in individuals with type 2 diabetes and its complications. Endocrine 2019, 66, 526–537. [Google Scholar] [CrossRef]
- Qin, J.; Li, Y.; Cai, Z.; Li, S.; Zhu, J.; Zhang, F.; Liang, S.; Zhang, W.; Guan, Y.; Shen, D.; et al. A metagenome-wide association study of gut microbiota in type 2 diabetes. Nature 2012, 490, 55–60. [Google Scholar] [CrossRef]
- Lambeth, S.M.; Carson, T.; Lowe, J.; Ramaraj, T.; Leff, J.W.; Luo, L.; Bell, C.J.; Shah, V.O. Composition, diversity and abundance of gut microbiome in prediabetes and type 2 diabetes. J. Diabetes Obes. 2015, 2, 1–7. [Google Scholar] [CrossRef]
- Furet, J.-P.; Kong, L.-C.; Tap, J.; Poitou, C.; Basdevant, A.; Bouillot, J.-L.; Mariat, D.; Corthier, G.; Doré, J.; Henegar, C.; et al. Differential Adaptation of Human Gut Microbiota to Bariatric Surgery–Induced Weight Loss: Links with metabolic and low-grade inflammation markers. Diabetes 2010, 59, 3049–3057. [Google Scholar] [CrossRef]
- Tazoe, H.; Otomo, Y.; Kaji, I.; Tanaka, R.; Karaki, S.I.; Kuwahara, A. Roles of short-chain fatty acids receptors, GPR41 and GPR43 on colonic functions. J. Physiol. Pharmacol. 2008, 59 (Suppl. 2), 251–262. [Google Scholar]
- Tolhurst, G.; Heffron, H.; Lam, Y.S.; Parker, H.E.; Habib, A.M.; Diakogiannaki, E.; Cameron, J.; Grosse, J.; Reimann, F.; Gribble, F.M. Short-chain fatty acids stimulate glucagon-like peptide-1 secretion via the G-protein-coupled receptor FFAR2. Diabetes 2012, 61, 364–371. [Google Scholar] [CrossRef]
- Mandøe, M.J.; Hansen, K.B.; Hartmann, B.; Rehfeld, J.F.; Holst, J.J.; Hansen, H.S. The 2-monoacylglycerol moiety of dietary fat appears to be responsible for the fat-induced release of GLP-1 in humans. Am. J. Clin. Nutr. 2015, 102, 548–555. [Google Scholar] [CrossRef] [PubMed]
- Amato, A.; Cinci, L.; Rotondo, A.; Serio, R.; Faussone-Pellegrini, M.S.; Vannucchi, M.G.; Mulè, F. Peripheral motor action of glucagon-like peptide-1 through enteric neuronal receptors. Neurogastroenterol. Motil. 2010, 22, 664-e203. [Google Scholar] [CrossRef] [PubMed]
- Salminen, S.; Bouley, C.; Boutron-Ruault, M.C.; Cummings, J.H.; Franck, A.; Gibson, G.R.; Isolauri, E.; Moreau, M.-C.; Roberfroid, M.; Rowland, I. Functional food science and gastrointestinal physiology and function. Br. J. Nutr. 1998, 80 (Suppl. 1), S147–S171. [Google Scholar] [CrossRef] [PubMed]
- Canfora, E.E.; Jocken, J.W.; Blaak, E.E. Short-chain fatty acids in control of body weight and insulin sensitivity. Nat. Rev. Endocrinol. 2015, 11, 577–591. [Google Scholar] [CrossRef]
- Kelly, C.J.; Zheng, L.; Campbell, E.L.; Saeedi, B.; Scholz, C.C.; Bayless, A.J.; Wilson, K.E.; Glover, L.E.; Kominsky, D.J.; Magnuson, A.; et al. Crosstalk between Microbiota-Derived Short-Chain Fatty Acids and Intestinal Epithelial HIF Augments Tissue Barrier Function. Cell Host Microbe 2015, 17, 662–671. [Google Scholar] [CrossRef]
- Hamer, H.M.; Jonkers, D.; Venema, K.; Vanhoutvin, S.; Troost, F.J.; Brummer, R.-J. Review article: The role of butyrate on colonic function. Aliment. Pharmacol. Ther. 2008, 27, 104–119. [Google Scholar] [CrossRef]
- Pedersen, H.K.; Gudmundsdottir, V.; Nielsen, H.B.; Hyotylainen, T.; Nielsen, T.; Jensen, B.A.H.; Forslund, K.; Hildebrand, F.; Prifti, E.; Falony, G.; et al. Human gut microbes impact host serum metabolome and insulin sensitivity. Nature 2016, 535, 376–381. [Google Scholar] [CrossRef]
- Forslund, K.; Hildebrand, F.; Nielsen, T.; Falony, G.; Le Chatelier, E.; Sunagawa, S.; Prifti, E.; Vieira-Silva, S.; Gudmundsdottir, V.; Krogh Pedersen, H.; et al. Disentangling type 2 diabetes and metformin treatment signatures in the human gut microbiota. Nature 2015, 528, 262–266. [Google Scholar] [CrossRef]
- Everard, A.; Belzer, C.; Geurts, L.; Ouwerkerk, J.P.; Druart, C.; Bindels, L.B.; Guiot, Y.; Derrien, M.; Muccioli, G.G.; Delzenne, N.M.; et al. Cross-talk between Akkermansia muciniphila and intestinal epithelium controls diet-induced obesity. Proc. Natl. Acad. Sci. USA 2013, 110, 9066–9071. [Google Scholar] [CrossRef]
- Cunningham, A.L.; Stephens, J.W.; Harris, D.A. Gut microbiota influence in type 2 diabetes mellitus (T2DM). Gut Pathog. 2021, 13, 50. [Google Scholar] [CrossRef]
- Dao, M.C.; Everard, A.; Aron-Wisnewsky, J.; Sokolovska, N.; Prifti, E.; Verger, E.O.; Kayser, B.D.; Levenez, F.; Chilloux, J.; Hoyles, L.; et al. Akkermansia muciniphila and improved metabolic health during a dietary intervention in obesity: Relationship with gut microbiome richness and ecology. Gut 2016, 65, 426–436. [Google Scholar] [CrossRef] [PubMed]
- Gradisteanu Pircalabioru, G.; Ilie, I.; Oprea, L.; Picu, A.; Petcu, L.M.; Burlibasa, L.; Chifiriuc, M.-C.; Musat, M. Microbiome, Mycobiome and Related Metabolites Alterations in Patients with Metabolic Syndrome—A Pilot Study. Metabolites 2022, 12, 218. [Google Scholar] [CrossRef] [PubMed]
- Baldelli, V.; Scaldaferri, F.; Putignani, L.; Del Chierico, F. The Role of Enterobacteriaceae in Gut Microbiota Dysbiosis in Inflammatory Bowel Diseases. Microorganisms 2021, 9, 697. [Google Scholar] [CrossRef]
- Allin, K.H.; Tremaroli, V.; Caesar, R.; Jensen, B.A.H.; Damgaard, M.T.F.; Bahl, M.I.; Licht, T.R.; Hansen, T.H.; Nielsen, T.; Dantoft, T.M.; et al. Aberrant intestinal microbiota in individuals with prediabetes. Diabetologia 2018, 61, 810–820. [Google Scholar] [CrossRef] [PubMed]
- Karlsson, F.H.; Tremaroli, V.; Nookaew, I.; Bergström, G.; Behre, C.J.; Fagerberg, B.; Nielsen, J.; Bäckhed, F. Gut metagenome in European women with normal, impaired and diabetic glucose control. Nature 2013, 498, 99–103. [Google Scholar] [CrossRef] [PubMed]
- Navab-Moghadam, F.; Sedighi, M.; Khamseh, M.E.; Alaei-Shahmiri, F.; Talebi, M.; Razavi, S.; Amirmozafari, N. The association of type II diabetes with gut microbiota composition. Microb. Pathog. 2017, 110, 630–636. [Google Scholar] [CrossRef]
- Fernandes, J.J.D.R.; Su, W.; Rahat-Rozenbloom, S.; Wolever, T.M.S.; Comelli, E. Adiposity, gut microbiota and faecal short chain fatty acids are linked in adult humans. Nutr. Diabetes 2014, 4, e121. [Google Scholar] [CrossRef]
- Sanna, S.; Van Zuydam, N.R.; Mahajan, A.; Kurilshikov, A.; Vila, A.V.; Võsa, U.; Mujagic, Z.; Masclee, A.A.M.; Jonkers, D.M.A.E.; Oosting, M.; et al. Causal relationships among the gut microbiome, short-chain fatty acids and metabolic diseases. Nat. Genet. 2019, 51, 600–605. [Google Scholar] [CrossRef]
- Connors, J.; Dawe, N.; Van Limbergen, J. The Role of Succinate in the Regulation of Intestinal Inflammation. Nutrients 2018, 11, 25. [Google Scholar] [CrossRef]
- Natividad, J.M.; Lamas, B.; Pham, H.P.; Michel, M.-L.; Rainteau, D.; Bridonneau, C.; da Costa, G.; Van Hylckama Vlieg, J.; Sovran, B.; Chamignon, C.; et al. Bilophila wadsworthia aggravates high fat diet induced metabolic dysfunctions in mice. Nat. Commun. 2018, 9, 2802. [Google Scholar] [CrossRef]
- Kaakoush, N.O. Sutterella Species, IgA-degrading Bacteria in Ulcerative Colitis. Trends Microbiol. 2020, 28, 519–522. [Google Scholar] [CrossRef] [PubMed]
- Shahi, S.K.; Ghimire, S.; Lehman, P.; Mangalam, A.K. Obesity induced gut dysbiosis contributes to disease severity in an animal model of multiple sclerosis. Front. Immunol. 2022, 13, 966417. [Google Scholar] [CrossRef] [PubMed]
- Ganesan, K.; Chung, S.K.; Vanamala, J.; Xu, B. Causal Relationship between Diet-Induced Gut Microbiota Changes and Diabetes: A Novel Strategy to Transplant Faecalibacterium prausnitzii in Preventing Diabetes. Int. J. Mol. Sci. 2018, 19, 3720. [Google Scholar] [CrossRef]
- Maioli, T.U.; Borras-Nogues, E.; Torres, L.; Barbosa, S.C.; Martins, V.D.; Langella, P.; Azevedo, V.A.; Chatel, J.-M. Possible Benefits of Faecalibacterium prausnitzii for Obesity-Associated Gut Disorders. Front. Pharmacol. 2021, 12, 740636. [Google Scholar] [CrossRef] [PubMed]
- Sun, H.; Yuan, Y.; Sun, Z.-L. Cholesterol Contributes to Diabetic Nephropathy through SCAP-SREBP-2 Pathway. Int. J. Endocrinol. 2013, 2013, 592576. [Google Scholar] [CrossRef]
- Russo, G.T.; De Cosmo, S.; Viazzi, F.; Pacilli, A.; Ceriello, A.; Genovese, S.; Guida, P.; Giorda, C.; Cucinotta, D.; Pontremoli, R.; et al. Plasma Triglycerides and HDL-C Levels Predict the Development of Diabetic Kidney Disease in Subjects with Type 2 Diabetes: The AMD Annals Initiative. Diabetes Care 2016, 39, 2278–2287. [Google Scholar] [CrossRef] [PubMed]
- Chen, W.; Zhang, M.; Guo, Y.; Wang, Z.; Liu, Q.; Yan, R.; Wang, Y.; Wu, Q.; Yuan, K.; Sun, W. The Profile and Function of Gut Microbiota in Diabetic Nephropathy. Diabetes Metab. Syndr. Obes. Targets Ther. 2021, 14, 4283–4296. [Google Scholar] [CrossRef]
- Parker, B.J.; Wearsch, P.A.; Veloo, A.C.M.; Rodriguez-Palacios, A. The Genus Alistipes: Gut Bacteria with Emerging Implications to Inflammation, Cancer, and Mental Health. Front. Immunol. 2020, 11, 906. [Google Scholar] [CrossRef]
- Loftus, M.; Hassouneh, S.A.-D.; Yooseph, S. Bacterial community structure alterations within the colorectal cancer gut microbiome. BMC Microbiol. 2021, 21, 98. [Google Scholar] [CrossRef]
- Zhou, Z.; Chen, J.; Yao, H.; Hu, H. Fusobacterium and Colorectal Cancer. Front. Oncol. 2018, 8, 371. [Google Scholar] [CrossRef]
- Elwing, J.E.; Gao, F.; Davidson, N.O.; Early, D.S. Type 2 diabetes mellitus: The impact on colorectal adenoma risk in women. Am. J. Gastroenterol. 2006, 101, 1866. [Google Scholar] [CrossRef]
- Noureldein, M.; Nawfal, R.; Bitar, S.; Maxwell, S.S.; Khurana, I.; Kassouf, H.K.; Khuri, F.R.; El-Osta, A.; Eid, A.A. Intestinal microbiota regulates diabetes and cancer progression by IL-1β and NOX4 dependent signaling cascades. Cell. Mol. Life Sci. 2022, 79, 502. [Google Scholar] [CrossRef] [PubMed]
- Salamon, D.; Sroka-Oleksiak, A.; Kapusta, P.; Szopa, M.; Mrozińska, S.; Ludwig-Słomczyńska, A.H.; Wołkow, P.P.; Bulanda, M.; Klupa, T.; Małecki, M.T.; et al. Characteristics of gut microbiota in adult patients with type 1 and type 2 diabetes based on next generation sequencing of the 16S rRNA gene fragment. Pol. Arch. Intern. Med. 2018, 128, 336–343. [Google Scholar] [CrossRef] [PubMed]
- Balvers, M.; Deschasaux, M.; Born, B.-J.V.D.; Zwinderman, K.; Nieuwdorp, M.; Levin, E. Analyzing Type 2 Diabetes Associations with the Gut Microbiome in Individuals from Two Ethnic Backgrounds Living in the Same Geographic Area. Nutrients 2021, 13, 3289. [Google Scholar] [CrossRef] [PubMed]
- Alvarez-Silva, C.; Kashani, A.; Hansen, T.H.; Pinna, N.K.; Anjana, R.M.; Dutta, A.; Saxena, S.; Støy, J.; Kampmann, U.; Nielsen, T.; et al. Trans-ethnic gut microbiota signatures of type 2 diabetes in Denmark and India. Genome Med. 2021, 13, 37. [Google Scholar] [CrossRef]
- Anhê, F.F.; Schertzer, J.D.; Marette, A. Bacteria to alleviate metabolic syndrome. Nat. Med. 2019, 25, 1031–1033. [Google Scholar] [CrossRef]
- Naito, Y.; Uchiyama, K.; Takagi, T. A next-generation beneficial microbe: Akkermansia muciniphila. J. Clin. Biochem. Nutr. 2018, 63, 33–35. [Google Scholar] [CrossRef]
- Li, Q.; Chang, Y.; Zhang, K.; Chen, H.; Tao, S.; Zhang, Z. Implication of the gut microbiome composition of type 2 diabetic patients from northern China. Sci. Rep. 2020, 10, 5450. [Google Scholar] [CrossRef]
- Caporaso, J.G.; Kuczynski, J.; Stombaugh, J.; Bittinger, K.; Bushman, F.D.; Costello, E.K.; Fierer, N.; Peña, A.G.; Goodrich, J.K.; Gordon, J.I.; et al. QIIME allows analysis of high-throughput community sequencing data. Nat. Methods 2010, 7, 335–336. [Google Scholar] [CrossRef]
- Pircalabioru, G.; Aviello, G.; Kubica, M.; Zhdanov, A.; Paclet, M.H.; Brennan, L.; Hertzberger, R.; Papkovsky, D.; Bourke, B.; Knaus, U.G. Defensive Mutualism Rescues NADPH Oxidase Inactivation in Gut Infection. Cell Host Microbe 2016, 19, 651–663. [Google Scholar] [CrossRef]


| Characteristic | HC | T2D |
|---|---|---|
| Age | 57 ± 10.30 | 63 ± 12.25 |
| Sex (F/M) | 30/15 | 74/31 |
| BMI | 24.9 ± 2.115 | 30 ± 4.39 |
| Blood pressure (mmHg): systolic | 110 ± 2.20 | 139.5 ± 2.9 |
| Blood pressure (mmHg): diastolic | 62 ± 1.89 | 87.5 ± 1.6 |
| HbA1c (%) | 5.4 ± 0.29 | 6.5 ± 0.3 |
| HDL | 65 ± 4.89 | 48 ± 7.52 |
| LDL | 98 ± 16.89 | 116 ± 31.45 |
| TG | 89 ± 18.97 | 129 ± 53.67 |
| Statin (number/total) | 9/45 | 92/105 |
| Metformin (number/total) | n/a | 65/105 |
| Taxonomic Target | Sequence |
|---|---|
| Actinobacteria | tgtagcggtggaatgcgc aattaagccacatgctccgct |
| Verrucomicrobia | tcaggtcagtatggcccttat cagttttcaggatttcctccgcc |
| Bacteroides spp. | cctacgatggataggggtt cacgctacttggctggttcag |
| Butyricicoccus spp. | acctgaagaataagctcc gataacgcttgctccctacgt |
| Betaproteobacteria | aacgcgaaaaaccttacctacc tgccctttcgtagcaactagtg |
| Gamma proteobacteria | gctaacgcattaagtaccccg gccatgcagcacctgtct |
| Akkermansia muciniphila | gcg tag gct gtt tcg taa gtc gtg tgt gaa ag gag tgt tcc cga tat cta cgc att tca |
| Eubacteria | act cct acg gga ggc agc agt att acc gcg gct gct ggc |
| Lactobacillus spp. | acg agt agg gaa atc ttc ca cac cgc tac aca tgg ag |
| BPP | ggtgtcggcttaagtgccat cggacgtaagggccgtgc |
| Clostridium leptum | gcacaagcagtggagt cttcctccgttttgtcaa |
| Ruminococcus spp. | actgagaggttgaacggcca cctttacacccagtaattccgga |
| Fusobacterium spp. | acctaagggagaaacagaacca cctgcctttaattcatctccat |
| Firmicutes | ggagcatgtggtttaattcgaagca agctgacgacaaccatgcac |
| Bacteroidetes | ggaacatgtggtttaattcgatgat agctgacgacaaccatgcag |
| F. prausnitzii | cccttcagtgccgcagt gtcgcaggatgtcaagac |
Publisher’s Note: MDPI stays neutral with regard to jurisdictional claims in published maps and institutional affiliations. |
© 2022 by the authors. Licensee MDPI, Basel, Switzerland. This article is an open access article distributed under the terms and conditions of the Creative Commons Attribution (CC BY) license (https://creativecommons.org/licenses/by/4.0/).
Share and Cite
Gradisteanu Pircalabioru, G.; Chifiriuc, M.-C.; Picu, A.; Petcu, L.M.; Trandafir, M.; Savu, O. Snapshot into the Type-2-Diabetes-Associated Microbiome of a Romanian Cohort. Int. J. Mol. Sci. 2022, 23, 15023. https://doi.org/10.3390/ijms232315023
Gradisteanu Pircalabioru G, Chifiriuc M-C, Picu A, Petcu LM, Trandafir M, Savu O. Snapshot into the Type-2-Diabetes-Associated Microbiome of a Romanian Cohort. International Journal of Molecular Sciences. 2022; 23(23):15023. https://doi.org/10.3390/ijms232315023
Chicago/Turabian StyleGradisteanu Pircalabioru, Gratiela, Mariana-Carmen Chifiriuc, Ariana Picu, Laura Madalina Petcu, Maria Trandafir, and Octavian Savu. 2022. "Snapshot into the Type-2-Diabetes-Associated Microbiome of a Romanian Cohort" International Journal of Molecular Sciences 23, no. 23: 15023. https://doi.org/10.3390/ijms232315023