Article

Conformational Structures of Neutral and Cationic Pivaldehyde Revealed by IR-Resonant VUV-MATI Mass Spectroscopy

1
Department of Chemistry and Institute for Molecular Science and Fusion Technology, Kangwon National University, Chuncheon 24341, Republic of Korea
2
Forensic Chemistry Division, National Forensic Service, Wonju 26460, Republic of Korea
*
Author to whom correspondence should be addressed.
These authors contributed equally to this work.
Int. J. Mol. Sci. 2022, 23(23), 14777; https://doi.org/10.3390/ijms232314777
Submission received: 9 November 2022 / Revised: 22 November 2022 / Accepted: 23 November 2022 / Published: 26 November 2022
(This article belongs to the Special Issue State-of-the-Art Physical Chemistry and Chemical Physics in Korea)

Abstract

:
Pivaldehyde, which is an unwanted by-product released with engine exhaust, has received considerable research attention because of its hydrocarbon oxidations at atmospheric temperature. To gain insight into the conformer-specific reaction dynamics, we investigated the conformational structures of the pivaldehyde molecule in neutral (S0) and cationic (D0) states using the recently invented IR-resonant VUV-MATI mass spectroscopy. Additionally, we constructed the two-dimensional potential energy surfaces (2D PESs) associated with the conformational transformations in the S0 and D0 states to deduce the conformations corresponding to the measured vibrational spectra. The 2D PESs indicated the presence of only the eclipsed conformation in the global minima of both states, unlike those in propanal and isobutanal. However, comparing the IR-dip VUV-MATI spectra from two intense peaks in the VUV-MATI spectrum with the anharmonic IR simulations revealed the correspondence between the gauche conformer on the S0 state and the measured IR spectra. Furthermore, Franck–Condon analysis confirmed that most peaks in the VUV-MATI spectrum are attributed to the adiabatic ionic transitions between the neutral gauche and cationic eclipsed conformers in pivaldehyde. Consequently, electron removal from the highest occupied molecular orbital, consisting of the nonbonding orbital of the oxygen atom in pivaldehyde, promoted the formyl-relevant modes in the induced cationic eclipsed conformer.

1. Introduction

Understanding the conformational structure of a polyatomic molecule is essential for elucidating the unique chemical reactivities of individual conformers and controlling their reaction dynamics, which has emerged as a research hotspot in chemistry [1,2,3,4,5]. However, deciphering the contribution of each conformation in the congested vibrational spectrum of the molecule is considerably challenging, because the conformers manifest comparable force fields between their atoms. Because of a low energy barrier, the conformers can be easily interconverted via rotation along a single bond between the carbons. Consequently, this process facilitates equilibration between all the conformers even at low temperature, resulting in limited conformer isolation. Therefore, the preparation of molecules with a specific conformation has been a persistent challenge [3]. Despite these difficulties, enabled by the technological advancements in ion spectroscopy, researchers have recently been successful in isolating a conformer in a molecule in exploring the conformer-specific photodissociation dynamics. For instance, Kim et al. observed conformer-specific photodissociation pathways for gauche and anti conformers in 1-iodopropane cation, which were directly generated using the vacuum ultraviolet mass-analyzed threshold ionization (VUV-MATI) spectroscopy [4]. In addition, Suits et al. combined photoelectron imaging with resonance-enhanced multiphoton ionization (REMPI-PEI) to elucidate the individual photodissociation dynamics for cis and gauche conformers in propanal cation [5]. Generally, these techniques involve adiabatic cooling of molecules, achieved via supersonic expansion, assuming the absence of the non-equilibrium kinetic effect [6]. Therefore, the molecular beam condition ensures that the molecules preferably populate the conformational and the vibrational ground states, because the populations depend on the Boltzmann distribution according to the vibrational temperature, which ultimately simplifies the conformational complexity.
In contrast, the REMPI-PEI technique is used to prepare the selected conformational or vibrational cations using multiphoton excitation via an intermediate state. Overall, an accurate characterization of the intermediate state is essential for selecting a molecular cation with a specific ionic state. However, in many non-aromatic molecular systems, the intermediate state either undergoes rapid internal conversion or is not clearly identified, thereby resulting in REMPI and corresponding photoelectron spectra with highly complicated features. In comparison, the VUV-MATI technique can generate molecular cations in either a specific conformation, vibrational state, or both, through direct transition from the neutral ground (S0) state to a Rydberg state converging to the ionic (D0) state without an intermediate state. As demonstrated, this technique facilitates the exploration of conformational structures of polyatomic cations by circumventing the structural complexity emerging from the veiled intermediate state in the multiphoton ionization process [7,8,9,10,11,12,13].
As such, the conformation corresponding to the peaks observed in the vibrational spectra can be identified by conducting Franck–Condon (FC) simulations based on the constructed potential energy surfaces associated with conformational interconversion. Similar investigations have revealed that molecules with sufficiently low energy barriers for conformational interconversion exist in thermal equilibrium even at low temperatures [7,8,10,11,12], whereas conformers with a high interconversion energy barrier retain their original composition during adiabatic cooling [9,13]. Thus, to understand the conformational stability of structures in the former case, further investigation is required on the conformational population depending on vibrational temperature. Nevertheless, deciphering the contribution of each conformer in the congested VUV-MATI spectrum of a polyatomic molecule is a challenging task owing to the presence of comparable force fields in the conformers. In this regard, certain alternative approaches, e.g., hole-burning and IR depletion spectroscopy methods, have been invented to characterize the structures of individual conformers [14,15]. In particular, these techniques exploit the principle that the excitation of a specific conformer in the ground state using a nanosecond pump laser irradiation can instantly reduce the population of its initial states.
Moreover, the repopulation of the specific conformation in equilibrium promotes the development of various laser double-resonance spectroscopic techniques, including UV–UV hole burning, IR–UV hole burning, and IR ion-dip spectroscopies, which primarily focuses on the van der Waals complexes in the chromophore systems to adopt the REMPI scheme [16,17,18,19]. The subsequent efforts for analyzing the aliphatic molecules with extremely short lifetime in the excited electronic state motivated the development of the IR–VUV double-resonance techniques, despite the occasional emergence of uncontrollable fragmentations from excess VUV photon energy at 118 nm [20,21,22]. Extending the conventional laser double-resonance spectroscopic techniques, we recently developed a conformer-specific vibrational spectroscopy technique based on IR-resonant VUV-MATI mass spectroscopy, which can measure the identifiable vibrational spectra of individual conformers of a molecule in both S0 and D0 states [23]. As demonstrated, the newly invented techniques adopting the cold and collision-free environment of supersonic expansion can effectively elucidate the vibrational structures of individual conformers in both S0 and D0 states beyond the population redistribution [24].
Simple aliphatic aldehydes such as propanal and isobutanal, bearing one more methyl group on α-carbon, have garnered considerable research attention owing to their significance as key intermediates of molecular evolution in relevant astrochemical systems [25,26,27]. Since the stable conformations and the relative stabilities of these aldehydes are affected by formyl torsion, they have emerged as a stepping stone to understanding the astrochemical evolution of cold molecular clouds in peptide formation [8,10,28,29,30]. Suits et al. reported the conformational- and vibrational-selected photoion and photoelectron imaging studies of propanal [28] and isobutanal [30], wherein the adiabatic ionization energies (AIEs) were determined for each conformer in these aldehydes. The results suggested that the gauche conformer with CCCO dihedral angle of ~119° on the D0 state of propanal is slightly more stable—by only 65 cm−1—than the cis conformer with CCCO in planar, which reverses the conformational preference on the S0 state. Furthermore, they attributed a unique peak observed in the photoelectron spectrum of isobutanal to the trans conformer cation, which was less stable than the gauche conformer in the S0 state.
The subsequent investigations regarding the AIEs and conformational structures of two aldehydes were performed by utilizing the VUV-MATI techniques adopting the one-photon scheme, which can directly investigate the intrinsic conformer-specific photoionization dynamics. Notably, the AIEs and cationic structures of the stable individual conformers in the propanal [29] and isobutanal [8,10] can be accurately deduced from the high-resolution (HR) VUV-MATI spectra.
Kim et al. determined the AIEs of the cis and gauche conformers in propanal to be 9.9997 ± 0.0006 and 9.9516 ± 0.0006 eV, respectively, which produced the stabilization energy difference (94 cm−1) of the gauche and cis conformers in the D0 state. This finding was supported by the density functional theory (DFT) calculation for the S0 state that indicated the cis conformer as more stable (by ~294 cm−1) than the gauche conformer [29]. Lee et al. measured the VUV-MATI spectra of isobutanal under various molecular beam conditions involving several carrier gases and identified the peaks corresponding to the adiabatic ionic transitions of individual conformers (gauche and trans) with AIEs of 9.7398 ± 0.0004 eV and 9.6878 ± 0.0004 eV, respectively [8]. In addition, they accurately determined that the gauche conformer is more stable by 162 ± 50 cm−1 than the trans conformer in the S0 state, whereas the trans conformer is more stable by 262 ± 50 cm−1 than the gauche conformer in the D0 state. Subsequently, the HR conformer-specific vibrational spectrum of the cationic gauche conformer was acquired through conformationally effective cooling with Ar carrier gas. Based on the measured VUV-MATI spectrum of a pure gauche conformer, its cationic structure can be precisely determined by adopting the FC fitting method, which reveals that the promotions of the formyl torsion and CC stretching in the measured spectrum can be attributed to a unique ionization-induced transformation in the conformational structure.
Investigating the effects of formyl torsion on the conformational structures and photoionization dynamics of pivaldehyde with three methyl groups on α-carbon will enable its comparative analyses with those of propanal and isobutanal. As pivaldehyde is emitted from vehicle exhausts and industrial sources associated with the oxidation of volatile organic compounds, it produces an acyl radical by the abstraction of the aldehydic H atom with OH radical, and therefore, is vital for atmospheric chemistry. More importantly, identifying the stable conformation of pivaldehyde is a prerequisite for understanding the conformer-specific reactivity at molecular level. Thus, to elucidate the conformational structures and their conformer-specific photoionization dynamics, this study performed IR-resonant VUV-MATI spectroscopy of pivaldehyde and constructed the two-dimensional potential energy surfaces (2D PESs) associated with the conformational transformations in the S0 and D0 states. Ultimately, this research aims to provide insights into conformational preference in terms of hyperconjugations between the methyl group(s) and formyl group in an aliphatic aldehyde.

2. Results and Discussion

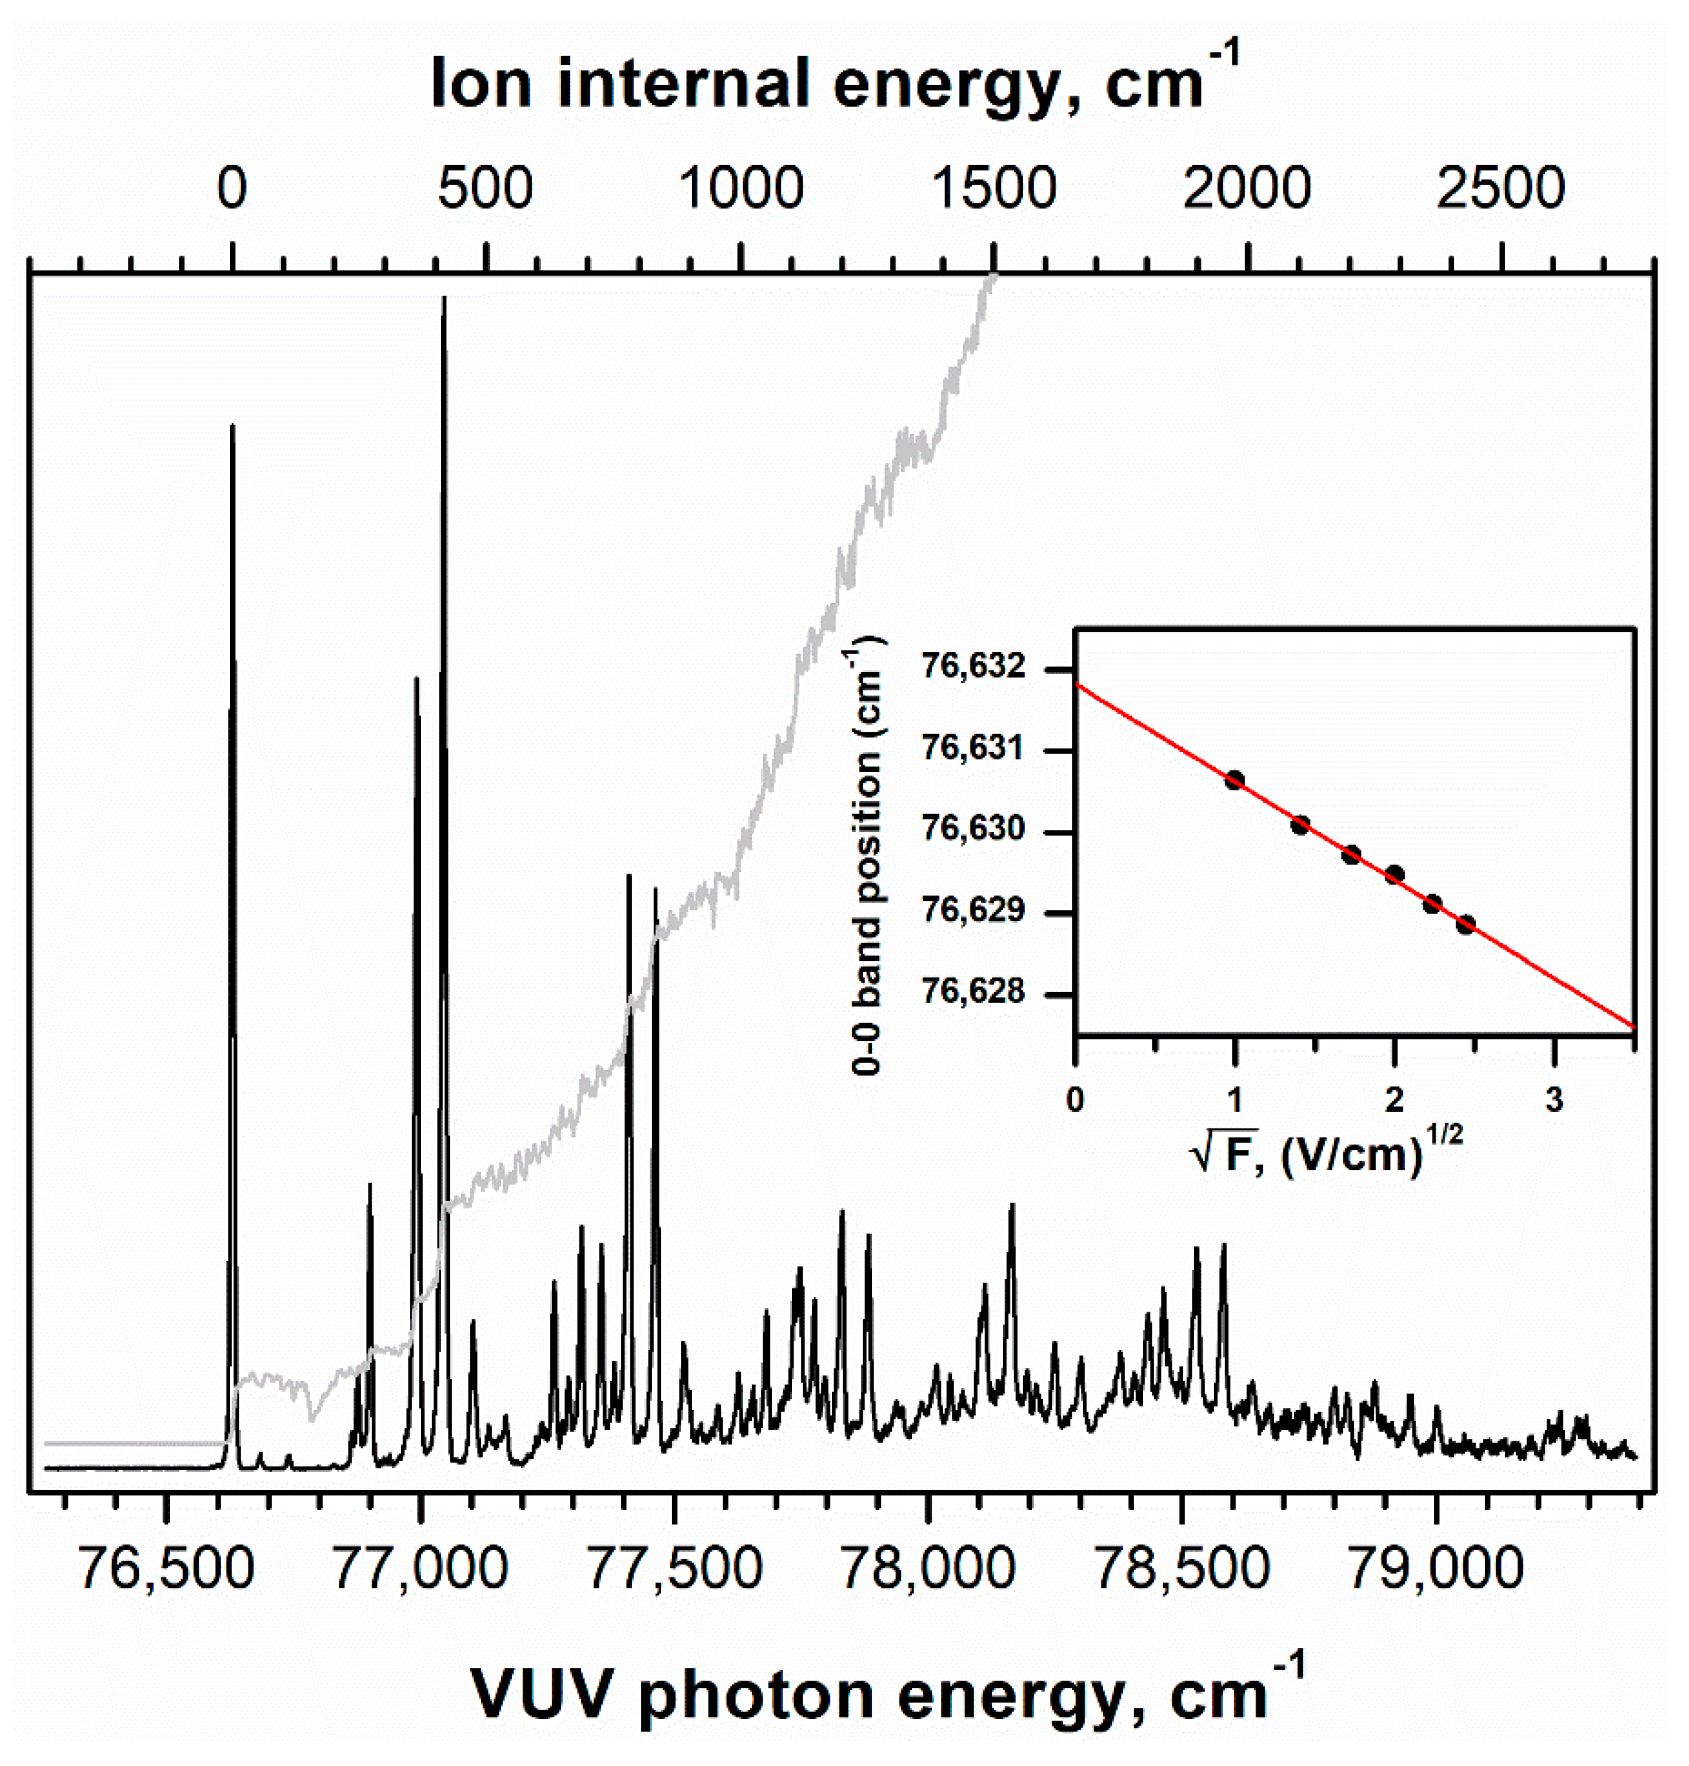
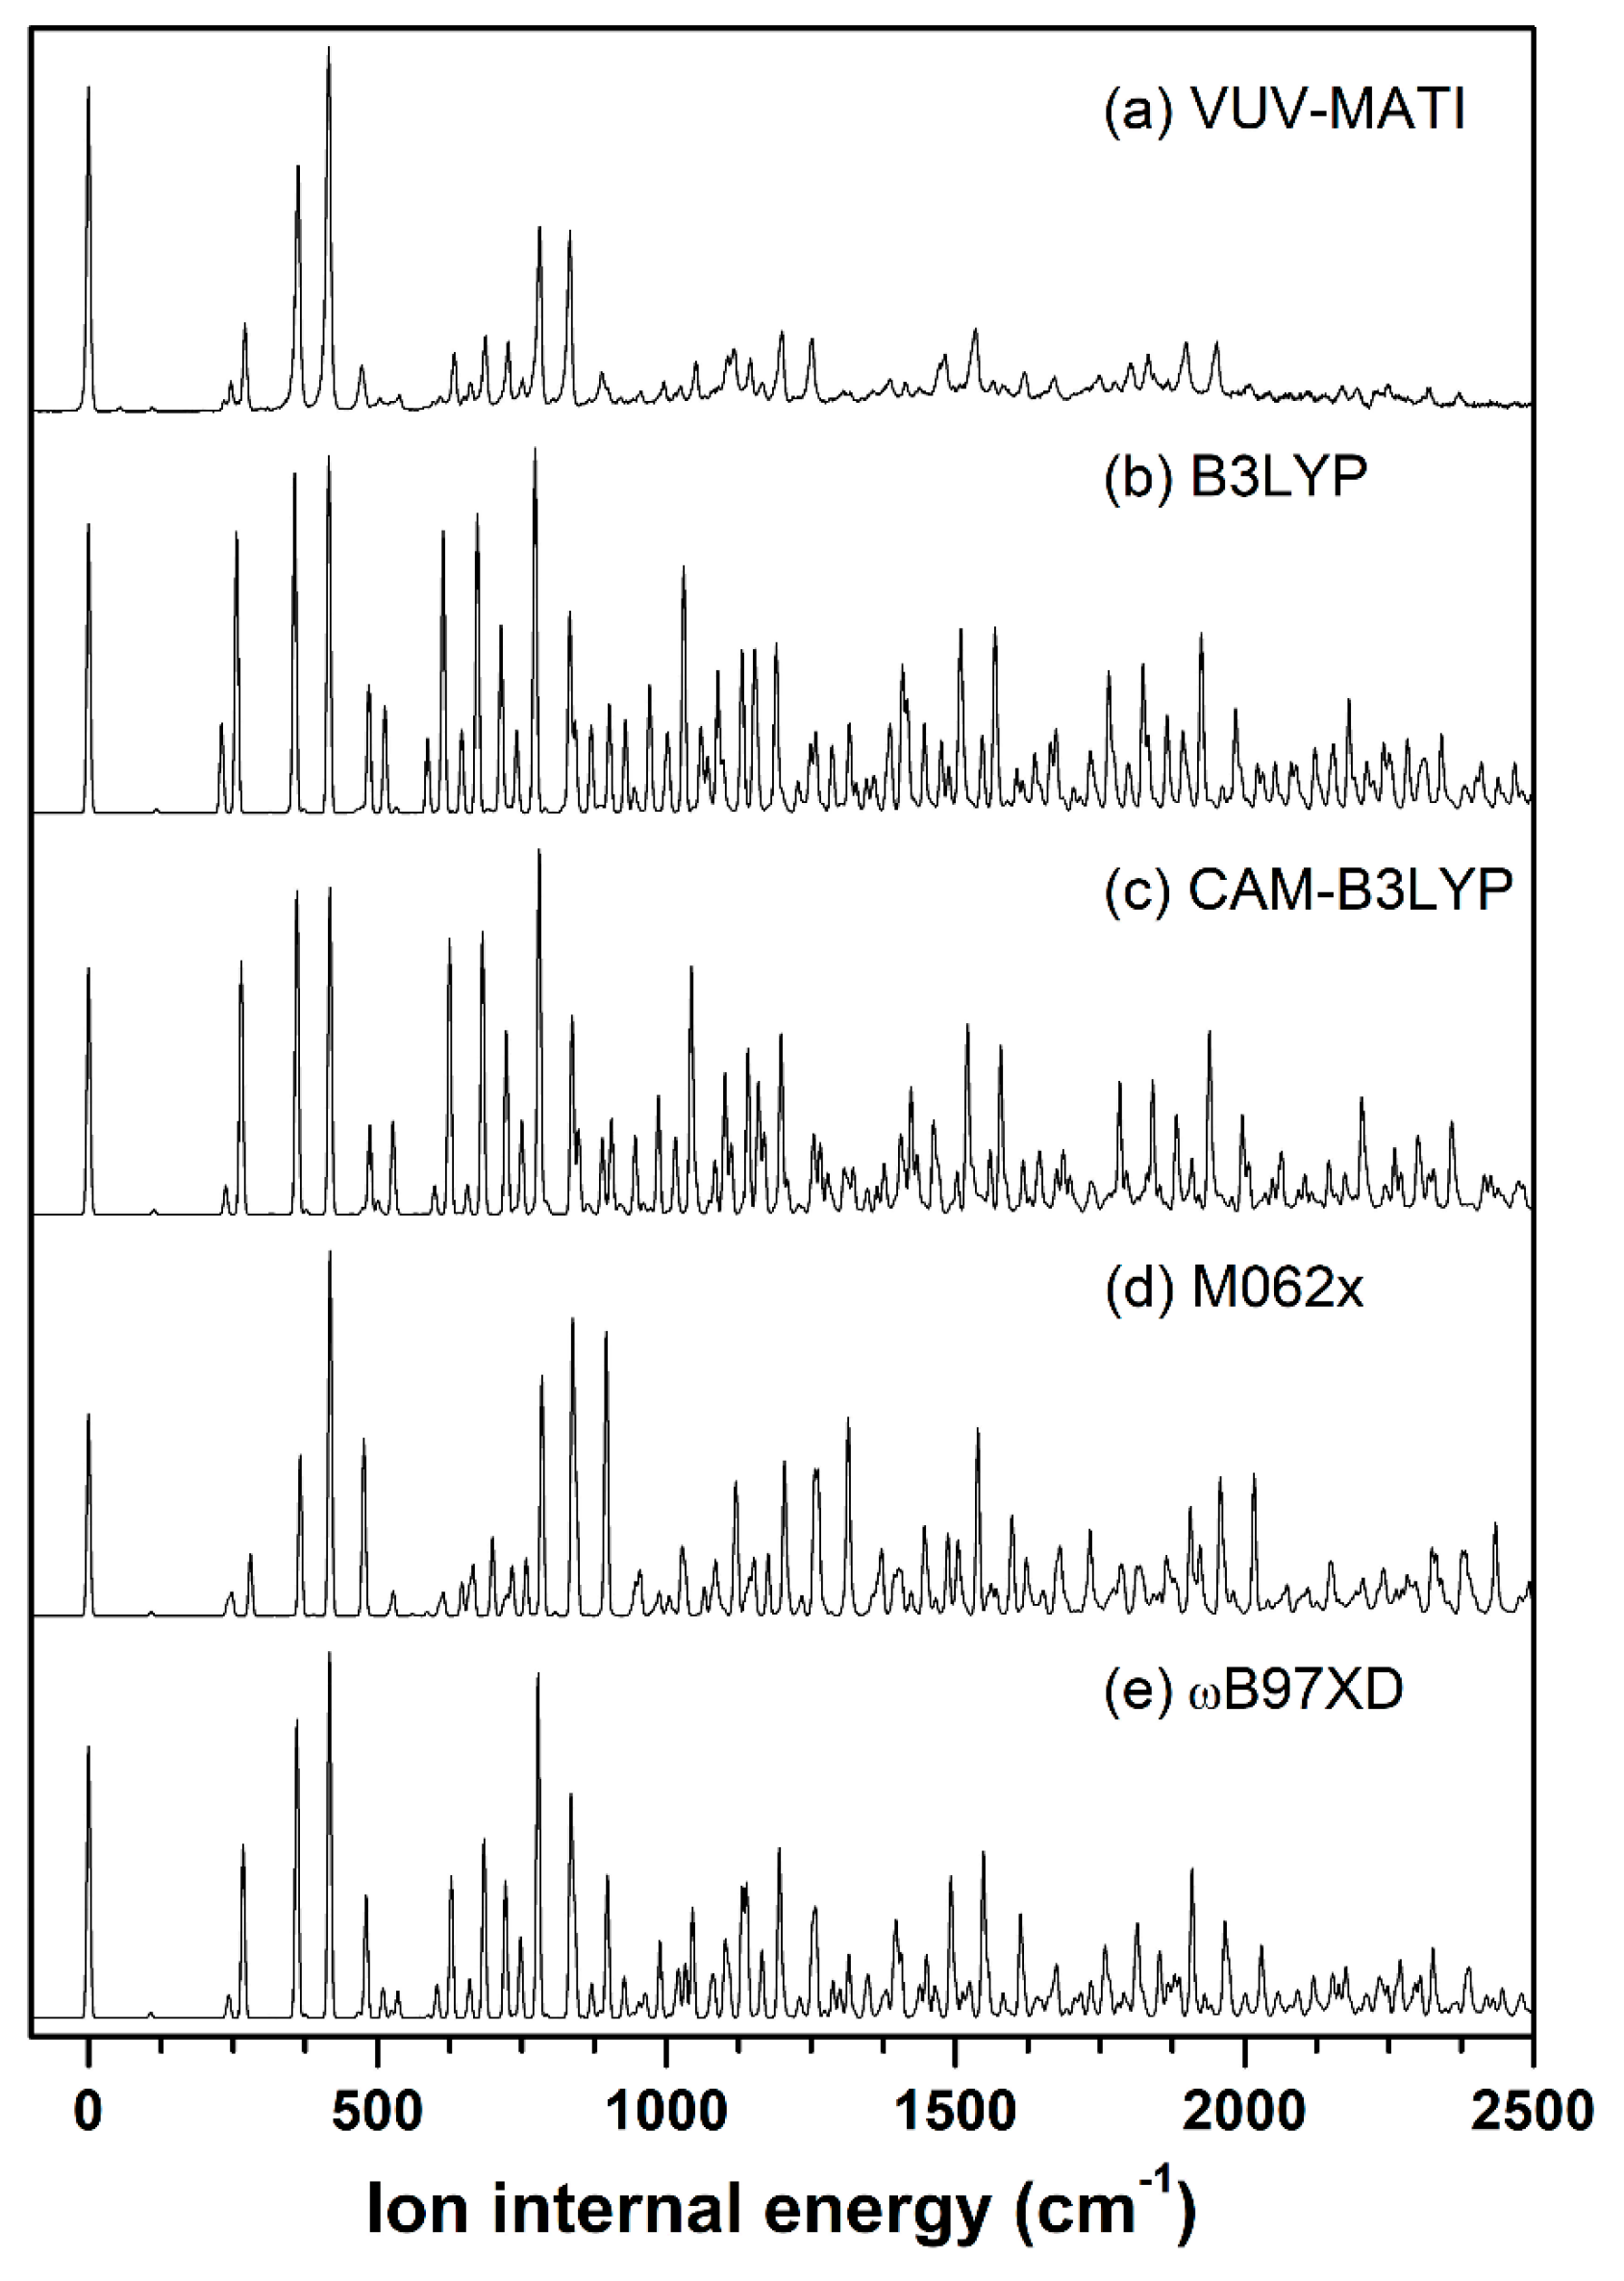
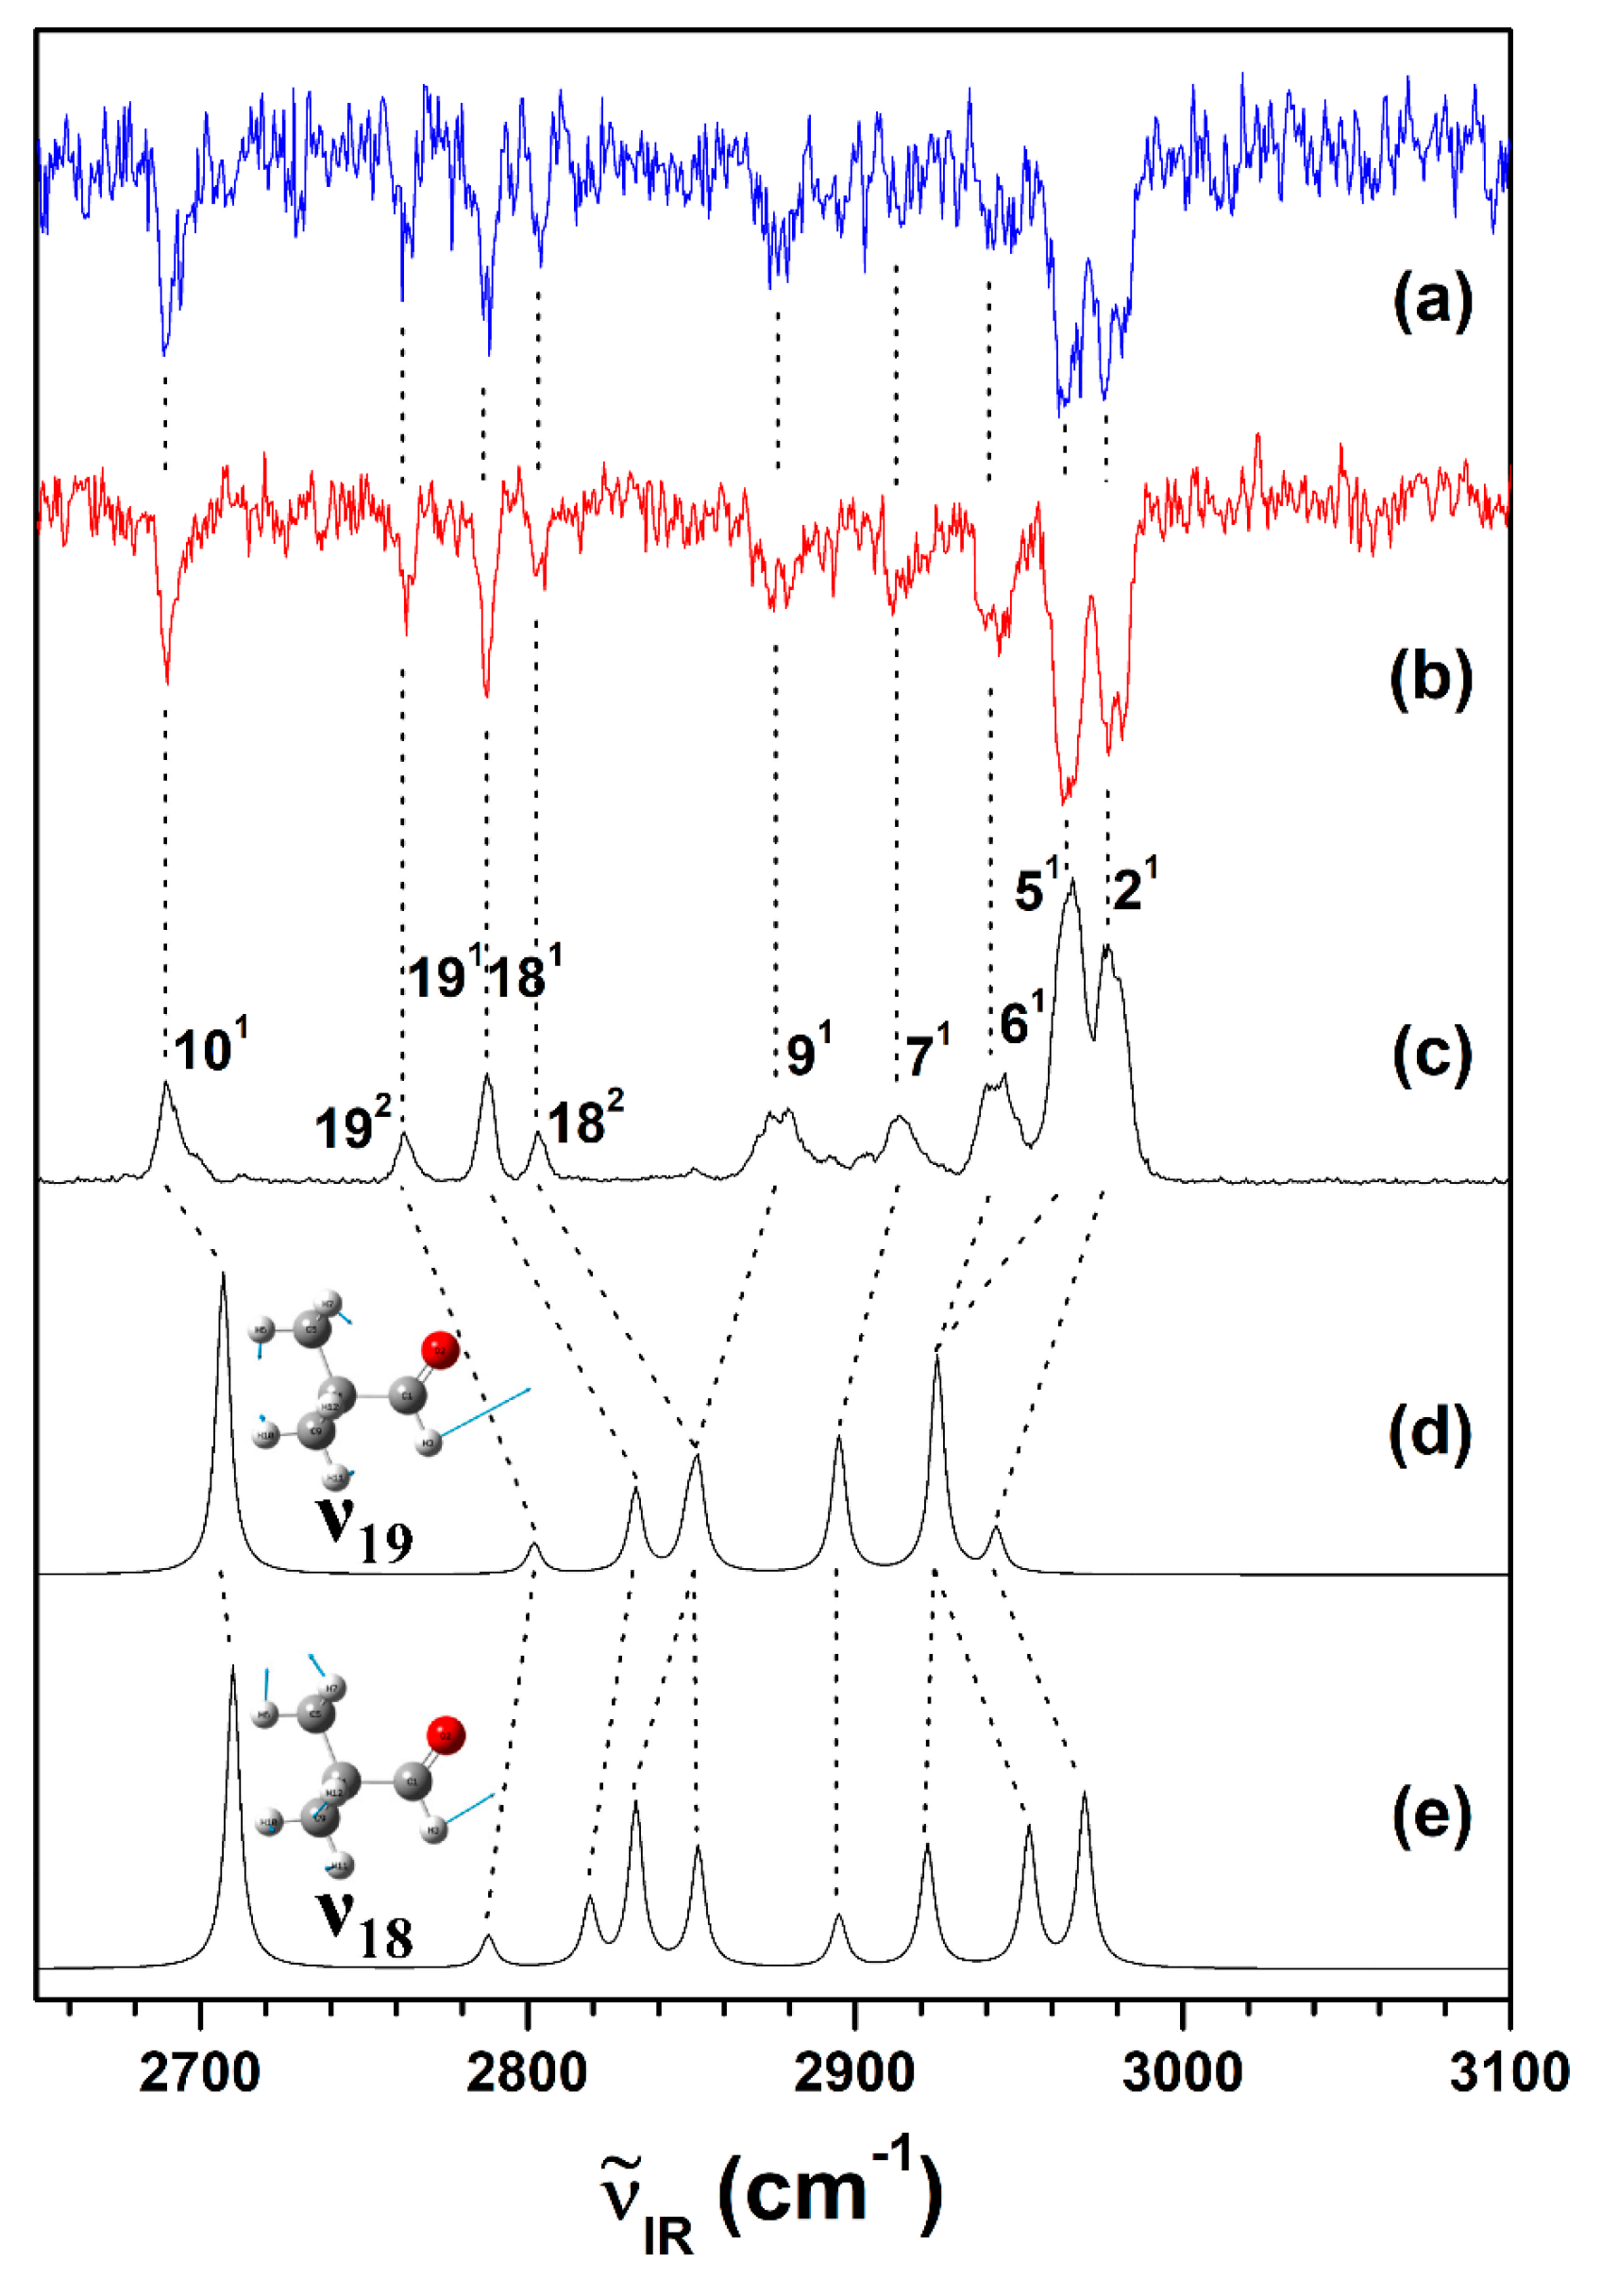
2.1. Conformer-Specific Photoionization of Pivaldehyde

To determine the ionization onset corresponding to the AIE value of the molecule, the delayed VUV-photoionization efficiency (PIE) curve of pivaldehyde was obtained by utilizing the pulsing scheme for the HR mode with the newly installed ion-source assembly [31]. The ionization onset was determined at ~76,626 cm−1, as denoted by the solid-gray line in Figure 1. Interestingly, several ascending steps appear above ~76,988 cm−1, indicating the possibilities of the onset of either another conformer, the favored FC transitions to low-frequency vibrational modes in the D0 state, as observed in the cases of propanal [29] and isobutanal [8], or both. To confirm these possibilities, the HR VUV-MATI spectrum of pivaldehyde was measured under the supersonic expansion condition (described in the Experimental Methods section) to eliminate any confusion with the hot bands and mostly populate the conformational and vibrational ground state, as illustrated in Figure 1.
Apparently, the extremely intense peak appearing at 76,629 cm−1 in the VUV-MATI spectrum can be assigned to the 0–0 band of pivaldehyde, which corresponds to the adiabatic ionic transition between the neutral and cationic molecules in the vibrational ground states. However, upon ionizing the molecules in the zero-kinetic-energy (ZEKE) states situated at several cm−1 below the ionization threshold by the pulsed field ionization (PFI) field of 3.5 V cm−1 [31], the accurate AIE could be obtained by adjusting the PFI field to the zero-field limit, as depicted in the inset of Figure 1. Therefore, the AIE of pivaldehyde was determined to be 9.5012 ± 0.0004 eV (76,632 ± 3 cm−1), which is marginally higher but more accurate than the AIE value of 76,625 ± 6 cm−1 determined by one-photon MATI spectroscopy [32].
Notably, the AIE value determined herein is substantially less than the AIE values of the gauche and trans conformers in isobutanal [8], because the additional methyl group on the α-carbon of pivaldehyde is expected to increase the electron density of the formyl group.
To ascertain information regarding the conformation corresponding to the measured AIE, the 2D PESs associated with the conformational variations occurring along the interconversion coordinates in the S0 and D0 states were constructed at the ωB97XD/cc-pVTZ level, as portrayed in Figure 2. The calculations were performed by optimizing the remaining geometric parameters, excluding two dihedral angles that were selected as the interconversion coordinates associated with the two torsional motions—formyl and methyl torsions—corresponding to the conformational interconversion of pivaldehyde.
Unexpectedly, the constructed 2D PESs displayed that only the eclipsed conformer with CS symmetry in pivaldehyde was located at the global minima on both states, whereas the staggered conformations such as cis or trans for propanal or isobutanal were located at the saddle point. Furthermore, the barrier height of 523 cm−1 for the formyl torsion in the S0 state, which is in agreement with the value of 385 cm−1 determined from microwave spectroscopy [33], was reduced to 425 cm−1 in the D0 state, implying that the formyl torsions in both states may involve a three-fold internal rotation potential. In contrast, the barrier height of 999 cm−1 in the S0 state for methyl torsion increased to 1268 cm−1 in the D0 state. The methyl torsions in both states can be described based on the harmonic potential instead of the internal rotation potential. This finding suggests that the variations in these barrier heights after ionization are primarily affected by the interactions between the staggered methyl hydrogens and the lone-pair electrons on the oxygen atom in the formyl group. This is further discussed based on comparison with the natural-bond orbital (NBO) analyses of the highest occupied molecular orbital (HOMO) and singly occupied molecular orbital (SOMO) for the neutral and cationic pivaldehyde.
Overall, the measured AIE value corresponded to the adiabatic ionization transition between the neutral and cationic eclipsed conformers with CS symmetry in the vibrational ground states. In addition, the AIE evaluated for the CS conformation with zero-point energy correction was 74,632 cm−1, which is comparable to the measured AIE value, considering the employed calculation level. Therefore, most peaks appearing in the measured MATI spectrum corresponded to the vibrational modes of the cationic eclipsed conformer with CS symmetry.

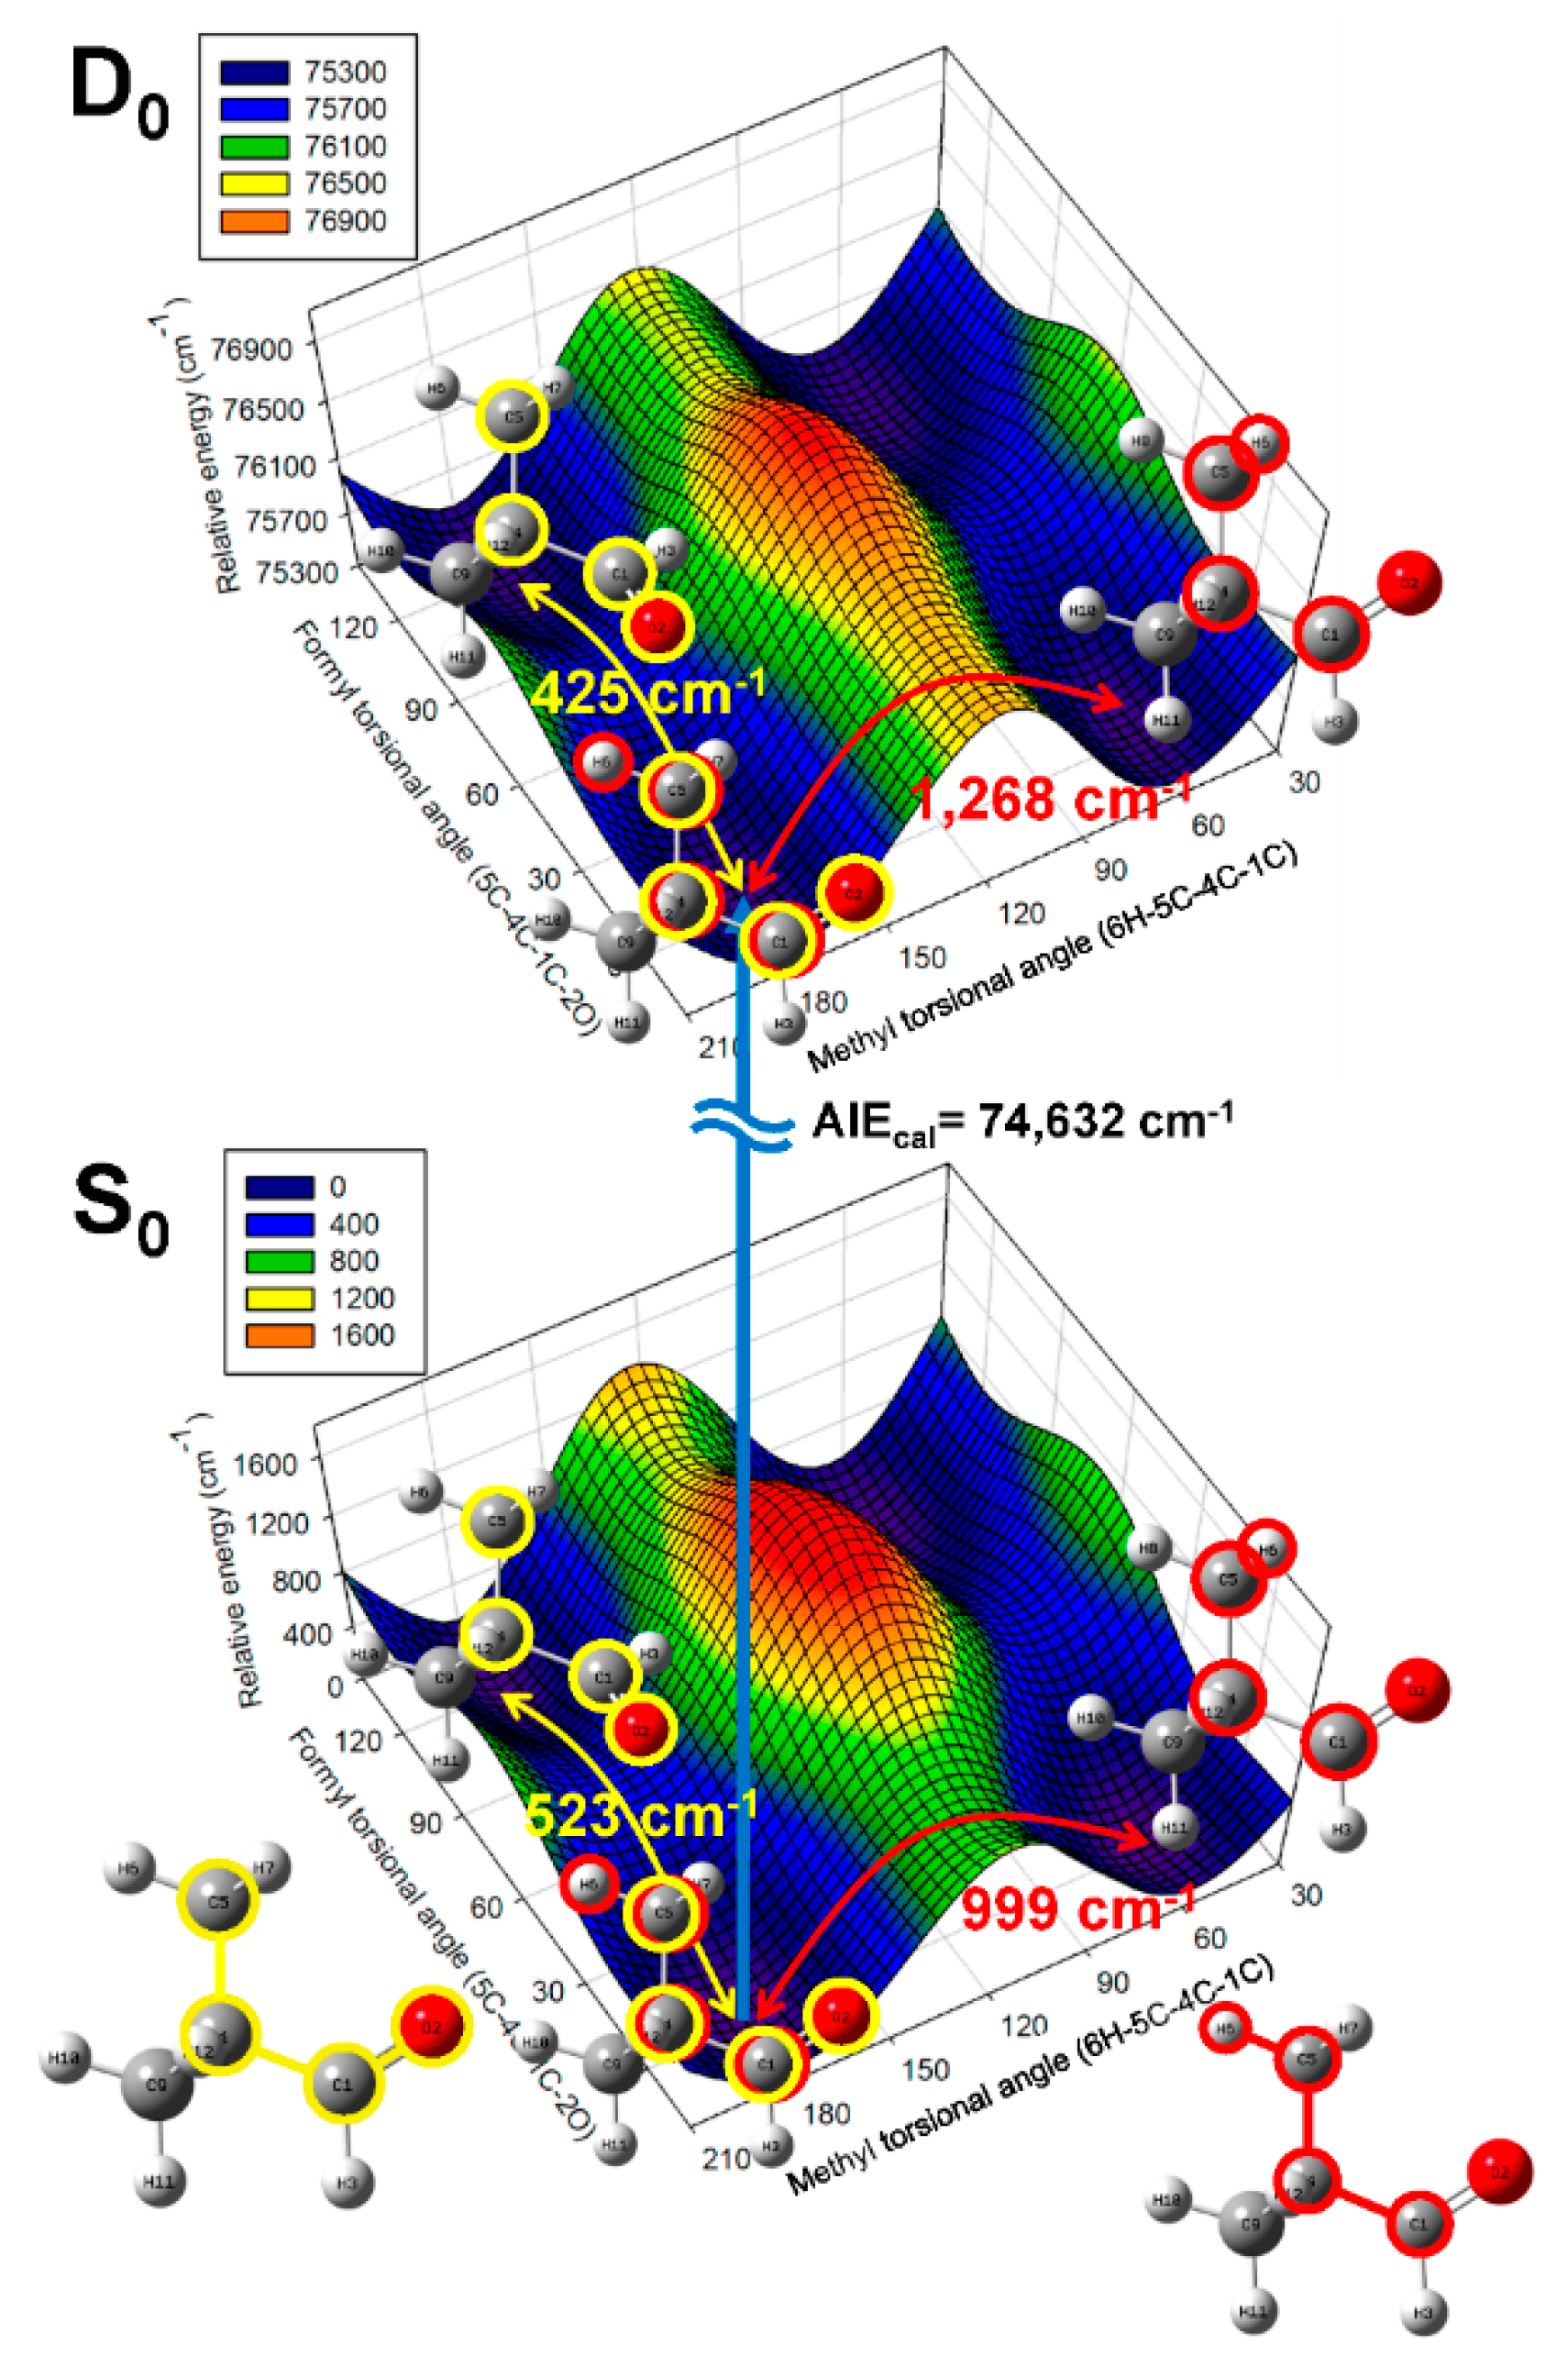
2.2. Conformational Structure of Neutral Pivaldehyde

In general, the VUV-MATI spectrum essentially measures the adiabatic ionic transitions between the neutral and cationic states, and it is affected by the geometric variations induced upon ionization. With respect to the neutral geometry, the extent of variation in the cationic geometry can be determined using FC analysis. Thus, we evaluated the vibrational frequencies for neutral and cationic eclipsed conformers in pivaldehyde based on the geometries optimized at various density functionals with the cc-pVTZ basis set. Thereafter, the FC factors for adiabatic transitions from the vibrational ground state of the neutral to the individual vibrational states of the cation were calculated based on the evaluated normal-mode eigenvectors of the optimized geometries in both states. Moreover, the vibrational spectra of the cation simulated using the calculated FC factors and vibrational frequencies were compared with the VUV-MATI spectrum, as presented in Figure 3. At first glance, the entire simulated spectra shown in Figure 3b–e appear comparable to the VUV-MATI spectrum shown in Figure 3a, excluding the peaks with low internal energy of ions, corresponding to the cationic vibrational frequency estimated by selecting the 0–0 band position as origin. This comparability indicates the presence of a small vibronic coupling between the ion core and an electron in the high-lying Rydberg state.
Furthermore, the measured MATI spectrum is related to the vibrational spectrum of the cationic eclipsed conformer, as predicted above. In particular, the FC factors and frequencies evaluated for the main adiabatic transitions in the simulated spectrum at ωB97XD/cc-pVTZ level (Figure 3e) were most comparable to their experimental counterparts for the prominent peaks located at 270, 363, 416, 632, 685, and 726 cm−1 in the MATI spectrum (Figure 3a). Accordingly, the frequencies and corresponding FC factors are listed in Table 1, including the ion internal energies of the experimental peaks, the intensities normalized by the most intense peak at 416 cm−1, and the frequencies of the neutral pivaldehyde determined by IR spectroscopy [34,35]. A careful comparison of these results implied that the FC factor was zero for the weak but distinct peak at 55 cm−1 on the MATI spectrum. This is because the related vibrational mode is due to formyl torsion, which is non-totally symmetric with CS symmetry, and it facilitated transitions for the vibrations only with even quanta. In reality, all the formyl torsional vibrations appeared at 55, 110, and 166 cm−1 in the MATI spectrum.
Moreover, other non-totally symmetric vibrations—under methyl torsion and bending for the cation with CS symmetry—produced distinct peaks at 199 and 309 cm−1, respectively, in the measured spectrum. Generally, these appearances of non-totally symmetric vibrational modes for the cation may be caused by the breakdown of the CS symmetry to the C1 symmetry. Surprisingly, the O–C–C–C dihedral angle between the experimental parameters of the neutral molecule was 2.1° (Table 2), determined using microwave spectroscopy [36], which was different from the calculated value of 0°; this indicates a gauche conformation. This finding implies that the appearances of the unexpected vibrational modes may be attributed to the inaccuracy in the neutral geometry calculated at the global minimum, unlike that in general cases [7,10,12,13], where the insufficient configuration interaction in the DFT calculations produces inaccuracies primarily in the cationic geometry of the open-shell system.
To verify the inaccurate evaluation of the conformational geometry in the global minimum on the S0 state, the eclipsed and gauche geometries with 2O–1C–4C–5C dihedral angles of 0.0° and 2.1°, respectively, in the S0 state, were obtained by optimizing the remaining geometric parameters at the ωB97XD/cc-pVTZ level, as described in Table 2. As observed, all the geometric parameters evaluated for two conformations in the S0 state were consistent with the experimental results obtained using microwave spectroscopy [36], except for only the difference in the 2O–1C–4C–5C dihedral angle. Furthermore, the energy difference between the eclipsed and gauche geometries with zero-point energy correction was only 4 cm−1, implying that the inaccuracy propagated from the energy calculations of the stable conformation of the molecule [37].
To investigate the abovementioned possibility utilizing the IR-resonant VUV-PI scheme, the IR absorption spectrum of gas-phase neutral pivaldehyde was obtained by scanning the frequency of the IR laser pulsed immediately before the VUV laser pulse fixed at 76,529 cm−1 below the ionization thresholds, as depicted in Figure 4c. More importantly, the conformer-specific vibrational spectra of the neutral pivaldehyde (i.e., the IR-dip VUV-MATI spectra) were recorded by monitoring two of the most intense peaks (76,629 and 77,045 cm−1) observed in the VUV-MATI spectra during scanning the frequency of the IR laser pulsating 5 ns in advance. This approach aimed to confirm that all the vibrational peaks observed in the measured IR absorption spectrum of pivaldehyde correspond to the single conformation, as discussed in the previous section.
Notably, the two IR-dip VUV-MATI spectra (Figure 4a,b) were identical to the IR absorption spectrum (Figure 4c), and they were expected as a proxy for the vibrational spectrum of the stable conformer(s) in the neutral pivaldehyde, implying that the IR absorption and VUV-MATI spectra represent the vibrational spectra of only the single conformation in the neutral and cationic pivaldehyde, respectively. To inspect the symmetry between CS (eclipsed conformation) and C1 (gauche conformation) of the neutral conformer, the IR spectra of the two conformations—eclipsed and gauche—in the S0 state were simulated with the harmonic vibrational frequencies calculated from two geometries at ωB97XD /cc-pVTZ level. However, the IR spectra of the two conformers (not presented in this study) varied from the experimental spectra (Figure 4a–c), because the Fermi resonance-related splitting peaks were observed as an aldehyde, and by borrowing the high intensity of the formyl stretching mode, either the overtones, the combination mode of the formyl bends, or in combination, appeared in the IR spectrum [38].
To represent Fermi resonance in the formyl stretching vibration region of pivaldehyde, the anharmonic vibrational frequencies were evaluated from the optimized eclipsed and the fitted gauche conformers in the S0 state and utilized in simulating the IR spectra, as depicted in Figure 4d,e, respectively. Remarkably, the IR spectrum simulated for the gauche conformer in neutral pivaldehyde (Figure 4e) is reasonably more comparable to the experimental IR spectrum than that (Figure 4d) for the eclipsed conformer, because 182 and 91 along with 61 and 51 can be identifiably distinguished in the calculated spectrum. Based on the simulated IR spectrum of the gauche conformer most consistent with the experimental spectra, the peaks observed in the IR spectra of the neutral pivaldehyde could be successfully assigned to the vibrational modes characterizing the formyl C–H stretching fundamental vibrations including the overtones and combinations of the formyl C-H bends along the vibrational frequencies measured by IR spectroscopy, as listed in Table 3 [34]. These findings revealed that the forbidden overtones and combination of the two formyl C-H bending modes (19 and 18) were promoted by the Fermi-resonance-related splitting with formyl C-H stretching vibration (101).

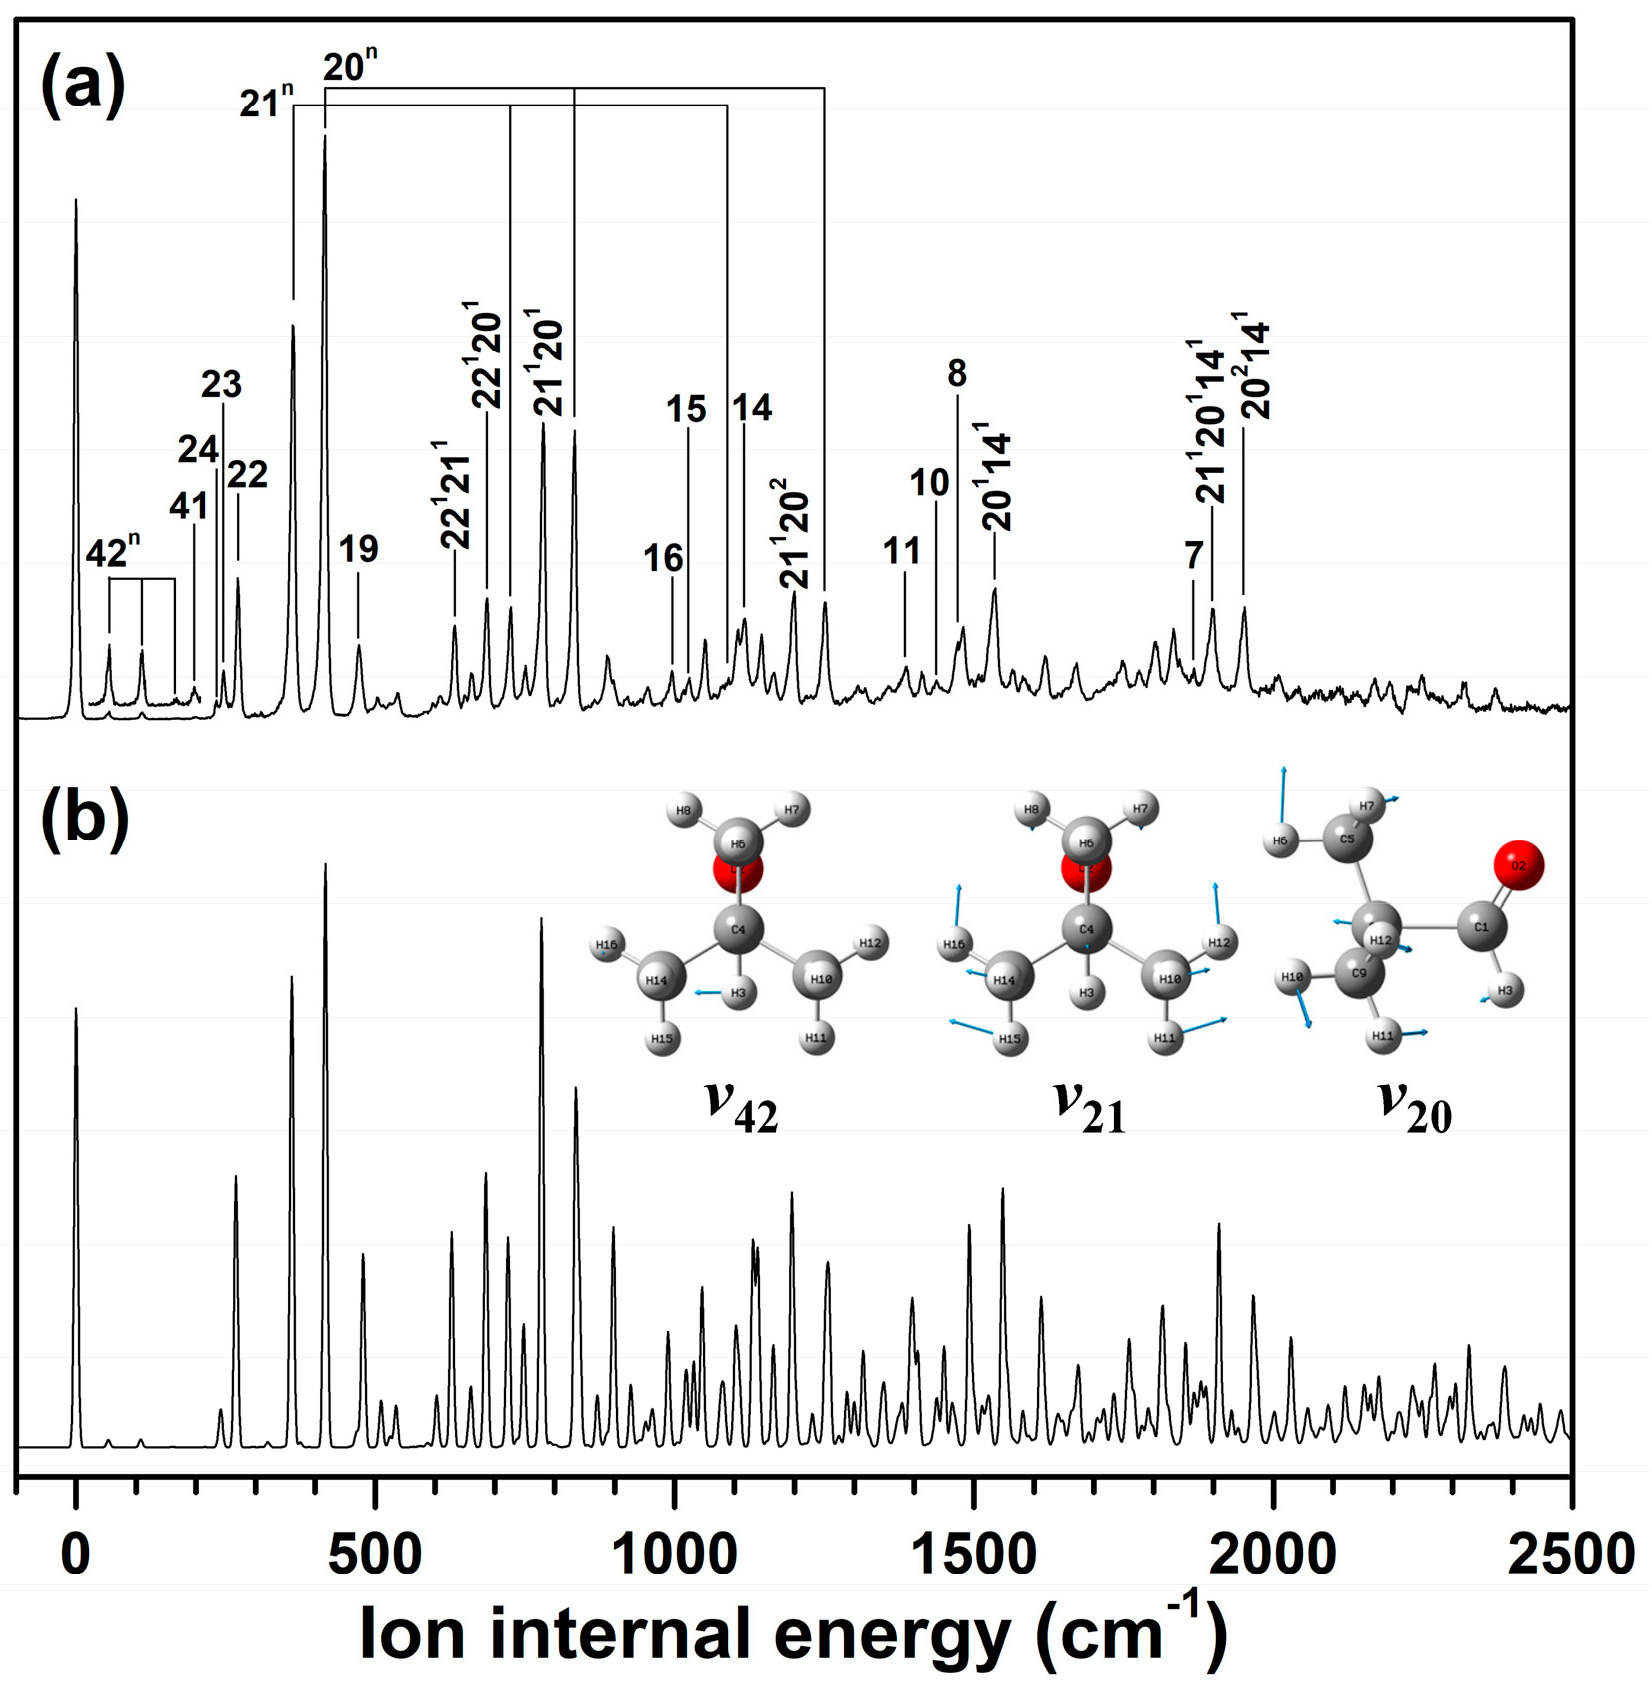
2.3. Cationic Structure of Pivaldehyde

Observably, the measured VUV-MATI spectrum covered the adiabatic ionic transitions of the gauche conformer in the neutral pivaldehyde. Thus, for the individual vibronic transitions between the neutral gauche and cationic eclipsed conformers, the FC factors were estimated assuming the correct geometry in the D0 state. Thereafter, the vibrational spectrum of the cation was simulated based on the evaluated FC factors and the vibrational frequencies of the cation (Figure 5b) for comparison with the MATI spectrum (Figure 5a). As such, the simulated spectrum was comparable to the VUV-MATI spectrum in quantitative terms, implying that the cationic eclipsed conformer can be induced by the electron removal from the HOMO of the neutral gauche conformer.
Accordingly, the calculated frequencies and corresponding FC factors for the cationic eclipsed conformer are listed in Table 1, including the vibrational frequencies corresponding to each peak in the MATI spectrum and the intensities normalized by the most intense peak at 416 cm−1. Based on the FC analysis with the simulated spectrum (Figure 5b), the vibrational assignment of the VUV-MATI spectrum of the gauche conformer in pivaldehyde could be accomplished. In brief, the intense peaks at 363 and 416 cm−1 with normalized intensities of 0.676 and 1.000 could be assigned to 211 and 201 related to the skeletal bends of the methyl groups incorporating the 1C–4C bond and 1C–4C–9(13)C bond angles, respectively. Moreover, these bond angles are consistent with their calculated frequencies (361 and 417 cm−1) and FC factors (0.815 and 1.000), respectively. These two strongly promoted vibrational modes can be attributed to the ionization-induced geometric variations and they produce overtones and combinations with other fundamental vibrational modes. Furthermore, the prominent vibrational peak at 270 cm−1 with an intensity of 0.242 was assigned to 221, which is associated with the methyl torsional mode.
Based on rigorous vibrational assignment, these spectral features were caused by the elongation of the 1C–4C bond and the contractions of the 1C–4C–Cmethyl and 2O–1C–4C bond angles as well as the 2O–1C–4C–5C dihedral angle in the cationic eclipsed conformation induced upon ionization with respect to the neutral gauche conformer. This is further discussed in the subsequent section from the perspective of NBO analysis. Accordingly, all the formyl torsional vibrations in the cationic state allowed in the MATI spectrum occurred due to the ionic transitions between the neutral gauche (C1 symmetry) and cationic eclipsed (CS symmetry) conformers. The eigenvectors of the promoted vibrational modes in the cationic state are displayed in Figure 5, and the geometric parameters for the cationic eclipsed conformer are listed in Table 2.

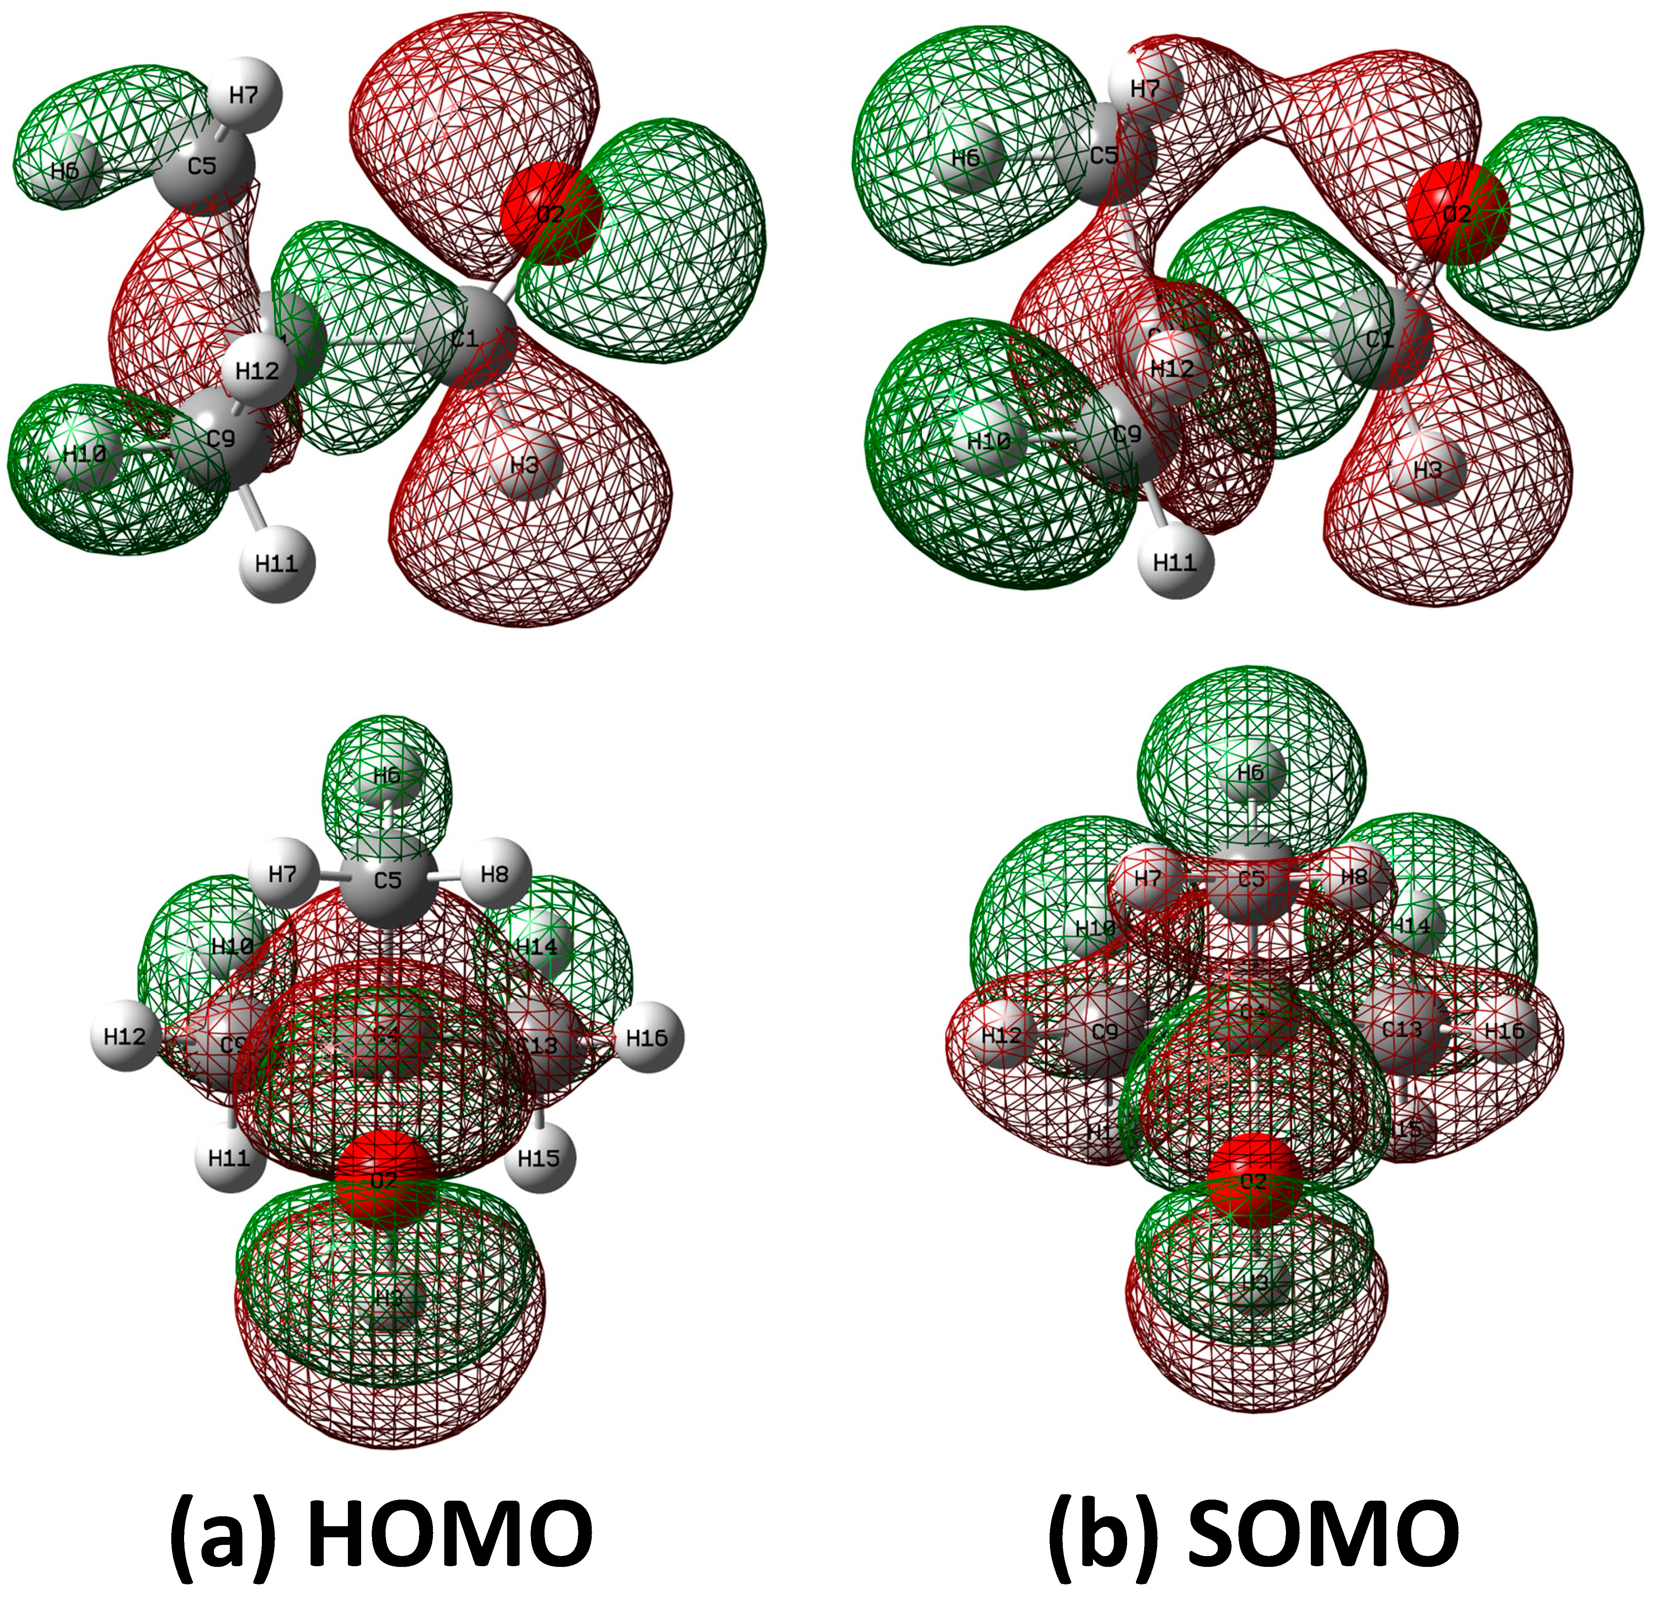
2.4. HOMO and SOMO of Pivaldehyde

The NBO analysis considers all interactions between the donor and acceptor NBOs to estimate the stabilization energy based on the hyperconjugation effect, which is closely related to the conformational preference in the S0 and D0 states. Accordingly, the NBO analyses on the HOMO of the neutral gauche conformer and SOMO of the cationic eclipsed conformer in pivaldehyde were performed at the ωB97XD/cc-pVTZ level. The results shown in Figure 6 indicate that the HOMO contains the lone-pair p-orbital on the oxygen atom of the formyl group interacting with σ-orbitals in the molecular plane. However, the SOMO generated by the adiabatic ionization of the neutral gauche conformer signified that the partially filled lone-pair p-orbital of the oxygen atom interacted with the σ-orbitals in the methyl group predominantly via the hyperconjugation effect to maximize charge delocalization. This created an eclipsed formyl group with a methyl group by altering the 2O–1C–4C–5C dihedral angle to zero. This phenomenon is similar to the NBO analysis results indicating the conformational preference between the cationic gauche and trans conformers in isobutanal [8].
Moreover, the vibrational modes related to the methyl and formyl torsional motions were commonly promoted after the ionization of the gauche pivaldehyde in the S0 state, which resulted from the charge-delocalized structure of the eclipsed pivaldehyde in the D0 state. Furthermore, this finding supports the fact that the adiabatic ionization-induced charge delocalization on the SOMO further diminishes the AIE of the gauche conformer in pivaldehyde compared to those in propanal and isobutanal, as discussed earlier.

3. Materials and Methods

3.1. Experimental Methods

In this study, we performed IR-resonant VUV-MATI spectroscopy using the home-built HR VUV-MATI mass spectrometer, and its details were provided in previous studies [23,24,31,39].
Briefly, the coherent and tunable VUV light with a wavelength range of 126.0–131.1 nm was generated by resonant four-wave difference frequency mixing (FWDFM) in Kr-gas cell employing Kr 4p6–5p[1/2]0 or 4p6–5p[5/2]2 transitions, which were alternated to avoid wavevector mismatches with the VUV wavelength. For each transition, the required UV laser pulse at 212.556 or 216.667 nm with ~0.8 mJ/pulse was generated in a beta barium borate crystal, obtained via mixing after the doubling of 637.668 or 650.002 nm light, respectively, from a dye laser (Continuum, ND 6000) pumped by a Nd:YAG laser (Continuum, Surelite II). In addition, visible light with wavelengths ranging from 571.0 to 680.0 or from 623.0 to 700.2 nm with ~10 mJ/pulse from another Nd:YAG laser-pumped dye laser (Lambda Physik, Scanmate 2E) was spatially and temporally overlapped with 212.556-nm or 216.667-nm light. The combined beams were loosely focused in the Kr cell through a fused silica lens (f = 50 cm) to generate the tunable VUV laser pulse. Moreover, the pressure in the Kr cell was optimized at 4–6 Torr to maximize the generation of VUV laser pulses in the given photon energy range. Thereafter, the generated VUV laser pulse was spatially separated from the residual UV and VIS pulses by passing the beam off-center through a MgF2 lens at the exit of the Kr cell. Subsequently, it was introduced into the ion-source assembly in counter-propagation with the molecular beam.
Pivaldehyde was purchased from Sigma-Aldrich and used without further purification. From a reservoir at 298 K, the gaseous sample was supersonically expanded through a pulsed nozzle (diameter: 500 μm, Parker Valve) with the Ar stagnation pressure of 2–6 atm to ensure that most molecules populate the conformational and vibrational ground states [6]. To overlap with the VUV laser pulse within the new ion source, the generated molecular beam was introduced into the ionization chamber through a molecular beam skimmer (diameter: 1 mm, Beam Dynamics) placed ~3 cm downstream from the nozzle orifice. The background pressure in the ionization chamber was normally maintained at ~10−7 Torr when the nozzle was operated at 10 Hz. To remove the direct ions and electrons, a weak spoil field of ~0.2 V cm−1 was applied to the PFI stage. Simultaneously, a slight electric jitter—generated after an abrupt reduction in the high-voltage pulse—was used to increase the lifetime of the high-n Rydberg states via ml mixing, which yielded the ZEKE states [31].
Thereafter, the molecules in the ZEKE states, situated immediately below the ionization threshold conversing with the cationic states, were ionized and simultaneously accelerated into the delayed-extraction stage by a PFI field of 3.5 V cm−1 applied by the VUV laser pulse with a delay of 15 μs. Subsequently, the resulting MATI ions were extracted from the delayed-extraction stage for first-order space focusing. They passed through a field-free region and were subjected to mass-selective detection using the multichannel plates at the end of the TOF tube. The new electrode assembly and pulsing scheme adopted in the home-built VUV-MATI mass spectrometer could simultaneously enhance both the spectral resolution (~5 cm−1) and signal intensity of the measured VUV-MATI spectrum [31]. Furthermore, the intensity of each peak in the measured MATI spectrum was normalized to the power of the VIS laser pulse used for VUV generation by FWDFM.
For the IR-resonant VUV-PI/MATI scheme, HR IR laser pulse in the range of 2650–3100 cm−1 with ~7 mJ/pulse was generated using a narrowband optical parametric oscillator/amplifier (OPO/OPA) system (LaserVision, ~0.1 cm−1) pumped by a Nd:YAG laser (Continuum, Powerlite 8010) seeded with a wavelength of 1064 nm. Thereafter, the generated IR laser light was cylindrically focused using a telescope comprising two CaF2 lenses (f = 75 and −100 mm) aligned perpendicularly to both the molecular beam and the direction of ion flight in the photoionization chamber. The VUV laser pulse was delayed by 5 ns with respect to the IR laser pulse for photoexciting a specific conformer to a vibrational state. This extent of pulse delay was verified by accurately recording the IR-dip VUV-MATI spectrum of the target molecule, such that the relative delay of 5 ns between the IR and VUV laser pulses is adequate for repopulating a vibrational state in the high-frequency region. The frequencies of all lasers used in the experiments were measured and calibrated using a wavemeter (HighFinesse, Wavelength Meter WS5) with an accuracy of 0.1 cm−1.

3.2. Theoretical Methods

All the quantum chemical calculations were performed using the Gaussian 16 program package [40]. The levels of DFT, e.g., B3LYP, CAM-B3LYP, M062x, and ωB97XD, with the cc-pVTZ basis set afford reliable accuracy and were utilized to optimize the structures and frequencies of the pivaldehyde molecules in the S0 and D0 states. The equilibrium geometries on both the neutral and cationic states exhibited CS symmetries. The IR spectra of the neutral eclipsed and gauche conformers in pivaldehyde were simulated at the ωB97XD/cc-pVTZ level with harmonic and anharmonic potentials for comparison with the experimental IR spectra. Subsequently, to analyze the MATI spectrum of pivaldehyde—essentially, the vibrational spectrum of the pivaldehyde cation—the FC factors were calculated based on the geometries, vibrational frequencies, and normal-mode eigenvectors of the neutral and cationic pivaldehyde in the ground electronic state at the ωB97XD/cc-pVTZ level. The vibrational frequencies calculated by harmonic approximation were appropriately scaled to compensate for the uncertainties arising from the vibrational anharmonicity and incomplete treatment of the electron correlation [41,42].

4. Conclusions

As the population of conformers in aliphatic aldehydes (e.g., propanal and isobutanal) depends on the vibrational temperature assuming adiabatic cooling under the molecular beam condition, the isolation and identification of a conformer are imperative. This study explored the conformational structures of pivaldehyde in the S0 and D0 states by utilizing conformer-specific vibrational spectroscopy.
The constructed 2D PESs associated with the conformational interconversion in the S0 and D0 states indicated the presence of only the eclipsed conformation at the global minima on both the states. In addition, we simulated IR spectra with anharmonic potentials for the neutral eclipsed and gauche conformations based on IR and microwave spectroscopies, respectively. The comparison of these simulated IR spectra with the observed IR-resonant VUV-PI/MATI spectra enabled the identification of the conformational structure of the neutral pivaldehyde in the ground electronic state and unveiled the gauche conformation of the neutral pivaldehyde.
Based on the conformation determined in the S0 state, the performed FC analysis could achieve the rigorous vibrational assignment of the measured VUV-MATI spectrum corresponding to the adiabatic ionic transitions between the neutral and cationic pivaldehyde, which indicated the cationic structure of the eclipsed conformer.
The ionization-induced geometric transformations can be attributed to the electron removal from the HOMO containing the lone-pair p-orbital on the oxygen atom that required charge delocalization via the hyperconjugation effect with the σ-orbitals in the methyl group in cationic state. Furthermore, this investigation of the conformational preference in the neutral and cationic states provides insights for elucidating the conformer-specific reaction dynamics upon photoionization and photodissociation in the gas phase.

Author Contributions

Conceptualization, methodology, software, and formal analysis, validation, investigation, resources, and data curation, visualization, all authors; writing—original draft preparation, Y.R.L.; writing—review and editing, supervision, project administration, C.H.K.; funding acquisition, S.M.P. and C.H.K. All authors have read and agreed to the published version of the manuscript.

Funding

This work was supported by the National Research Foundation in Korea (2020R1A2B5B02001658 and 2021R1I1A1A01047743).

Institutional Review Board Statement

Not applicable.

Informed Consent Statement

Not applicable.

Data Availability Statement

The data that support the findings of this study are available from the corresponding author upon reasonable request.

Acknowledgments

We thank M. H. Kim for the insightful discussion on the conformational structure of pivaldehyde. We extend sincere gratitude to all the members in the Physical Chemistry Division, Korean Chemical Society.

Conflicts of Interest

The authors declare no conflict of interest.

References

  1. Crim, F.F. Bond-Selected Chemistry: Vibrational state control of photodissociation and bimolecular reaction. J. Phys. Chem. 1996, 100, 12725–12734. [Google Scholar] [CrossRef]
  2. Khriachtchev, L.; Maҫôas, E.; Pettersson, M.; Räsänen, M. Conformational memory in photodissociation of formic acid. J. Am. Chem. Soc. 2002, 124, 10994–10995. [Google Scholar] [CrossRef] [PubMed]
  3. Dian, B.C.; Longarte, A.; Zwier, T.S. Conformational dynamics in a dipeptide after single-mode vibrational excitation. Science 2002, 296, 2369–2373. [Google Scholar] [CrossRef]
  4. Park, S.T.; Kim, S.K.; Kim, M.S. Observation of conformation-specific pathways in the photodissociation of 1-iodopropane ions. Nature 2002, 415, 306–308. [Google Scholar] [CrossRef]
  5. Kim, M.H.; Shen, L.; Tao, H.L.; Martinez, T.J.; Suits, A.G. Conformationally controlled chemistry: Excited-state dynamics dictate ground-state reaction. Science 2007, 315, 1561–1565. [Google Scholar] [CrossRef] [PubMed]
  6. Miller, D.R. Free Jet Sources. In Atomic and Molecular Beam Methods; Scoles, G., Ed.; Oxford University Press: New York, NY, USA, 1988; Volume 1, pp. 14–53. [Google Scholar]
  7. Park, S.M.; Lee, Y.R.; Kang, D.W.; Kim, H.L.; Kwon, C.H. Conformational structures of the tetrahydrofuran cation determined using one-photon mass-analyzed threshold ionization spectroscopy. Phys. Chem. Chem. Phys. 2017, 19, 30362–30369. [Google Scholar] [CrossRef]
  8. Lee, Y.R.; Kim, M.H.; Kim, H.L.; Kwon, C.H. Conformer-specific photoionization and conformational stabilities of isobutanal revealed by one-photon mass-analyzed threshold ionization (MATI) spectroscopy. J. Chem. Phys. 2018, 149, 174302. [Google Scholar] [CrossRef]
  9. Park, S.M.; Kim, H.L.; Kwon, C.H. Identification and composition of conformational isomers and their cations in crotonaldehyde by VUV-MATI spectroscopy. Phys. Chem. Chem. Phys. 2018, 20, 27162–27168. [Google Scholar] [CrossRef]
  10. Lee, Y.R.; Kim, K.E.; Kim, M.H.; Kim, H.L.; Kwon, C.H. Formyl torsion and cationic structure of gauche conformer in isobutanal by conformer-specific VUV-MATI spectroscopy and Franck-Condon fitting. J. Chem. Phys. 2019, 151, 014304. [Google Scholar] [CrossRef]
  11. Eom, S.Y.; Lee, Y.R.; Kwon, C.H. Accurate conformational stability and cationic structure of piperidine determined by conformer-specific VUV-MATI spectroscopy. Phys. Chem. Chem. Phys. 2020, 22, 6184–6191. [Google Scholar] [CrossRef]
  12. Park, S.M.; Choi, J.; Kim, H.L.; Kwon, C.H. Conformer-specific VUV-MATI spectroscopy of methyl vinyl ketone: Stabilities and cationic structures of the s-trans and s-cis conformers. Phys. Chem. Chem. Phys. 2020, 22, 28383–28392. [Google Scholar] [CrossRef]
  13. Eom, S.Y.; Kang, D.W.; Kwon, C.H. Conformational structure of cationic tetrahydropyran by one-photon vacuum ultraviolet mass-analyzed threshold ionization spectroscopy. Phys. Chem. Chem. Phys. 2021, 23, 1414–1423. [Google Scholar] [CrossRef]
  14. Lipert, R.J.; Colson, S.D. Persistent spectral hole burning of molecular clusters in a supersonic jet. J. Phys. Chem. 1989, 93, 3894–3896. [Google Scholar] [CrossRef]
  15. Riehn, C.; Lahmann, C.; Wassermann, B.; Brutschy, B. IR depletion spectroscopy. A method for characterizing a microsolvation environment. Chem. Phys. Lett. 1992, 197, 443–450. [Google Scholar] [CrossRef]
  16. Ebata, T.; Fujii, A.; Mikami, N. Vibrational spectroscopy of small-sized hydrogen-bonded clusters and their ions. Int. Rev. Phys. Chem. 1998, 17, 331–361. [Google Scholar] [CrossRef]
  17. Bakker, J.M.; Mac Aleese, L.; Meijer, G.; Helden, G. Fingerprint IR spectroscopy to probe amino acid conformations in the gas phase. Phys. Rev. Lett. 2003, 91, 203003. [Google Scholar] [CrossRef] [Green Version]
  18. Choi, C.M.; Choi, D.H.; Heo, J.; Kim, N.J.; Kim, S.K. Ultraviolet–Ultraviolet hole burning spectroscopy in a quadrupole ion trap: Dibenzo [18] crown-6 complexes with alkali metal cations. Angew. Chem. Int. Ed. 2012, 51, 7297–7300. [Google Scholar] [CrossRef]
  19. Min, A.; Ahn, A.; Moon, C.J.; Lee, J.H.; Seong, Y.G.; Kim, S.K.; Choi, M.Y. Conformational structures of jet-cooled acetaminophen-water clusters: A gas phase spectroscopic and computational study. Phys. Chem. Chem. Phys. 2017, 19, 4840–4848. [Google Scholar] [CrossRef]
  20. Woo, H.K.; Wang, P.; Lau, K.-C.; Xing, X.; Chang, C.; Ng, C.Y. State-selected and state-to-state photoionization study of trichloroethene using the two-color infrared-vacuum ultraviolet scheme. J. Chem. Phys. 2003, 119, 9333–9336. [Google Scholar] [CrossRef]
  21. Matsuda, Y.; Mikami, N.; Fujii, A. Vibrational spectroscopy of size-selected neutral and cationic clusters combined with vacuum-ultraviolet one-photon ionization detection. Phys. Chem. Chem. Phys. 2009, 11, 1279–1290. [Google Scholar] [CrossRef]
  22. Han, H.; Camacho, C.; Witek, H.A.; Lee, Y. Infrared absorption of methanol clusters (CH3OH)n with n = 2–6 recorded with a time-of flight mass spectrometer using infrared depletion and vacuum-ultraviolet ionization. J. Chem. Phys. 2011, 134, 144309. [Google Scholar] [CrossRef]
  23. Park, S.M.; Kwon, C.H. Development and verification of conformer-specific vibrational spectroscopy. J. Phys. Chem. A 2021, 125, 9251–9258. [Google Scholar] [CrossRef] [PubMed]
  24. Park, S.M.; Kwon, C.H. Identification of individual conformers in C4H6O isomers using conformer-specific vibrational spectroscopy. RSC Adv. 2021, 11, 38240–38246. [Google Scholar] [CrossRef] [PubMed]
  25. Vasyunin, A.I.; Herbst, E. Reactive desorption and radiative association as possible drivers of complex molecule formation in the cold interstellar medium. Astrophys. J. 2013, 769, 34. [Google Scholar] [CrossRef] [Green Version]
  26. Kaiser, R.I.; Maity, S.; Jones, B.M. Infrared and reflectron time-of-flight mass spectroscopic analysis of methane (CH4)–carbon monoxide (CO) ices exposed to ionization radiation—Toward the formation of carbonyl bearing molecules in extraterrestrial ices. Phys. Chem. Chem. Phys. 2014, 16, 3399–3424. [Google Scholar] [CrossRef] [PubMed]
  27. McGuire, B. 2018 Census of interstellar, circumstellar, extragalactic, protoplanetary disk, and exoplanetary molecules. Astrophys. J. Suppl. Ser. 2018, 239, 48. [Google Scholar] [CrossRef]
  28. Kim, M.H.; Shen, L.; Suits, A.G. Photoelectron imaging of propanal by resonant multiphoton ionization via the 3s Rydberg state. Phys. Chem. Chem. Phys. 2006, 8, 2933–2939. [Google Scholar] [CrossRef]
  29. Choi, S.; Kang, T.Y.; Choi, K.; Han, S.; Ahn, D.; Baek, S.J.; Kim, S.K. Ionization spectroscopy of conformational isomers of propanal: The origin of the conformational preference. J. Phys. Chem. A 2008, 112, 5060–5063. [Google Scholar] [CrossRef]
  30. Shen, L.; Singh, P.C.; Kim, M.; Zhang, B.; Suits, A.G. Ion and electron imaging study of isobutanal photoionization dynamics. J. Phys. Chem. A 2009, 113, 68–74. [Google Scholar] [CrossRef]
  31. Lee, Y.R.; Kwon, C.H. Innovative mass spectrometer for high resolution ion spectroscopy. J. Chem. Phys. 2021, 155, 164203. [Google Scholar] [CrossRef] [PubMed]
  32. Kim, K.E. Vacuum Ultraviolet Mass-Analyzed Threshold Ionization (VUV-MATI) Spectroscopy of Trimethylacetaldehyde. Master’s Thesis, Ewha University, Seoul, Republic of Korea, 2017. [Google Scholar]
  33. Ronn, A.M.; Woods, R.C., III. Microwave spectrum of pivaldehyde. J. Chem. Phys. 1966, 45, 3831–3836. [Google Scholar] [CrossRef]
  34. Crowder, G.A. Vibrational spectra of 2,2-dimethylpropanal. J. Chem. Soc. Perkin Trans. II 1973, 2, 1241–1244. [Google Scholar] [CrossRef]
  35. Durig, J.R.; Kenton, R.; Phan, H.V.; Little, T.S. Far-infrared spectra and barriers to internal rotation of pivaldehyde, pivaloyl fluoride, pivaloyl chloride and pinacolone. J. Mol. Struct. 1991, 247, 237–251. [Google Scholar] [CrossRef]
  36. Cox, A.P.; Couch, A.D.; Hillig II, K.W.; LaBarge, M.S.; Kuczkowski, R.L. Microwave spectrum, molecular structure and dipole moment of pivalaldehyde. J. Chem. Soc. Faraday Trans. 1991, 87, 2689–2698. [Google Scholar] [CrossRef]
  37. Kim, M.C.; Sim, E.; Burke, K. Understanding and reducing errors in density functional calculations. Phys. Rev. Lett. 2013, 111, 073003. [Google Scholar] [CrossRef] [PubMed] [Green Version]
  38. Amrein, A.; Hollenstein, H.; Quack, M.; Zenobi, R.; Segall, J.; Zare, R.N. Fermi resonance structure in the CH vibrational overtones of CD3CHO. J. Chem. Phys. 1989, 90, 3944–3951. [Google Scholar] [CrossRef] [Green Version]
  39. Lee, Y.R.; Kwon, C.H. Determination of highest occupied molecular orbital and cationic structures of cyclopentanone using high-resolution vacuum ultraviolet mass-analyzed threshold ionization mass spectrophotometry. Bull. Korean Chem. Soc. 2022, 43, 636–644. [Google Scholar] [CrossRef]
  40. Frisch, M.J.; Trucks, G.W.; Schlegel, H.B.; Scuseria, G.E.; Robb, M.A.; Cheeseman, J.R.; Scalmani, G.; Barone, V.; Mennucci, B.; Petersson, G.A.; et al. Gaussian 16; Gaussian Inc.: Wallingford, CT, USA, 2016. [Google Scholar]
  41. Sinha, P.; Boesch, S.E.; Gu, C.; Wheeler, R.A.; Wilson, A.K. Harmonic vibrational frequencies: Scaling factors for HF, B3LYP, and MP2 methods in combination with correlation consistent basis sets. J. Phys. Chem. A 2004, 108, 9213–9217. [Google Scholar] [CrossRef]
  42. Merrick, J.P.; Moran, D.; Radom, L. An evaluation of harmonic vibrational frequency scale factors. J. Phys. Chem. A 2007, 111, 11683–11700. [Google Scholar] [CrossRef]
Figure 1. Delayed VUV–PIE curve (solid-gray line) for the C5H10O+• signal measured as a function of photon energy of VUV laser pulse at the bottom horizontal axis. Based on the onset observed in the PIE curve, the HR VUV-MATI spectrum of pivaldehyde was recorded, where the 0–0 band position was located at 76,629 cm−1. Ion internal energy at the top horizontal axis corresponds to cationic vibrational frequency, estimated by setting the 0–0 band position as the origin. Inset: AIE of pivaldehyde determined accurately by extrapolating the 0–0 band position in the MATI spectrum to the zero-field limit.
Ijms 23 14777 g001
Figure 2. 2D PESs of pivaldehyde in S0 and D0 states constructed as functions of dihedral angles associated with formyl and methyl torsional motions, describing conformational interconversion performed by optimizing the remaining geometric parameters at ωB97XD/cc-pVTZ level. Eclipsed-pivaldehyde conformer with CS symmetry, which can be interconverted via three-fold internal rotations for formyl or methyl groups, exists at global minimum on both S0 and D0 states. AIEcal denotes the AIE calculated for conformer with zero-point energy correction.
Ijms 23 14777 g002
Figure 3. (a) HR VUV-MATI spectrum of pivaldehyde. Spectra simulated using FC factors and vibrational frequencies calculated at (b) B3LYP, (c) CAM-B3LYP, (d) M062X, and (e) ωB97XD levels with the cc-pVTZ basis set for adiabatic ionic transitions between optimized neutral and cationic pivaldehyde.
Ijms 23 14777 g003
Figure 4. IR-dip VUV-MATI spectra of pivaldehyde were measured by monitoring intense peaks at (a) 76,629 and (b) 77,045 cm−1, respectively. (c) IR-resonant VUV-PI (76,529 cm−1) spectrum of pivaldehyde measured by scanning IR laser. Simulated IR spectra for neutral pivaldehydes with 2O–1C–4C–5C dihedral angles of (d) 0° and (e) 2.1°, respectively, calculated at ωB97XD/cc-pVTZ level with anharmonic potentials.
Ijms 23 14777 g004
Figure 5. (a) HR VUV-MATI spectrum of pivaldehyde, including the vibrational assignments achieved by FC analysis. (b) FC simulation spectrum for adiabatic ionic transitions between neutral gauche with 2O–1C–4C–5C dihedral angle of 2.1° and the cationic eclipsed conformers optimized at ωB97XD/cc-pVTZ level for pivaldehyde. Eigenvectors of promoted vibrational modes in cationic state are illustrated in figure.
Ijms 23 14777 g005
Figure 6. (a) HOMO of pivaldehyde with 2O–1C–4C–5C dihedral angle of 2.1° in S0 and (b) singly occupied molecular orbital (SOMO) of pivaldehyde in D0 state obtained at ωB97XD/cc-pVTZ level. HOMO and SOMO were obtained from NBO analysis.
Ijms 23 14777 g006
Table 1. Experiment and calculated vibrational frequencies (cm−1) of pivaldehyde in S0 and D0 states.
Mode aS0 (C1)D0 (CS)
VUV-MATIFC (CS→) dFC (C1→) c
Exp bCal cFreqInt eFreqInt eFreqInt e
Fundamentals
4217077550.01354 540.014
4112221961990.004195 1951 × 10−4
3913303223090.012308 3085 × 10−4
2412672502350.0312390.0122390.013
2312782752460.0822420.0592420.058
2213483462700.2422670.4752670.472
2113893853630.6763610.8143610.815
2015935904161.0004171.0004171.000
1917647594730.1264800.3304800.331
161104110389960.0819890.0699890.069
1511217122210250.07010320.14610320.147
1411277127911170.17111310.34711310.347
1111406141013870.08913980.00613980.006
1011457145314370.06714350.00314350.003
811484148914730.13214830.00214830.002
711774180518670.08618880.07518880.074
Overtones and combinations
4221301541100.0091080.0161080.013
423 1660.001162 1620.001
241221 5040.0365060.0015060.001
222 5380.0455350.0695350.067
241211 5960.0276000.0076000.008
231211 6100.0396030.0866030.085
221211 6320.1566280.3756280.373
241201 6500.0396560.0116560.013
231201 6620.0766600.1006600.099
221201 6850.1966850.4766850.472
212 7260.1857220.3397220.340
221191 7500.0817480.2137480.211
211201 7800.5077780.8827780.882
202 8330.4948350.5798350.578
201191 8880.1058980.3518980.352
222201 9550.0549520.0369520.035
222191 10150.05010150.03310150.032
221211201 10510.13510460.27410460.272
213 10900.07010820.06510820.066
221211191 11060.15311080.11511080.115
212201 11450.14411390.28011390.280
211202 12000.22011960.40111960.400
203 12510.19912520.19112520.191
202191 13060.05713150.15513150.155
211161 13570.05713500.06014500.060
201161 14130.00814060.08414060.084
211141 14820.15714920.34914920.349
191151 14960.06815130.06215130.063
201141 15360.22515480.43515480.435
212201191 16190.10816190.02816190.028
211202191 16710.09516760.05616760.056
221211141 17480.09917590.15117590.150
231201141 17760.08217910.05117910.051
221201141 18030.13118160.19618160.194
202161 18330.15418240.04518240.044
212141 18430.10218530.13418530.134
211201141 18990.18819090.35619090.356
202141 19520.19119660.23919660.238
201191141 20080.07520290.15020290.150
231202141 21950.06422080.03622080.036
203161 22480.07522410.01322410.013
211202141 23200.06123270.15123270.150
14181 25910.04126140.00126140.001
191151141 26140.04926440.03526440.035
a Vibrational assignments for cationic pivaldehyde with CS symmetry in Mülliken notation. b Frequencies from Refs. [34,35]. c Frequencies and FC factors calculated for the neutral with 2O–1C–4C–5C dihedral angle of 2.1° and cation with CS symmetry at ωB97XD/cc-pVTZ level. The calculated vibrational frequencies were scaled by 0.975. d Frequencies and FC factors calculated for pivaldehyde with Cs symmetry in S0 and D0 states optimized at ωB97XD/cc-pVTZ level. e Normalized to intensity of the most intense peak at 416 cm−1 in MATI spectrum.
Table 2. Geometric parameters of pivaldehyde molecule in S0 and D0 states calculated at ωB97XD/cc-pVTZ level.
S0D0
Exp aCal (Cs) bCal (C1) cCal (Cs) b
Bond length (Å)
1C–2O1.2061.1991.1991.159 (−0.040) d
1C–4C1.5161.5161.5161.724 (0.208)
4C–5C1.5371.5231.5231.505 (−0.018)
4C–9C (4C–13C)1.5371.5351.5351.515 (−0.020)
1C–3H1.1301.1131.1131.103 (−0.010)
5C–6H1.1181.0911.0911.093 (0.002)
5C–7H (5C–8H)1.1181.0891.0891.088 (−0.001)
9C–10H (13C–14H)1.1181.0911.0911.095 (0.004)
9C–11H (13C–15H)1.1181.0921.0921.089 (−0.003)
9C–12H (13C–16H)1.1181.0911.0911.089 (−0.002)
Bond angle (°)
2O–1C–4C126.0125.9125.9121.0 (−4.9)
1C–4C–5C110.5110.9110.8108.3 (−2.5)
1C–4C–9C (1C–4C–13C)107.4107.1106.9100.5 (−6.4)
4C–1C–3H113.0113.8113.8110.6 (−3.2)
Dihedral angle (°)
2O–1C–4C–5C2.10.02.10.0 (−2.1)
a Geometric parameters of neutral pivaldehyde determined using microwave spectroscopy in Ref. [33]. b Geometric parameters of neutral and cationic pivaldehyde calculated at ωB97XD/cc-pVTZ level. c Geometric parameters of neutral pivaldehyde with 2O–1C–4C–5C dihedral angle of 2.1° calculated at ωB97XD/cc-pVTZ level. d Numbers in parentheses represent ionization-induced geometric transformations with respect to the fitted gauche geometry.
Table 3. Vibrational assignment of pivaldehyde in high-frequency region (cm−1) of S0 state.
Mode (C1) aIR(CS) bCal(CS) c
(Har)
Cal(CS) d
(Anhar)
Cal(C1) e
(Anhar)
IR-Resonant VUV-PIIR-Dip
VUV-MATI
Mode Description f
101269627272707271026892689Cformyl-H stretch
192276826952802278827622762Overtone of Cformyl-H bending
191181279127222833281927882788Combination of bending
182280327502849283328032803Overtone of Cformyl-H bending
91287628942852285228762876Out-of-plane (CH3)2 asym. stretch
71291329042895289529132913In-plane CH3 sym. stretch
61 292229432943Out-of-plane (CH3)2 asym. stretch
51296929642925295329642964Out-of-plane (CH3)2 sym. stretch
21298029762943297029772977In-plane CH3 asym. stretch
a Vibrational assignments for neutral pivaldehyde with C1 symmetry in Mülliken notation. b Vibrational frequencies measured by IR spectroscopy in Ref. [34]. c Harmonic vibrational frequencies calculated from optimized geometry of neutral pivaldehyde with CS symmetry at ωB97XD/cc-pVTZ level. The calculated vibrational frequencies were scaled by 0.951. d Anharmonic vibrational frequencies calculated for neutral pivaldehyde with CS symmetry at ωB97XD/cc-pVTZ level to reflect Fermi resonances between the formyl C–H stretching and the overtone and combination of formyl C–H bends. e Anharmonic vibrational frequencies calculated for neutral pivaldehyde with 2O–1C–4C–5C dihedral angle of 2.1° at ωB97XD/cc-pVTZ level. f Normal modes for the optimized eclipsed conformer at the global minimum utilized for the vibrational assignments.
Publisher’s Note: MDPI stays neutral with regard to jurisdictional claims in published maps and institutional affiliations.

