
Renal Cell Carcinoma as a Metabolic Disease: An Update on Main Pathways, Potential Biomarkers, and Therapeutic Targets
 , , , , , and
Abstract
:1. Introduction
2. Metabolic Pathway Understanding: Where Do We Stand?
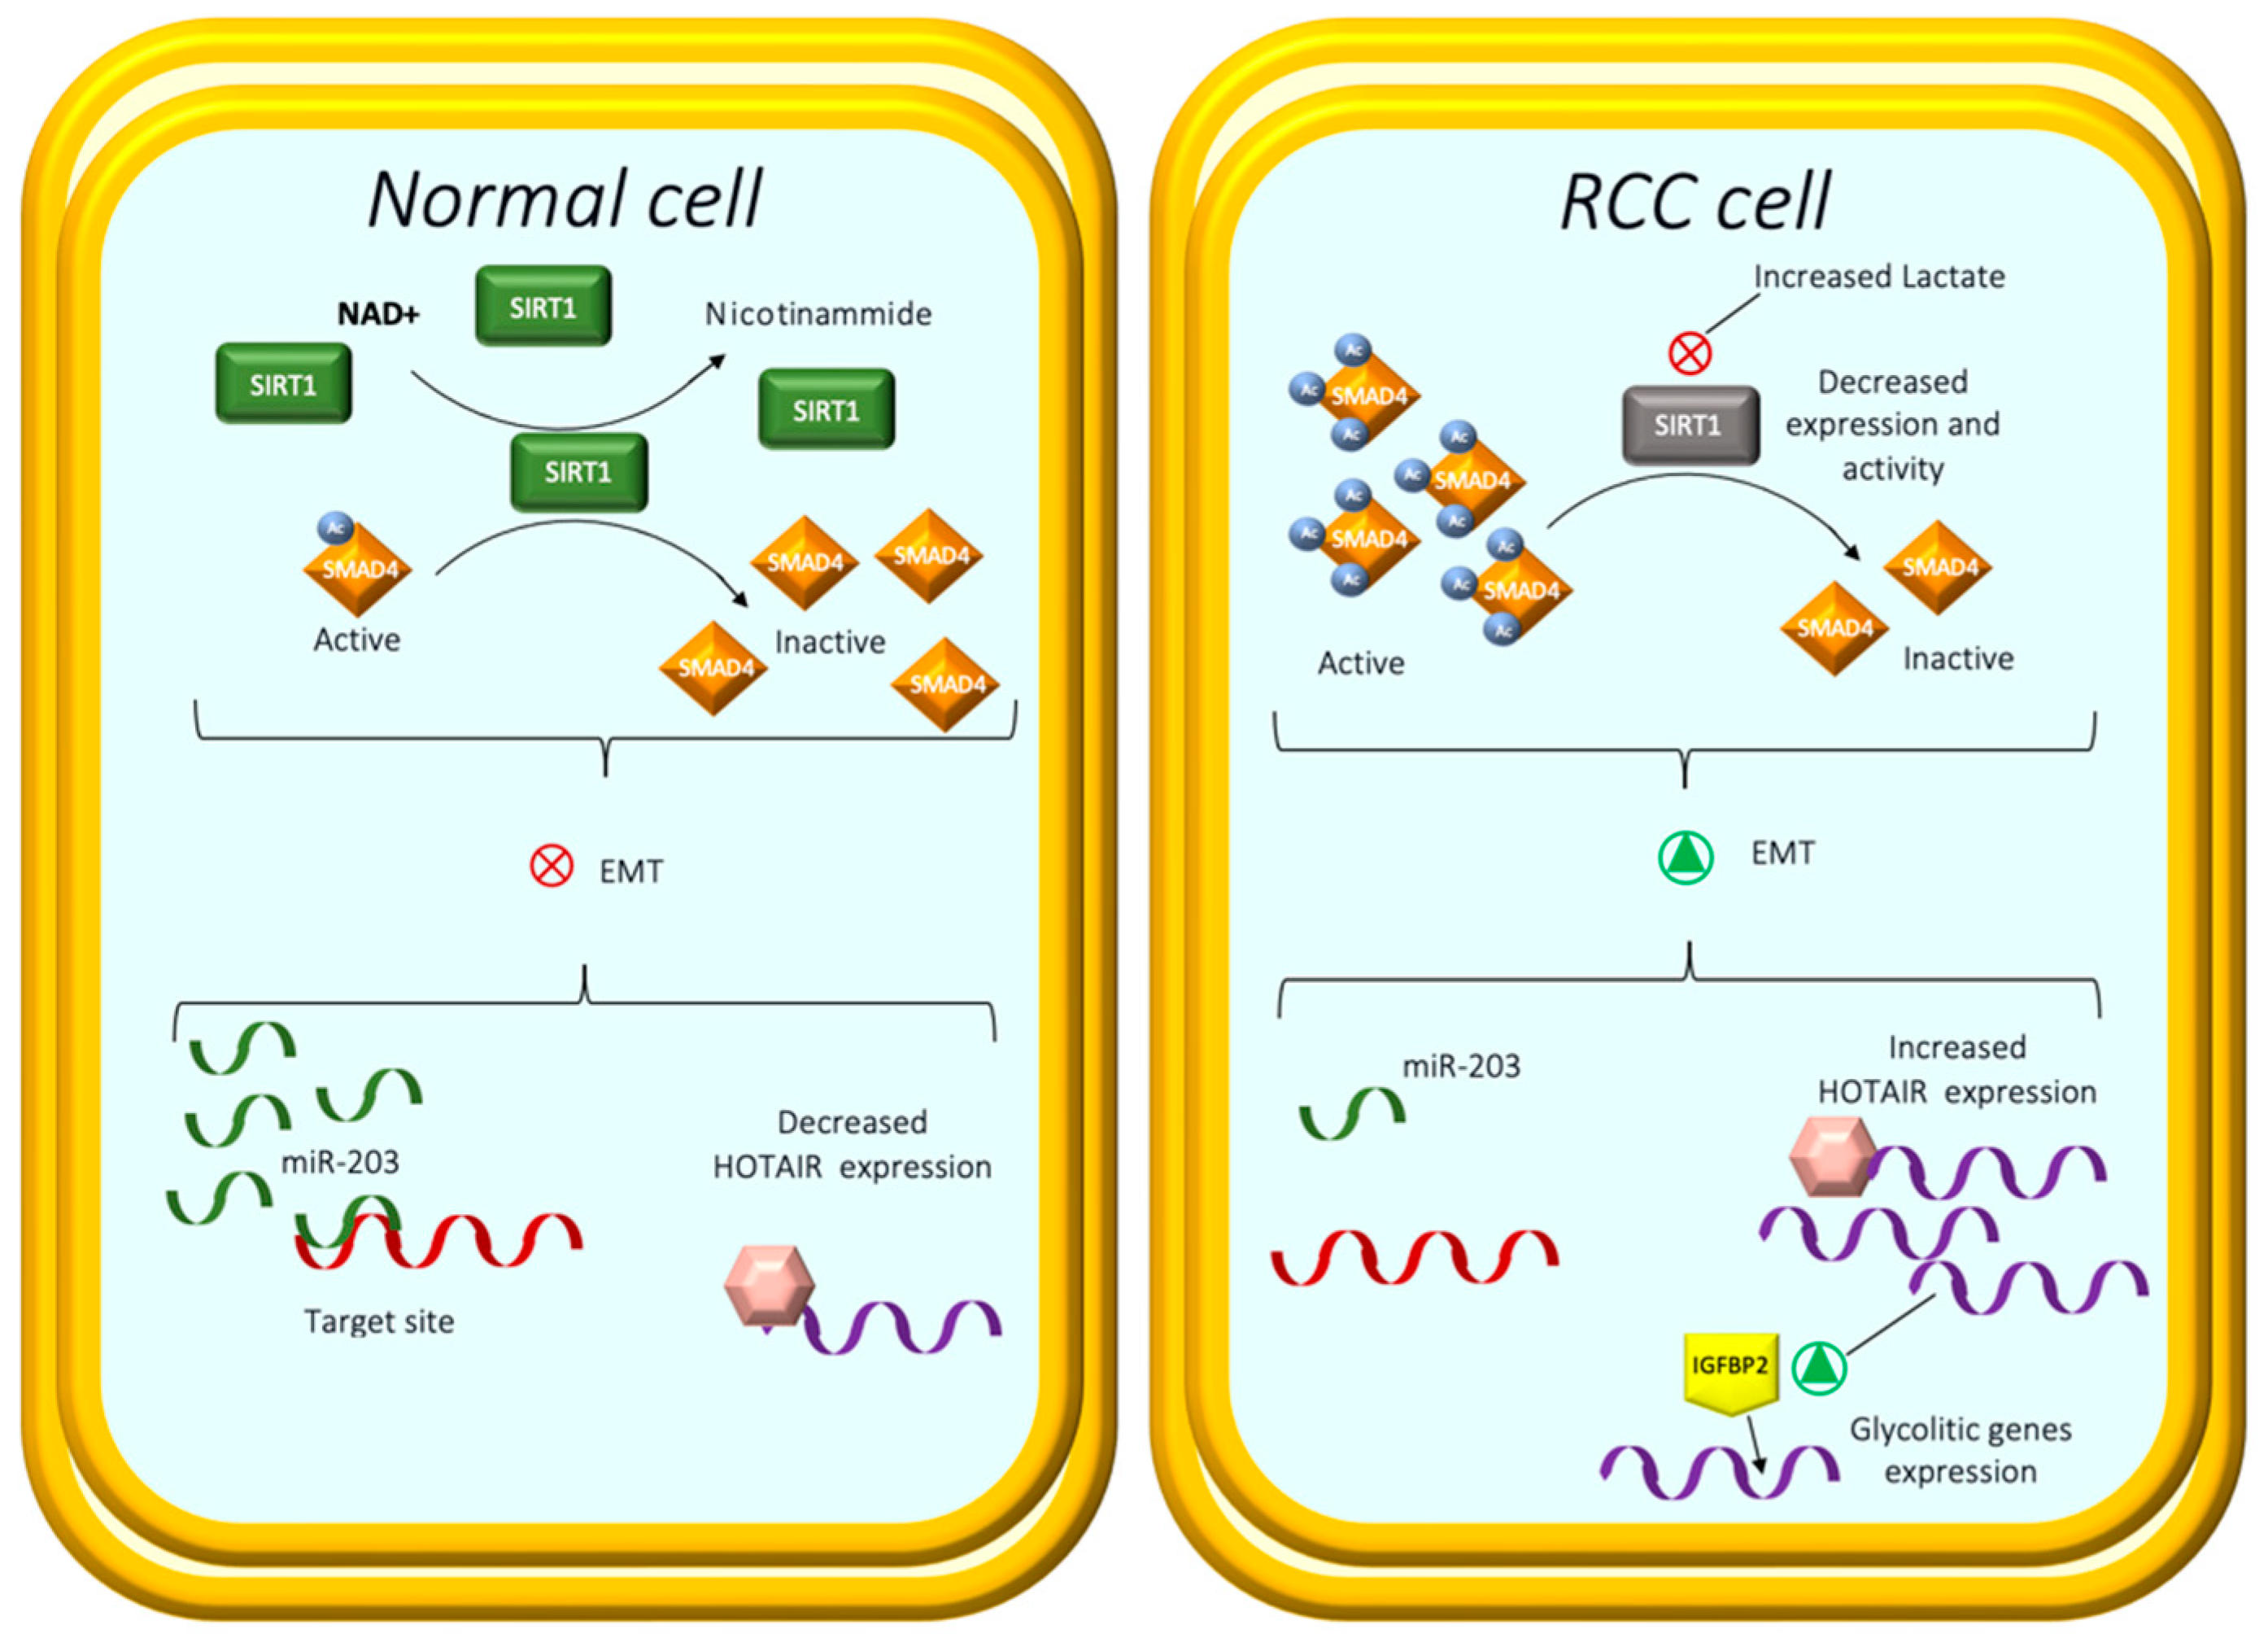
2.1. Lactate Metabolism
2.2. The Leading Role of Transporters
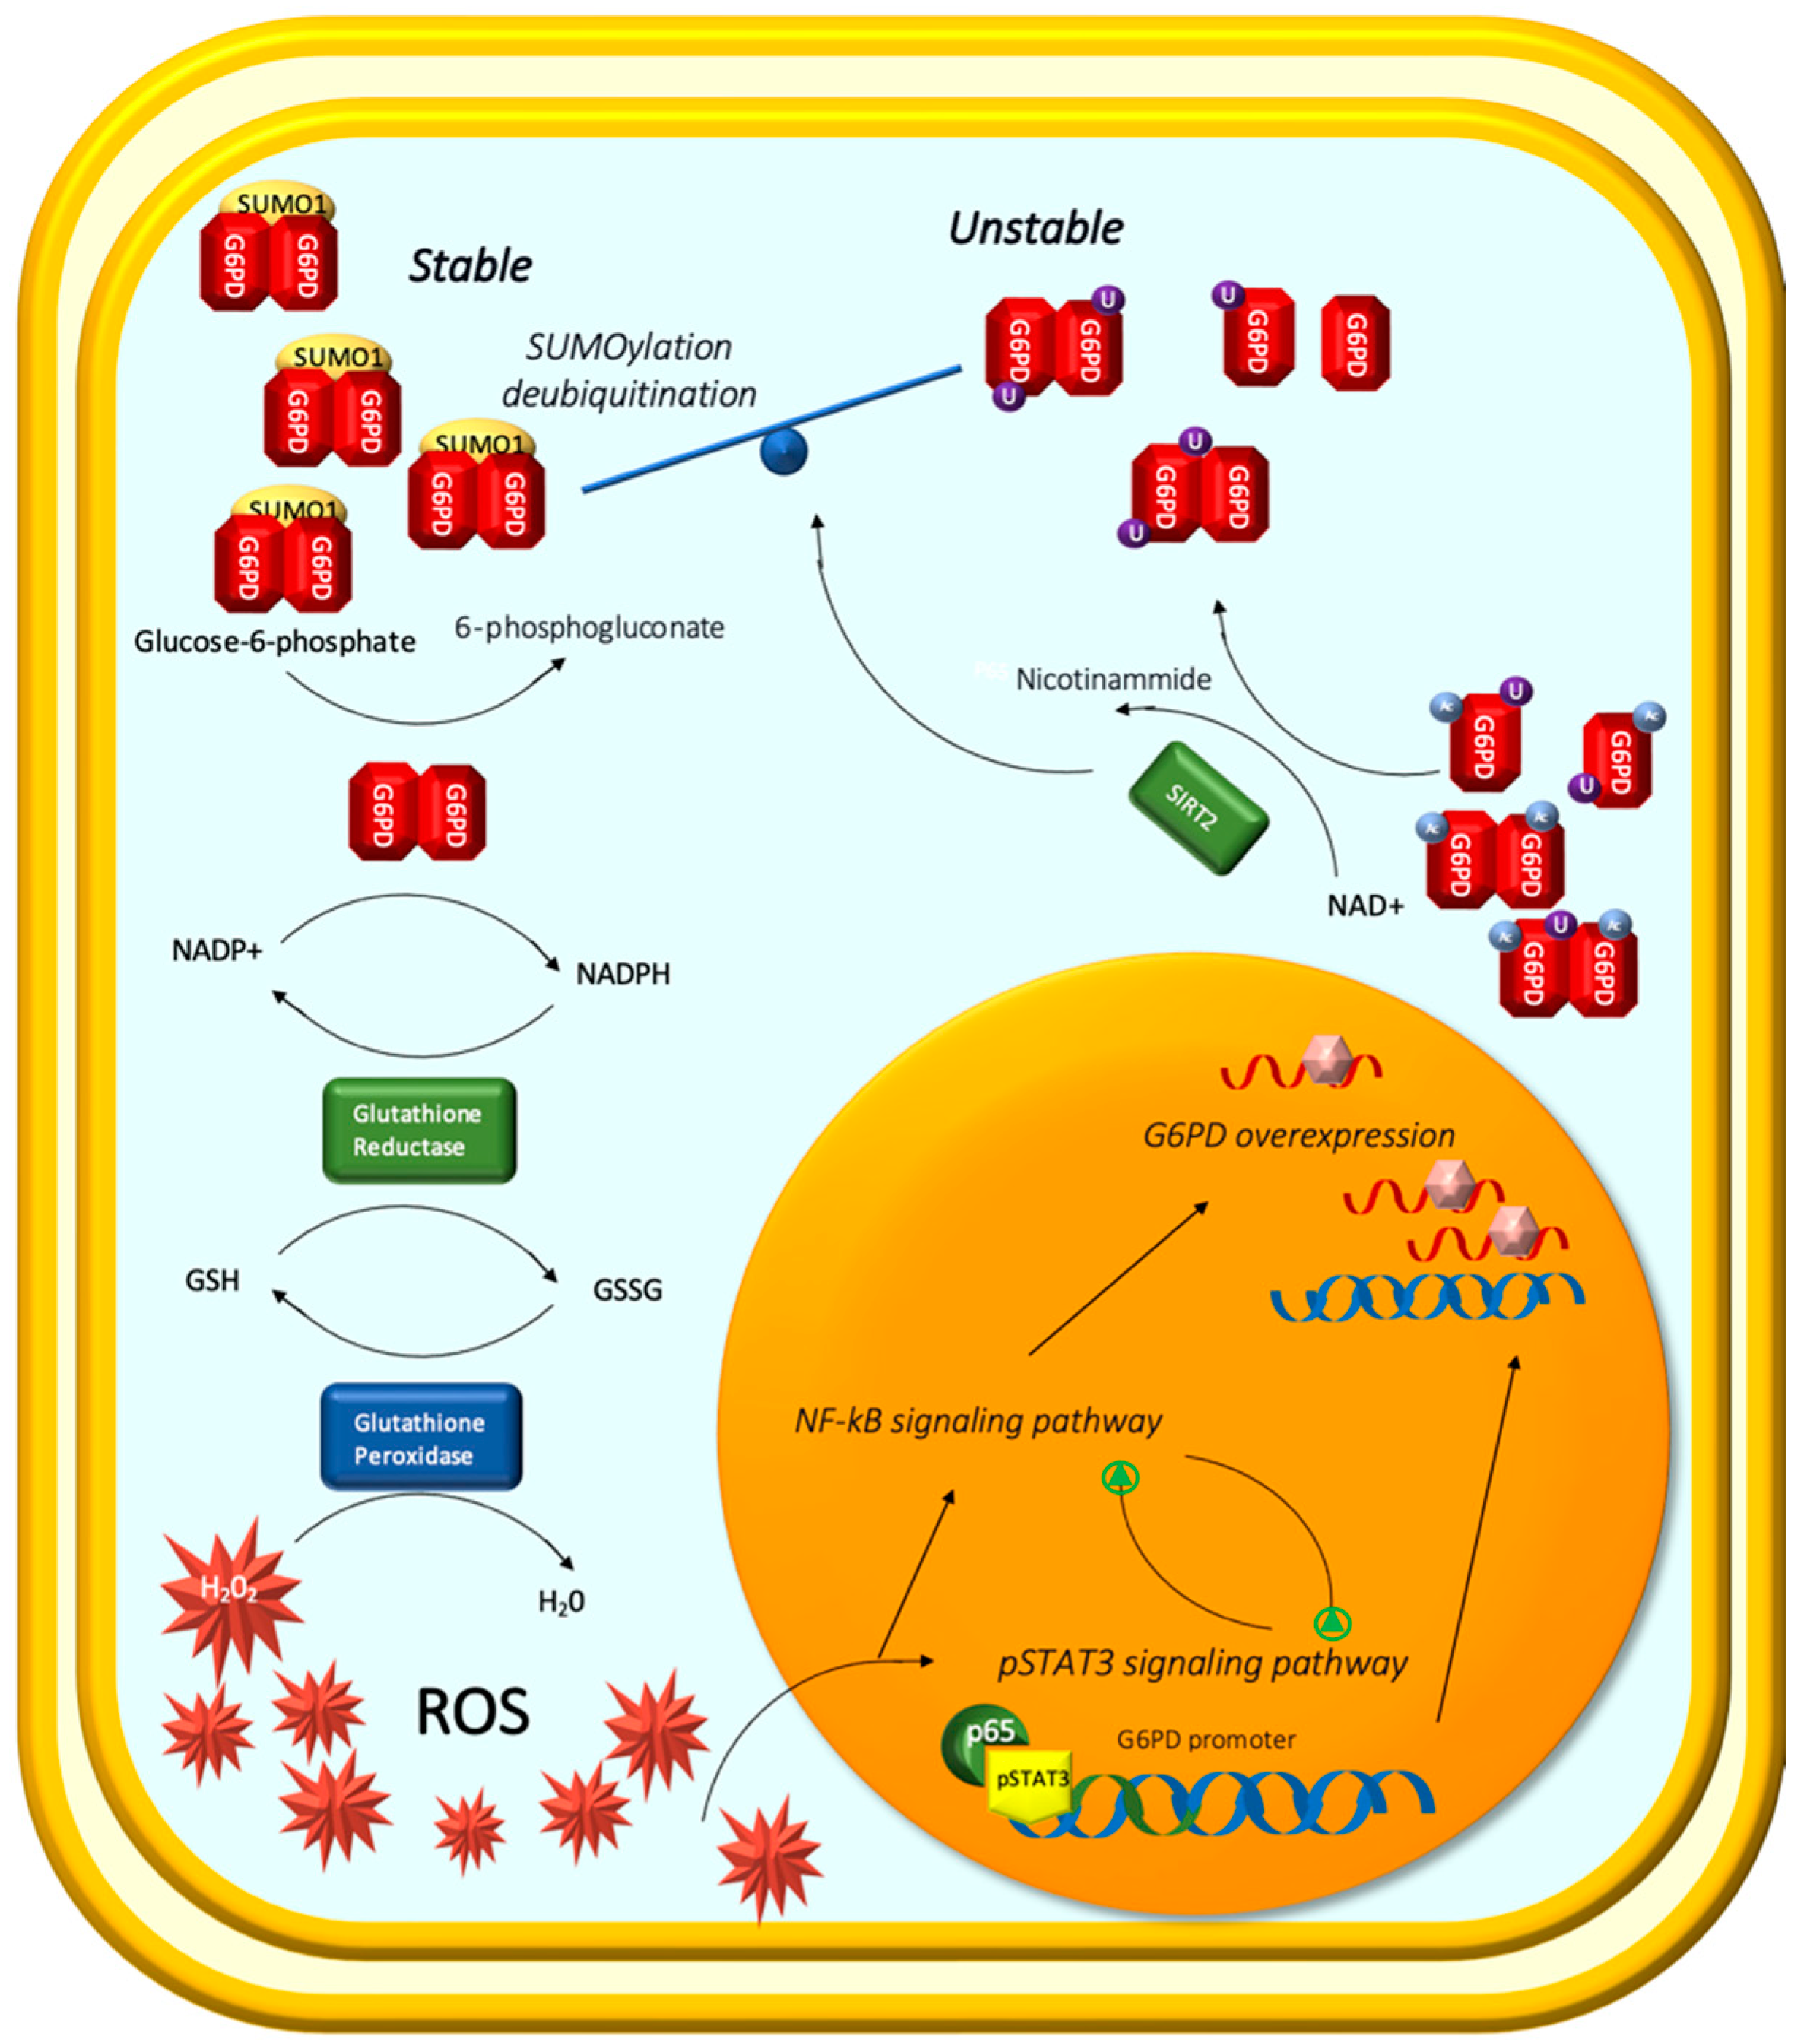
2.3. The Oncogenic Role of G6PD
2.4. The Metabolic Background of Lipid Droplets
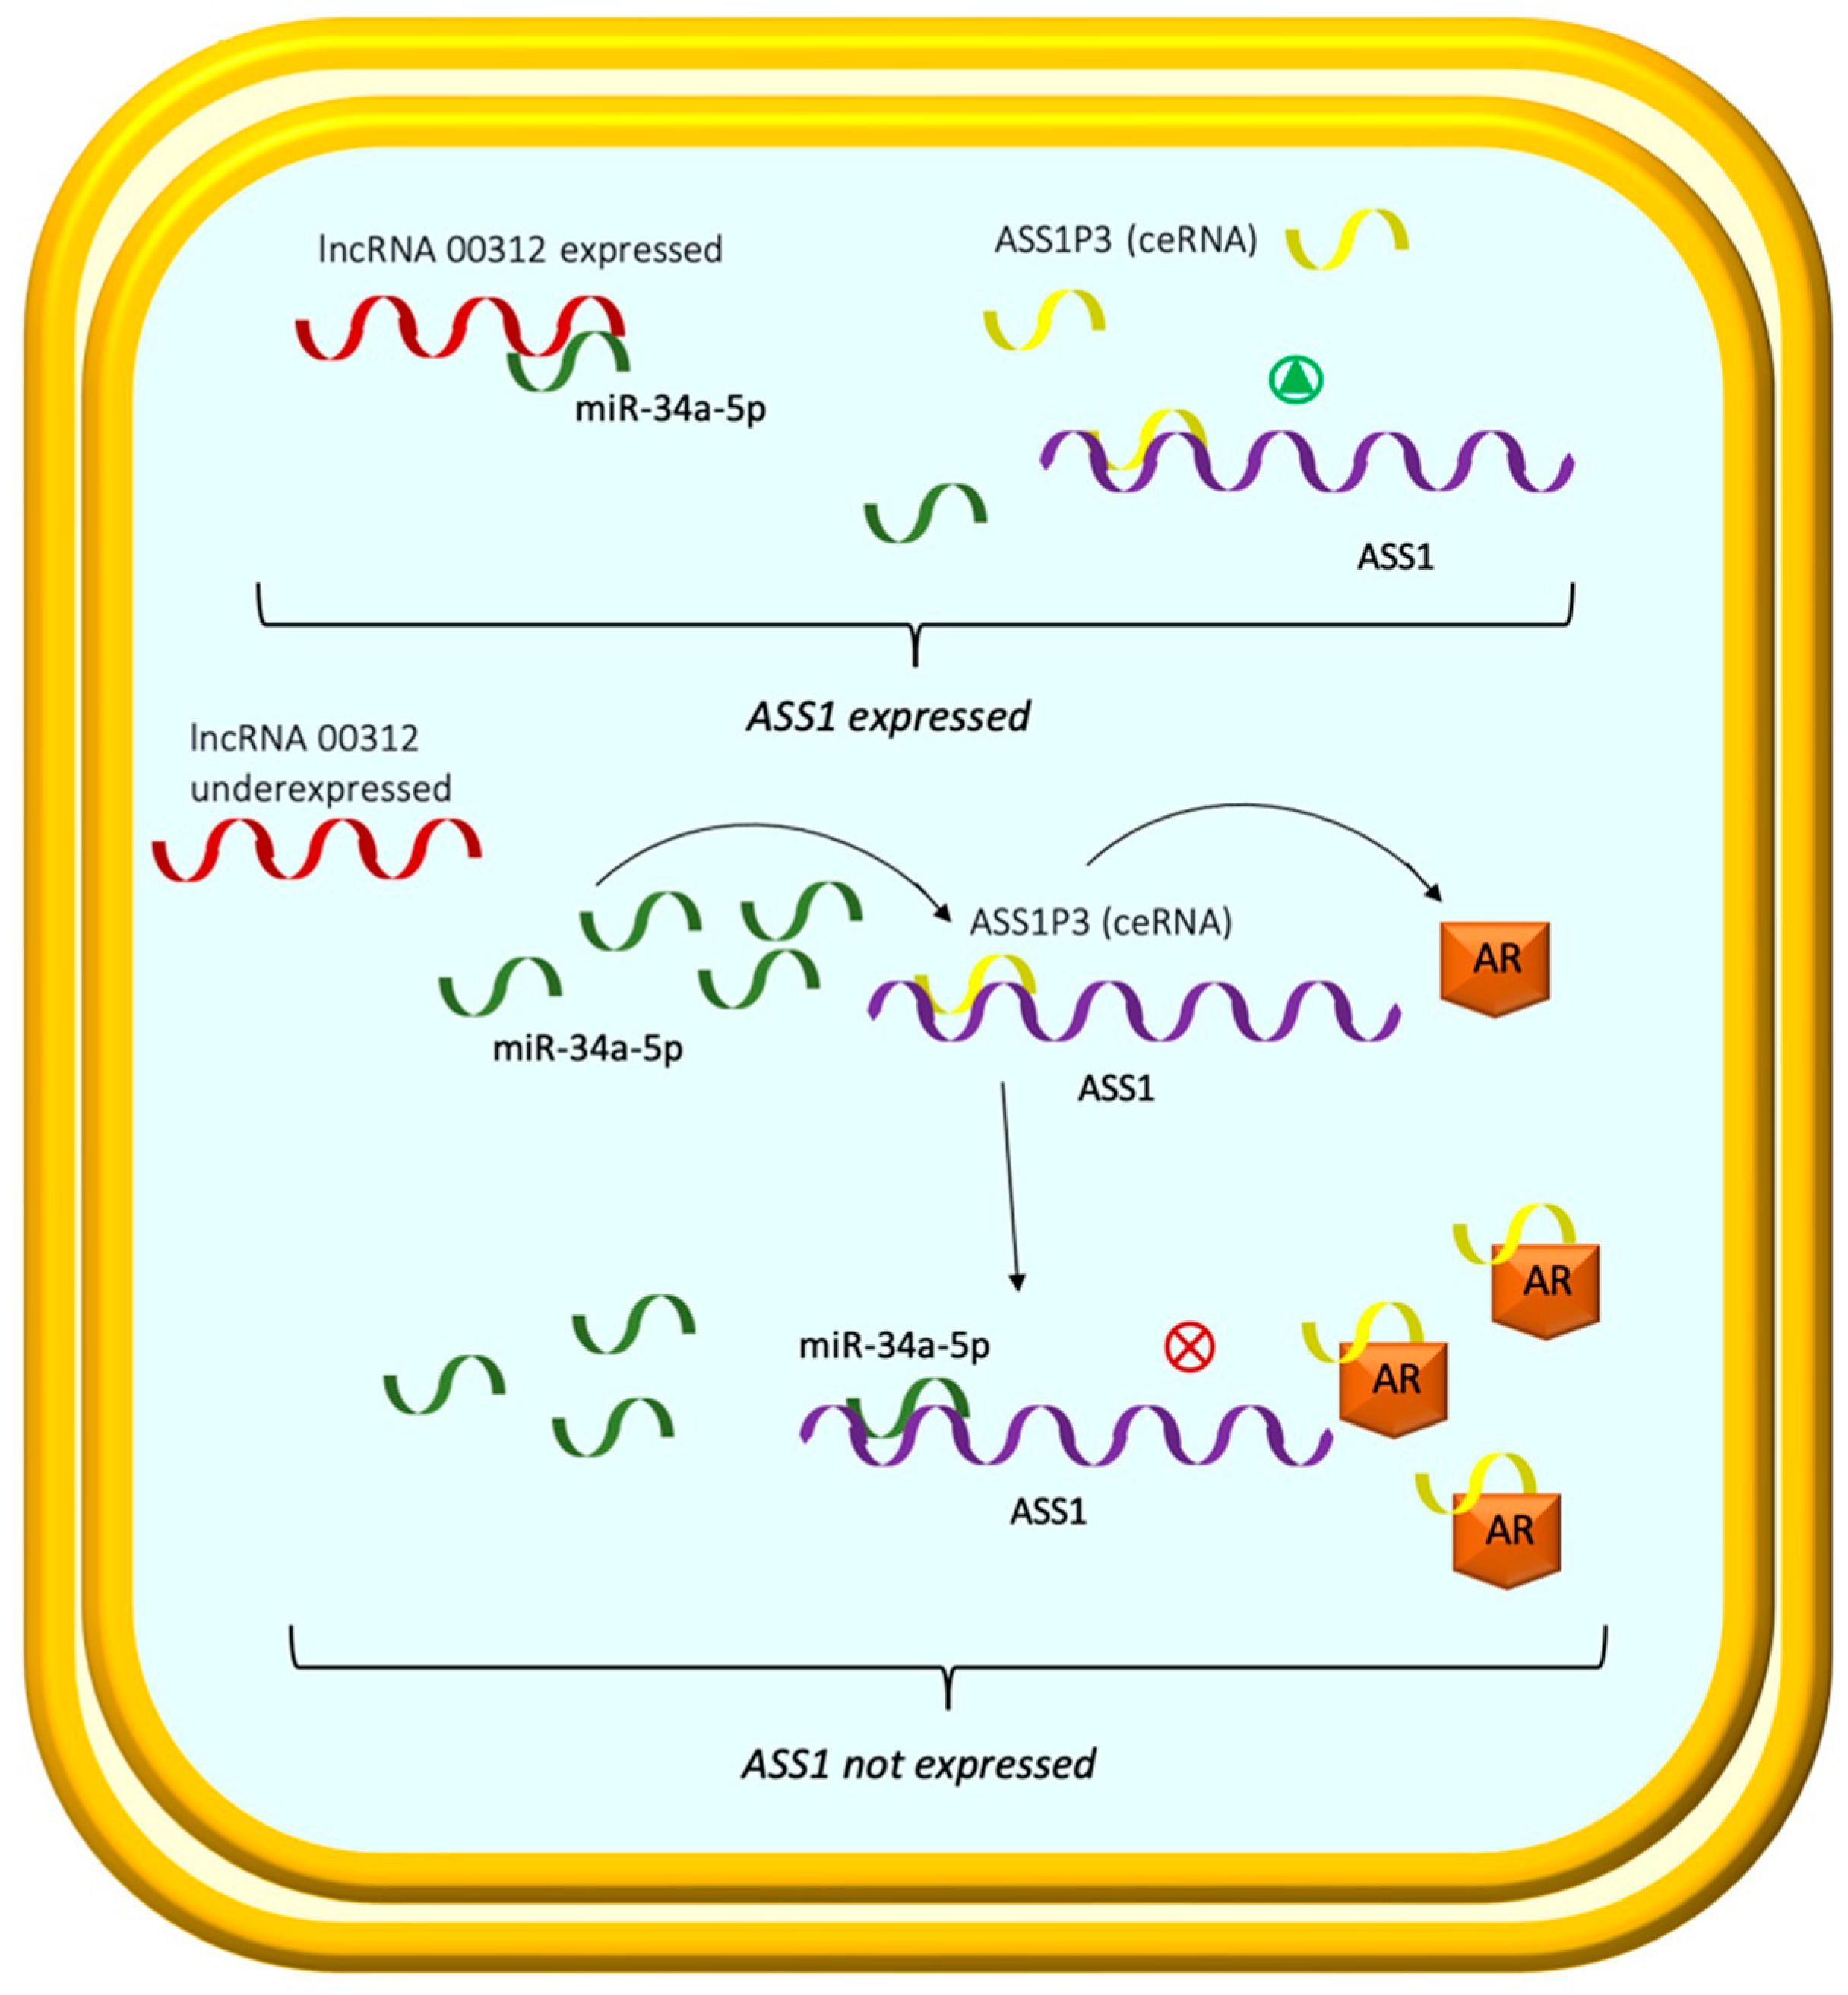
2.5. Arginine and miR-34a-5p/ASS1 Axis
3. Metabolomic Biomarkers in Tumor Staging and Drug Efficacy
4. Future Perspectives
5. Conclusions
Author Contributions
Funding
Institutional Review Board Statement
Informed Consent Statement
Data Availability Statement
Conflicts of Interest
References
- Siegel, R.L.; Miller, K.D.; Fuchs, H.E.; Jemal, A. Cancer statistics, 2022. CA Cancer J. Clin. 2022, 72, 7–33. [Google Scholar] [CrossRef] [PubMed]
- Wei, J.-H.; Feng, Z.-H.; Cao, Y.; Zhao, H.-W.; Chen, Z.-H.; Liao, B.; Wang, Q.; Han, H.; Zhang, J.; Xu, Y.-Z.; et al. Predictive value of single-nucleotide polymorphism signature for recurrence in localised renal cell carcinoma: A retrospective analysis and multicentre validation study. Lancet Oncol. 2019, 20, 591–600. [Google Scholar] [CrossRef]
- Battaglia, M.; Lucarelli, G. The role of renal surgery in the era of targeted therapy: The urologist’s perspective. Urologia 2015, 82, 137–138. [Google Scholar] [CrossRef] [PubMed]
- Di Lorenzo, G.; De Placido, S.; Pagliuca, M.; Ferro, M.; Lucarelli, G.; Rossetti, S.; Bosso, D.; Puglia, L.; Pignataro, P.; Ascione, I.; et al. The evolving role of monoclonal antibodies in the treatment of patients with advanced renal cell carcinoma: A systematic review. Exp. Opin. Biol. Ther. 2016, 16, 1387–1401. [Google Scholar] [CrossRef] [Green Version]
- Tamma, R.; Rutigliano, M.; Lucarelli, G.; Annese, T.; Ruggieri, S.; Cascardi, E.; Napoli, A.; Battaglia, M.; Ribatti, D. Microvascular density, macrophages, and mast cells in human clear cell renal carcinoma with and without bevacizumab treatment. Urol. Oncol. 2019, 37, 355.e11–355.e19. [Google Scholar] [CrossRef]
- Testa, U.; Pelosi, E.; Castelli, G. Genetic alterations in renal cancers: Identification of the mechanisms underlying cancer initiation and progression and of therapeutic targets. Medicines 2020, 7, 44. [Google Scholar] [CrossRef]
- Ragone, R.; Sallustio, F.; Piccinonna, S.; Rutigliano, M.; Vanessa, G.; Palazzo, S.; Lucarelli, G.; Ditonno, P.; Battaglia, M.; Fanizzi, F.P.; et al. Renal cell carcinoma: A study through NMR-based metabolomics combined with transcriptomics. Diseases 2016, 4, 7. [Google Scholar] [CrossRef] [Green Version]
- Forbes, S.A.; Beare, D.; Boutselakis, H.; Bamford, S.; Bindal, N.; Tate, J.; Cole, C.G.; Ward, S.; Dawson, E.; Ponting, L.; et al. COSMIC: Somatic cancer genetics at high-resolution. Nucleic Acids Res. 2017, 45, D777–D783. [Google Scholar] [CrossRef]
- Cancer Genome Atlas Research Network. Comprehensive molecular characterization of clear cell renal cell carcinoma. Nature 2013, 499, 43–49. [Google Scholar] [CrossRef] [Green Version]
- Gnarra, J.; Tory, K.; Weng, Y.; Schmidt, L.; Wei, M.; Li, H.; Latif, F.; Liu, S.; Chen, F.; Duh, F.-M.; et al. Mutations of the VHL tumour suppressor gene in renal carcinoma. Nat. Genet. 1994, 7, 85–90. [Google Scholar] [CrossRef]
- Mehdi, A.; Riazalhosseini, Y. Epigenome aberrations: Emerging driving factors of the clear cell renal cell carcinoma. Int. J. Mol. Sci. 2017, 18, 1774. [Google Scholar] [CrossRef] [Green Version]
- Hakimi, A.A.; Voss, M.H. Genomic classifiers in renal cell carcinoma. Eur. Urol. 2018, 73, 770–771. [Google Scholar] [CrossRef] [PubMed]
- Hakimi, A.A.; Pham, C.G.; Hsieh, J.J. A clear picture of renal cell carcinoma. Nat. Genet. 2013, 45, 849–850. [Google Scholar] [CrossRef] [PubMed]
- Sato, Y.; Yoshizato, T.; Shiraishi, Y.; Maekawa, S.; Okuno, Y.; Kamura, T.; Shimamura, T.; Sato-Otsubo, A.; Nagae, G.; Suzuki, H.; et al. Integrated molecular analysis of clear-cell renal cell carcinoma. Nat. Genet. 2013, 45, 860–867. [Google Scholar] [CrossRef] [PubMed]
- Cerami, E.; Gao, J.; Dogrusoz, U.; Gross, B.E.; Sumer, S.O.; Aksoy, B.A.; Jacobsen, A.; Byrne, C.J.; Heuer, M.L.; Larsson, E.; et al. The cBio cancer genomics portal: An open platform for exploring multidimensional cancer genomics data. Cancer Discov. 2012, 2, 401–404, Correction: Cancer Discov. 2012, 2, 960. [Google Scholar] [CrossRef] [Green Version]
- Gao, J.; Aksoy, B.A.; Dogrusoz, U.; Dresdner, G.; Gross, B.E.; Sumer, S.O.; Sun, Y.; Jacobsen, A.; Sinha, R.; Larsson, E.; et al. Integrative analysis of complex cancer genomics and clinical profiles using the cBioPortal. Sci. Signal. 2013, 6, pl1. [Google Scholar] [CrossRef] [Green Version]
- Kim, H.S.; Kim, J.H.; Jang, H.J.; Han, B.; Zang, D.Y. Clinicopathologic significance of VHL gene alteration in clear-cell renal cell carcinoma: An updated meta-analysis and review. Int. J. Mol. Sci. 2018, 19, 2529. [Google Scholar] [CrossRef]
- Fan, D.; Liu, Q.; Wu, F.; Liu, N.; Qu, H.; Yuan, Y.; Li, Y.; Gao, H.; Ge, J.; Xu, Y.; et al. Prognostic significance of PI3K/AKT/ mTOR signaling pathway members in clear cell renal cell carcinoma. PeerJ 2020, 8, e9261. [Google Scholar] [CrossRef]
- Guo, H.; German, P.; Bai, S.; Barnes, S.; Guo, W.; Qi, X.; Lou, H.; Liang, J.; Jonasch, E.; Mills, G.B.; et al. The PI3K/AKT pathway and renal cell carcinoma. J. Genet. Genom. 2015, 42, 343–353. [Google Scholar] [CrossRef] [Green Version]
- Makhov, P.; Joshi, S.; Ghatalia, P.; Kutikov, A.; Uzzo, R.G.; Kolenko, V.M. Resistance to systemic therapies in clear cell renal cell carcinoma: Mechanisms and management strategies. Mol. Cancer Ther. 2018, 17, 1355–1364. [Google Scholar] [CrossRef]
- Zhang, J.; Zhang, Q. VHL and hypoxia signaling: Beyond HIF in cancer. Biomedicines 2018, 6, 35. [Google Scholar] [CrossRef] [PubMed] [Green Version]
- Sanchez, D.J.; Simon, M.C. Genetic and metabolic hallmarks of clear cell renal cell carcinoma. Biochim. Biophys. Acta Rev. Cancer 2018, 1870, 23–31. [Google Scholar] [CrossRef] [PubMed]
- Büscheck, F.; Fraune, C.; Simon, R.; Kluth, M.; Hube-Magg, C.; Möller-Koop, C.; Sarper, I.; Ketterer, K.; Henke, T.; Eichelberg, C.; et al. Prevalence and clinical significance of VHL mutations and 3p25 deletions in renal tumor subtypes. Oncotarget 2020, 11, 237–249. [Google Scholar] [CrossRef] [Green Version]
- van de Pol, J.A.A.; Ferronika, P.; Westers, H.; van Engeland, M.; Terpstra, M.M.; Smits, K.M.; de Lange, K.; Brandt, P.A.V.D.; Sijmons, R.H.; Schouten, L.J.; et al. Evaluation of a seven gene mutational profile as a prognostic factor in a population-based study of clear cell renal cell carcinoma. Sci. Rep. 2022, 12, 6478. [Google Scholar] [CrossRef] [PubMed]
- Shim, E.-H.; Livi, C.B.; Rakheja, D.; Tan, J.; Benson, D.; Parekh, V.; Kho, E.-Y.; Ghosh, A.P.; Kirkman, R.; Velu, S.; et al. L-2-hydroxyglutarate: An epigenetic modifier and putative oncometabolite in renal cancer. Cancer Discov. 2014, 4, 1290–1298. [Google Scholar] [CrossRef] [Green Version]
- Vavallo, A.; Simone, S.; Lucarelli, G.; Rutigliano, M.; Galleggiante, V.; Grandaliano, G.; Gesualdo, L.; Campagna, M.; Cariello, M.; Ranieri, E.; et al. Pre-existing type 2 diabetes mellitus is an independent risk factor for mortality and progression in patients with renal cell carcinoma. Medicine 2014, 93, e183. [Google Scholar] [CrossRef]
- Lucarelli, G.; Galleggiante, V.; Rutigliano, M.; Vavallo, A.; Ditonno, P.; Battaglia, M. Isolation and characterization of cancer stem cells in renal cell carcinoma. Urologia 2015, 82, 46–53. [Google Scholar] [CrossRef]
- Galleggiante, V.; Rutigliano, M.; Sallustio, F.; Ribatti, D.; Ditonno, P.; Bettocchi, C.; Selvaggi, F.P.; Lucarelli, G.; Battaglia, M. CTR2 identifies a population of cancer cells with stem cell-like features in patients with clear cell renal cell carcinoma. J. Urol. 2014, 192, 1831–1841. [Google Scholar] [CrossRef]
- Breda, A.; Lucarelli, G.; Rodriguez-Faba, O.; Guirado, L.; Facundo, C.; Bettocchi, C.; Gesualdo, L.; Castellano, G.; Grandaliano, G.; Battaglia, M.; et al. Clinical and pathological outcomes of renal cell carcinoma (RCC) in native kidneys of patients with end-stage renal disease: A long-term comparative retrospective study with RCC diagnosed in the general population. World J. Urol. 2015, 33, 1–7, Correction: World J. Urol. 2015, 33, 9. [Google Scholar] [CrossRef]
- Pandolfo, S.D.; Carbonara, U.; Beksac, A.T.; Derweesh, I.; Celia, A.; Schiavina, R.; Elbich, J.; Basile, G.; Hampton, L.J.; Cerrato, C.; et al. Microwave versus cryoablation and radiofrequency ablation for small renal mass: A multicenter comparative analysis. Minerva Urol. Nephrol. 2022; ahead of print. [Google Scholar] [CrossRef]
- Pandolfo, S.D.; Loizzo, D.; Beksac, A.T.; Derweesh, I.; Celia, A.; Bianchi, L.; Elbich, J.; Costa, G.; Carbonara, U.; Lucarelli, G.; et al. Percutaneous thermal ablation for cT1 renal mass in solitary kidney: A multicenter trifecta comparative analysis versus robot-assisted partial nephrectomy. Eur. J. Surg. Oncol. 2022; ahead of print. [Google Scholar] [CrossRef]
- Zhang, H.; Yu, L.; Chen, J.; Liu, L.; Yang, X.; Cui, H.; Yue, G. Role of metabolic reprogramming of long non-coding RNA in clear cell renal cell carcinoma. J. Cancer 2022, 13, 691–705. [Google Scholar] [CrossRef]
- Lucarelli, G.; Loizzo, D.; Franzin, R.; Battaglia, S.; Ferro, M.; Cantiello, F.; Castellano, G.; Bettocchi, C.; Ditonno, P.; Battaglia, M. Metabolomic insights into pathophysiological mechanisms and biomarker discovery in clear cell renal cell carcinoma. Exp. Rev. Mol. Diagn. 2019, 19, 397–407. [Google Scholar] [CrossRef] [PubMed]
- De la Cruz-López, K.G.; Castro-Muñoz, L.J.; Reyes-Hernández, D.O.; García-Carrancá, A.; Manzo-Merino, J. Lactate in the regulation of tumor microenvironment and therapeutic approaches. Front. Oncol. 2019, 9, 1143. [Google Scholar] [CrossRef] [Green Version]
- Wang, L.; Xiong, H.; Wu, F.; Zhang, Y.; Wang, J.; Zhao, L.; Guo, X.; Chang, L.-J.; Zhang, Y.; You, M.J.; et al. Hexokinase 2-mediated Warburg effect is required for PTEN- and p53-deficiency-driven prostate cancer growth. Cell Rep. 2014, 8, 1461–1474. [Google Scholar] [CrossRef] [PubMed] [Green Version]
- Mayer, A.; Schmidt, M.; Seeger, A.; Serras, A.F.; Vaupel, P.; Schmidberger, H. GLUT-1 expression is largely unrelated to both hypoxia and the Warburg phenotype in squamous cell carcinomas of the vulva. BMC Cancer 2014, 14, 760. [Google Scholar] [CrossRef] [PubMed] [Green Version]
- Fantin, V.R.; St-Pierre, J.; Leder, P. Attenuation of LDH-A expression uncovers a link between glycolysis, mitochondrial physiology, and tumor maintenance. Cancer Cell. 2006, 9, 425–434, Correction: Cancer Cell. 2006, 10, 172. [Google Scholar] [CrossRef] [Green Version]
- Shim, H.; Dolde, C.; Lewis, B.C.; Wu, C.-S.; Dang, G.; Jungmann, R.A.; Dalla-Favera, R.; Dang, C.V. c-Myc transactivation of LDH-A: Implications for tumor metabolism and growth. Proc. Natl. Acad. Sci. USA 1997, 94, 6658–6663. [Google Scholar] [CrossRef] [Green Version]
- Johnson, R.F.; Perkins, N.D. Nuclear factor-κB, p53, and mitochondria: Regulation of cellular metabolism and the Warburg effect. Trends Biochem. Sci. 2012, 37, 317–324. [Google Scholar] [CrossRef]
- Lu, H.; Forbes, R.A.; Verma, A. Hypoxia-inducible factor 1 activation by aerobic glycolysis implicates the Warburg effect in carcinogenesis. J. Biol. Chem. 2002, 277, 23111–23115. [Google Scholar] [CrossRef]
- Ward, P.S.; Thompson, C.B. Metabolic reprogramming: A cancer hallmark even Warburg did not anticipate. Cancer Cell. 2012, 21, 297–308. [Google Scholar] [CrossRef] [Green Version]
- Warburg, O. On respiratory impairment in cancer cells. Science 1956, 124, 269–270. [Google Scholar] [CrossRef]
- Warburg, O. On the origin of cancer cells. Science 1956, 123, 309–314. [Google Scholar] [CrossRef] [PubMed]
- San-Millán, I.; Brooks, G.A. Reexamining cancer metabolism: Lactate production for carcinogenesis could be the purpose and explanation of the Warburg Effect. Carcinogenesis 2017, 38, 119–133. [Google Scholar] [CrossRef] [Green Version]
- Doherty, J.R.; Cleveland, J.L. Targeting lactate metabolism for cancer therapeutics. J. Clin. Investig. 2013, 123, 3685–3692. [Google Scholar] [CrossRef] [PubMed]
- Lucarelli, G.; Galleggiante, V.; Rutigliano, M.; Sanguedolce, F.; Cagiano, S.; Bufo, P.; Lastilla, G.; Maiorano, E.; Ribatti, D.; Giglio, A.; et al. Metabolomic profile of glycolysis and the pentose phosphate pathway identifies the central role of glucose-6-phosphate dehydrogenase in clear cell-renal cell carcinoma. Oncotarget 2015, 6, 13371–13386. [Google Scholar] [CrossRef] [PubMed] [Green Version]
- Gao, H.; Dong, B.; Jia, J.; Zhu, H.; Diao, C.; Yan, Z.; Huang, Y.; Li, X. Application of ex vivo 1H NMR metabonomics to the characterization and possible detection of renal cell carcinoma metastases. J. Cancer Res. Clin. Oncol. 2012, 138, 753–761. [Google Scholar] [CrossRef] [PubMed]
- Dong, B.; Gao, Y.; Kang, X.; Gao, H.; Zhang, J.; Guo, H.; You, M.J.; Xue, W.; Cheng, J.; Huang, Y. SENP1 promotes proliferation of clear cell renal cell carcinoma through activation of glycolysis. Oncotarget 2016, 7, 80435–80449. [Google Scholar] [CrossRef] [Green Version]
- Lucarelli, G.; Ferro, M.; Loizzo, D.; Bianchi, C.; Terracciano, D.; Cantiello, F.; Bell, L.N.; Battaglia, S.; Porta, C.; Gernone, A.; et al. Integration of lipidomics and transcriptomics reveals reprogramming of the lipid metabolism and composition in clear cell renal cell carcinoma. Metabolites 2020, 10, 509. [Google Scholar] [CrossRef]
- Saito, K.; Arai, E.; Maekawa, K.; Ishikawa, M.; Fujimoto, H.; Taguchi, R.; Matsumoto, K.; Kanai, Y.; Saito, Y. Lipidomic signatures and associated transcriptomic profiles of clear cell renal cell carcinoma. Sci. Rep. 2016, 6, 28932. [Google Scholar] [CrossRef]
- Lucarelli, G.; Rutigliano, M.; Ferro, M.; Giglio, A.; Intini, A.; Triggiano, F.; Palazzo, S.; Gigante, M.; Castellano, G.; Ranieri, E.; et al. Activation of the kynurenine pathway predicts poor outcome in patients with clear cell renal cell carcinoma. Urol Oncol. 2017, 35, 461.e15–461.e27. [Google Scholar] [CrossRef]
- Liu, X.; Zhang, M.; Liu, X.; Sun, H.; Guo, Z.; Tang, X.; Wang, Z.; Li, J.; Li, H.; Sun, W.; et al. Urine metabolomics for renal cell carcinoma (RCC) prediction: Tryptophan metabolism as an important pathway in RCC. Front. Oncol. 2019, 9, 663. [Google Scholar] [CrossRef] [Green Version]
- Certo, M.; Tsai, C.H.; Pucino, V.; Ho, P.C.; Mauro, C. Lactate modulation of immune responses in inflammatory versus tumour microenvironments. Nat. Rev. Immunol. 2021, 21, 151–161. [Google Scholar] [CrossRef] [PubMed]
- Hirschhaeuser, F.; Sattler, U.G.; Mueller-Klieser, W. Lactate: A metabolic key player in cancer. Cancer Res. 2011, 71, 6921–6925. [Google Scholar] [CrossRef] [PubMed] [Green Version]
- Ippolito, L.; Morandi, A.; Giannoni, E.; Chiarugi, P. Lactate: A metabolic driver in the tumour landscape. Trends Biochem. Sci. 2019, 44, 153–166. [Google Scholar] [CrossRef] [PubMed]
- Zhao, J.; Huang, X.; Xu, Z.; Dai, J.; He, H.; Zhu, Y.; Wang, H. LDHA promotes tumor metastasis by facilitating epithelial-mesenchymal transition in renal cell carcinoma. Mol. Med. Rep. 2017, 16, 8335–8344. [Google Scholar] [CrossRef] [Green Version]
- Girgis, H.; Masui, O.; White, N.M.; Scorilas, A.; Rotondo, F.; Seivwright, A.; Gabril, M.; Filter, E.R.; Girgis, A.H.; A Bjarnason, G.; et al. Lactate dehydrogenase A is a potential prognostic marker in clear cell renal cell carcinoma. Mol. Cancer 2014, 13, 101. [Google Scholar] [CrossRef] [Green Version]
- Sun, Z.; Tao, W.; Guo, X.; Jing, C.; Zhang, M.; Wang, Z.; Kong, F.; Suo, N.; Jiang, S.; Wang, H. Construction of a lactate-related prognostic signature for predicting prognosis, tumor microenvironment, and immune response in kidney renal clear cell carcinoma. Front. Immunol. 2022, 13, 818984. [Google Scholar] [CrossRef]
- Popa, F.I.; Perlini, S.; Teofoli, F.; Degani, D.; Funghini, S.; La Marca, G.; Rinaldo, P.; Vincenzi, M.; Antoniazzi, F.; Boner, A.; et al. 3-hydroxyacyl-coenzyme a dehydrogenase deficiency: Identification of a new mutation causing hyperinsulinemic hypoketotic hypoglycemia, altered organic acids and acylcarnitines concentrations. JIMD Rep. 2012, 2, 71–77. [Google Scholar] [CrossRef] [Green Version]
- Wei, J.; Xie, Q.; Liu, X.; Wan, C.; Wu, W.; Fang, K.; Yao, Y.; Cheng, P.; Deng, D.; Liu, Z. Identification the prognostic value of glutathione peroxidases expression levels in acute myeloid leukemia. Ann. Transl. Med. 2020, 8, 678. [Google Scholar] [CrossRef]
- Ren, J.; Feng, J.; Song, W.; Wang, C.; Ge, Y.; Fu, T. Development and validation of a metabolic gene signature for predicting overall survival in patients with colon cancer. Clin. Exp. Med. 2020, 20, 535–544. [Google Scholar] [CrossRef]
- Shen, C.; Song, Y.-H.; Xie, Y.; Wang, X.; Wang, Y.; Wang, C.; Liu, S.; Xue, S.-L.; Li, Y.; Liu, B.; et al. Downregulation of HADH promotes gastric cancer progression via Akt signaling pathway. Oncotarget 2017, 8, 76279–76289. [Google Scholar] [CrossRef] [Green Version]
- Jiang, H.; Chen, H.; Wan, P.; Chen, N. Decreased expression of HADH is related to poor prognosis and immune infiltration in kidney renal clear cell carcinoma. Genomics 2021, 113, 3556–3564. [Google Scholar] [CrossRef] [PubMed]
- Guillem, V.; Hernández-Boluda, J.C.; Gallardo, D.; Buño, I.; Bosch, A.; Martínez-Laperche, C.; de la Cámara, R.; Brunet, S.; Martin, C.; Nieto, J.B.; et al. A polymorphism in the TYMP gene is associated with the outcome of HLA-identical sibling allogeneic stem cell transplantation. Am. J. Hematol. 2013, 88, 883–889. [Google Scholar] [CrossRef] [PubMed]
- Li, W.; Yue, H. Thymidine phosphorylase: A potential new target for treating cardiovascular disease. Trends Cardiovasc. Med. 2018, 28, 157–171. [Google Scholar] [CrossRef]
- Slager, E.H.; Honders, M.W.; van der Meijden, E.D.; van Luxemburg-Heijs, S.A.P.; Kloosterboer, F.M.; Kester, M.G.D.; Jedema, I.; Marijt, W.A.E.; Schaafsma, M.R.; Willemze, R.; et al. Identification of the angiogenic endothelial-cell growth factor-1/thymidine phosphorylase as a potential target for immunotherapy of cancer. Blood 2006, 107, 4954–4960. [Google Scholar] [CrossRef] [Green Version]
- Semenza, G.L. Tumor metabolism: Cancer cells give and take lactate. J. Clin. Investig. 2008, 118, 3835–3837. [Google Scholar] [CrossRef] [Green Version]
- Miranda-Gonçalves, V.; Lameirinhas, A.; Macedo-Silva, C.; Lobo, J.; Dias, P.C.; Ferreira, V.; Henrique, R.; Jerónimo, C. Lactate increases renal cell carcinoma aggressiveness through sirtuin 1-dependent epithelial mesenchymal transition axis regulation. Cells 2020, 9, 1053. [Google Scholar] [CrossRef] [Green Version]
- Serrano-Gomez, S.J.; Maziveyi, M.; Alahari, S.K. Regulation of epithelial-mesenchymal transition through epigenetic and post-translational modifications. Mol. Cancer 2016, 15, 18. [Google Scholar] [CrossRef] [Green Version]
- Peixoto, P.; Etcheverry, A.; Aubry, M.; Missey, A.; Lachat, C.; Perrard, J.; Hendrick, E.; Delage-Mourroux, R.; Mosser, J.; Borg, C.; et al. EMT is associated with an epigenetic signature of ECM remodeling genes. Cell Death Dis. 2019, 10, 205. [Google Scholar] [CrossRef]
- Potaczek, D.P.; Miethe, S.; Schindler, V.; Alhamdan, F.; Garn, H. Role of airway epithelial cells in the development of different asthma phenotypes. Cell Signal. 2020, 69, 109523. [Google Scholar] [CrossRef]
- Simic, P.; Williams, E.O.; Bell, E.L.; Gong, J.J.; Bonkowski, M.; Guarente, L. SIRT1 suppresses the epithelial-to-mesenchymal transition in cancer metastasis and organ fibrosis. Cell Rep. 2013, 3, 1175–1186. [Google Scholar] [CrossRef] [Green Version]
- Avalos, J.L.; Bever, K.M.; Wolberger, C. Mechanism of sirtuin inhibition by nicotinamide: Altering the NAD+ cosubstrate specificity of a Sir2 enzyme. Mol. Cell 2005, 17, 855–868. [Google Scholar] [CrossRef] [PubMed]
- Yang, Y.-C.; Piek, E.; Zavadil, J.; Liang, D.; Xie, D.; Heyer, J.; Pavlidis, P.; Kucherlapati, R.; Roberts, A.B.; Böttinger, E.P. Hierarchical model of gene regulation by transforming growth factor beta. Proc. Natl. Acad. Sci. USA 2003, 100, 10269–10274. [Google Scholar] [CrossRef] [PubMed] [Green Version]
- Rasti, A.; Madjd, Z.; Zanjani, L.S.; Babashah, S.; Abolhasani, M.; Asgari, M.; Mehrazma, M. SMAD4 expression in renal cell carcinomas correlates with a stem-cell phenotype and poor clinical outcomes. Front. Oncol. 2021, 11, 581172. [Google Scholar] [CrossRef] [PubMed]
- Lichner, Z.; Mejia-Guerrero, S.; Ignacak, M.; Krizova, A.; Bao, T.T.; Girgis, A.H.; Youssef, Y.M.; Yousef, G.M. Pleiotropic action of renal cell carcinoma-dysregulated miRNAs on hypoxia-related signaling pathways. Am. J. Pathol. 2012, 180, 1675–1687. [Google Scholar] [CrossRef]
- Dasgupta, P.; Kulkarni, P.; Majid, S.; Shahryari, V.; Hashimoto, Y.; Bhat, N.S.; Shiina, M.; Deng, G.; Saini, S.; Tabatabai, Z.L.; et al. MicroRNA-203 inhibits long noncoding RNA HOTAIR and regulates tumorigenesis through epithelial-to-mesenchymal transition pathway in renal cell carcinoma. Mol. Cancer Ther. 2018, 17, 1061–1069. [Google Scholar] [CrossRef] [Green Version]
- Katayama, H.; Tamai, K.; Shibuya, R.; Nakamura, M.; Mochizuki, M.; Yamaguchi, K.; Kawamura, S.; Tochigi, T.; Sato, I.; Okanishi, T.; et al. Long non-coding RNA HOTAIR promotes cell migration by upregulating insulin growth factor-binding protein 2 in renal cell carcinoma. Sci. Rep. 2017, 7, 12016. [Google Scholar] [CrossRef] [Green Version]
- Ozcan, A.; Shen, S.S.; Zhai, Q.J.; Truong, L.D. Expression of GLUT1 in primary renal tumors: Morphologic and biologic implications. Am. J. Clin. Pathol. 2007, 128, 245–254. [Google Scholar] [CrossRef]
- Singer, K.; Kastenberger, M.; Gottfried, E.; Hammerschmied, C.G.; Büttner, M.; Aigner, M.; Seliger, B.; Walter, B.; Schlösser, H.; Hartmann, A.; et al. Warburg phenotype in renal cell carcinoma: High expression of glucose-transporter 1 (GLUT-1) correlates with low CD8+ T-cell infiltration in the tumor. Int. J. Cancer 2011, 128, 2085–2095. [Google Scholar] [CrossRef]
- Fischer, K.; Hoffmann, P.; Voelkl, S.; Meidenbauer, N.; Ammer, J.; Edinger, M.; Gottfried, E.; Schwarz, S.; Rothe, G.; Hoves, S.; et al. Inhibitory effect of tumor cell-derived lactic acid on human T cells. Blood 2007, 109, 3812–3819. [Google Scholar] [CrossRef] [Green Version]
- Miyakita, H.; Tokunaga, M.; Onda, H.; Usui, Y.; Kinoshita, H.; Kawamura, N.; Yasuda, S. Significance of 18F-fluorodeoxyglucose positron emission tomography (FDG-PET) for detection of renal cell carcinoma and immunohistochemical glucose transporter 1 (GLUT-1) expression in the cancer. Int. J. Urol. 2002, 9, 15–18. [Google Scholar] [CrossRef]
- Kobayashi, M.; Uematsu, T.; Tokura, Y.; Takei, K.; Sakamoto, K.; Narimatsu, T.; Nukui, A.; Kamai, T. Immunohistochemical expressionof sodium-dependent glucose transporter-2 (SGLT-2) in clear cell renal carcinoma: Possible prognostic implications. Int. Braz. J. Urol. 2019, 45, 169–178. [Google Scholar] [CrossRef] [PubMed] [Green Version]
- Linden, K.C.; DeHaan, C.L.; Zhang, Y.; Glowacka, S.; Cox, A.J.; Kelly, D.J.; Rogers, S. Renal expression and localization of the facilitative glucose transporters GLUT1 and GLUT12 in animal models of hypertension and diabetic nephropathy. Am. J. Physiol. Renal Physiol. 2006, 290, F205–F213. [Google Scholar] [CrossRef] [PubMed] [Green Version]
- Ishikawa, N.; Oguri, T.; Isobe, T.; Fujitaka, K.; Kohno, N. SGLT gene expression in primary lung cancers and their metastatic lesions. Jpn. J. Cancer Res. 2001, 92, 874–879. [Google Scholar] [CrossRef] [PubMed]
- Helmke, B.M.; Reisser, C.; Idzko, M.; Dyckhoff, G.; Herold-Mende, C. Expression of SGLT-1 in preneoplastic and neoplastic lesions of the head and neck. Oral. Oncol. 2004, 40, 28–35, Erratum in Oral. Oncol. 2004, 40, 654. [Google Scholar] [CrossRef]
- Casneuf, V.F.; Fonteyne, P.; Van Damme, N.; Demetter, P.; Pauwels, P.; De Hemptinne, B.; De Vos, M.; Van De Wiele, C.; Peeters, M. Expression of SGLT1, Bcl-2 and p53 in primary pancreatic cancer related to survival. Cancer Investig. 2008, 26, 852–859. [Google Scholar] [CrossRef]
- Perez, M.; Praena-Fernandez, J.M.; Felipe-Abrio, B.; Lopez-García, M.A.; Lucena-Cacace, A.; Garcia, A.; Lleonart, M.; Roncador, G.; Marin, J.J.; Carnero, A. MAP17 and SGLT1 protein expression levels as prognostic markers for cervical tumor patient survival. PLoS ONE 2013, 8, e56169. [Google Scholar] [CrossRef] [Green Version]
- Lai, B.; Xiao, Y.; Pu, H.; Cao, Q.; Jing, H.; Liu, X. Overexpression of SGLT1 is correlated with tumor development and poor prognosis of ovarian carcinoma. Arch. Gynecol. Obstet. 2012, 285, 1455–1461. [Google Scholar] [CrossRef]
- Guo, G.F.; Cai, Y.C.; Zhang, B.; Xu, R.H.; Qiu, H.J.; Xia, L.P.; Jiang, W.Q.; Hu, P.L.; Chen, X.X.; Zhou, F.F.; et al. Overexpression of SGLT1 and EGFR in colorectal cancer showing a correlation with the prognosis. Med. Oncol. 2011, 28 (Suppl. 1), S197–S203. [Google Scholar] [CrossRef]
- Scafoglio, C.; Hirayama, B.A.; Kepe, V.; Liu, J.; Ghezzi, C.; Satyamurthy, N.; Moatamed, N.A.; Huang, J.; Koepsell, H.; Barrio, J.R.; et al. Functional expression of sodium-glucose transporters in cancer. Proc. Natl. Acad. Sci. USA 2015, 112, E4111–E4119. [Google Scholar] [CrossRef] [Green Version]
- Kim, Y.; Choi, J.W.; Lee, J.H.; Kim, Y.S. Expression of lactate/H+ symporters MCT1 and MCT4 and their chaperone CD147 predicts tumor progression in clear cell renal cell carcinoma: Immunohistochemical and The Cancer Genome Atlas data analyses. Hum. Pathol. 2015, 46, 104–112. [Google Scholar] [CrossRef]
- Fisel, P.; Kruck, S.; Winter, S.; Bedke, J.; Hennenlotter, J.; Nies, A.T.; Scharpf, M.; Fend, F.; Stenzl, A.; Schwab, M.; et al. DNA methylation of the SLC16A3 promoter regulates expression of the human lactate transporter MCT4 in renal cancer with consequences for clinical outcome. Clin. Cancer Res. 2013, 19, 5170–5181. [Google Scholar] [CrossRef] [PubMed] [Green Version]
- Pinheiro, C.; Longatto-Filho, A.; Ferreira, L.; Pereira, S.M.M.; Etlinger, D.; Moreira, M.A.R.; Jubé, L.F.; Queiroz, G.S.; Schmitt, F.; Baltazar, F. Increasing expression of monocarboxylate transporters 1 and 4 along progression to invasive cervical carcinoma. Int. J. Gynecol. Pathol. 2008, 27, 568–574. [Google Scholar] [CrossRef] [PubMed]
- Yoo, A.; Lee, H.; Jung, J.; Koh, S.S.; Lee, S. Monocarboxylate transporter 9 (MCT9) is down-regulated in renal cell carcinoma. Genes Genom. 2021, 43, 351–359. [Google Scholar] [CrossRef] [PubMed]
- Ichida, K.; Matsuo, H.; Takada, T.; Nakayama, A.; Murakami, K.; Shimizu, T.; Yamanashi, Y.; Kasuga, H.; Nakashima, H.; Nakamura, T.; et al. Decreased extra-renal urate excretion is a common cause of hyperuricemia. Nat. Commun. 2012, 3, 764. [Google Scholar] [CrossRef] [PubMed] [Green Version]
- Yang, H.-C.; Wu, Y.-H.; Yen, W.-C.; Liu, H.-Y.; Hwang, T.-L.; Stern, A.; Chiu, D.T.-Y. The redox role of G6PD in cell growth, cell death, and cancer. Cells 2019, 8, 1055. [Google Scholar] [CrossRef] [PubMed] [Green Version]
- Song, J.; Sun, H.; Zhang, S.; Shan, C. The multiple roles of glucose-6-phosphate dehydrogenase in tumorigenesis and cancer chemoresistance. Life 2022, 12, 271. [Google Scholar] [CrossRef]
- Zhang, Q.; Yang, Z.; Han, Q.; Bai, H.; Wang, Y.; Yi, X.; Yi, Z.; Yang, L.; Jiang, L.; Song, X.; et al. G6PD promotes renal cell carcinoma proliferation through positive feedback regulation of p-STAT3. Oncotarget 2017, 8, 109043–109060. [Google Scholar] [CrossRef] [Green Version]
- Fan, T.-F.; Wu, T.-F.; Bu, L.-L.; Ma, S.-R.; Li, Y.-C.; Mao, L.; Sun, Z.-J.; Zhang, W.-F. Dihydromyricetin promotes autophagy and apoptosis through ROS-STAT3 signaling in head and neck squamous cell carcinoma. Oncotarget 2016, 7, 59691–59703. [Google Scholar] [CrossRef]
- Morgan, M.J.; Liu, Z.G. Crosstalk of reactive oxygen species and NF-κB signaling. Cell Res. 2011, 21, 103–115. [Google Scholar] [CrossRef] [Green Version]
- Li, G.; Liao, Y.; Hu, J.; Lu, L.; Zhang, Y.; Li, B.; An, T. Activation of NF-κB pathways mediating the inflammation and pulmonary diseases associated with atmospheric methylamine exposure. Environ. Pollut. 2019, 252 Pt B, 1216–1224. [Google Scholar] [CrossRef]
- Grivennikov, S.I.; Karin, M. Dangerous liaisons: STAT3 and NF-kappaB collaboration and crosstalk in cancer. Cytokine Growth Factor Rev. 2010, 21, 11–19. [Google Scholar] [CrossRef] [PubMed] [Green Version]
- Kim, E.K.; Jang, M.; Song, M.J.; Kim, D.; Kim, Y.; Jang, H.H. Redox-mediated mechanism of chemoresistance in cancer cells. Antioxidants 2019, 8, 471. [Google Scholar] [CrossRef] [PubMed] [Green Version]
- Xian, D.; Lai, R.; Song, J.; Xiong, X.; Zhong, J. Emerging perspective: Role of increased ROS and redox imbalance in skin carcinogenesis. Oxid. Med. Cell Longev. 2019, 2019, 8127362. [Google Scholar] [CrossRef] [PubMed] [Green Version]
- Yoon, S.; Woo, S.U.; Kang, J.H.; Kim, K.; Shin, H.-J.; Gwak, H.-S.; Park, S.; Chwae, Y.-J. NF-κB and STAT3 cooperatively induce IL6 in starved cancer cells. Oncogene 2012, 31, 3467–3481. [Google Scholar] [CrossRef] [PubMed] [Green Version]
- Wang, Y.; Su, J.; Wang, Y.; Fu, D.; Ideozu, J.E.; Geng, H.; Cui, Q.; Wang, C.; Chen, R.; Yu, Y.; et al. The interaction of YBX1 with G3BP1 promotes renal cell carcinoma cell metastasis via YBX1/G3BP1-SPP1-NF-κB signaling axis. J. Exp. Clin. Cancer Res. 2019, 38, 386. [Google Scholar] [CrossRef] [Green Version]
- Lorente, D.; Trilla, E.; Meseguer, A.; Arevalo, J.; Nemours, S.; Planas, J.; Placer, J.; Celma, A.; Salvador, C.; Regis, L.; et al. The role of STAT3 protein as a prognostic factor in the clear cell renal carcinoma. Systematic review. Valor de la proteína STAT3 como factor pronóstico en el carcinoma renal de célula clara. Revisión sistemática. Actas Urol. Esp. (Engl. Ed.) 2019, 43, 118–123. [Google Scholar] [CrossRef]
- Cuadros, T.; Trilla, E.; Sarró, E.; Vilà, M.R.; Vilardell, J.; de Torres, I.; Salcedo, M.; López-Hellin, J.; Sánchez, A.; Cajal, S.R.Y.; et al. HAVCR/KIM-1 activates the IL-6/STAT-3 pathway in clear cell renal cell carcinoma and determines tumor progression and patient outcome. Cancer Res. 2014, 74, 1416–1428. [Google Scholar] [CrossRef] [Green Version]
- Lafarge, S.; Hamzeh-Cognasse, H.; Richard, Y.; Pozzetto, B.; Cogné, M.; Cognasse, F.; Garraud, O. Complexes between nuclear factor-κB p65 and signal transducer and activator of transcription 3 are key actors in inducing activation-induced cytidine deaminase expression and immunoglobulin A production in CD40L plus interleukin-10-treated human blood B cells. Clin. Exp. Immunol. 2011, 166, 171–183. [Google Scholar] [CrossRef]
- Kim, S.J.; Yoon, S. Activated Rac1 regulates the degradation of IκBα and the nuclear translocation of STAT3-NFκB complexes in starved cancer cells. Exp. Mol. Med. 2016, 48, e231. [Google Scholar] [CrossRef] [Green Version]
- Nan, J.; Hu, H.; Sun, Y.; Zhu, L.; Wang, Y.; Zhong, Z.; Zhao, J.; Zhang, N.; Wang, Y.; Wang, Y.; et al. TNFR2 stimulation promotes mitochondrial fusion via Stat3- and NF-kB-dependent activation of OPA1 expression. Circ. Res. 2017, 121, 392–410. [Google Scholar] [CrossRef]
- Ni, Y.; Yang, Z.; Agbana, Y.L.; Bai, H.; Wang, L.; Yang, L.; Yi, Z.; Cheng, J.; Zhang, Q.; Kuang, Y.; et al. Silent information regulator 2 promotes clear cell renal cell carcinoma progression through deacetylation and small ubiquitin-related modifier 1 modification of glucose 6-phosphate dehydrogenase. Cancer Sci. 2021, 112, 4075–4086. [Google Scholar] [CrossRef] [PubMed]
- Zhang, Q.; Han, Q.; Yang, Z.; Ni, Y.; Agbana, Y.L.; Bai, H.; Yi, Z.; Yi, X.; Kuang, Y.; Zhu, Y. G6PD facilitates clear cell renal cell carcinoma invasion by enhancing MMP2 expression through ROS-MAPK axis pathway. Int. J. Oncol. 2020, 57, 197–212. [Google Scholar] [CrossRef] [Green Version]
- Burlaka, A.P.; Ganusevich, I.I.; Gafurov, M.R.; Lukin, S.M.; Sidorik, E.P. Stomach cancer: Interconnection between the redox state, activity of MMP-2, MMP-9 and stage of tumor growth. Cancer Microenviron. 2016, 9, 27–32. [Google Scholar] [CrossRef] [PubMed] [Green Version]
- Zhang, Q.; Ni, Y.; Wang, S.; Agbana, Y.L.; Han, Q.; Liu, W.; Bai, H.; Yi, Z.; Yi, X.; Zhu, Y.; et al. G6PD upregulates Cyclin E1 and MMP9 to promote clear cell renal cell carcinoma progression. Int. J. Med. Sci. 2022, 19, 47–64. [Google Scholar] [CrossRef] [PubMed]
- Gobin, E.; Bagwell, K.; Wagner, J.; Mysona, D.; Sandirasegarane, S.; Smith, N.; Bai, S.; Sharma, A.; Schleifer, R.; She, J.-X. A pan-cancer perspective of matrix metalloproteases (MMP) gene expression profile and their diagnostic/prognostic potential. BMC Cancer 2019, 19, 581. [Google Scholar] [CrossRef] [PubMed] [Green Version]
- VandeKopple, M.J.; Wu, J.; Auer, E.N.; Giaccia, A.J.; Denko, N.C.; Papandreou, I. HILPDA regulates lipid metabolism, lipid droplet abundance, and response to microenvironmental stress in solid tumors. Mol. Cancer Res. 2019, 17, 2089–2101. [Google Scholar] [CrossRef] [Green Version]
- Avgerinos, K.I.; Spyrou, N.; Mantzoros, C.S.; Dalamaga, M. Obesity and cancer risk: Emerging biological mechanisms and perspectives. Metabolism 2019, 92, 121–135. [Google Scholar] [CrossRef]
- Petan, T.; Jarc, E.; Jusović, M. Lipid droplets in cancer: Guardians of fat in a stressful world. Molecules 2018, 23, 1941. [Google Scholar] [CrossRef] [PubMed]
- Liu, S.; Liu, X.; Wu, F.; Zhang, X.; Zhang, H.; Gao, D.; Bi, D.; Qu, H.; Ge, J.; Xu, Y.; et al. HADHA overexpression disrupts lipid metabolism and inhibits tumor growth in clear cell renal cell carcinoma. Exp. Cell Res. 2019, 384, 111558. [Google Scholar] [CrossRef]
- Ackerman, D.; Tumanov, S.; Qiu, B.; Michalopoulou, E.; Spata, M.; Azzam, A.; Xie, H.; Simon, M.C.; Kamphorst, J.J. Triglycerides promote lipid homeostasis during hypoxic stress by balancing fatty acid saturation. Cell Rep. 2018, 24, 2596–2605.e5. [Google Scholar] [CrossRef] [Green Version]
- Boroughs, L.K.; DeBerardinis, R.J. Metabolic pathways promoting cancer cell survival and growth. Nat. Cell Biol. 2015, 17, 351–359. [Google Scholar] [CrossRef] [PubMed] [Green Version]
- Zhao, Z.; Lu, J.; Han, L.; Wang, X.; Man, Q.; Liu, S. Prognostic significance of two lipid metabolism enzymes, HADHA and ACAT2, in clear cell renal cell carcinoma. Tumour Biol. 2016, 37, 8121–8130. [Google Scholar] [CrossRef] [PubMed]
- Wettersten, H.I.; Hakimi, A.A.; Morin, D.; Bianchi, C.; Johnstone, M.E.; Donohoe, D.R.; Trott, J.F.; Abu Aboud, O.; Stirdivant, S.; Neri, B.; et al. Grade-dependent metabolic reprogramming in kidney cancer revealed by combined proteomics and metabolomics analysis. Cancer Res. 2015, 75, 2541–2552. [Google Scholar] [CrossRef] [PubMed] [Green Version]
- Bianchi, C.; Meregalli, C.; Bombelli, S.; Di Stefano, V.; Salerno, F.; Torsello, B.; De Marco, S.; Bovo, G.; Cifola, I.; Mangano, E.; et al. The glucose and lipid metabolism reprogramming is grade-dependent in clear cell renal cell carcinoma primary cultures and is targetable to modulate cell viability and proliferation. Oncotarget 2017, 8, 113502–113515. [Google Scholar] [CrossRef] [PubMed] [Green Version]
- Qiu, B.; Ackerman, D.; Sanchez, D.J.; Li, B.; Ochocki, J.D.; Grazioli, A.; Bobrovnikova-Marjon, E.; Diehl, J.A.; Keith, B.; Simon, M.C. HIF2α-dependent lipid storage promotes endoplasmic reticulum homeostasis in clear-cell renal cell carcinoma. Cancer Discov. 2015, 5, 652–667. [Google Scholar] [CrossRef] [PubMed] [Green Version]
- van der Mijn, J.C.; Fu, L.; Khani, F.; Zhang, T.; Molina, A.M.; Barbieri, C.E.; Chen, Q.; Gross, S.S.; Gudas, L.J.; Nanus, D.M. Combined metabolomics and genome-wide transcriptomics analyses show multiple HIF1α-induced changes in lipid metabolism in early stage clear cell renal cell carcinoma. Transl. Oncol. 2020, 13, 177–185. [Google Scholar] [CrossRef] [PubMed]
- Bombelli, S.; Torsello, B.; De Marco, S.; Lucarelli, G.; Cifola, I.; Grasselli, C.; Strada, G.; Bovo, G.; Perego, R.A.; Bianchi, C. 36-kDa annexin A3 isoform negatively modulates lipid storage in clear cell renal cell carcinoma cells. Am. J. Pathol. 2020, 190, 2317–2326. [Google Scholar] [CrossRef]
- Ding, X.; Zhang, W.; Li, S.; Yang, H. The role of cholesterol metabolism in cancer. Am. J. Cancer Res. 2019, 9, 219–227. [Google Scholar]
- Go, G.W.; Mani, A. Low-density lipoprotein receptor (LDLR) family orchestrates cholesterol homeostasis. Yale J. Biol Med. 2012, 85, 19–28. [Google Scholar]
- Shen, W.J.; Azhar, S.; Kraemer, F.B. SR-B1: A unique multifunctional receptor for cholesterol influx and efflux. Annu. Rev. Physiol. 2018, 80, 95–116. [Google Scholar] [CrossRef]
- Li, F.; Zhang, H. Lysosomal acid lipase in lipid metabolism and beyond. Arterioscler. Thromb. Vasc. Biol. 2019, 39, 850–856. [Google Scholar] [CrossRef] [PubMed]
- Sundelin, J.P.; Ståhlman, M.; Lundqvist, A.; Levin, M.; Parini, P.; Johansson, M.E.; Borén, J. Increased expression of the very low-density lipoprotein receptor mediates lipid accumulation in clear-cell renal cell carcinoma. PLoS ONE 2012, 7, e48694. [Google Scholar] [CrossRef] [Green Version]
- Wang, J.; Tan, M.; Ge, J.; Zhang, P.; Zhong, J.; Tao, L.; Wang, Q.; Tong, X.; Qiu, J. Lysosomal acid lipase promotes cholesterol ester metabolism and drives clear cell renal cell carcinoma progression. Cell Prolif. 2018, 51, e12452. [Google Scholar] [CrossRef] [Green Version]
- Goldstein, J.L.; Brown, M.S. Regulation of the mevalonate pathway. Nature 1990, 343, 425–430. [Google Scholar] [CrossRef] [PubMed]
- Sinensky, M. Recent advances in the study of prenylated proteins. Biochim. Biophys. Acta 2000, 1484, 93–106. [Google Scholar] [CrossRef]
- Iannelli, F.; Lombardi, R.; Milone, M.R.; Pucci, B.; De Rienzo, S.; Budillon, A.; Bruzzese, F. Targeting mevalonate pathway in cancer treatment: Repurposing of statins. Recent Pat. Anticancer Drug Discov. 2018, 13, 184–200. [Google Scholar] [CrossRef]
- Misirkic, M.; Janjetovic, K.; Vucicevic, L.; Tovilovic, G.; Ristic, B.; Vilimanovich, U.; Harhaji-Trajkovic, L.; Sumarac-Dumanovic, M.; Micic, D.; Bumbasirevic, V.; et al. Inhibition of AMPK-dependent autophagy enhances in vitro antiglioma effect of simvastatin. Pharmacol. Res. 2012, 65, 111–119. [Google Scholar] [CrossRef]
- Parikh, A.; Childress, C.; Deitrick, K.; Lin, Q.; Rukstalis, D.; Yang, W. Statin-induced autophagy by inhibition of geranylgeranyl biosynthesis in prostate cancer PC3 cells. Prostate 2010, 70, 971–981. [Google Scholar] [CrossRef]
- Kang, S.; Kim, E.S.; Moon, A. Simvastatin and lovastatin inhibit breast cell invasion induced by H-Ras. Oncol. Rep. 2009, 21, 1317–1322. [Google Scholar] [CrossRef] [Green Version]
- Goldman, M.J.; Craft, B.; Hastie, M.; Repečka, K.; McDade, F.; Kamath, A.; Banerjee, A.; Luo, Y.; Rogers, D.; Brooks, A.N.; et al. Visualizing and interpreting cancer genomics data via the Xena platform. Nat. Biotechnol. 2020, 38, 675–678. [Google Scholar] [CrossRef]
- Gebhard, R.L.; Clayman, R.V.; Prigge, W.F.; Figenshau, R.; A Staley, N.; Reesey, C.; Bear, A. Abnormal cholesterol metabolism in renal clear cell carcinoma. J. Lipid Res. 1987, 28, 1177–1184. [Google Scholar] [CrossRef]
- Shimano, H.; Sato, R. SREBP-regulated lipid metabolism: Convergent physiology–divergent pathophysiology. Nat. Rev. Endocrinol. 2017, 13, 710–730. [Google Scholar] [CrossRef] [PubMed]
- De la Cruz López, K.G.; Toledo Guzmán, M.E.; Sánchez, E.O.; García Carrancá, A. mTORC1 as a regulator of mitochondrial functions and a therapeutic target in cancer. Front. Oncol. 2019, 9, 1373. [Google Scholar] [CrossRef] [PubMed] [Green Version]
- Liu, G.; Zhao, X.; Zhou, J.; Cheng, X.; Ye, Z.; Ji, Z. LncRNA TP73-AS1 promotes cell proliferation and inhibits cell apoptosis in clear cell renal cell carcinoma through repressing KISS1 expression and inactivation of PI3K/Akt/mTOR signaling pathway. Cell. Physiol. Biochem. 2018, 48, 371–384. [Google Scholar] [CrossRef]
- Li, X.; Liu, Z.; Xia, C.; Yan, K.; Fang, Z.; Fan, Y. SETD8 stabilized by USP17 epigenetically activates SREBP1 pathway to drive lipogenesis and oncogenesis of ccRCC. Cancer Lett. 2022, 527, 150–163. [Google Scholar] [CrossRef]
- Fang, J.; Feng, Q.; Ketel, C.S.; Wang, H.; Cao, R.; Xia, L.; Erdjument-Bromage, H.; Tempst, P.; Simon, J.A.; Zhang, Y. Purification and functional characterization of SET8, a nucleosomal histone H4-lysine 20-specific methyltransferase. Curr. Biol. 2002, 12, 1086–1099. [Google Scholar] [CrossRef] [Green Version]
- Serrano, L.; Martínez-Redondo, P.; Marazuela-Duque, A.; Vazquez, B.N.; Dooley, S.J.; Voigt, P.; Beck, D.B.; Kane-Goldsmith, N.; Tong, Q.; Rabanal, R.M.; et al. The tumor suppressor SirT2 regulates cell cycle progression and genome stability by modulating the mitotic deposition of H4K20 methylation. Genes Dev. 2013, 27, 639–653. [Google Scholar] [CrossRef] [Green Version]
- Beck, D.B.; Oda, H.; Shen, S.S.; Reinberg, D. PR-Set7 and H4K20me1: At the crossroads of genome integrity, cell cycle, chromosome condensation, and transcription. Genes Dev. 2012, 26, 325–337. [Google Scholar] [CrossRef] [Green Version]
- Dulev, S.; Tkach, J.; Lin, S.; Batada, N.N. SET8 methyltransferase activity during the DNA double-strand break response is required for recruitment of 53BP1. EMBO Rep. 2014, 15, 1163–1174. [Google Scholar] [CrossRef]
- de la Vega, M.; Kelvin, A.A.; Dunican, D.J.; McFarlane, C.; Burrows, J.F.; Jaworski, J.; Stevenson, N.J.; Dib, K.; Rappoport, J.Z.; Scott, C.J.; et al. The deubiquitinating enzyme USP17 is essential for GTPase subcellular localization and cell motility. Nat. Commun. 2011, 2, 259. [Google Scholar] [CrossRef]
- Pereg, Y.; Liu, B.Y.; O’Rourke, K.M.; Sagolla, M.; Dey, A.; Komuves, L.; French, D.M.; Dixit, V.M. Ubiquitin hydrolase Dub3 promotes oncogenic transformation by stabilizing Cdc25A. Nat. Cell Biol. 2010, 12, 400–406. [Google Scholar] [CrossRef] [PubMed]
- Liu, T.; Yu, J.; Deng, M.; Yin, Y.; Zhang, H.; Luo, K.; Qin, B.; Li, Y.; Wu, C.; Ren, T.; et al. CDK4/6-dependent activation of DUB3 regulates cancer metastasis through SNAIL1. Nat. Commun. 2017, 8, 13923. [Google Scholar] [CrossRef] [PubMed] [Green Version]
- Wu, Y.; Wang, Y.; Lin, Y.; Liu, Y.; Wang, Y.; Jia, J.; Singh, P.; Chi, Y.-I.; Wang, C.; Dong, C.; et al. Dub3 inhibition suppresses breast cancer invasion and metastasis by promoting Snail1 degradation. Nat. Commun. 2017, 8, 14228. [Google Scholar] [CrossRef] [PubMed] [Green Version]
- Lin, Y.; Wang, Y.; Shi, Q.; Yu, Q.; Liu, C.; Feng, J.; Deng, J.; Evers, B.M.; Zhou, B.P.; Wu, Y. Stabilization of the transcription factors slug and twist by the deubiquitinase dub3 is a key requirement for tumor metastasis. Oncotarget 2017, 8, 75127–75140. [Google Scholar] [CrossRef]
- Lu, C.-H.; Yeh, D.-W.; Lai, C.-Y.; Liu, Y.-L.; Huang, L.-R.; Lee, A.Y.-L.; Jin, S.-L.C.; Chuang, T.-H. USP17 mediates macrophage-promoted inflammation and stemness in lung cancer cells by regulating TRAF2/TRAF3 complex formation. Oncogene 2018, 37, 6327–6340, Erratum in Oncogene 2019, 38, 5742–5743. [Google Scholar] [CrossRef]
- Chen, X.; Wang, C.; Liao, K.; Zhou, S.; Cao, L.; Chen, J.; Xu, C.; Lin, Y. USP17 suppresses tumorigenesis and tumor growth through deubiquitinating AEP. Int. J. Biol. Sci. 2019, 15, 738–748. [Google Scholar] [CrossRef] [Green Version]
- McFarlane, C.; Kelvin, A.A.; de la Vega, M.; Govender, U.; Scott, C.J.; Burrows, J.F.; Johnston, J.A. The deubiquitinating enzyme USP17 is highly expressed in tumor biopsies, is cell cycle regulated, and is required for G1-S progression. Cancer Res. 2010, 70, 3329–3339. [Google Scholar] [CrossRef] [Green Version]
- Yang, H.; Zhao, H.; Ren, Z.; Yi, X.; Zhang, Q.; Yang, Z.; Kuang, Y.; Zhu, Y. Overexpression CPT1A reduces lipid accumulation via PPARα/CD36 axis to suppress the cell proliferation in ccRCC. Acta Biochim. Biophys. Sin. 2022, 54, 220–231. [Google Scholar] [CrossRef]
- Du, W.; Zhang, L.; Brett-Morris, A.; Aguila, B.; Kerner, J.; Hoppel, C.L.; Puchowicz, M.; Serra, D.; Herrero, L.; Rini, B.I.; et al. HIF drives lipid deposition and cancer in ccRCC via repression of fatty acid metabolism. Nat. Commun. 2017, 8, 1769. [Google Scholar] [CrossRef] [Green Version]
- Zani, I.A.; Stephen, S.L.; Mughal, N.A.; Russell, D.; Homer-Vanniasinkam, S.; Wheatcroft, S.B.; Ponnambalam, S. Scavenger receptor structure and function in health and disease. Cells 2015, 4, 178–201. [Google Scholar] [CrossRef] [PubMed]
- Yang, Q.; Shu, F.; Gong, J.; Ding, P.; Cheng, R.; Li, J.; Tong, R.; Ding, L.; Sun, H.; Huang, W.; et al. Sweroside ameliorates NAFLD in high-fat diet induced obese mice through the regulation of lipid metabolism and inflammatory response. J. Ethnopharmacol. 2020, 255, 112556. [Google Scholar] [CrossRef] [PubMed]
- Ou, M.; Huang, R.; Luo, Q.; Xiong, L.; Chen, K.; Wang, Y. Characterisation of scavenger receptor class B type 1 in rare minnow (Gobiocypris rarus). Fish Shellfish Immunol. 2019, 89, 614–622. [Google Scholar] [CrossRef] [PubMed]
- Liu, G.-Z.; Hou, T.-T.; Yuan, Y.; Hang, P.-Z.; Zhao, J.-J.; Sun, L.; Zhao, G.-Q.; Dong, J.-M.; Wang, X.-B.; Shi, H.; et al. Fenofibrate inhibits atrial metabolic remodelling in atrial fibrillation through PPAR-α/sirtuin 1/PGC-1α pathway. Br. J. Pharmacol. 2016, 173, 1095–1109. [Google Scholar] [CrossRef] [PubMed] [Green Version]
- Goto, T. A review of the studies on food-derived factors which regulate energy metabolism via the modulation of lipid-sensing nuclear receptors. Biosci. Biotechnol. Biochem. 2019, 83, 579–588. [Google Scholar] [CrossRef]
- Song, S.; Attia, R.R.; Connaughton, S.; Niesen, M.I.; Ness, G.C.; Elam, M.B.; Hori, R.T.; Cook, G.A.; Park, E.A. Peroxisome proliferator activated receptor alpha (PPARalpha) and PPAR gamma coactivator (PGC-1alpha) induce carnitine palmitoyltransferase IA (CPT-1A) via independent gene elements. Mol. Cell Endocrinol. 2010, 325, 54–63. [Google Scholar] [CrossRef] [Green Version]
- Zhang, Y.; Wang, H.; Zhang, J.; Lv, J.; Huang, Y. Positive feedback loop and synergistic effects between hypoxia-inducible factor-2α and stearoyl-CoA desaturase-1 promote tumorigenesis in clear cell renal cell carcinoma. Cancer Sci. 2013, 104, 416–422. [Google Scholar] [CrossRef]
- Tanaka, K.; Kandori, S.; Sakka, S.; Nitta, S.; Tanuma, K.; Shiga, M.; Nagumo, Y.; Negoro, H.; Kojima, T.; Mathis, B.J.; et al. ELOVL2 promotes cancer progression by inhibiting cell apoptosis in renal cell carcinoma. Oncol. Rep. 2022, 47, 23. [Google Scholar] [CrossRef]
- Kobayashi, T.; Zadravec, D.; Jacobsson, A. ELOVL2 overexpression enhances triacylglycerol synthesis in 3T3-L1 and F442A cells. FEBS Lett. 2007, 581, 3157–3163. [Google Scholar] [CrossRef] [Green Version]
- Morris, S.M., Jr. Arginine: Beyond protein. Am. J. Clin. Nutr. 2006, 83, 508S–512S. [Google Scholar] [CrossRef] [Green Version]
- Keshet, R.; Szlosarek, P.; Carracedo, A.; Erez, A. Rewiring urea cycle metabolism in cancer to support anabolism. Nat. Rev. Cancer 2018, 18, 634–645. [Google Scholar] [CrossRef]
- Rabinovich, S.; Adler, L.; Yizhak, K.; Sarver, A.; Silberman, A.; Agron, S.; Stettner, N.; Sun, Q.; Brandis, A.; Helbling, D.; et al. Diversion of aspartate in ASS1-deficient tumours fosters de novo pyrimidine synthesis. Nature 2015, 527, 379–383. [Google Scholar] [CrossRef] [PubMed] [Green Version]
- Nagamani, S.C.; Erez, A. A metabolic link between the urea cycle and cancer cell proliferation. Mol. Cell Oncol. 2016, 3, e1127314. [Google Scholar] [CrossRef] [PubMed] [Green Version]
- Khare, S.; Kim, L.C.; Lobel, G.; Doulias, P.-T.; Ischiropoulos, H.; Nissim, I.; Keith, B.; Simon, M.C. ASS1 and ASL suppress growth in clear cell renal cell carcinoma via altered nitrogen metabolism. Cancer Metab. 2021, 9, 40. [Google Scholar] [CrossRef] [PubMed]
- Erez, A.; Nagamani, S.C.S.; A Shchelochkov, O.; Premkumar, M.H.; Campeau, P.; Chen, Y.; Garg, H.K.; Li, L.; Mian, A.; Bertin, T.K.; et al. Requirement of argininosuccinate lyase for systemic nitric oxide production. Nat. Med. 2011, 17, 1619–1626. [Google Scholar] [CrossRef] [PubMed] [Green Version]
- Qiu, F.; Chen, Y.-R.; Liu, X.; Chu, C.-Y.; Shen, L.-J.; Xu, J.; Gaur, S.; Forman, H.J.; Zhang, H.; Zheng, S.; et al. Arginine starvation impairs mitochondrial respiratory function in ASS1-deficient breast cancer cells. Sci. Signal. 2014, 7, ra31. [Google Scholar] [CrossRef] [PubMed] [Green Version]
- Zhou, L.; Zhang, H.; Wu, J. Effects of nitric oxide on the biological behavior of HepG2 human hepatocellular carcinoma cells. Exp. Ther. Med. 2016, 11, 1875–1880. [Google Scholar] [CrossRef] [Green Version]
- Keshet, R.; Erez, A. Arginine and the metabolic regulation of nitric oxide synthesis in cancer. Dis. Model. Mech. 2018, 11, dmm033332. [Google Scholar] [CrossRef] [Green Version]
- Kobayashi, E.; Masuda, M.; Nakayama, R.; Ichikawa, H.; Satow, R.; Shitashige, M.; Honda, K.; Yamaguchi, U.; Shoji, A.; Tochigi, N.; et al. Reduced argininosuccinate synthetase is a predictive biomarker for the development of pulmonary metastasis in patients with osteosarcoma. Mol. Cancer Ther. 2010, 9, 535–544. [Google Scholar] [CrossRef] [Green Version]
- Ochocki, J.D.; Khare, S.; Hess, M.; Ackerman, D.; Qiu, B.; Daisak, J.I.; Worth, A.J.; Lin, N.; Lee, P.; Xie, H.; et al. Arginase 2 suppresses renal carcinoma progression via biosynthetic cofactor pyridoxal phosphate depletion and increased polyamine toxicity. Cell Metab. 2018, 27, 1263–1280.e6. [Google Scholar] [CrossRef] [Green Version]
- Poliseno, L.; Salmena, L.; Zhang, J.; Carver, B.; Haveman, W.J.; Pandolfi, P.P. A coding-independent function of gene and pseudogene mRNAs regulates tumour biology. Nature 2010, 465, 1033–1038. [Google Scholar] [CrossRef]
- Monti, M.; Lunardini, S.; Magli, I.A.; Campi, R.; Primiceri, G.; Berardinelli, F.; Amparore, D.; Terracciano, D.; Lucarelli, G.; Schips, L.; et al. Micro-RNAs predict response to systemic treatments in metastatic renal cell carcinoma patients: Results from a systematic review of the literature. Biomedicines 2022, 10, 1287. [Google Scholar] [CrossRef] [PubMed]
- Wang, K.; Sun, Y.; Guo, C.; Liu, T.; Fei, X.; Chang, C. Androgen receptor regulates ASS1P3/miR-34a-5p/ASS1 signaling to promote renal cell carcinoma cell growth. Cell Death Dis. 2019, 10, 339. [Google Scholar] [CrossRef] [PubMed] [Green Version]
- Shi, X.-B.; Xue, L.; Ma, A.-H.; Tepper, C.G.; Gandour-Edwards, R.; Kung, H.-J.; White, R.W.D. Tumor suppressive miR-124 targets androgen receptor and inhibits proliferation of prostate cancer cells. Oncogene 2013, 32, 4130–4138. [Google Scholar] [CrossRef] [PubMed] [Green Version]
- Izumi, K.; Zheng, Y.; Li, Y.; Zaengle, J.; Miyamoto, H. Epidermal growth factor induces bladder cancer cell proliferation through activation of the androgen receptor. Int. J. Oncol. 2012, 41, 1587–1592. [Google Scholar] [CrossRef] [Green Version]
- Fujii, R.; Hanamura, T.; Suzuki, T.; Gohno, T.; Shibahara, Y.; Niwa, T.; Yamaguchi, Y.; Ohnuki, K.; Kakugawa, Y.; Hirakawa, H.; et al. Increased androgen receptor activity and cell proliferation in aromatase inhibitor-resistant breast carcinoma. J. Steroid Biochem. Mol. Biol. 2014, 144 Pt B, 513–522. [Google Scholar] [CrossRef]
- Zeng, J.; Li, Y.; Wang, Y.; Xie, G.; Feng, Q.; Yang, Y.; Feng, J. lncRNA 00312 attenuates cell proliferation and invasion and promotes apoptosis in renal cell carcinoma via miR-34a-5p/ASS1 axis. Oxid. Med. Cell. Longev. 2020, 2020, 5737289. [Google Scholar] [CrossRef] [Green Version]
- di Meo, N.A.; Loizzo, D.; Pandolfo, S.D.; Autorino, R.; Ferro, M.; Porta, C.; Stella, A.; Bizzoca, C.; Vincenti, L.; Crocetto, F.; et al. Metabolomic approaches for detection and identification of biomarkers and altered pathways in bladder cancer. Int. J. Mol. Sci. 2022, 23, 4173. [Google Scholar] [CrossRef]
- Lucarelli, G.; Loizzo, D.; Ferro, M.; Rutigliano, M.; Vartolomei, M.D.; Cantiello, F.; Buonerba, C.; Di Lorenzo, G.; Terracciano, D.; De Cobelli, O.; et al. Metabolomic profiling for the identification of novel diagnostic markers and therapeutic targets in prostate cancer: An update. Exp. Rev. Mol. Diagn. 2019, 19, 377–387. [Google Scholar] [CrossRef]
- Papale, M.; Vocino, G.; Lucarelli, G.; Rutigliano, M.; Gigante, M.; Rocchetti, M.T.; Pesce, F.; Sanguedolce, F.; Bufo, P.; Battaglia, M.; et al. Urinary RKIP/p-RKIP is a potential diagnostic and prognostic marker of clear cell renal cell carcinoma. Oncotarget 2017, 8, 40412–40424. [Google Scholar] [CrossRef] [Green Version]
- Lucarelli, G.; Rutigliano, M.; Sanguedolce, F.; Galleggiante, V.; Giglio, A.; Cagiano, S.; Bufo, P.; Maiorano, E.; Ribatti, D.; Ranieri, E.; et al. Increased expression of the autocrine motility factor is associated with poor prognosis in patients with clear cell-renal cell carcinoma. Medicine 2015, 94, e2117. [Google Scholar] [CrossRef]
- Gigante, M.; Lucarelli, G.; Divella, C.; Netti, G.S.; Pontrelli, P.; Cafiero, C.; Grandaliano, G.; Castellano, G.; Rutigliano, M.; Stallone, G.; et al. Soluble serum αKlotho Is a potential predictive marker of disease progression in clear cell renal cell carcinoma. Medicine 2015, 94, e1917. [Google Scholar] [CrossRef] [PubMed]
- Lucarelli, G.; Ditonno, P.; Bettocchi, C.; Vavallo, A.; Rutigliano, M.; Galleggiante, V.; LaRocca, A.M.V.; Castellano, G.; Gesualdo, L.; Grandaliano, G.; et al. Diagnostic and prognostic role of preoperative circulating CA 15-3, CA 125, and beta-2 microglobulin in renal cell carcinoma. Dis. Mark. 2014, 2014, 689795. [Google Scholar] [CrossRef] [PubMed]
- Zhang, M.; Liu, X.; Liu, X.; Li, H.; Sun, W.; Zhang, Y. A pilot investigation of a urinary metabolic biomarker discovery in renal cell carcinoma. Int. Urol. Nephrol. 2020, 52, 437–446. [Google Scholar] [CrossRef] [PubMed]
- Falegan, O.S.; Ball, M.W.; Shaykhutdinov, R.A.; Pieroraio, P.M.; Farshidfar, F.; Vogel, H.J.; Allaf, M.E.; Hyndman, M.E. Urine and serum metabolomics analyses may distinguish between stages of renal cell carcinoma. Metabolites 2017, 7, 6. [Google Scholar] [CrossRef] [Green Version]
- Bifarin, O.O.; Gaul, D.A.; Sah, S.; Arnold, R.S.; Ogan, K.; Master, V.A.; Roberts, D.L.; Bergquist, S.H.; Petros, J.A.; Edison, A.S.; et al. Urine-based metabolomics and machine learning reveals metabolites associated with renal cell carcinoma stage. Cancers 2021, 13, 6253. [Google Scholar] [CrossRef]
- Amaro, F.; Carvalho, M.; Bastos, M.L.; Guedes de Pinho, P.; Pinto, J. Pharmacometabolomics applied to personalized medicine in urological cancers. Pharmaceuticals 2022, 15, 295. [Google Scholar] [CrossRef]
- Sharma, R.; Kadife, E.; Myers, M.; Kannourakis, G.; Prithviraj, P.; Ahmed, N. Determinants of resistance to VEGF-TKI and immune checkpoint inhibitors in metastatic renal cell carcinoma. J. Exp. Clin. Cancer Res. 2021, 40, 186. [Google Scholar] [CrossRef]
- Escudier, B.; Porta, C.; Schmidinger, M.; Rioux-Leclercq, N.; Bex, A.; Khoo, V.; Grünwald, V.; Gillessen, S.; Horwich, A.; ESMO Guidelines Committee. Renal cell carcinoma: ESMO Clinical Practice Guidelines for diagnosis, treatment and follow-up. Ann. Oncol. 2019, 30, 706–720. [Google Scholar] [CrossRef] [Green Version]
- Kapoor, A. First-line treatment options in metastatic renal cell cancer. Can. Urol. Assoc. J. 2016, 10 (Suppl. 7), S236–S238. [Google Scholar] [CrossRef]
- Netti, G.S.; Lucarelli, G.; Spadaccino, F.; Castellano, G.; Gigante, M.; Divella, C.; Rocchetti, M.T.; Rascio, F.; Mancini, V.; Stallone, G.; et al. PTX3 modulates the immunoflogosis in tumor microenvironment and is a prognostic factor for patients with clear cell renal cell carcinoma. Aging 2020, 12, 7585–7602. [Google Scholar] [CrossRef]
- Gigante, M.; Pontrelli, P.; Herr, W.; Gigante, M.; D’Avenia, M.; Zaza, G.; Cavalcanti, E.; Accetturo, M.; Lucarelli, G.; Carrieri, G.; et al. miR-29b and miR-198 overexpression in CD8+ T cells of renal cell carcinoma patients down-modulates JAK3 and MCL-1 leading to immune dysfunction. J. Transl. Med. 2016, 14, 84. [Google Scholar] [CrossRef] [PubMed] [Green Version]
- De Marco, S.; Torsello, B.; Minutiello, E.; Morabito, I.; Grasselli, C.; Bombelli, S.; Zucchini, N.; Lucarelli, G.; Strada, G.; Perego, R.A.; et al. The cross-talk between Abl2 tyrosine kinase and TGFβ1 signalling modulates the invasion of clear cell renal cell carcinoma cells. FEBS Lett. 2022; ahead of print. [Google Scholar] [CrossRef]
- Motzer, R.J.; Tannir, N.M.; McDermott, D.F.; Aren Frontera, O.; Melichar, B.; Choueiri, T.K.; Plimack, E.R.; Barthélémy, P.; Porta, C.; George, S.; et al. Nivolumab plus ipilimumab versus sunitinib in advanced renal-cell carcinoma. N. Engl. J. Med. 2018, 378, 1277–1290. [Google Scholar] [CrossRef] [PubMed]
- Powles, T.; Plimack, E.R.; Soulières, D.; Waddell, T.; Stus, V.; Gafanov, R.; Nosov, D.; Pouliot, F.; Melichar, B.; Vynnychenko, I.; et al. Pembrolizumab plus axitinib versus sunitinib monotherapy as first-line treatment of advanced renal cell carcinoma (KEYNOTE-426): Extended follow-up from a randomised, open-label, phase 3 trial. Lancet Oncol. 2020, 21, 1563–1573, Erratum in Lancet Oncol. 2020, 21, e553. [Google Scholar] [CrossRef]
- Motzer, R.J.; Penkov, K.; Haanen, J.; Rini, B.; Albiges, L.; Campbell, M.T.; Venugopal, B.; Kollmannsberger, C.; Negrier, S.; Uemura, M.; et al. Avelumab plus axitinib versus sunitinib for advanced renal-cell carcinoma. N. Engl. J. Med. 2019, 380, 1103–1115. [Google Scholar] [CrossRef]
- Xu, J.X.; Maher, V.E.; Zhang, L.; Tang, S.; Sridhara, R.; Ibrahim, A.; Kim, G.; Pazdur, R. FDA approval summary: Nivolumab in advanced renal cell carcinoma after anti-angiogenic therapy and exploratory predictive biomarker analysis. Oncologist 2017, 22, 311–317. [Google Scholar] [CrossRef] [Green Version]
- Hatakeyama, H.; Fujiwara, T.; Sato, H.; Terui, A.; Hisaka, A. Investigation of metabolomic changes in sunitinib-resistant human renal carcinoma 786-O cells by capillary electrophoresis-time of flight mass spectrometry. Biol. Pharm. Bull. 2018, 41, 619–627. [Google Scholar] [CrossRef] [Green Version]
- Sato, T.; Kawasaki, Y.; Maekawa, M.; Takasaki, S.; Morozumi, K.; Sato, M.; Shimada, S.; Kawamorita, N.; Yamashita, S.; Mitsuzuka, K.; et al. Metabolomic analysis to elucidate mechanisms of sunitinib resistance in renal cell carcinoma. Metabolites 2020, 11, 1. [Google Scholar] [CrossRef]
- Mock, A.; Zschäbitz, S.; Kirsten, R.; Scheffler, M.; Wolf, B.; Herold-Mende, C.; Kramer, R.; Busch, E.; Jenzer, M.; Jäger, D.; et al. Serum very long-chain fatty acid-containing lipids predict response to immune checkpoint inhibitors in urological cancers. Cancer Immunol. Immunother. 2019, 68, 2005–2014. [Google Scholar] [CrossRef]
- Jobard, E.; Blanc, E.; Négrier, S.; Escudier, B.; Gravis, G.; Chevreau, C.; Elena-Herrmann, B.; Trédan, O. A serum metabolomic fingerprint of bevacizumab and temsirolimus combination as first-line treatment of metastatic renal cell carcinoma. Br. J. Cancer 2015, 113, 1148–1157. [Google Scholar] [CrossRef]
- Li, H.; Bullock, K.; Gurjao, C.; Braun, D.; Shukla, S.A.; Bossé, D.; Lalani, A.-K.A.; Gopal, S.; Jin, C.; Horak, C.; et al. Metabolomic adaptations and correlates of survival to immune checkpoint blockade. Nat. Commun. 2019, 10, 4346. [Google Scholar] [CrossRef] [Green Version]
- Deleuze, A.; Saout, J.; Dugay, F.; Peyronnet, B.; Mathieu, R.; Verhoest, G.; Bensalah, K.; Crouzet, L.; Laguerre, B.; Belaud-Rotureau, M.-A.; et al. Immunotherapy in renal cell carcinoma: The future is now. Int. J. Mol. Sci. 2020, 21, 2532. [Google Scholar] [CrossRef] [Green Version]
- Bellmunt, J.; Szczylik, C.; Feingold, J.; Strahs, A.; Berkenblit, A. Temsirolimus safety profile and management of toxic effects in patients with advanced renal cell carcinoma and poor prognostic features. Ann. Oncol. 2008, 19, 1387–1392. [Google Scholar] [CrossRef] [PubMed]
- Yao, Z.; Zheng, Z.; Zheng, X.; Wu, H.; Zhao, W.; Mu, X.; Sun, F.; Wu, K.; Zheng, J. Comprehensive characterization of metabolism-associated subtypes of renal cell carcinoma to aid clinical therapy. Oxid. Med. Cell. Longev. 2022, 2022, 9039732. [Google Scholar] [CrossRef] [PubMed]
- Hoefflin, R.; Harlander, S.; Schäfer, S.; Metzger, P.; Kuo, F.; Schönenberger, D.; Adlesic, M.; Peighambari, A.; Seidel, P.; Chen, C.-Y.; et al. HIF-1α and HIF-2α differently regulate tumour development and inflammation of clear cell renal cell carcinoma in mice. Nat. Commun. 2020, 11, 4111. [Google Scholar] [CrossRef] [PubMed]
- Wang, G.; Zhang, Z.-J.; Jian, W.-G.; Liu, P.-H.; Xue, W.; Wang, T.-D.; Meng, Y.-Y.; Yuan, C.; Li, H.-M.; Yu, Y.-P.; et al. Novel long noncoding RNA OTUD6B-AS1 indicates poor prognosis and inhibits clear cell renal cell carcinoma proliferation via the Wnt/β-catenin signaling pathway. Mol. Cancer 2019, 18, 15. [Google Scholar] [CrossRef] [PubMed] [Green Version]
- Accetturo, M.; D’Uggento, A.M.; Portincasa, P.; Stella, A. Improvement of MEFV gene variants classification to aid treatment decision making in familial Mediterranean fever. Rheumatology 2020, 59, 754–761. [Google Scholar] [CrossRef] [Green Version]
- Lucarelli, G.; Ferro, M.; Battaglia, M. Multi-omics approach reveals the secrets of metabolism of clear cell-renal cell carcinoma. Transl. Androl. Urol. 2016, 5, 801–803. [Google Scholar] [CrossRef] [Green Version]
- Lucarelli, G.; Rutigliano, M.; Loizzo, D.; di Meo, N.A.; Lasorsa, F.; Mastropasqua, M.; Maiorano, E.; Bizzoca, C.; Vincenti, L.; Battaglia, M.; et al. MUC1 tissue expression and its soluble form CA 15-3 identify a clear cell renal cell carcinoma with distinct metabolic profile and poor clinical outcome. Int. J. Mol. Sci. 2022, 23, 13968. [Google Scholar] [CrossRef]
- Lucarelli, G.; Rutigliano, M.; Sallustio, F.; Ribatti, D.; Giglio, A.; Signorile, M.L.; Grossi, V.; Sanese, P.; Napoli, A.; Maiorano, E.; et al. Integrated multi-omics characterization reveals a distinctive metabolic signature and the role of NDUFA4L2 in promoting angiogenesis, chemoresistance, and mitochondrial dysfunction in clear cell renal cell carcinoma. Aging 2018, 10, 3957–3985. [Google Scholar] [CrossRef]
- Lippa, K.A.; Aristizabal-Henao, J.J.; Beger, R.D.; Bowden, J.A.; Broeckling, C.; Beecher, C.; Davis, W.C.; Dunn, W.B.; Flores, R.; Goodacre, R.; et al. Reference materials for MS-based untargeted metabolomics and lipidomics: A review by the metabolomics quality assurance and quality control consortium (mQACC). Metabolomics 2022, 18, 24. [Google Scholar] [CrossRef]


| Pathway | Metabolite | Sample | Variation in RCC | Reference |
|---|---|---|---|---|
| Glycolysis | Maltose | Tissue | ↑ | [46] |
| Maltotriose | Tissue | ↑ | [46] | |
| Maltotetraose | Tissue | ↑ | [46] | |
| Maltopentaose | Tissue | ↑ | [46] | |
| Maltohexaose | Tissue | ↑ | [46] | |
| Fructose-6-phosphate | Tissue | ↑ | [46] | |
| Fructose-1,6-phosphate | Tissue | ↑ | [46] | |
| 3-phosphoglycerate | Tissue | ↓ | [46] | |
| 2-phosphoglyderate | Tissue | ↓ | [46] | |
| Phosphoenolpyruvate | Tissue | ↓ | [46] | |
| Lactate | Tissue | ↑ | [46,47,48] | |
| Urine | ↑ | [7] | ||
| Pyruvate | Tissue | ↑ | [46,47,48] | |
| Urine | ↑ | [7] | ||
| TCA cycle | Malate | Tissue | ↓ | [47] |
| Fumarate | Tissue | ↓ | [48] | |
| Citrate | Urine | ↓ | [7] | |
| L-2-hydroxyglutarate | Tissue | ↑ | [25] | |
| Pentose Phosphate Pathway | Arabitol | Tissue | ↓ | [46] |
| Xylitol | Tissue | ↓ | [46] | |
| Xylonate | Tissue | ↓ | [46] | |
| Glucose-6-phosphate | Tissue | ↑ | [46] | |
| Ribose-5-phosphate | Tissue | ↑ | [46] | |
| Ribulose-5-phosphate/xylulose 5-phosphate | Tissue | ↑ | [46] | |
| Sedoheptulose-7-phosphate | Tissue | ↑ | [46] | |
| Biosynthesis of unsaturated FA | Arachidonate (20:4n6) | Tissue | ↓ | [49,50] |
| Arachidate (20:0) | Tissue | ↑ | [49] | |
| Cis-vaccenate (18:1n7) | Tissue | ↑ | [49,50] | |
| Dihomo-linoleate (20:2n6) | Tissue | =/↑ | [49,50] | |
| Dihomo-linolenate (20:3n3 or n6) | Tissue | ↑ | [49,50] | |
| Docosadienoate (22:2n6) | Tissue | ↑ | [49] | |
| Docosahexaenoate (22:6) | Tissue | ↓ | [49,50] | |
| Docosapentaenoate (22:5) | Tissue | =/↓ | [49,50] | |
| Eicosapentaenoate (20:5n3) | Tissue | ↓ | [49,50] | |
| Eicosenoate (20:1n9 or 11) | Tissue | ↑ | [49] | |
| Erucate (22:1n9) | Tissue | ↑ | [49] | |
| Linoleate (18:2n6) | Tissue | ↑ | [49,50] | |
| Linolenate (18:3n3 or 6) | Tissue | ↑ | [49] | |
| Nervonate (24:1n9) | Tissue | ↑ | [49] | |
| Oleate (18:1n9) | Tissue | ↑ | [49] | |
| Palmitate (16:0) | Tissue | ↑ | [49,50] | |
| Palmitoleate (16:1n7) | Tissue | ↑ | [49,50] | |
| Stearate (18:0) | Tissue | ↑ | [49] | |
| FA elongation | Palmitate (16:0) | Tissue | ↑ | [49] |
| Arachidonic acid metabolism | Arachidonate (20:4n6) | Tissue | ↓ | [44,49] |
| 5-HETE | Tissue | ↓ | [44,49] | |
| 5-oxo-HETE | Tissue | ↓ | [44,49] | |
| PGE2 | Tissue | ↓ | [44,49] | |
| Squalene | Tissue | ↓ | [44,49] | |
| 7-alpha-hydroxycholesterol | Tissue | ↓ | [44,49] | |
| Desmosterol | Tissue | ↓ | [44,49] | |
| Cholesterol biosynthesis | Cholesterol | Tissue | ↓ | [44,49] |
| Cholesterol ester | Tissue | ↑ | [44,49] | |
| 7-Dehydrocholesterol | Tissue | ↓ | [44,49] | |
| 7-HOCA | Tissue | ↓ | [44,49] | |
| 7-beta-hydroxycholesterol | Tissue | ↓ | [44,49] | |
| Tryptophan | Tissue Serum | ↓ | [45,50] | |
| Kynurenine | Tissue Serum | ↓ | [45,50] | |
| N-formylkynurenine | Urine | ↑ | [46,51] | |
| Tryptophan metabolism | 3-hydroxy-Lkynurenine | Urine | ↑ | [46,51] |
| 5-hydroxy-L-tryptophan | Urine | ↑ | [46,51] | |
| Serotonin | Urine | ↑ | [46,51] | |
| Acetyl-N-formyl-5-methoxy-kynurenamine | Urine | ↓ | [46,51] |
| Metabolite | Sample | Variation | Ref. | |
|---|---|---|---|---|
| Diagnosis/Staging | RCC vs. benign tumors | |||
| Cortisol | Urine | ↑ | [195] | |
| Testosterone | Urine | ↑ | ||
| L-2-aminoadipate adenylate | Urine | ↑ | ||
| RCC vs. healthy controls | ||||
| Aminoadipic acid | Urine | ↑ | ||
| 2-(formamido)-N1-(5-phospho-d-ribosyl) acetamidine | Urine | ↑ | ||
| Alpha-N-phenylacetyl-l-glutamine | Urine | ↑ | ||
| RCC vs. benign | [196] | |||
| Citrate | Serum | ↓ | ||
| Urine | ↓ | |||
| Methanol | Serum | ↓ | ||
| Threonine Glycine | Serum | ↓ | ||
| Histidine Taurine | Serum | ↓ | ||
| Glutamine | Serum | ↓ | ||
| 5-methylcitosine | Serum | ↓ | ||
| Eicosanoate | Serum | ↓ | ||
| Succinate | Urine | ↓ | ||
| Glycine | Urine | ↓ | ||
| 3-hydroxybutyrate creatinine | Urine | ↓ | ||
| 2-aminoisobutyrate | Urine | ↓ | ||
| Phenylalanine | Urine | ↓ | ||
| Methylhistidine | Urine | ↓ | ||
| Acetate threonine | Urine | ↓ | ||
| Gluconate | Urine | ↓ | ||
| Thymine | Urine | ↓ | ||
| Mannitol | Urine | ↓ | ||
| 2-oxoisocaproate | Serum | ↑ | ||
| Creatine | Serum | ↑ | ||
| Isoleucine | Serum | ↑ | ||
| Glutamate | Serum | ↑ | ||
| Ornithine | Serum | ↑ | ||
| Tyrosine | Serum | ↑ | ||
| Octadecanoate | Serum | ↑ | ||
| Galactose | Serum | ↑ | ||
| Pyruvate | Serum | ↑ | ||
| Urine | ↑ | |||
| Lactate | Serum | ↑ | ||
| Urine | ↑ | |||
| Oxypurinol | Urine | ↑ | ||
| Gluconate | Urine | ↑ | ||
| Hypoxanthine | Urine | ↑ | ||
| Malonate | Urine | ↑ | ||
| Betaine | Urine | ↑ | ||
| Tryptophan | Urine | ↑ | ||
| Trigonelline | Urine | ↑ | ||
| Dimethylamine | Urine | ↑ | ||
| Glucose | Urine | ↑ | ||
| Erythritol | Urine | ↑ | ||
| 2-oxoglutarate | Urine | ↑ | ||
| Myo-inositol | Urine | ↑ | ||
| Apo-[3-mthylcrotonoyl-CoA:carbon-dioxide ligase] | Urine | Early/Advanced RCC vs. healthy controls ↑ | [197] | |
| Dihydrouridine | Urine | ↑ | ||
| Acetone | Urine | ↑ | ||
| Pyruvate | Urine | ↑ | ||
| Hydroxypropyl-asparagine | Urine | ↑ | ||
| 7-aminomethyl-7-carbaguanine | Urine | ↑ | ||
| Lys-gly/gly-lys | Urine | ↑ | ||
| Apo-[3-mthylcrotonoyl-CoA:carbon-dioxide ligase] | Urine | ↓ Advanced vs. early RCC ↑ | ||
| Dihydrouridine | Urine | ↑ | ||
| Acetone | ||||
| Pyruvate | Urine | ↑ | ||
| Hydroxypropyl-asparagine | Urine | ↑ | ||
| 7-aminomethyl-7-carbaguanine | Urine | ↑ | ||
| Lys-gly/gly-lys | Urine | ↑ | ||
| N,N-dimethyl-histidine | Urine | Early RCC vs. healthy controls ↓ | ||
| Succinic anhydride | Urine | ↓ | ||
| Diethyl-2-methyl-3-oxosuccinate | Urine | ↓ | ||
| Cytosine dimer | Urine | ↓ | ||
| 3-hydroxyanthranilic acid | Urine | ↓ | ||
| N,N-dimethyl-histidine | Urine | Advanced RCC vs. healthy controls ↑ | ||
| Succinic anhydride | Urine | ↑ | ||
| Diethyl-2-methyl-3-oxosuccinate | Urine | ↑ | ||
| Cytosine dimer | Urine | ↑ | ||
| 3-hydroxyanthranilic acid | Urine | ↑ | ||
| Drug Efficacy | Fructose-6-phosphate | Sunitinib Resistant Cell lines | ↓ | [209] |
| D-sedoheptulose 7-phosphate | ↓ | |||
| Glucose 1-phosphate | ↓ | |||
| Lipid species | Serum | Bevacizumab+temsirolimus vs. sunitinib+interferon-alfa + bevacizumab ↑ | ||
| Lipoproteins | Serum | ↑ | [212] | |
| Very-long-chain FA | Serum | Responders vs. nonresponders to immunotherapy ↑ | [211] | |
| Kynurenine/tryptophan | Serum | ↑ | [213] |
Publisher’s Note: MDPI stays neutral with regard to jurisdictional claims in published maps and institutional affiliations. |
© 2022 by the authors. Licensee MDPI, Basel, Switzerland. This article is an open access article distributed under the terms and conditions of the Creative Commons Attribution (CC BY) license (https://creativecommons.org/licenses/by/4.0/).
Share and Cite
di Meo, N.A.; Lasorsa, F.; Rutigliano, M.; Loizzo, D.; Ferro, M.; Stella, A.; Bizzoca, C.; Vincenti, L.; Pandolfo, S.D.; Autorino, R.; et al. Renal Cell Carcinoma as a Metabolic Disease: An Update on Main Pathways, Potential Biomarkers, and Therapeutic Targets. Int. J. Mol. Sci. 2022, 23, 14360. https://doi.org/10.3390/ijms232214360
di Meo NA, Lasorsa F, Rutigliano M, Loizzo D, Ferro M, Stella A, Bizzoca C, Vincenti L, Pandolfo SD, Autorino R, et al. Renal Cell Carcinoma as a Metabolic Disease: An Update on Main Pathways, Potential Biomarkers, and Therapeutic Targets. International Journal of Molecular Sciences. 2022; 23(22):14360. https://doi.org/10.3390/ijms232214360
Chicago/Turabian Styledi Meo, Nicola Antonio, Francesco Lasorsa, Monica Rutigliano, Davide Loizzo, Matteo Ferro, Alessandro Stella, Cinzia Bizzoca, Leonardo Vincenti, Savio Domenico Pandolfo, Riccardo Autorino, and et al. 2022. "Renal Cell Carcinoma as a Metabolic Disease: An Update on Main Pathways, Potential Biomarkers, and Therapeutic Targets" International Journal of Molecular Sciences 23, no. 22: 14360. https://doi.org/10.3390/ijms232214360