
Overexpression of a Plasma Membrane H+-ATPase Gene OSA1 Stimulates the Uptake of Primary Macronutrients in Rice Roots
 , and
, and 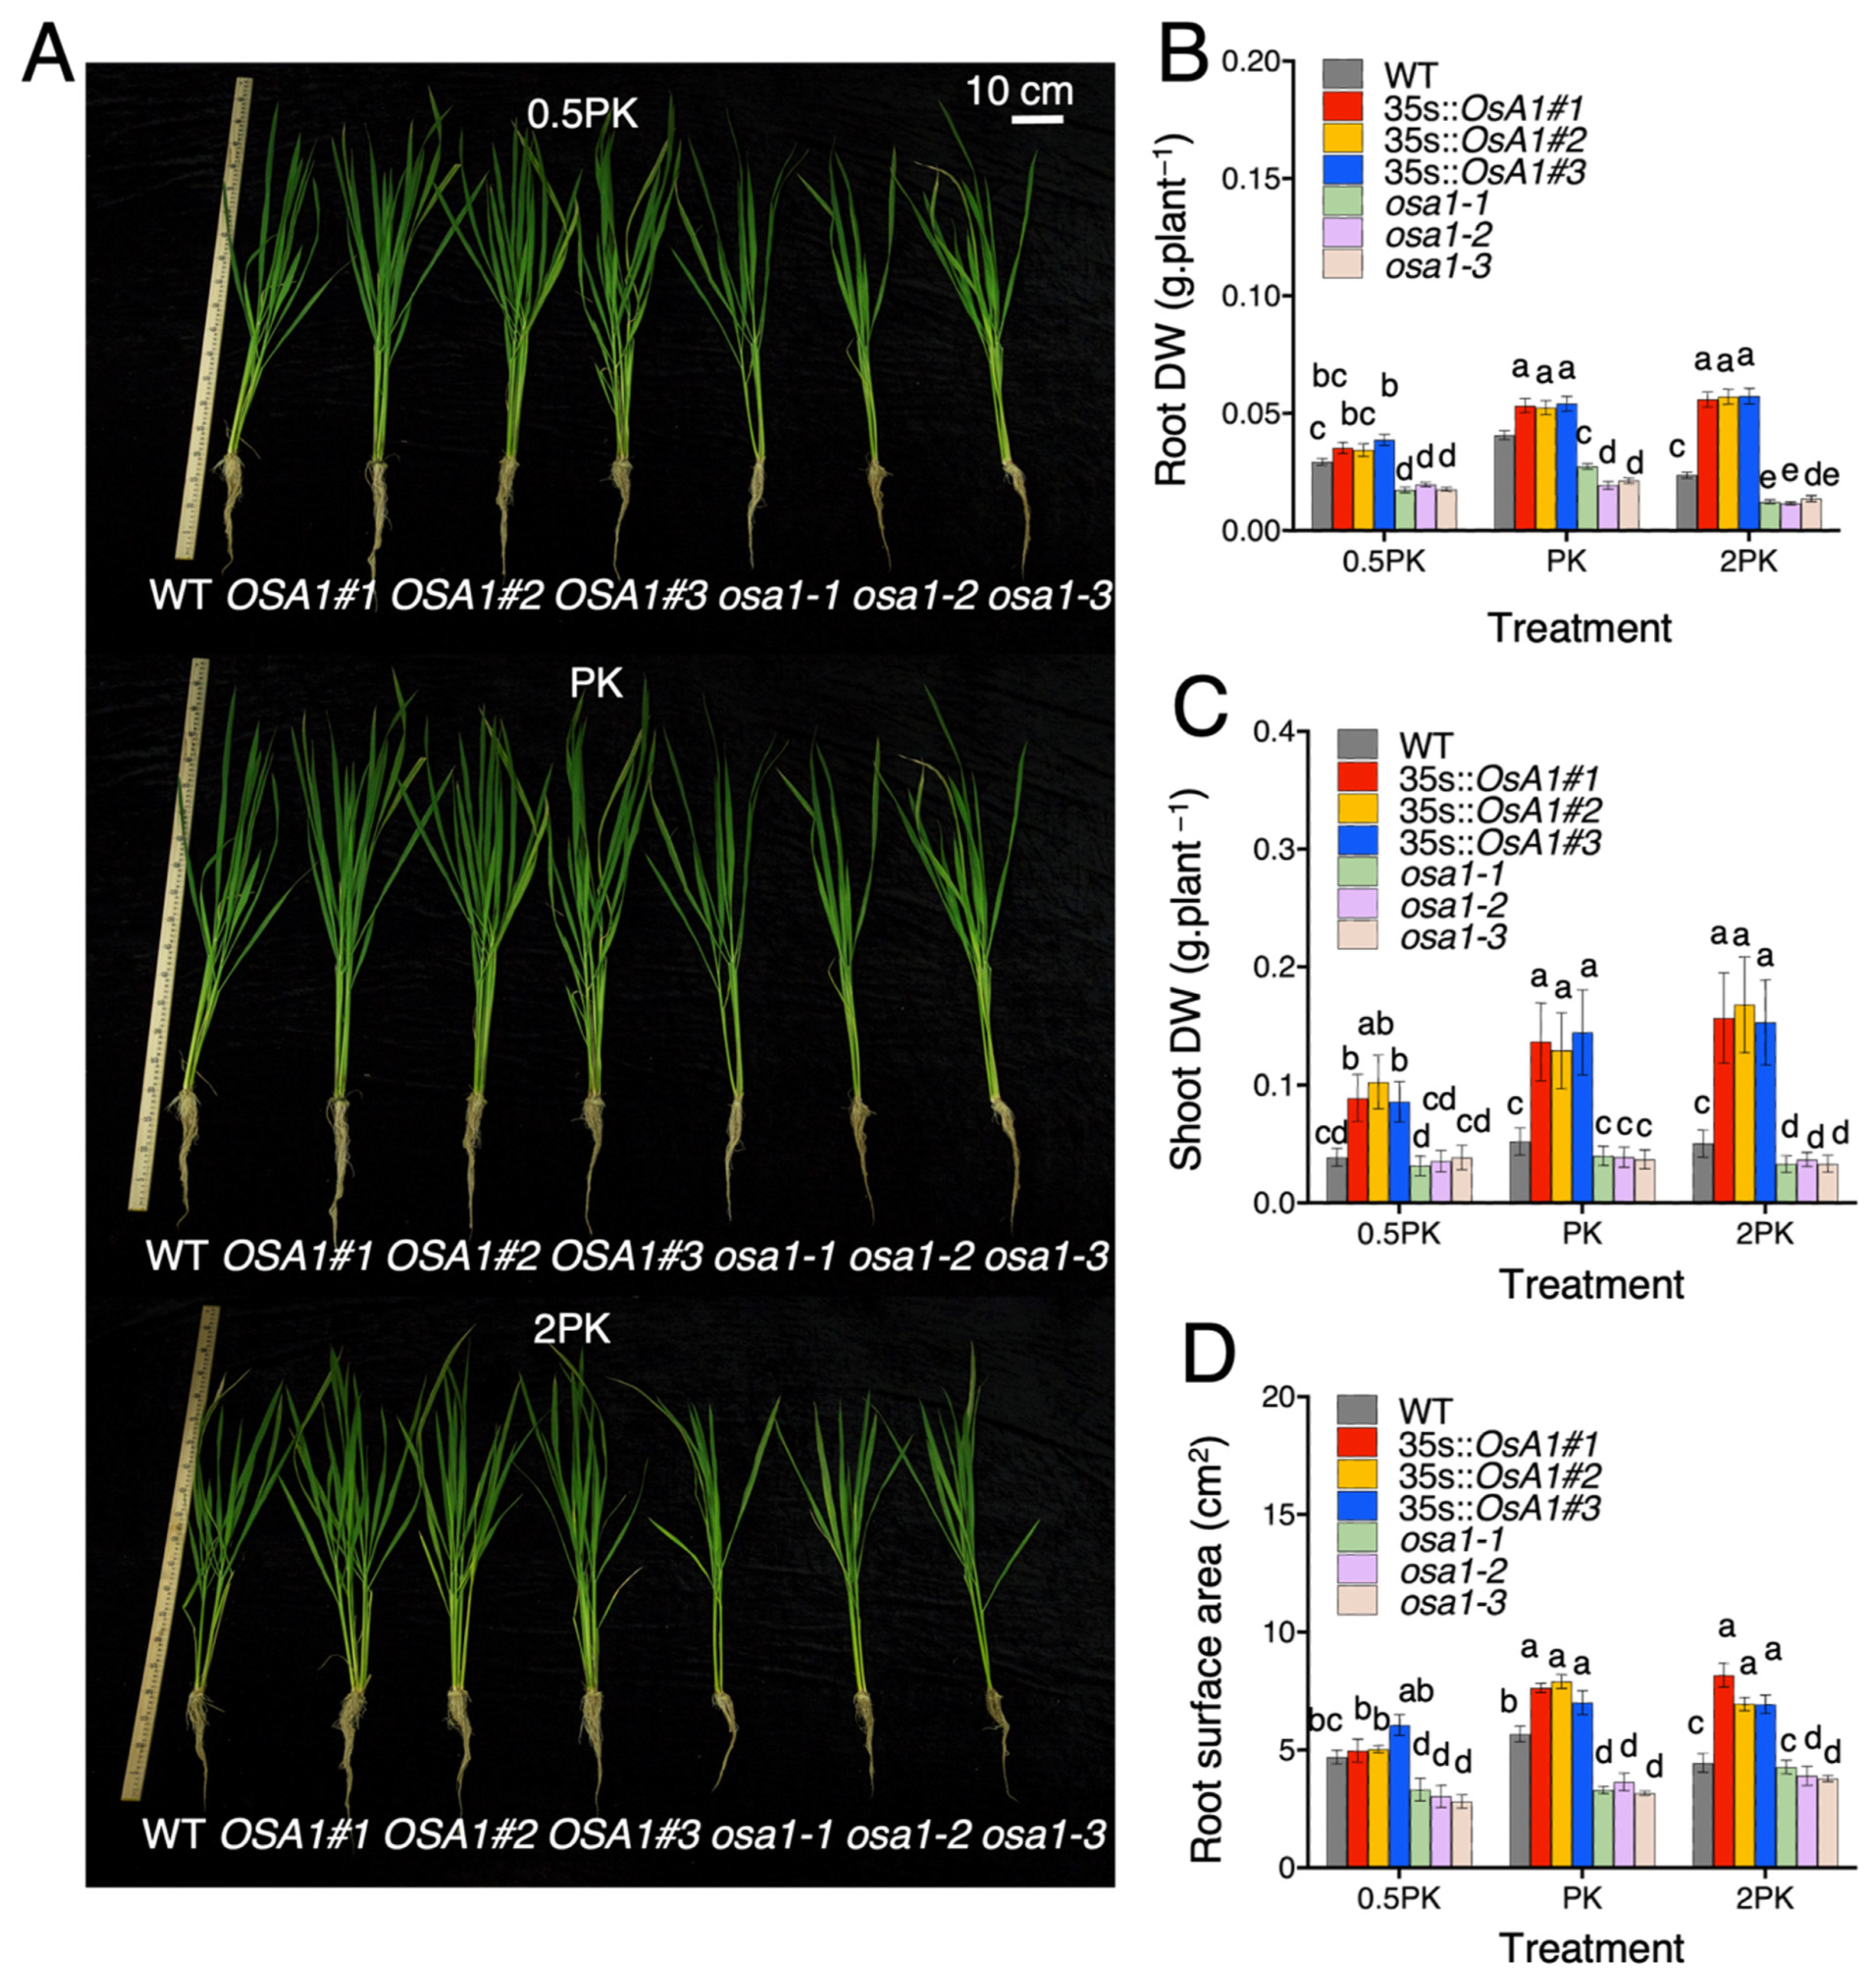
Abstract
:1. Introduction
2. Results
2.1. OSA1-Overexpression Promotes Rice Growth under Different Concentrations of P and K
2.2. PM H+-ATPase Activity in Rice Roots of OSA1-Modified Plants under Different Concentrations of P and K
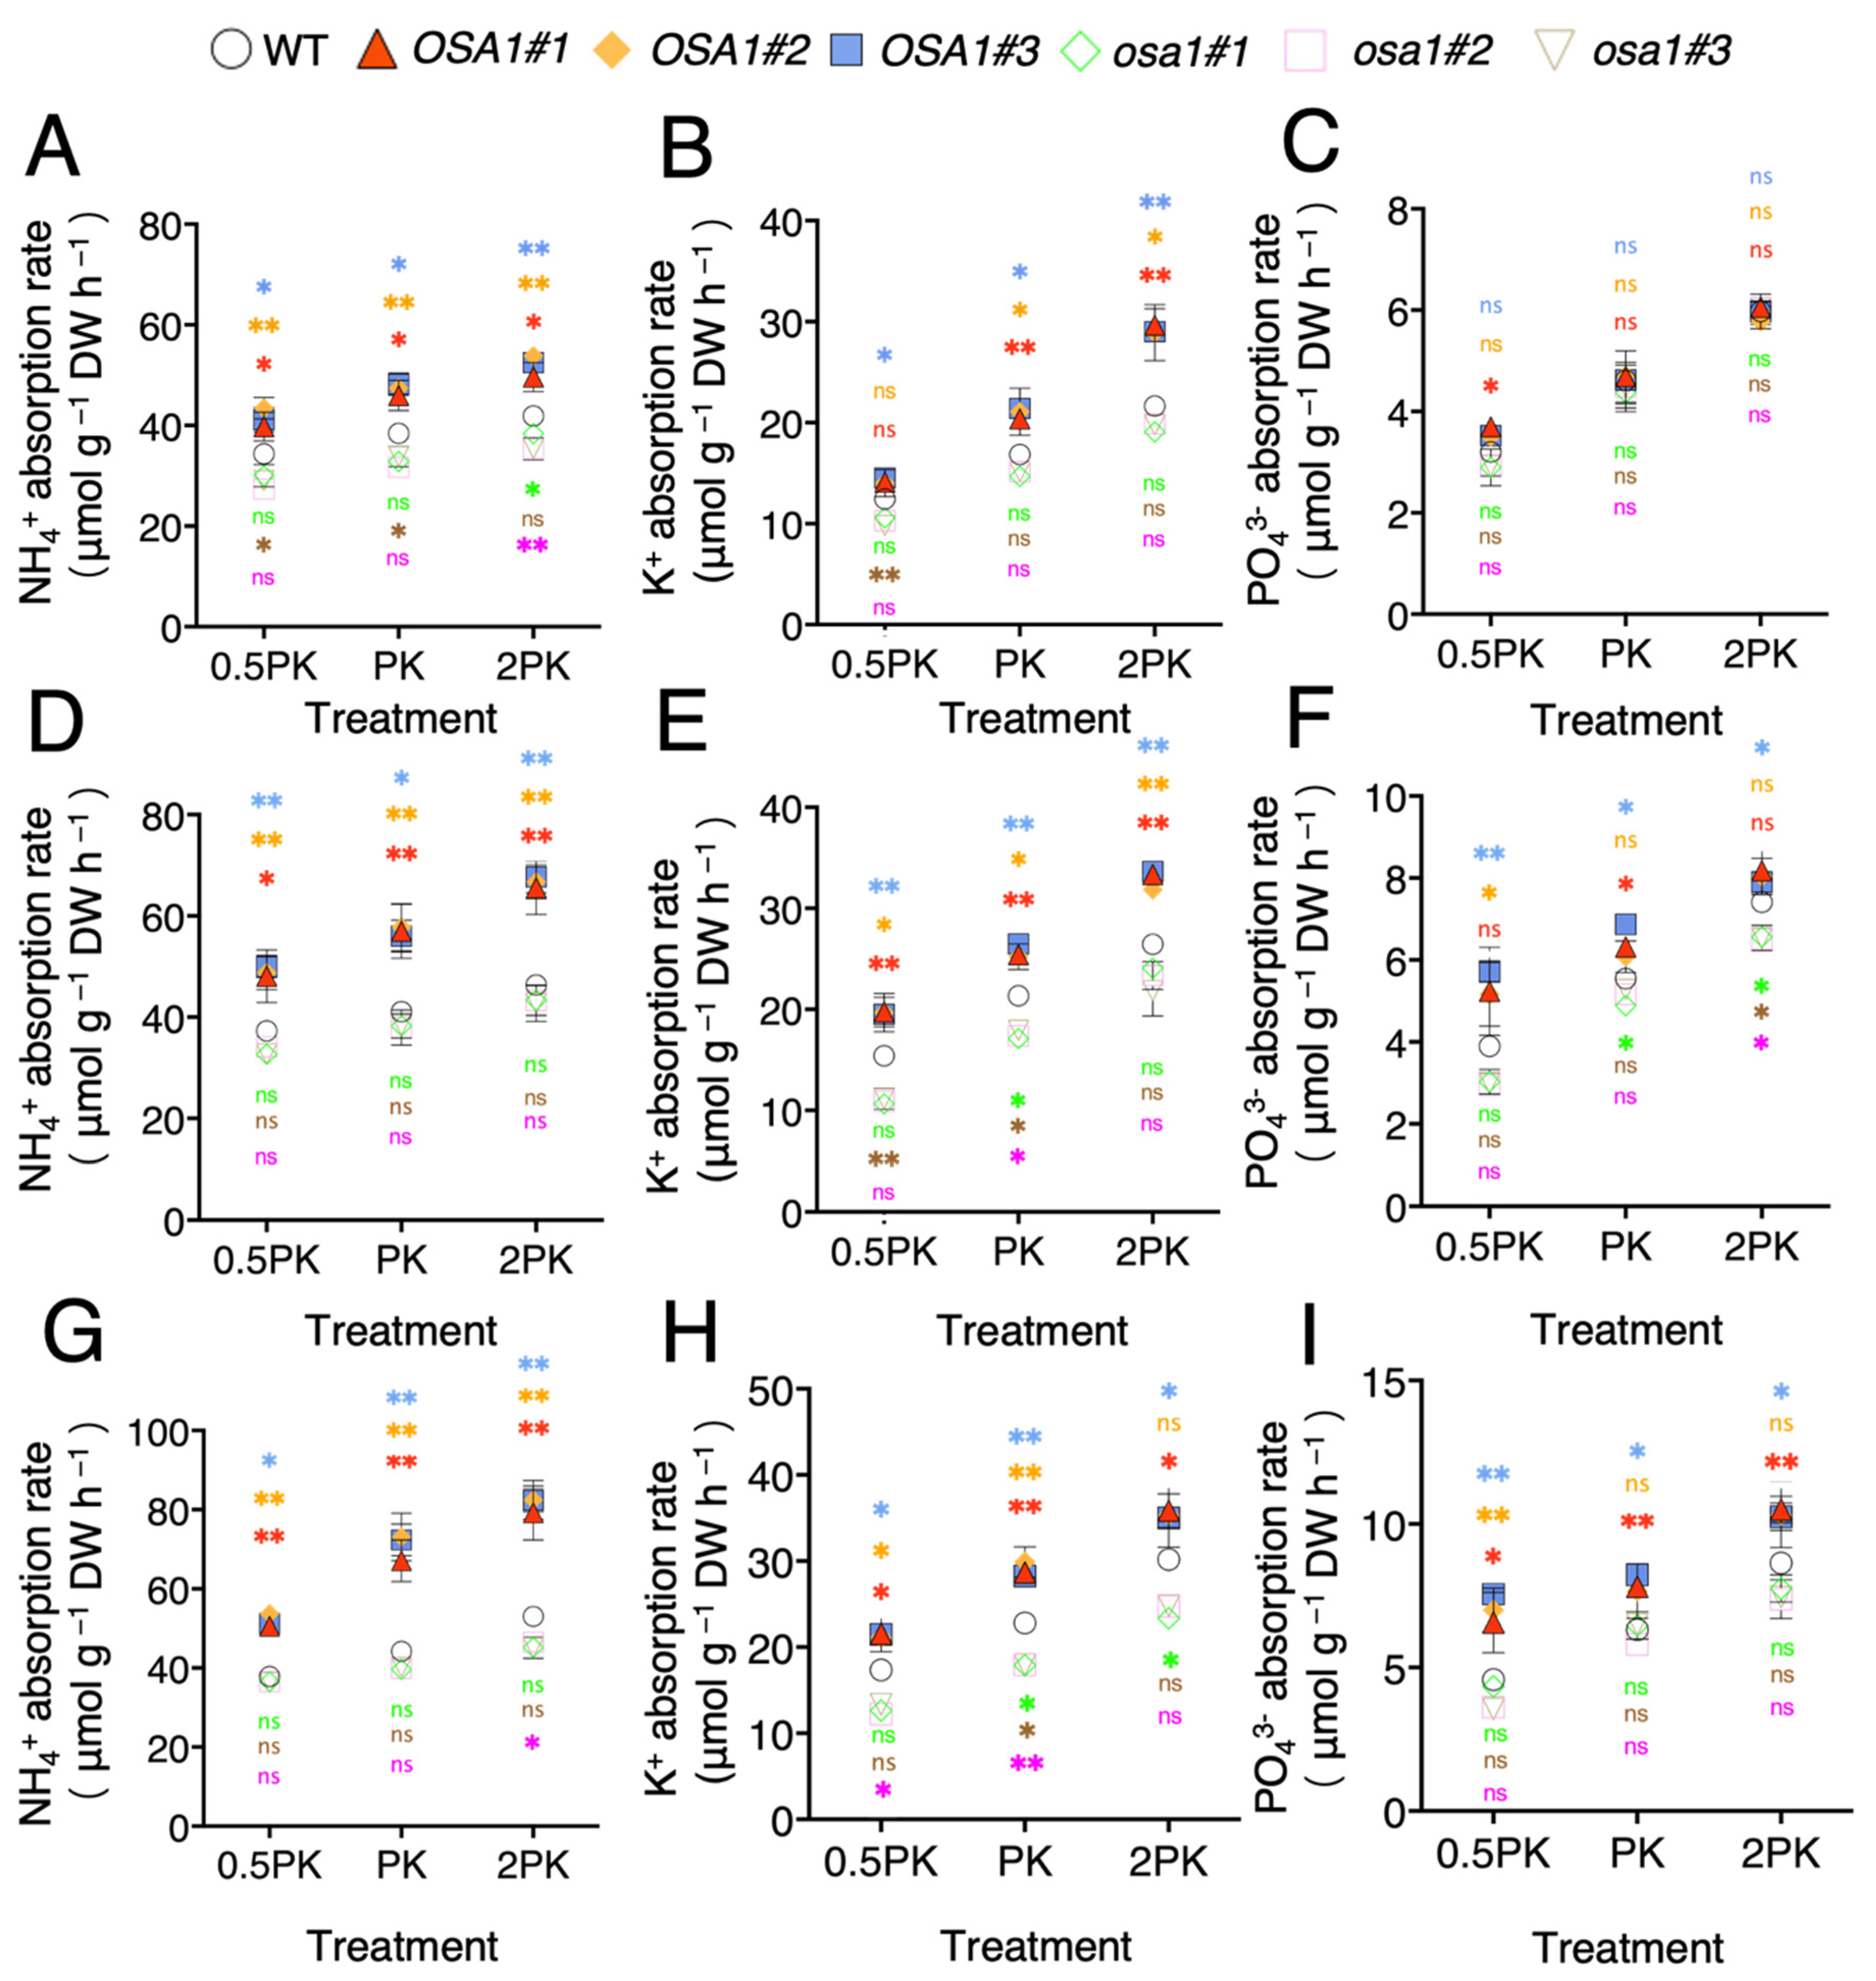
2.3. Overexpression of OSA1 Stimulates P, K, and N Uptake Rates under Different Concentrations of P and K
2.4. Overexpression of OSA1 Increases the Expression of Nutrient Transporter Genes in Roots under Different Concentrations of P and K
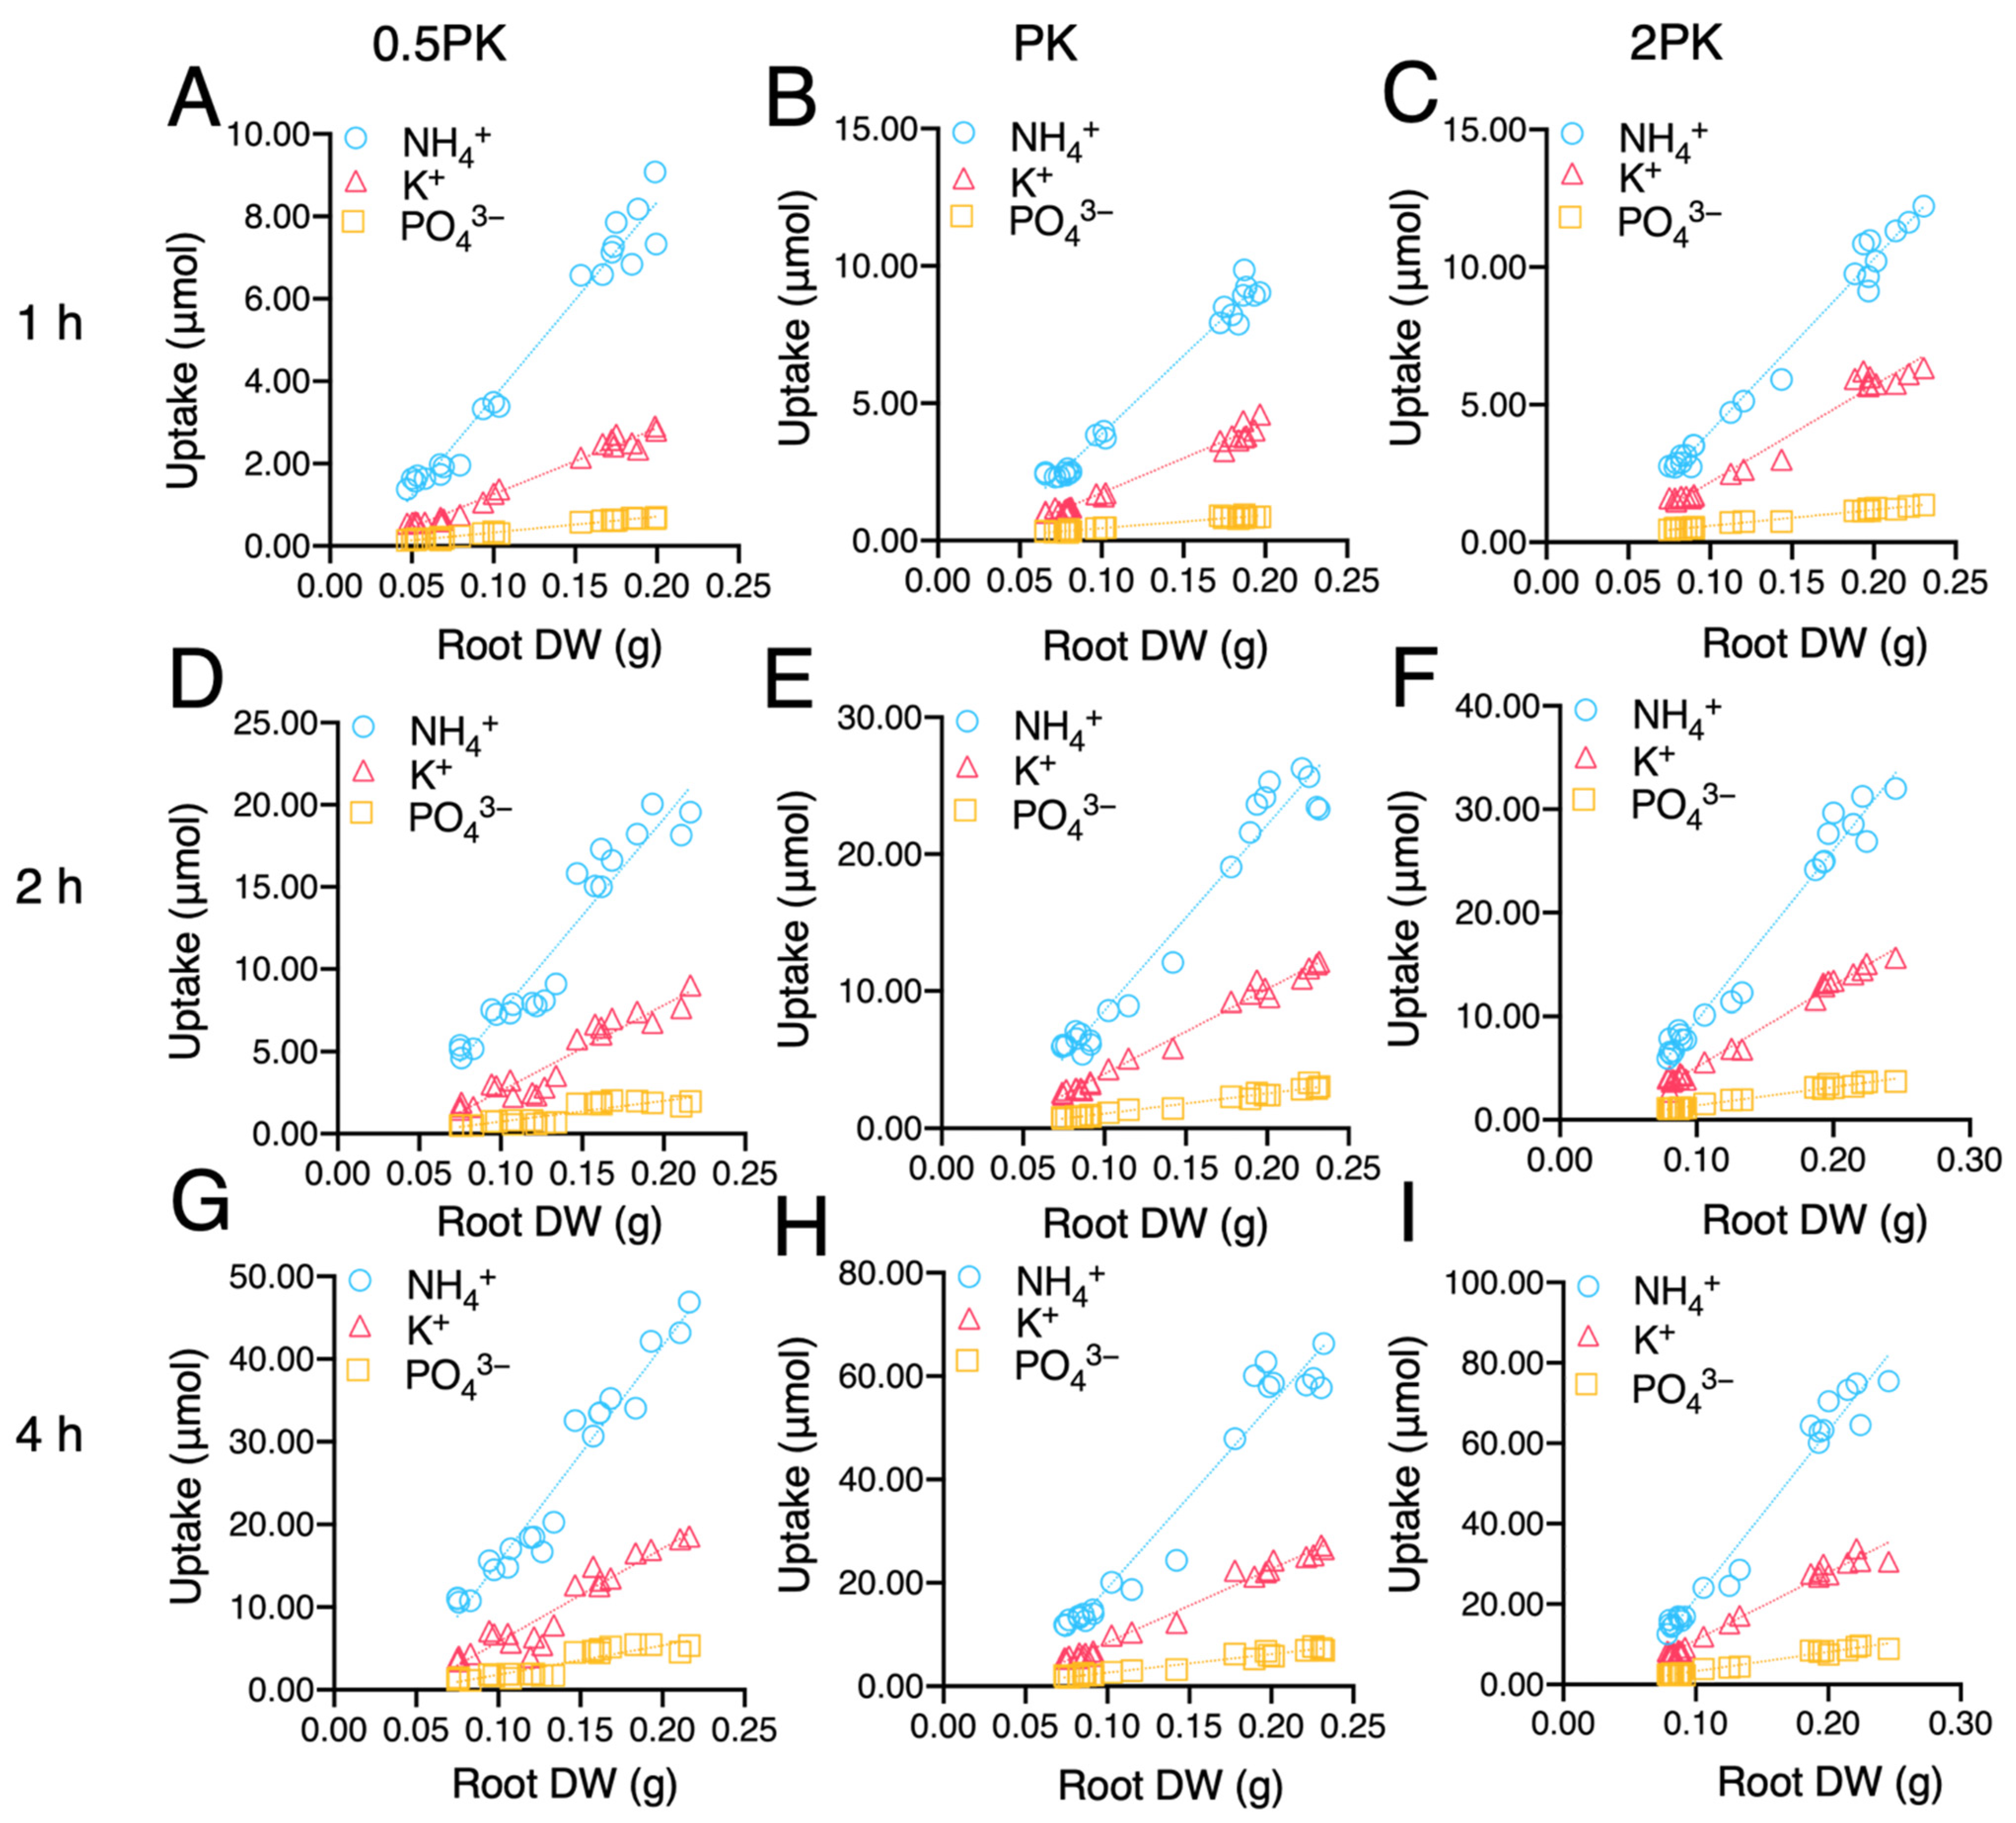
2.5. Correlation between N/P/K Uptakes and Root Morphology
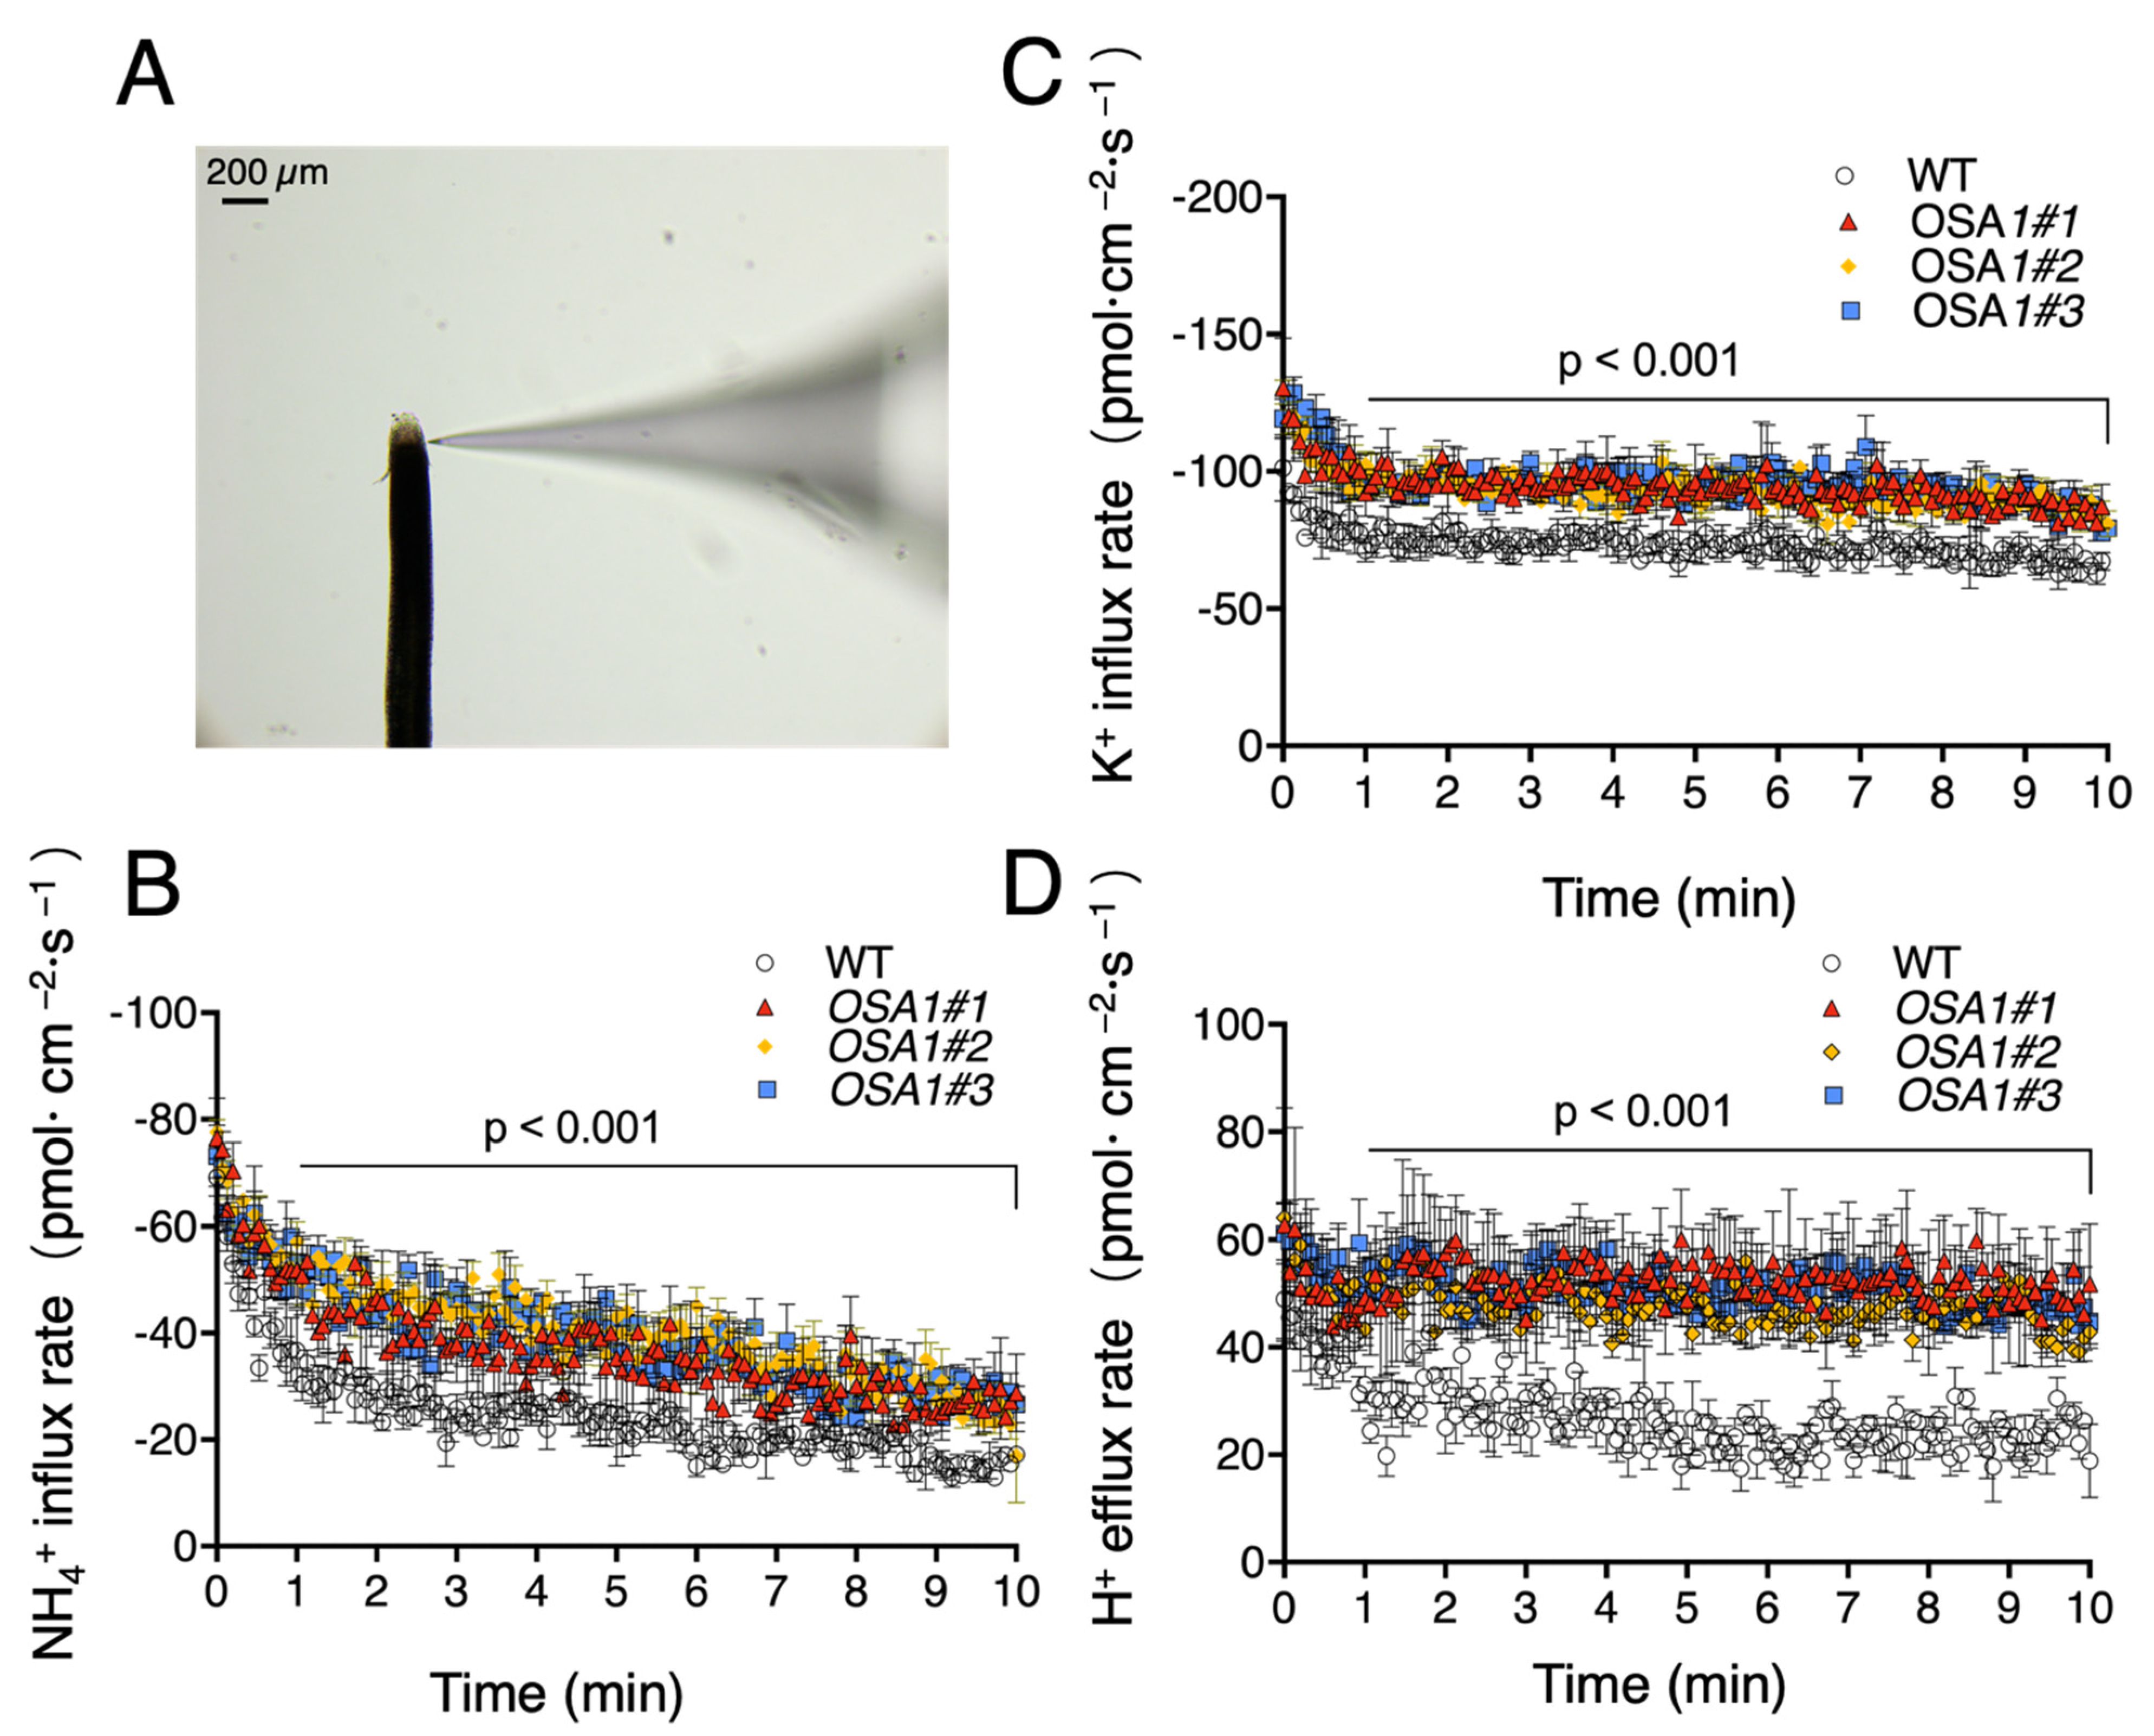
2.6. OSA1 Overexpression Promotes Cation Fluxes in Rice Roots under High-Affinity Transport Concentrations
3. Discussion
4. Materials and Methods
4.1. Plant Cultivation
4.2. Nutrient Uptake Rate Determination
4.3. Measurements of Net Proton, K+, and NH4+ Fluxes Rate in Roots
4.4. Quantitative Reverse-Transcription PCR
4.5. Measurement of PM H+-ATPase Activity
4.6. Statistical Analysis
Supplementary Materials
Author Contributions
Funding
Institutional Review Board Statement
Informed Consent Statement
Data Availability Statement
Conflicts of Interest
References
- Arango, M.; Gévaudant, F.; Oufattole, M.; Boutry, M. The plasma membrane proton pump ATPase: The significance of gene subfamilies. Planta 2003, 216, 355–365. [Google Scholar] [CrossRef] [PubMed]
- Heven, S.; Li, X.H.; Palmgren, M.G. Energization of Plant Cell Membranes by H+-Pumping ATPases: Regulation and Biosynthesis. Plant Cell 1999, 11, 677–689. [Google Scholar]
- Chang, C.R.; Hu, Y.B.; Sun, S.B.; Zhu, Y.Y.; Ma, G.J.; Xu, G.H. Proton Pump OsA8 Is Linked to Phosphorus Uptake and Translocation in Rice. J. Exp. Bot. 2009, 60, 557–565. [Google Scholar] [CrossRef] [Green Version]
- Zhu, Y.Y.; Di, T.J.; Xu, G.H.; Chen, X.; Zeng, H.Q.; Yan, F.; Shen, Q.R. Adaptation of Plasma Membrane H+-ATPase of Rice Roots to Low PH as Related to Ammonium Nutrition. Plant Cell Environ. 2009, 32, 1428–1440. [Google Scholar] [CrossRef] [PubMed]
- Cao, Y.; Zhang, M.; Liang, X. Natural variation of an EF-hand Ca2+-binding-protein coding gene confers saline-alkaline tolerance in maize. Nat. Commun. 2020, 11, 186. [Google Scholar] [CrossRef] [Green Version]
- Olsson, A.; Svennelid, F.; Sommarin, M. A phosphothreonine residue at the c-terminal end of the plasma membrane H+-ATPase is protected by fusicoccin-induced 14–3–3 binding1. Plant Physiol. 1998, 2, 2. [Google Scholar] [CrossRef] [Green Version]
- Fuglsang, A.T.; Visconti, S.; Drumm, K.; Jahn, T.; Stensballe, A.; Mattei, B.; Jensen, O.N.; Aducci, P.; Palmgren, M.G. Binding of 14–3–3 protein to the plasma membrane H(+)-ATPase AHA2 involves the three C-terminal residues Tyr(946)-Thr-Val and requires phosphorylation of Thr(947). J. Biol. Chem. 1999, 274, 36774–36780. [Google Scholar] [CrossRef] [Green Version]
- Kinoshita, T.; Shimazaki, K.I. Blue Light Activates the Plasma Membrane H+-ATPase by Phosphorylation of the C-Terminus in Stomatal Guard Cells. EMBO J. 1999, 18, 5548–5558. [Google Scholar] [CrossRef] [Green Version]
- Takahashi, K.; Hayashi, K.; Kinoshita, T. Auxin activates the plasma membrane H+-ATPase by phosphorylation during hypocotyl elongation in Arabidopsis. Plant Physiol. 2012, 159, 632–641. [Google Scholar] [CrossRef] [Green Version]
- Spartz, A.K.; Ren, H.; Park, M.E.; Grandt, K.N.; Lee, S.H.; Murphy, A.S.; Sussman, M.R.; Overvoorde, P.J.; Gray, W.M. SAUR Inhibition of PP2C-D Phosphatases Activates Plasma Membrane H+-ATPases to Promote Cell Expansion in Arabidopsis. Plant Cell. 2014, 26, 2129–2142. [Google Scholar] [CrossRef] [Green Version]
- Inoue, S.; Takahashi, K.; Okumura-Noda, H.; Kinoshita, T. Auxin influx carrier AUX1 confers acid resistance for Arabidopsis root elongation through the regulation of plasma membrane H+-ATPase. Plant Cell Physiol. 2016, 57, 2194–2201. [Google Scholar] [CrossRef] [PubMed]
- Raghothama, K.G. Phosphate acquisition. Annu. Rev. Plant Physiol. Mol. Biol. 1999, 50, 665–693. [Google Scholar] [CrossRef] [PubMed]
- Marschner, P. Marschner’s Mineral Nutrition of Higher Plants; Elsevier: Amsterdam, The Netherlands, 2012. [Google Scholar]
- Li, J.; Long, Y.; Qi, G.; Li, J.; Xu, Z.; Wu, W.; Wang, Y. The Os-AKT1 channel is critical for K+ uptake in rice rootsandis modulated by the rice CBL1-CIPK23 complex. Plant Cell 2014, 26, 3387–3402. [Google Scholar] [CrossRef] [PubMed] [Green Version]
- Shen, H.; Chen, J.; Wang, Z.; Yang, C.; Sasaki, T.; Yamamoto, Y.; Matsumoto, H.; Yan, X. Root plasma membrane H+-ATPase is involved in the adaptation of soybean to phosphorus starvation. J. Exp. Bot. 2006, 57, 1353–1362. [Google Scholar] [CrossRef] [Green Version]
- Yan, F.; Zhu, Y.; Müller, C.; Zörb, C.; Schubert, S. Adaptation of H+-pumping and plasma membrane H+-ATPase activity in proteoid roots of white lupin under phosphate deficiency. Plant Physiol. 2002, 129, 50–63. [Google Scholar] [CrossRef] [Green Version]
- Liu, J.L.; Chen, J.D.; Xie, K.; Tian, Y.; Yan, A.N.; Liu, J.J.; Huang, Y.J.; Wang, S.S.; Zhu, Y.Y.; Chen, A.Q.; et al. A mycorrhiza- specific H+-ATPase is essential for arbuscule development and symbiotic phosphate and nitrogen uptake. Plant Cell Environ. 2020, 43, 1069–1083. [Google Scholar] [CrossRef]
- Briskin, D.P.; Margaret, C.G. Role of the Plasma Membrane H+-ATPase in K+ Transport. Plant Physiol. 1996, 111, 1199–1207. [Google Scholar] [CrossRef] [Green Version]
- Ding, M.; Zhang, M.X.; Zeng, H.Q.; Hayashi, Y.K.; Zhu, Y.Y.; Kinoshita, T. Molecular basis of plasma membrane H+-ATPase function and potential application in the agricultural production. Plant Physiol. Bioch. 2021, 168, 0981–9428. [Google Scholar] [CrossRef]
- Palmgren, M.G. Plant Plasma Membrane H + -ATPases. Annu. Rev. Plant Physiol. Mol. Biol. 2001, 52, 817–845. [Google Scholar] [CrossRef] [Green Version]
- Sperandio, M.V.L.; Santos, L.A.; Bucher, C.A. Isoforms of plasma membrane H -ATPase in rice root and shoot are differentially induced by starvation and resupply of NO3- or NH4+. Plant Sci. 2011, 180, 251–258. [Google Scholar] [CrossRef]
- Yang, T.; Feng, H.; Zhang, S. The potassium transporter OsHAK5 alters rice architecture via ATP-dependent transmembrane auxin fluxes. Plant Commn. 2020, 1, 100052. [Google Scholar] [CrossRef] [PubMed]
- Zhang, M.X.; Wang, Y.; Chen, X.; Xu, F.Y.; Ding, M.; Ye, W.X.; Kawai, Y.Y.; Toda, Y.S.; Hayashi, Y.K.; Suzuki, T.; et al. Plasma Membrane H+-ATPase Overexpression Increases Rice Yield via Simultaneous Enhancement of Nutrient Uptake and Photosynthesis. Nature Commn. 2021, 12, 735. [Google Scholar] [CrossRef] [PubMed]
- Bao, A.; Liang, Z.; Zhao, Z.; Cai, H. Overexpressing of OsAMT1–3, a High Affinity Ammonium Transporter Gene, Modifies Rice Growth and Carbon-Nitrogen Metabolic Status. Int. J. Mol. Sci. 2015, 16, 9037–9063. [Google Scholar] [CrossRef] [PubMed] [Green Version]
- Anandan, A.; Parameswaran, C.; Mahender, A. Trait variations and expression profiling of OsPHT1 gene family at the early growth-stages under phosphorus-limited conditions. Sci. Rep. 2021, 11, 13563. [Google Scholar] [CrossRef] [PubMed]
- Chen, G.; Hu, Q.; Luo, L.; Yang, T.; Zhang, S.; Hu, Y.; Yu, L.; Xu, G. Rice potassium transporter OsHAK1 is essential for maintaining potassium-mediated growth and functions in salt tolerance over low and high potassium concentration ranges. Plant Cell Environ. 2015, 38, 2747–2765. [Google Scholar] [CrossRef]
- Milla, R.; Castro-Díez, P.; Maestro-Martínez, M. Relationships between phenology and the remobilization of nitrogen, phosphorus and potassium in branches of eight Mediterranean evergreens. New Phytol. 2005, 168, 167–178. [Google Scholar] [CrossRef] [Green Version]
- Wang, Y.; Chen, Y.F.; Wu, W.H. Potassium and phosphorus transport and signaling in plants. J. Integr. Plant Biol. 2021, 63, 34–52. [Google Scholar] [CrossRef]
- Rodríguez-Navarro, A. Potassium Transport in Fungi and Plants. Biochim. Biophys. Acta. Biomembr. 2000, 1469, 1–30. [Google Scholar] [CrossRef]
- Weng, L.; Zhang, M.; Wang, K.; Chen, G.; Ding, M.; Yuan, W.; Zhu, Y.; Xu, W.; Xu, F. Potassium alleviates ammonium toxicity in rice by reducing its uptake through activation of plasma membrane H+-ATPase to enhance proton extrusion. Plant Physiol. Biochem. 2020, 151, 429–437. [Google Scholar] [CrossRef]
- Hoffmann, R.D.; Olsen, L.I.; Ezike, C.V.; Pedersen, J.T.; Manstretta, R.; López-Marqués, R.L.; Palmgren, M. Roles of plasma membrane proton ATPases AHA2 and AHA7 in normal growth of roots and root hairs in Arabidopsis thaliana. Physiol. Plant 2019, 166, 848–861. [Google Scholar] [CrossRef] [Green Version]
- Ren, H.; Park, M.Y.; Spartz, A.K.; Wong, J.H.; Gray, W.M. A subset of plasma membrane-localized PP2C.D phosphatases negatively regulate SAUR-mediated cell expansion in Arabidopsis. PLoS Genet. 2018, 14, e1007455. [Google Scholar] [CrossRef] [PubMed]
- Shukla, D.; Rinehart, C.A.; Sahi, S.V. Comprehensive study of excess phosphate response reveals ethylene mediated signaling that negatively regulates plant growth and development. Sci. Rep. 2017, 7, 3074. [Google Scholar] [CrossRef] [Green Version]
- Xu, X.; Du, X.; Wang, F.; Sha, J.; Chen, Q.; Tian, G.; Zhu, Z.; Ge, S.; Jiang, Y. Effects of Potassium Levels on Plant Growth, Accumulation and Distribution of Carbon, and Nitrate Metabolism in Apple Dwarf Rootstock Seedlings. Front. Plant Sci. 2000, 11, 904. [Google Scholar] [CrossRef]
- Hou, L.; Zhang, X.; Feng, G. Arbuscular mycorrhizal enhancement of phosphorus uptake and yields of maize under high planting density in the black soil region of China. Sci. Rep. 2021, 11, 1100. [Google Scholar] [CrossRef] [PubMed]
- Newman, E.I.; Andrews, R.E. Uptake of phosphorus and potassium in relation to root growth and root density. Plant Soil 2004, 38, 49–69. [Google Scholar] [CrossRef]
- Sondergaard, T.E.; Schulz, A.; Palmgren, M.G. Energization of Transport Processes in Plants. Roles of the Plasma Membrane H+-ATPase. Plant Physiol. 2004, 136, 2475–2482. [Google Scholar] [CrossRef] [PubMed] [Green Version]
- Jia, L.; Xie, Y.; Wang, Z.; Luo, L.; Zhang, C.; Pélissier, P.M.; Parizot, B.; Qi, W.; Zhang, J.; Hu, Z.; et al. Rice plants respond to ammonium stress by adopting a helical root growth pattern. Plant J. 2020, 104, 1023–1037. [Google Scholar] [CrossRef]
- Kühtreiber, W.M.; Jaffe, L.F. Detection of extracellular calcium gradients with a calcium specific vibrating electrode. J. Cell Biol. 1990, 110, 1565–1573. [Google Scholar] [CrossRef] [Green Version]
- Hu, W.; Di, Q.; Wang, Z. Grafting alleviates potassium stress and improves growth in tobacco. BMC Plant Biol. 2019, 19, 130. [Google Scholar] [CrossRef]
- Wang, K.; Hu, Q.; Wei, Y.; Yin, H.; Sun, C.; Liu, G. Uptake Kinetics of NH4+, NO3- and H2PO4- by Typha orientalis, Acorus calamus L.; Lythrum salicaria L.; Sagittaria trifolia L. and Alisma plantago-aquatica Linn. Sustainability 2021, 13, 434. [Google Scholar] [CrossRef]
- Xu, W.; Jia, L.; Shi, W.; Liang, J.; Zhou, F.; Li, Q.; Zhang, J. Abscisic acid accumulation modulates auxin transport in the root tip to enhance proton secretion for maintaining root growth under moderate water stress. New Phytol. 2013, 197, 139–150. [Google Scholar] [CrossRef] [PubMed]
- Wang, Y.; Noguchi, K.; Ono, N.; Inoue, S.I.; Terashima, I.; Kinoshita, T. Overexpression of plasma membrane H+-ATPase in guard cells promotes light-induced stomatal opening and enhances plant growth. Proc. Natl. Acad Sci. USA 2014, 111, 533–538. [Google Scholar] [CrossRef] [PubMed] [Green Version]
- Livak, K.J.; Schmittgen, T.D. Analysis of relative gene expression data using real-time quantitative PCR and the 2(-Delta Delta C(T)) Method. Methods 2001, 25, 402–408. [Google Scholar] [CrossRef] [PubMed]


Publisher’s Note: MDPI stays neutral with regard to jurisdictional claims in published maps and institutional affiliations. |
© 2022 by the authors. Licensee MDPI, Basel, Switzerland. This article is an open access article distributed under the terms and conditions of the Creative Commons Attribution (CC BY) license (https://creativecommons.org/licenses/by/4.0/).
Share and Cite
Ding, M.; Zhang, M.; Wang, Z.; Yu, X.; Kinoshita, T.; Zeng, H.; Zhu, Y. Overexpression of a Plasma Membrane H+-ATPase Gene OSA1 Stimulates the Uptake of Primary Macronutrients in Rice Roots. Int. J. Mol. Sci. 2022, 23, 13904. https://doi.org/10.3390/ijms232213904
Ding M, Zhang M, Wang Z, Yu X, Kinoshita T, Zeng H, Zhu Y. Overexpression of a Plasma Membrane H+-ATPase Gene OSA1 Stimulates the Uptake of Primary Macronutrients in Rice Roots. International Journal of Molecular Sciences. 2022; 23(22):13904. https://doi.org/10.3390/ijms232213904
Chicago/Turabian StyleDing, Ming, Maoxing Zhang, Zihui Wang, Xin Yu, Toshinori Kinoshita, Houqing Zeng, and Yiyong Zhu. 2022. "Overexpression of a Plasma Membrane H+-ATPase Gene OSA1 Stimulates the Uptake of Primary Macronutrients in Rice Roots" International Journal of Molecular Sciences 23, no. 22: 13904. https://doi.org/10.3390/ijms232213904