Article

Neurodegenerative Disorder Risk in Krabbe Disease Carriers

1
Functional Proteomics Laboratory, Department of Life Sciences, University of Siena, 53100 Siena, Italy
2
Department of Pulmonology, Hannover Medical School, Carl-Neuberg-Straße 1, 30625 Hannover, Germany
3
Department of Life Sciences, University of Siena, 53100 Siena, Italy
4
Department of Biochemical and Biotechnological Sciences, Section of Physiology, University of Catania, 95121 Catania, Italy
5
Department of Molecular and Developmental Medicine, University of Siena, 53100 Siena, Italy
*
Author to whom correspondence should be addressed.
Int. J. Mol. Sci. 2022, 23(21), 13537; https://doi.org/10.3390/ijms232113537
Submission received: 4 October 2022 / Revised: 26 October 2022 / Accepted: 30 October 2022 / Published: 4 November 2022

Abstract

:
Krabbe disease (KD) is a rare autosomal recessive disorder caused by mutations in the galactocerebrosidase gene (GALC). Defective GALC causes aberrant metabolism of galactolipids present almost exclusively in myelin, with consequent demyelinization and neurodegeneration of the central and peripheral nervous system (NS). KD shares some similar features with other neuropathies and heterozygous carriers of GALC mutations are emerging with an increased risk in developing NS disorders. In this work, we set out to identify possible variations in the proteomic profile of KD-carrier brain to identify altered pathways that may imbalance its homeostasis and that may be associated with neurological disorders. The differential analysis performed on whole brains from 33-day-old twitcher (galc −/−), heterozygous (galc +/−), and wild-type mice highlighted the dysregulation of several multifunctional factors in both heterozygous and twitcher mice. Notably, the KD-carrier mouse, despite its normal phenotype, presents the deregulation of vimentin, receptor of activated protein C kinase 1 (RACK1), myelin basic protein (MBP), 2′,3′-cyclic-nucleotide 3′-phosphodiesterase (CNP), transitional endoplasmic reticulum ATPase (VCP), and N-myc downstream regulated gene 1 protein (NDRG1) as well as changes in the ubiquitinated-protein pattern. Our findings suggest the carrier may be affected by dysfunctions classically associated with neurodegeneration: (i) alteration of (mechano) signaling and intracellular trafficking, (ii) a generalized affection of proteostasis and lipid metabolism, with possible defects in myelin composition and turnover, and (iii) mitochondrion and energy supply dysfunctions.

Graphical Abstract

1. Introduction

Krabbe disease (KD) (OMIM #245200), also known as globoid cell leukodystrophy, is a neurological disorder presenting demyelination and impaired neuronal transmission. It is a rare autosomal recessive disease that affects the central and peripheral nervous system (CNS and PNS, respectively). Infantile, juvenile, and adult-onset forms of KD have been described, with the infantile form being the most common, rapidly progressive, and fatal while the latter presenting less severity and slower progression [1,2].
KD is a lysosome storage disease (LSD) caused by the functional deficiency of galactocerebrosidase (GALC). This lysosomal enzyme is vital for the degradation of sphingolipids, for the recycling of sphingosine and ceramide, and, consequently, for myelin synthesis and homeostasis [3,4,5,6]. Biochemical defects related to GALC aberrant functionality cause abnormal myelin turnover that leads to demyelination, neurodegeneration, and neuroinflammation, with white matter perivascular monocyte/macrophage infiltrates [7].
Although it is not unique in catabolizing the myelin highly-abundant sphingolipid galactosylceramide (GalCer), GALC is the only known enzyme able to degrade galactosylsphingosine (psychosine, Psy), whose accumulation is highly toxic [8]. Nonetheless, increasing evidence suggests that all the dysfunctions described in KD cannot be merely explained by psychosine accumulation and that additional mechanisms could be involved. In fibroblasts from KD patients, Papini et al. [9] have recently correlated increased concentrations of lactosylceramide (LacCer), a bioactive lipid metabolized by GALC, to several signaling pathway alterations involved in neurodegeneration. Other studies have also reported axonal defects independent of Psy accumulation or demyelinization [10,11]. In fact, Kreher et al. [11] proved that GALC absence in neurons triggers neuro-axonal degeneration and related inflammatory demyelination. In addition, neuron-specific GALC ablation was described in attenuating neuron maturation during brain development [12], and thus intimately impacting the CNS properties.
Phenotypically, KD shares similar traits with other neurodegenerative disorders that, in some cases, correlate to similar molecular defects. Notably, several papers report KD patients, prevalently with late onset KD, and misdiagnosed as affected by MS. Sahai et al. [13] discussed the MS family history of a KD patient with infantile-onset KD. In addition, genome-wide association studies (GWAS) and expression analyses recognized, in the GALC SNPs and expression levels, highly significant patterns distinguishing a number of people with MS (PwMS) from healthy controls [14,15,16]. Currently, the GALC gene (14q31) is actually considered a susceptibility locus for MS [15]. Furthermore, α-synuclein fibrillization and Lewy body (LB) formation, which are characteristic features of synucleinopathies, lipidoses, other LSDs, and mitochondrial diseases, were described in KD human and mouse brains [17,18].
Despite the very low incidence of KD [1:100,000 live births in the United States and Europe, with a pick of incidence recorded in Sweden (1:39,000)] [19,20], heterozygous carriers are estimated to be frequent in Caucasians (1:150) [21] and are suggested to carry a risk for neurological disorder onset [5]. In fact, despite carriers of recessive disorders not being clinically ill, they may present non-physiological biochemical and molecular traits that may predispose them to develop a disease state [16]. In fact, carriers of mutations causing KD are known for presenting an increased risk for developing open angle glaucoma and pulmonary artery enlargement in chronic obstructive pulmonary disease [22,23]. Furthermore, the galc +/− mutation carrier mouse, from the twitcher (Twi) KD-model, seems to corroborate these hypotheses. After cuprizone administration, young adult heterozygous mice, despite being apparently healthy and identical, in physiological conditions, to wild-type (WT), present a reduced remyelination response and an impaired microglial reaction to myelin damage when compared with similarly treated WT animals. These defects result in a reduced debris clearance and a more frequent inflammation occurrence, which may increase the possibility to develop auto-antibodies against components of myelin sheaths [16]. In addition, a late onset manifestation of GALC deficiency in Twi mice underwent massive gene therapy (galc transgene) consisting of brain lesions associated with leakage of the blood–brain barrier and plasma fibrinogen extravasation (PFE), with consequent activation of the fibrinogen-bone morphogenic protein (BMP)-SMAD-glial fibrillary acidic protein (GFAP) glia response [24]. In particular, PFE observed in late Twi treated-mice, where galc transgene decreased in expression, resembles microglial activation and brain damage observed in neurological disorders. Asymptomatic galc +/− heterozygous mice also present, similarly to Twi animals, an increase in oxidative stress markers, i.e., F2-isoprostanes and F4-neuroprostanes, that were generated from polyunsaturated fatty acid oxidative damage. Their occurrence is retained impacting on the nervous system (NS) and associated with neurological diseases [25].
Based on these premises, we performed a functional proteomic analysis on whole brain lysates from 33-day-old Twi, heterozygous galc +/− carrier (Het), and wild-type (WT) mice [26] to identify molecular affections and related biomarkers that, over time, may increase or report an increased risk for carriers to develop NS affections. As proteoform heterogeneity define protein properties and the functional profile of investigated systems, we applied a 2DE/mass spectrometry approach with the intent to capture and visualize, on a large scale, possible different proteoform presences that may differentially impact mutants’ physiology.
According to our data, the Het proteome profile diverges from both WT and Twi ones. Hence, we provide an integrated overview on the identified protein differences to delineate their eventual correlation to biochemical and molecular aberrances previously described in other neuropathologies. Our data suggest significant dysfunctions in different pathways, critical for CNS homeostasis, occurring in Het brain. These are likely to make KD carriers more vulnerable to any other risk factor, either environmental or genetic, thus exposing them to a greater likelihood of developing neuropathies.

2. Results and Discussion

We applied a functional proteomic approach on whole brain protein extracts obtained from 33-day-old twitcher, galc +/− heterozygous, and wild-type mice. At this age, the disease is overt in Twi and GALC activity drastically lower than in the controls [27]. Nonetheless, they are still viable since death occurs by ~40 days after birth. Twenty-seven highly significant protein differences were detected among these sample classes (Figure 1) by applying 2DE and gel image analysis (on seven gels for each tested condition), rigorous statistics, and result filtering for %Vol fold change. Then, MALDI-TOF/TOF mass spectrometry successfully identified 23 of the differing protein spots, which correspond to 21 unique proteins (Table 1 and Figure 2).
The variance-covariance analysis was performed by principal component analysis (PCA) on the %Vol values of significantly differing spots and the first three axes of variation, i.e., PC1, PC2, and PC3, explain the 27.5%, 19.8%, and 13.1% of variance, respectively. The PC1/PC2 plot (Figure 3) shows Het mice clustering apart from the others on the right side of PC1 and partially overlapping with the Twi and WT groups around the center of PC2 (Figure 3A). The WT cluster is instead interposed, on PC1/PC2 (Figure 3A) and PC1/PC3 (Figure 3B) plots, between the other two conditions and presents a relatively low PC1 variability with a relevant clustering. Finally, Twi and Het mice widely overlap on the PC1/PC2 and partially on PC2/PC3 plots throughout PC2 and PC3 axes, respectively (Figure 3C).
Overall, PCA evidences that Het animals, despite being apparently “normal”, present a distinct biochemical profile from Twi and WT mice, which may expose Het to an increased risk to develop other disorders, including neuropathologies [28].
To further the understanding of the biological implications that the protein profile outlined in Het may have, we performed a bioinformatics analysis and predicted functional interactions occurring between the 21 differentially identified abundant unique proteins by applying the shortest-path-network (SPN) building tool from the MetaCore resource. Except for tropomodulin-2, all the processed proteins entered into the SPN, resulting in being perfectly embedded in their functionality. This underlines that identified factors belong to the same or related biochemical pathways.
Vimentin (VIME), protein NDRG1 (alternative name: N-myc downstream-regulated gene 1 protein), receptor of activated protein C kinase 1 (RACK1), transitional endoplasmic reticulum ATPase (alternative name: valosin-containing protein, VCP), and myelin basic protein (MBP) emerged as central hubs, by establishing the highest number of interactions with the other proteins of the net (Figure 4). Furthermore, the MetaCore enrichment analysis in the “Pathways Maps” ontology, which highlights the molecular pathways related to identified differences (Table S1), suggested the presence of cytoskeleton remodeling and neuronal cell development affections and their direct correlation to VIME and MBP deregulation in Twi as well as in Het mice.

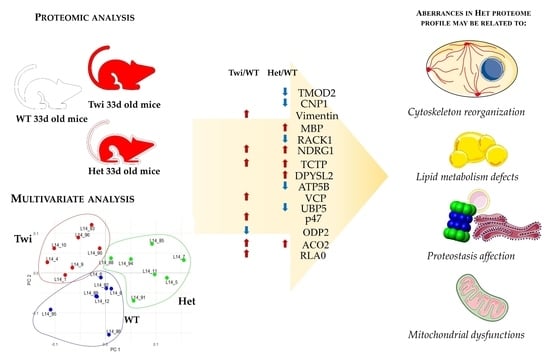
2.1. Cytoskeleton (Re)Organization and Its Possible Roles in Myelination Dynamics of KD Carriers

Vimentin spot 13 is the most differing protein spot among the significant differences we detected (Table 1, Figure 2), by showing fold changes of 12.75 and 5.77 in the Twi vs. Het and Twi vs. WT comparisons, respectively. In addition, the anti-VIME 2D WB, shown in Figure 5, evidenced the presence of several VIME spots exclusive to the Twi mouse. A complex VIME pattern, not merely limited to the protein abundance of spot 13, evidently distinguishes the Twi from Het and WT animals. This type III intermediate filament (IF) is an astrocyte marker whose increased expression characterizes reactive astrocytosis and that was previously described in CNS and PNS of 30/33-day-old Twi mice [29]. Although the effective role of its increase has not been defined, vimentin was proved to participate in CNS damage-restraint by sequestering affected areas [30]. Interestingly, its down-regulation was also reported as having pathological effects by negatively regulating myelination [31] and causing several astrocyte dysfunctions during cell migration, vesicle trafficking, oxidative stress response, reconstruction of the blood–brain barrier, and interaction with microglia [31]. On the one hand, the very high up-regulation of vimentin in Twi can derive from an extensive astrocytosis following wide myelin damage. On the other hand, the decrease in the spot 13 proteoform (Figure 1), although not significant, the lack of the immunosignals 1 and 2 (Figure 5A–C), and the general intensity decrease in various immunosignals (Figure 5A–C) in Het animals may imply the occurrence of differences in VIME processing and in related cytoskeleton structure and dynamics between the WT and Het mice. The immunosignal intensity heatmap (Figure 5D) and the multiple line chart (Supplementary Figure S1) visualize an overall affection of the vimentin pattern in Het, which differs from both WT and Twi mice.
Cytoskeleton defects are known to impair numerous cell functions, such as mechanosignaling, migration, differentiation, proliferation, intracellular trafficking, and mitochondria metabolism and activities. Several of these processes have been described as defective in KD [31,32,33]. In particular, abnormal cytoskeleton is widely associated to neurodegeneration [34,35] and aberrances in VIME post-translational modifications, e.g., phosphorylation, have been described in some degenerative neuropathies, such as Niemann–Pick disease Type C1 [36] and Huntington’s disease [37], or as a marker of activated astrocytes, i.e., citrullination, in Creutzfeldt–Jakob disease [38].
The relevance of this IF in the pathophysiology of KD advanced stage and maybe in affections of young adult carriers is further stressed by the MetaCore SPN, where VIME resulted in the main central hub. SPN also evidences a tight indirect regulation of VIME by RACK1, another main hub of the net. RACK1 is actually suggested modulating VIME by controlling STAT1, STAT3, AP-1, HIF1A, and SMAD3 transcription factors, PKC and AKT kinases as well as the protein phosphatase 2A (PP2A catalytic), and the actin-network component filamin-A. Notably, all these interactors are known to play key roles in NS physiology and their dysfunctions have been associated with several neuropathies, including tauopathies [39,40,41,42,43,44,45,46,47,48,49].
Besides its functional correlation with VIME, RACK1 acts as a neuroprotective factor [50,51] whose down-regulation (Table 1, Figure 2, spot 22) further stresses the possible occurrence of myelin dyshomeostasis related to cytoskeleton dysfunctions in Het animals. As a plectin-binding protein, RACK1 is in fact thought linking constituents of different signaling pathways to the cytoskeleton and mediating signal transmission to cytoskeleton remodeling machineries [52]. Among others, the above mentioned PKC is anchored to the cytoskeleton and held in active conformation by interacting with this scaffold protein [53]. Interestingly, dysfunctions in PKC anchoring caused by defects in RACK1 have been associated to aging and to AD pathophysiology [52]. After all, RACK1 dependent PKC signal transduction regulates the MBP phosphorylation [54,55] whose defects can cause demyelination in MS [56]. The RACK1 down-regulation detected in Het animals may hence represent a potential molecular link between the heterozygote GALC mutant and the risk for developing MS in humans, principally related to the failure of remyelination in progressive MS [5,14,57,58].
MBP is a highly abundant and essential membrane stacker in CNS and PNS myelin [59]. Smirnova et al. [60] have recently delineated the wide interatomic pattern of MBP, which reveals an incredible, heterogeneous, and complex plethora of functions in which this intrinsically disordered protein may act. Among others, the MBP-interacting net includes cytoskeleton components and proteins involved in the reorganization of the actin cytoskeleton at the plasma membrane and cell adhesions [60]. By linking the underling cytoskeleton and proteins containing SH3 domains to the membrane, it is also active in transmembrane signal transduction to the cytosol and, consequently, in myelinating cell response control [61].
MBP molecular interactors and related functions are intimately defined by the maturation processes it undergoes. MBP presents a complex proteoform pattern, resulting from alternative splicing and differential post-translational modifications, that profoundly influences myelin physiology and related pathology. Besides the above mentioned phosphorylation, MBP citrullination levels correlate with myelin sheath instability and MS pathogenesis and severity [62,63,64].
The abundance of the MBP-proteoform spot difference we identified (Table 1, Figure 2, spot 27) is considerably increased in Het with respect to both Twi and WT animals (Table 1, Figure 2). Since this structural myelin protein is the only known factor indispensable to generate compact myelin sheaths in the CNS and in reason of its aforementioned functional plasticity related to its post translational modifications (PTMs), the MBP proteoform observed increase in KD carriers could have a biochemical echo in myelin stability and integrity maintenance [65].
On the same line of reasoning, a probable axon dysfunction and dyshomeostasis process in myelinating cells from Het mice may also be supposed in relation to the significant decrease in 2′,3′-cyclic-nucleotide 3′-phosphodiesterase (CNP) that we detected occurring between Het and WT animals (Table 1, Figure 2, spot 12). This protein is an oligodendrocyte early differentiation marker with microtubule-associated-protein (MAP) like functions that was reported as counteracting MBP by organizing the F-actin cytoskeleton to prevent cytosolic membrane leaflet collapsing in the multilayered myelin [66]. Although its function is not fully understood, CNP is thought to play a crucial role in myelin physiology [67]. It is in fact essential for murine axonal survival but not for myelin assembly, and adult CNPase-null mice present a normal myelin morphology but develop neurodegeneration [68]. Interestingly, Al-Abdi et al. [66] reported a normal development before hypomyelinating leukodystrophy and premature death in consanguineous patients presenting CNP deficiency. In addition, erythrocytes from PwMS have lower CNP activity than control cells [69]. In PwMS, this protein was also recognized as a target of self-antigens and described as involved in the pathological demyelination of axon terminals [70].
Our hypothesis on a probable cytoskeletal rearrangement, with reasonable neurological effects, in carrier brains is further strengthened by the detected deregulation of other cytoskeletal modulators, i.e., NDRG1, the translationally-controlled tumor protein (TCTP), tropomodulin-2, and transegelin-3 (Table 1, Figure 2).
The latter (spot 25), up-regulated in Het mice compared to both Twi and WT animals, is an actin and tubulin co-localizing protein of the NS that is considered relevant in neuron plasticity [71] and in maintaining neuronal morphology [72], which was confirmed to be down-regulated in the brain of Alzheimer’s disease (AD) patients [73].
In addition, tropomodulin-2, decreased in Het mice (spot 17), is a neuron-specific regulatory protein that prevents elongation and depolymerization of actin filaments [74].
NDRG1 (spot 15) and TCTP (spot 24), significantly up-regulated in Het and Twi mice when compared to WT animals, control instead microtubule dynamics [75,76,77]. The SPN central hub NDRG1, conceivably by regulating also lipid metabolism [78], is crucial for the development and maintenance of Schwann myelin sheath and of adult myelinating oligodendrocytes. Its deficiency leads to Schwann cell dysfunction and may result in greater susceptibility of myelin to damage in PwMS brain [79,80]. Noteworthy, the SNP evidenced an indirect functional correlation existing between RACK1 and NDRG1. Specifically, the former controls the latter through the serine/threonine-protein kinase PLK1 (PLK1), AKT/PKB, PKC, and the transcription factors p73, AP-1, and HIF1A. As stated above, several of these factors, as well as other SPN transcription factors (i.e., the estrogen receptor ESR1, p53, and STAT5A) functionally linked to NDRG1 but not under the direct RACK1 activity (Figure 4), have been reported to be involved in KD or in other neurodegenerative disorders [78,81,82,83,84,85,86,87,88,89,90,91,92,93,94]. Not coincidentally, NDRG1 expression and activity may depend on different endogenous and environmental signals, such as cell differentiation, p53-mediated apoptosis, hypoxia, and endoplasmic reticulum (ER) stress [95,96,97,98,99,100], which are aberrant or increased in KD patients and that have been correlated to psychosine accumulation [25]. Moreover, NDRG1 is widely described as dysregulated in Charcot–Marie–Tooth disease type 4, which presents severe and progressive demyelination, and, with other NDRG family members (e.g., NDRG2), it might influence other neurodegenerative disorders such as AD, the above mentioned MS, and frontotemporal lobar degeneration [78,101]. This evidence may be relevant in evaluating the risk for KD carriers to develop neuropathies related to defective cellular processes involving NDRG1 functions in ER stress response, cell trafficking, and lipid metabolism, as further discussed below [78,102,103].

2.2. Lipid Metabolism Defects in Krabbe Disease

As already stated, KD is an inborn error of lipid metabolism. Consequently, the factors involved in lipid metabolism that we have identified as differing between mutants and WT mice may help to clarify how the defective metabolization of GALC substrates radiates to other lipid metabolism processes, and definitely compromises NS lipid homeostasis.
Sphingolipids, in particular sulfatides and their precursor galactosylceramide (GalCer), are one of the main representative components of myelin. Studies in mice reported GalCer as an essential factor for neural development, for the maintenance of myelin stability, and having protective functions in both CNS and PNS [3]. GalCer is highly abundant in compact myelin and, despite myelinating cells being able to compensate for defects in lipid synthesis, GalCer and sulfatide defective synthesis causes a failure of the long-term stability of myelin [4].
Furthermore, the role of sphingolipids are not limited to structural functions: they have been reported modulating signal transduction, differentiation, apoptosis, autophagy, and necrosis [48]. GalCer, in particular, increases the thickness of raft membranes and affects membrane viscosity between its two leaflets thus interfering in membrane protein composition and activation, in membrane interactions with cytoplasmic structural proteins, and in signal transduction [6]. Sphingolipids may also be metabolized in signaling molecules that may regulate the immune and nervous systems and whose receptor targeting has been applied to treat MS [104].
Evidently, sphingolipid metabolism defects may profoundly impact myelin composition, organization, stability, and functionality [5]. In this context as well as the MBP up-regulation discussed above, it may be related to myelin disorganization in association with the altered lipid composition of myelin [74].
Moreover, Psy accumulation in lipid raft disrupts their organization, increases their cholesterol concentration, and modifies the distribution of two protein markers of these domains: flotillin-2 and caveolin-1 [105,106,107]. The latter was also provided by SPN (Figure 4) as directly linked with the mitochondrial ATP synthase subunit beta (ATPB), a protein that we detected to be down-regulated in Het mice when compared to both Twi and WT animals (Table 1, Figure 2, spot 14). Interestingly, ATPB is involved in lipoprotein uptake [108] and its expression was observed as increasing in Alzheimer’s and Huntington’s diseases [109].
Among the proteins deregulated in Het mice, numerous evidences describe the multi-functional NDRG1 also involved in lipid homeostasis by acting as an adipogenesis promoter [110], and as an important factor for oligodendrocyte cholesterol balance and differentiation [111,112]. Interestingly Pietiäinen et al. [112] also reported a significant increase in the total ceramide levels in NDRG1 depleted cells. In light of these findings and in particular for its correlation to ceramide, NDRG1 deregulation in Het and Twi animals supports the hypothesis of lipid metabolism defects and associated brain dysfunctions also in Het mice.
Recently, attention has turned to the role that dihydropyrimidinase-related protein 2 (DPYSL2), another protein up-regulated in Twi animals (Table 1, Figure 2, spot 10), seems to play during adipogenesis and lipid metabolism in metabolic disorders related to neurodegeneration. It is typically expressed in adult neurons and oligodendrocytes and represents the major phosphoprotein in neuronal tissues where it acts in microtubule stability, neuronal outgrowth, cellular polarity, and vesicle trafficking [113]. Chang et al. [114] proved DPYSL2 correlation to energy metabolism in adipogenesis and lipid deposits and to cytoskeleton remodeling necessary for lipid maturation, hence suggesting a molecular link between neurodegenerative diseases and metabolic disorders. Of relevance, DPYSL2 modulation by molecular therapy has been reported to improve symptoms of AD in animal models [115]. DPYSL2 may indeed represent an interesting molecular checkpoint for novel pharmacological attempts, especially in late-onset KD.

2.3. Proteostasis Affection in Het Mice

The proteostasis network (PN) results from a fine balance of synthesis, folding, PTM, quality control, localization, and degradation of proteins and it is fundamental for cellular physiology [116]. ER plays a pivotal role in protein homeostasis and has emerged as a key compartment for brain development and function [117]. Several autoimmune and neurodegenerative disorders are in fact associated with ubiquitination proteasome system (UPS) dysregulation and ER dysfunction [118,119,120,121,122]. Furthermore, as an LSD, KD presents defective lysosomes that result in the accumulation of undigested macromolecules, with obvious consequences for proteostasis. In general, failure in removing inherently disordered proteins, such as amyloid-β (Aβ), Tau, and α-synuclein, correlates with distorted protein–protein interactions that trigger event cascades leading to neurological affections [123]. Therefore, the control of protein homeostasis and restoring physiological protein synthesis could represent an attractive therapeutic target for these disorders [124].
ER stress is present from the very first days of life in Twi mice [32] and it may be considered as a hallmark of KD [125]. For this reason, it is extremely interesting to have detected the depletion in Het mice, when compared to both WT and Twi mice, of proteins implicated in the control of ubiquitination and related protein degradation for ER, mitochondrion, and nucleus misfolded proteins, as well as for the maturation of ubiquitin-containing autophagosomes and the clearance of ubiquitinated proteins by autophagy. Subliminal and non-phenotype-affecting proteostasis-dysfunctions, bona fide related to the presence of a mutated galc allele, may hence occur in Het young mice, even interesting different PN modules [116]. The decrease in ubiquitin carboxyl-terminal hydrolase 5 (UCHL5) and of the central hub VCP, despite the Het/WT ratio was not significant for the latter, could in fact influence the dynamic regulation and function of the Het neuronal proteome. Over time, this could relate to neurodegenerative disease development, possibly in combination with stressful conditions.
Intriguingly, VCP (Table 1, Figure 2, spot 2) is a lysosomal integrity maintenance protein, retained relevant in LSD [126], and described interrelated with neurological disorders, such as familiar forms of amyotrophic lateral sclerosis (ALS), AD, Parkinson disease (PD), and the inclusion body myopathy with early-onset Paget disease and frontotemporal dementia (IBMPFD) [127]. Among others, it forms a complex with NSFL1 cofactor p47 (p47), another down-regulated protein (Table 1, Figure 2, spot 16) in Het animals, that regulates cell soma ER morphology and function as well as tubular ER formation and extension into dendrites. VCP-p47 defective neurons actually present a reduced number of ER attached ribosomes, decreased protein synthesis, and consequent reduction in dendritic spine density [73].
Moreover, VCP AAA+ ATPase hexamer has “segregase” activity that is required for the endoplasmic reticulum-associated degradation (ERAD) and for releasing specific membrane-bound transcription factors to modulate gene expression, for extracting proteins from the mitochondrial outer membrane and to support mitophagy, and for ribosome, autophagosome, and chromatin-associated protein degradation [95,96,128]. Throughout different cellular compartments, VCP hence exerts a key control on protein synthesis, quality and degradation, also by regulating the clearance of protein aggregates and the autophagy of stress granules [127,129].
Down-stream of VCP and in association with the 19S regulatory particle of the 26S proteasome, UCHL5/UCH37 (Table 1, Figure 2, spot 1) participates in the branched-ubiquitin tag removal from protein substrates, thus controlling their access to the 20S core particle of the proteasome for degradation [130]. This differential ubiquitin tag recognition and removal is highly selective and, as different ubiquitin biopolymer structures differentially prioritize substrates for degradation, vital for proteostasis [131]. In addition, since it exerts its essential role in proteostasis also by editing and rescuing polyubiquitinated proteins before their commitment to the 20S proteasome [121,132,133], UCHL5 modulates cell protein profiles even preventing excessive protein degradation.
UCHL5 activities are finely modulated by its PTMs, which interest several residues of this deubiquitinase (DUB). Their differential occurrence and combination could modify the affinity of UCHL5 with other components of the proteasome as well as with its substrates, thus impacting on its activity and proteasome degradation [123]. Therefore, whether the decrease in the spot 1 proteoform is due to differential modulations of PTMs or due to an overall reduced presence of UCHL5, Het mice most likely have UCHL5 dysfunctions and an ubiquitinated profile affection. In line with this hypothesis, we proved an overall decrease in ubiquitinated proteins in Het mice by performing 2D WB and immunostaining with an anti-ubiquitin primary antibody (Figure 6). Although the ubiquitination pattern of Het mice is quite similar to that of WT, several spots have an evident signal decrease in carries (Figure 6A,B), as highlighted in the immunoreactive-spot intensity heatmap (Figure 6D) and multiple line chart (Supplementary Figure S2). On the contrary, the Twi mouse presents an overall qualitative and quantitative increase in ubiquitinated protein species compared to both WT and Het animals (Figure 6A–C).
The UCHL5 down-regulation observed in KD carriers acquires even more interest given the context of our analyses. UCHL5 actually exerts a crucial role in the NS [134,135]. Not only does the uchl5 knockout mouse present defects in brain development and is lethal [134], but UCHL5 may act in a neuroprotectant role by modulating NF-κB activation [136,137,138], which is notoriously affected by psychosine [81]. This DUB may also indirectly correlate to amyloid-beta precursor protein (APP) synthesis by deubiquitinating SMADs and type I TGF-β receptor and, consequently, by controlling TGF-β signaling, whose up-regulation associates with AD [139]. In different tissues and cell types, UCHL5 was also described as regulating Wnt/β-catenin signaling and related cellular survival and migration, DNA double-strand break repair, and apoptosis via Bax/Bcl-2, caspase-9, and caspase-3 [131,140]. Interestingly, the Wnt/β-catenin pathway is critical for the NS development [141].
Defects/alterations in UCHL5 activity are hence detrimental to numerous cellular functions and, as a result, the UCHL5 modulation observed in Het mice is unlikely to have no consequences in carriers’ brain physiology.
Besides its role in cytoskeleton organization and signal transduction, RACK1 has also been reported to be active in ubiquitination and proteasome-mediated degradation, as well as in cell cycle arrest and apoptosis induction [142,143].
As mentioned above, NDRG1 is a stress response protein, which widely manipulates the ER stress response and whose expression is induced, among others, by oxidative stress (OS) [102,144]. Twi mice are notoriously under OS [25,145] and the NDRG1 up-regulation we detected in these animals may be, at least in part, due to OS. Since Het animals also present the same abundance increase in the spot 15 proteoform, when compared to the control group, we may speculate that NDRG1 deregulation could similarly impact in Twi and Het mice. Although its function is somewhat controversial, cancer studies reveal that NDRG1 up-regulation reduces the pro-survival response to ER stress by attenuating the PERK-eIF2α pathway of the unfolded protein response (UPR) [102]. The consequent defective autophagy, which is a critical feature in the pathogenesis of KD [146], may further compromise cell brain survival in the Twi mouse.
On the other hand, the NDRG1 increase strengthens the hypothesis of an impaired ability of Het mice to manage stressful and damage-inducing conditions that may cause the formation of hazardous products, e.g., stress granule, whose removal is carried out by autophagy.

2.4. Mitochondrial and Energy Supply Dysfunctions

Our comparative proteomics analysis has shown mitochondrial-protein significant affection in brain samples from Twi and Het mice. This improves the delineation in Het animals of mutually-related molecular defects that may result in cellular dysfunctions, relative to several neurodegenerative diseases, strengthening the hypothesis that apparently healthy KD carriers are exposed to an increased risk of developing neuropathies. KD is an LSD caused by a defective lipid and protein metabolism that often presents LB formation [147]. Psychosine induces α-synuclein fibrillization [17] and LB have been recently described as an aberrant protein–lipid compartmentalization presenting a lipid core surrounded by dysmorphic aberrant mitochondria and α-synuclein fibrils [148]. While lipid core is coherent with KD lipid metabolism dyshomeostasis, mitochondrial occurrence in KD LB is in line with other neurological affections presenting LBs and with a consistent body of evidence that proposes mitochondrion dysfunctions playing a relevant rule in this disease onset and development [33,149]. Mitochondrial homeostasis actually depends on the integrity of autophagy and lysosomal degradation that are, as already discussed, broadly affected in KD. At the same time, psychosine has been reported as interfering with mitochondrial functionality in oligodendrocytes by affecting their permeabilization, intra- and extra-mitochondrial Ca2+ kinetics, their membrane potential and electron transport chain, oxidative phosphorylation, and cytochrome c release and caspase activation [149,150]. After all, increased ROS production and oxidative stress, largely originated from these defects, are one of the main cytotoxic effects mediated by psychosine. In agreement with the above observations, the MetaCore enrichment analysis that we performed in the “pathway maps” ontology highlighted the significant enrichment of the dihydrolipoyllysine-residue acetyltransferase component of pyruvate dehydrogenase complex (ODP2) and aconitate hydratase (ACO2) protein differences in the “mitochondrial dysfunction in neurodegenerative diseases” pathway.
Mitochondrion aberrances obviously correlate with metabolism dysfunctions and ATP defective production. In particular, mitochondrial ATP production is indispensable for neuronal metabolism and synaptic function: even little defects in ATP synthesis may actually cause excitotoxicity and neuronal death [33]. Pyruvate dehydrogenase complex (PDC) is a crucial enzyme in NS energy metabolism. PDC deficiency has in fact a broad spectrum of clinical features, from severe neonatal/infantile lactic acidosis to chronic neurological disorders, even with later manifestations [151,152]. It links the glycolytic pathway to the Krebs cycle by catalyzing pyruvate conversion to acetyl-CoA and CO2. ODP2 is the E2 subunit of the PDC that forms the structural core of the complex. Twi mice have a significant increase in the spot 9 proteoform of ODP2 and a slight increase, despite not being significant, was also detected for Het mice when compared to the controls (Table 1, Figure 2, spot 9). This suggests a deregulation in ODP2 proteoform pattern in Twi animals that, as ODP2 PTMs are vital for the PDC activity [153], may influence the cellular energy supply. The relevance of this enzyme in KD pathogenesis is further stressed by reports describing KD patients with neonatal/infancy and adult onset presenting lactate increases in brain [154,155,156]. Interestingly, glucose hypometabolism and augmented lactate levels were also described in the CNS of patients suffering from other leukodystrophies as well as in symptomatic Twi mice [157]. Noteworthy, MS is also characterized by the low utilization of glucose, most likely a consequence to mitochondrion dysfunction and oxidative stress [158].
Likewise, ACO2 is involved in energy metabolism. It serves as the second step of the tricarboxylic acid (TCA) cycle, where it catalyzes the interconversion of citrate to isocitrate via cis-aconitate. As oxidation of its prosthetic group [4Fe-4S] determines its inactivation, ACO2 is highly vulnerable to ROS attack [159]. Consequently, it is highly likely that ACO2 dysfunctions could occur in Twi mice. Our analysis provided three ACO2 proteoforms (Table 1, Figure 2, spots 3, 4, and 6) whose abundances significantly differ among the three mouse groups. Although differently, ACO2-patterns of both Twi and Het mice diverge from the WT one. This suggests different modulation of its activity even in the carrier galc +/− mice. In addition, ACO2 defects could also contribute to mitochondrial dyshomeostasis by interfering in mitochondrion DNA stabilization and mRNA translation [160]. Thus, our results suggest the ACO2 enzyme as a possible biochemical marker of mitochondrial functional impairment in KD and, probably, with a functional relevance, not necessarily negative, also in Het animals.
The ATPB down-regulation detected in Het mice extends the mitochondrial ATP-synthesis alteration to the oxidative phosphorylation pathway. ATPB forms the catalytic core of the structural domain F1 of the mitochondrial membrane ATP synthase and catalyzes ATP synthesis. The ATPB proteoform that we identified is consistently down-regulated in Het mice compared to both WT and Twi animals. Although the spot 14 decreased abundance does not imply an overall decrease in this protein, our data suggest, once again, changes in ATPB proteoform pattern that may lead to defective ATP synthesis in heterozygous carriers of galc mutations. Of interest, ATPB has been recently detected to be down-regulated in brain samples from PD patients and functionally predicted as one of the main hub gene in the pathogenesis of the disorder [161].
Finally, among the mitochondrial deregulated proteins in mutants, we identified the lipoamide acyltransferase component of branched-chain alpha-keto acid dehydrogenase complex (ODB2) (Table 1, Figure 2, spot 11). It results in being significantly down-regulated in Twi when compared to Het animals and increased, although not significantly, in the latter when compared to the controls. ODB2 is the E2 component of the multi-subunit branched-chain α-ketoacid dehydrogenase (BCKDH), a critical mitochondrial enzyme-complex that provides acetyl-CoA molecules, via oxidative decarboxylation of branched and short-chain alpha-ketoacids, to the TCA cycle. The deregulation of ODB2 not only suggests some alteration in branched-chain amino acid metabolism between Twi and Het animals, but also highlights possible differences in mitochondrial nucleoid dynamics, ODB2 being a core protein of these structures [162]. As a rule, the spot 11 proteoform of ODB2 may be a molecular attempt of Het mice to counteract metabolic aberrances related to the presence of a mutated galc allele.

3. Materials and Methods

3.1. Animal Model

Heterozygous twitcher mice (galc +/−) on a congenic C57BLJ/6 background (RRID:IMSR_JAX:000845) were purchased from Jackson Laboratory (Bar Harbor, ME, USA) RRID:IMSR_JAX:000845) [26]. The animals were kept in a controlled environment and conventional conditions at the Department of Molecular and Developmental Medicine, University of Siena. Water and food were continuously available. All mice experiments were conducted according to the protocol approved by the Local Ethical Committee of the University of Siena. All experimental treatments and animal maintenance were carried out according to the Public Health Service (PHS) Policy on Human Care and Use of Laboratory Animals. Homozygous twitcher (galc −/−) and homozygous wild-type (galc +/+) mice were obtained by crossing heterozygous (galc +/−) mice. High Resolution Melting Polymerase Chain Reaction (HRM-PCR) was used to determine newborn mice genotype for the galc mutation. Mice were euthanized at the age of 33 days by lethal injection of phenobarbital. Whole brains were collected and, after being thoroughly washed in phosphate buffer saline (PBS), were immediately frozen in liquid nitrogen and stored at −80 °C.

3.2. Whole Brain Preparation

Twelve whole brains for each tested condition were collected from 33 day-old Twi, Het, and WT mice. For each condition, samples from seven animals were used for differential 2DE analysis (analytical runs) and those from the other 5 mice were applied in mass spectrometry and western blot analyses. Brain samples were analyzed individually, never pooled. According to [32], proteins were extracted by first pestle-pounding the whole brain in liquid nitrogen and then, by solubilizing resulting dusts in a 2D lysis buffer: 7 M Urea, 2 M Thiourea, 4% (w/v) 3-[(3-Cholamidopropyl)dimethylammonio]-1-propanesulfonate hydrate (CHAPS), 1% (w/v) dithioerythritol (DTE) and 0.5% (w/v) Triton X-100. Obtained lysates were then vortexed and centrifuged at 20,000× g for 15 min. Protein concentration was estimated by Bradford assay [163] and aliquots stored at −80°C until use.

3.3. Proteomic Analyses

Brain samples were separated by 2DE, according to [32]. For each 2DE analytical run, 60 μg of protein sample with 0.2% (v/v) of pH 3–10 carrier ampholytes was loaded by cup-loading on isoelectrofocusing (IEF) strips, pH 3–10 non-linear gradient 18 cm in length (Cytiva, formerly GE Healthcare, Marlborough, MA, USA) by the Ettan IPGphor system (Cytiva). For 2DE Western blots (2D WB) and mass spectrometry-compatible 2DE runs, 120 µg and 600 µg, respectively, were loaded with 2% (v/v) pH 3–10 carrier ampholytes, on the same strip type. Cup loading was performed on IEF strips rehydrated overnight with 350 μL of lysis buffer at room temperature and then IEF was carried out by applying the following voltage settings at 16 °C: 200 V for 8 h; a gradient to 3500 V in 2 h, a step at 3500 V for 2 h, from 3500 V to 5000 V in 2 h, maintained at 5000 V for another 3 h; a gradient to 8000 V in 1 h and a step at 8000 V for 3 h; and finally, a gradient to 10,000 V in 1 h and maintained up to a total of 100,000 V h. After IEF, strips underwent a 12 min equilibration step with a solution composed of 6 M urea, 30% (v/v) glycerol, 2% (w/v) sodium dodecyl sulfate (SDS), 0.05 M Tris–HCl pH 6.8 and 2% (w/v) DTE; and a further 5 min in a solution composed of 6 M urea, 30% (v/v) glycerol, 2% (w/v) SDS, 0.05 M Tris–HCl pH 6.8, 2.5% (w/v) iodoacetamide and trace of bromophenol blue. The second dimension was carried out at 9 °C on 9–16% polyacrylamide linear gradient gels (18 cm × 20 cm × 1.5 mm) at 40 mA/gel. Analytical gels were stained with ammoniacal silver nitrate staining [164], while mass spectrometry preparative gels were stained according to a mass spectrometry-compatible silver staining [165]. Gels images were digitalized using the Image Scanner III by LabScan 6.0 software (GE Healthcare, Chicago, IL, USA) and then analyzed by ImageMaster 2D Platinum v. 6.0 software (Cytiva). The relative volume percentage (%Vol), corresponding to the ratio between the optical density of a single spot (volume) and the total volume of spots present in the same gel, and expressed as a percentage, has been considered for statistical analysis.

3.4. Statistical Analysis

Statistical analysis and principal component analysis (PCA) were performed by RStudio Desktop 1.1.463 (Integrated Development for RStudio, Inc., Boston, MA, USA, https://www.rstudio.com (accessed on 1 March 2022)) [166].
Twi, Het, and WT groups were compared using nonparametric statistics. Kruskal–Wallis and Dunn’s Multiple Comparison test with Benjamini–Hochberg post-hoc correction were applied to proteomic datasets. Only spots presenting a p-value ≤ 0.05 and a minimal fold change of ±2 in at least one comparison among the three groups were considered as differentially abundant. The %Vol of significantly differing spots were submitted to PCA and the related variance–covariance evaluation was performed on the three first PCs.

3.5. Protein Identification by MALDI TOF-TOF Mass Spectrometry

Statistically significant differential spots were manually cut out from mass spectrometry-compatible silver stained gels and destained in a solution of 30 mM potassium ferricyanide and 100 mM sodium sulphate anhydrous and then, in a 200 mM ammonium bicarbonate. Dehydration was carried out in 100% acetonitrile (ACN). Proteins spots were rehydrated and digested in trypsin solution at 37 °C overnight. Obtained peptides were placed on MALDI target, air-dried, and covered with matrix solution of 5 mg/mL α-cyano-4-hydroxycinnamic acid (CHCA) in 50% (v/v) ACN and 0.5% (v/v) trifluoroacetic acid (TFA). The mass spectrometry spectra acquisition was carried out utilizing the UltrafleXtreme™ MALDI-TOF/TOF mass spectrometer (Bruker Daltonics, Billerica, MA, USA), equipped with a 200 Hz smartbeam™ I laser (Bruker) in the positive reflector mode with the following parameters: 80 ns of delay; ion source 1: 25 kV; ion source 2: 21.75 kV; lens voltage: 9.50 kV; reflector voltage: 26.30 kV and reflector 2 voltage: 14.00 kV. The applied laser wavelength and frequency were 353 nm and 100 Hz, respectively, and the percentage was set to 50%. Mass spectrometry spectra were processed by the FlexAnalysis software version 3.0 (Bruker), using peptides produced by trypsin autoproteolysis as internal standards for calibration. Common contaminants, such as matrix-related ions, trypsin autolysis and keratin peaks, were removed in the resulting mass lists and protein identification was, then, carried out by Peptide Mass Fingerprinting (PMF) search using MASCOT (Matrix Science Ltd., London, UK, http://www.matrixscience.com (accessed on 20 December 2021)). PMF search was performed setting parameters as follows: Mus musculus as taxonomy, SwissProt as database, 50 ppm as mass tolerance, one missed cleavage site, carbamidomethylation of cysteine as fixed modification and oxidation of methionine as a variable modification. Mass spectrometry analyses were performed at the Molsys Technology Platform (http://molsys.dbcf.unisi.it; accessed on 2 May 2022).

3.6. Western Blot Analysis

Western blot analysis was performed for proteomic data validations. According to Bianchi et al. [167] after the second dimension run, 2D WB gels were equilibrated in Towbin transfer buffer (25 mM Tris, 192 mM glycine, 20% (v/v) methanol) and then proteins were electroblotted to nitrocellulose membranes (Hybond ECL, Cytiva). These were thoroughly washed with blotting solution (skimmed milk 3% (w/v) and Triton X-100 0.1% (v/v) in PBS pH 7.4) and incubated overnight at 4 °C with the primary antibody. Membranes were tested, individually, with (i) anti-vimentin (D21H3, Abcam, Cambridge, UK) or (ii) anti-ubiquitin (SAB2107745, Sigma, St. Louis, MO, USA), both at 1:1000 dilution. Successively, they were washed with blotting solution and incubated, at room temperature for 2 h, with anti-rabbit IgG (A-4914, Sigma) as secondary antibody, at 1:3000 dilution. Membranes were thoroughly washed: first in the blotting solution, then in Triton X-100 0.5% (v/v) in PBS pH 7.4, and finally in 0.05 M Tris HCl pH 6.8. Immunoreaction was performed using the ECL chemiluminescence detection system (Cytiva), and signals were detected by exposing membranes to Hyperfilm ECL X-ray films (Cytiva). Images were acquired by the Image Scanner III and the LabScan 6.0 software. Signals were analyzed by using the ImageMaster 2D Platinum v. 6.0 software (Cytiva). The analysis included an automatic detection of immunoreactive signals by filtering from the background and no protein related interfering signals. Density values of detected spots were then exported and analyzed by RStudio Desktop 1.1.463 (Integrated Development for RStudio, Inc., Boston, MA, USA, https://www.rstudio.com).

3.7. Enrichment Analysis by MetaCore™ Software

Identified differential proteins were functionally processed by the MetaCore v. 21.3 (Clarivate Analytics, Boston, MA, USA) network building tool using the shortest path algorithm with “high trust interactions” [168,169]. Obtained networks include only closely related proteins: experimental proteins that directly interacted or indirectly mediated only by a non-experimental protein. According to their function, proteins are represented by specific graphic symbols that are reciprocally crosslinked by interaction vectors. We also performed an enrichment analysis of identified differential proteins in the “pathway maps” ontology provided by the MetaCore resource [170].

4. Conclusions

This study highlights the heterozygous galc +/− mice showing characteristic proteomic features that clearly distinguish them from Twi and WT mice. Overall, the protein differences we described suggest molecular impairment, probably related to the occurrence of different proteoforms in cytoskeleton dynamics and related signal transduction, the proteostasis network, mitochondrion integrity and functionalities, energy supply, and lipid metabolism.
In particular, the vimentin and RACK1 down-regulation in Het animals may represent a potential molecular link between the KD carrier and the risk of developing neuropathies, principally related to mechanosignaling and intracellular trafficking defects as well as to an altered myelin turnover associated with cytoskeleton dysfunctions. In addition, the dysregulation of NDRG1, besides strengthening our hypothesis on cytoskeletal rearrangement, suggests lipid metabolism defects in Het mice as also proposed for other neurodegenerative disorders, e.g., AD. Furthermore, the overall decrease in ubiquitinated proteins that we detected in Het mice along with the dysregulation of VCP and UCHL5 strengthens the supposition of proteostasis imbalances in KD carriers that may result in a hazard to its NS, classically associated to neuron inclusions and related neurodegenerations. The altered presence of mitochondrial factors, principally ACO2, was also detected in both Twi and Het mice, hence suggesting potential mitochondrion failure with increased oxidative stress and energy imbalance in both Twi and KD carriers.
Nonetheless, the deregulation of some of the identified proteoforms, and especially transgelin-3, MBP and NDRG1 proteoforms, may be also considered a molecular Het mouse response to counterbalance a probable sub-pathological myelin dyshomeostasis in the normal-appearing carriers’ brain, for preserving neuron survival and function. In both cases, the Het proteome profile, by differing from both WT and Twi ones, suggests molecular affections reasonably related to the occurrence of a mutated galc allele that could concur over time and, bona fide, in association with stressful conditions to the onset of neurological disorders.

Supplementary Materials

The following supporting information can be downloaded at: https://www.mdpi.com/article/10.3390/ijms232113537/s1.

Author Contributions

Conceptualization: L.B. (Laura Bianchi) and L.B. (Luca Bini); supervision: L.B. (Laura Bianchi); data curation: L.V., L.B. (Laura Bianchi), A.C., E.S., and D.B.; formal analysis: L.V. and A.C.; investigation: L.V. and E.S.; methodology: L.B. (Laura Bianchi), L.V. and E.S.; software, A.C.; writing—original draft: L.B. (Laura Bianchi) and L.V.; writing—review and editing, all the authors. All authors have read and agreed to the published version of the manuscript.

Funding

This research received no external funding.

Institutional Review Board Statement

The study was approved by the local ethics committee.

Conflicts of Interest

The authors declare that they have no current or potential conflict of interest regarding this article.

Abbreviations

%VolPercentage relative volume
2DETwo-dimensional electrophoresis
2DTwo-dimensional
ACNAcetonitrile
ACO2Mitochondrial aconitase
ADAlzheimer disease
ALSAmyotrophic lateral sclerosis
AP-1Activator protein 1
APPAmyloid-beta precursor protein
ATPBATP synthase subunit beta, mitochondrial
BMPBone morphogenetic protein
CHAPS3-[(3-cholamidopropyl) dimethylammonio]-1-propanesulfonate
CHCAα-cyano-4-hydroxycinnamic acid
CNP2′,3′-cyclic-nucleotide 3′-phosphodiesterase
CNSCentral nervous system
DTE1,4-Dithioerythritol
DPYSL2Dihydropyrimidinase-Related Protein 2
DUBDeubiquitinase
EREndoplasmic reticulum
ERADEndoplasmic reticulum-associated degradation
FCFold change
GALCGalactosylceramidase
GalCerGalactosylceramide
GFAPGlial fibrillary acidic protein
GWASGenome-wide association studies
HIF-1AHypoxia-inducible factor 1-alpha
HetHeterozygous mice (galc +/−)
HRM-PCRHigh resolution melting polymerase chain reaction
IBMPFDInclusion body myopathy with early-onset Paget disease and frontotemporal dementia 1
IEFIsoelectrofocusing
IFIntermediate filament
KDKrabbe disease
LacCerLactosylceramide
LBLewy body
LSDLysosomal storage disease
MALDIMatrix assisted laser desorption/ionization
MAPMicrotubule-associated-protein
MBPMyelin basic protein
NDRG1N-myc downstream regulated 1
NSNervous system
OSOxidative stress
p47NSFL1 cofactor p47
PBSPhosphate buffer saline
PC1First principal component
PC2Second principal component
PC3Third principal component
PCAPrincipal component analysis
PCsPrincipal components
PDParkinson disease
PDCPyruvate dehydrogenase complex
PHSPublic health service
PKCProtein kinase C
PFEPlasma fibrinogen extravasation
PMFPeptide mass fingerprinting
PNProteostasis network
PNSPeripheral nervous system
PP2AProtein phosphatase 2A
PsyPsychosine
PwMSPeople with multiple sclerosis
RACK1Receptor of activated protein c kinase 1
SDSSodium dodecyl sulfate
SPNShortest-path-network
STAT1Activator of transcription-1
STAT3Activator of transcription-3
TCATricarboxylic acid
TCTPTranslationally-controlled tumor protein
TOFTime of flight
TWHomozygous twitcher mice (galc −/−)
UCHL5Ubiquitin carboxyl-terminal hydrolase 5
UPSUbiquitination proteasome system
VCPTransitional endoplasmic reticulum ATPase; alternative name: valosin-containing protein
VIMEVimentin
WBWestern blot
WTHomozygous wild-type mice (galc +/+)

References

  1. Komatsuzaki, S.; Zielonka, M.; Mountford, W.K.; Kölker, S.; Hoffmann, G.F.; Garbade, S.F.; Ries, M. Clinical Characteristics of 248 Patients with Krabbe Disease: Quantitative Natural History Modeling Based on Published Cases. Genet. Med. 2019, 21, 2208–2215. [Google Scholar] [CrossRef] [PubMed]
  2. Suzuki, K. Globoid Cell Leukodystrophy (Krabbe’s Disease): Update. J. Child Neurol. 2003, 18, 595–603. [Google Scholar] [CrossRef] [PubMed]
  3. Ryckman, A.E.; Brockhausen, I.; Walia, J.S. Metabolism of Glycosphingolipids and Their Role in the Pathophysiology of Lysosomal Storage Disorders. Int. J. Mol. Sci. 2020, 21, 6881. [Google Scholar] [CrossRef] [PubMed]
  4. Schmitt, S.; Castelvetri, L.C.; Simons, M. Metabolism and Functions of Lipids in Myelin. Biochim. Biophys. Acta 2015, 1851, 999–1005. [Google Scholar] [CrossRef] [PubMed]
  5. Giussani, P.; Prinetti, A.; Tringali, C. The Role of Sphingolipids in Myelination and Myelin Stability and Their Involvement in Childhood and Adult Demyelinating Disorders. J. Neurochem. 2021, 156, 403–414. [Google Scholar] [CrossRef] [PubMed]
  6. Reza, S.; Ugorski, M.; Suchański, J. Glucosylceramide and Galactosylceramide, Small Glycosphingolipids with Significant Impact on Health and Disease. Glycobiology 2021, 31, 1416–1434. [Google Scholar] [CrossRef] [PubMed]
  7. Potter, G.B.; Petryniak, M.A. Neuroimmune Mechanisms in Krabbe’s Disease. J. Neurosci. Res. 2016, 94, 1341–1348. [Google Scholar] [CrossRef] [Green Version]
  8. Li, Y.; Xu, Y.; Benitez, B.A.; Nagree, M.S.; Dearborn, J.T.; Jiang, X.; Guzman, M.A.; Woloszynek, J.C.; Giaramita, A.; Yip, B.K.; et al. Genetic Ablation of Acid Ceramidase in Krabbe Disease Confirms the Psychosine Hypothesis and Identifies a New Therapeutic Target. Proc. Natl. Acad. Sci. USA 2019, 116, 20097–20103. [Google Scholar] [CrossRef] [Green Version]
  9. Papini, N.; Giallanza, C.; Brioschi, L.; Ranieri, F.R.; Giussani, P.; Mauri, L.; Ciampa, M.G.; Viani, P.; Tringali, C. Galactocerebrosidase Deficiency Induces an Increase in Lactosylceramide Content: A New Hallmark of Krabbe Disease? Int. J. Biochem. Cell Biol. 2022, 145, 106184. [Google Scholar] [CrossRef]
  10. Lim, S.M.; Choi, B.-O.; Oh, S.-I.; Choi, W.J.; Oh, K.-W.; Nahm, M.; Xue, Y.; Choi, J.H.; Choi, J.Y.; Kim, Y.-E.; et al. Patient Fibroblasts-Derived Induced Neurons Demonstrate Autonomous Neuronal Defects in Adult-Onset Krabbe Disease. Oncotarget 2016, 7, 74496–74509. [Google Scholar] [CrossRef]
  11. Kreher, C.; Favret, J.; Weinstock, N.I.; Maulik, M.; Hong, X.; Gelb, M.H.; Wrabetz, L.; Feltri, M.L.; Shin, D. Neuron-Specific Ablation of the Krabbe Disease Gene Galactosylceramidase in Mice Results in Neurodegeneration. PLoS Biol. 2022, 20, e3001661. [Google Scholar] [CrossRef] [PubMed]
  12. Weinstock, N.I.; Kreher, C.; Favret, J.; Nguyen, D.; Bongarzone, E.R.; Wrabetz, L.; Feltri, M.L.; Shin, D. Brainstem Development Requires Galactosylceramidase and Is Critical for Pathogenesis in a Model of Krabbe Disease. Nat. Commun. 2020, 11, 5356. [Google Scholar] [CrossRef] [PubMed]
  13. Sahai, I.; Baris, H.; Kimonis, V.; Levy, H.L. Krabbe Disease: Severe Neonatal Presentation with a Family History of Multiple Sclerosis. J. Child Neurol. 2005, 20, 826–828. [Google Scholar] [CrossRef] [PubMed]
  14. Sawcer, S.; Hellenthal, G.; Pirinen, M.; Spencer, C.C.A.; Patsopoulos, N.A.; Moutsianas, L.; Dilthey, A.; Su, Z.; Freeman, C.; Hunt, S.E.; et al. Genetic Risk and a Primary Role for Cell-Mediated Immune Mechanisms in Multiple Sclerosis. Nature 2011, 476, 214. [Google Scholar] [CrossRef] [PubMed] [Green Version]
  15. Li, H.; Hou, X.; Liang, Y.; Xu, F.; Zhang, X.; Cui, P.; Xing, G.; Wang, X.; Jiang, W. Gene-Based Tests of a Genome-Wide Association Study Dataset Highlight Novel Multiple Sclerosis Risk Genes. Front. Neurosci. 2021, 15, 614528. [Google Scholar] [CrossRef] [PubMed]
  16. Scott-Hewitt, N.J.; Folts, C.J.; Noble, M.D. Heterozygous Carriers of Galactocerebrosidase Mutations That Cause Krabbe Disease Have Impaired Microglial Function and Defective Repair of Myelin Damage. Neural. Regen. Res. 2018, 13, 393–401. [Google Scholar] [CrossRef]
  17. Abdelkarim, H.; Marshall, M.S.; Scesa, G.; Smith, R.A.; Rue, E.; Marshall, J.; Elackattu, V.; Stoskute, M.; Issa, Y.; Santos, M.; et al. α-Synuclein Interacts Directly but Reversibly with Psychosine: Implications for α-Synucleinopathies. Sci. Rep. 2018, 8, 12462. [Google Scholar] [CrossRef] [Green Version]
  18. Smith, B.R.; Santos, M.B.; Marshall, M.S.; Cantuti-Castelvetri, L.; Lopez-Rosas, A.; Li, G.; van Breemen, R.; Claycomb, K.I.; Gallea, J.I.; Celej, M.S.; et al. Neuronal Inclusions of α-Synuclein Contribute to the Pathogenesis of Krabbe Disease. J. Pathol. 2014, 232, 509–521. [Google Scholar] [CrossRef] [Green Version]
  19. Nasir, G.; Chopra, R.; Elwood, F.; Ahmed, S.S. Krabbe Disease: Prospects of Finding a Cure Using AAV Gene Therapy. Front. Med. 2021, 8, 760236. [Google Scholar] [CrossRef]
  20. Hult, M.; Darin, N.; von Döbeln, U.; Månsson, J.-E. Epidemiology of Lysosomal Storage Diseases in Sweden. Acta Paediatr. 2014, 103, 1258–1263. [Google Scholar] [CrossRef]
  21. Laquerrière, A.; Bekri, S.; Suzuki, K.; Harding, B.N. Sphingolipidoses and Related Disorders. In Developmental Neuropathology; Wiley Online Library: Hoboken, NJ, USA, 2018; pp. 313–367. ISBN 978-1-119-01311-2. [Google Scholar]
  22. Liu, Y.; Gibson, J.; Wheeler, J.; Kwee, L.C.; Santiago-Turla, C.M.; Akafo, S.K.; Lichter, P.R.; Gaasterland, D.E.; Moroi, S.E.; Challa, P.; et al. GALC Deletions Increase the Risk of Primary Open-Angle Glaucoma: The Role of Mendelian Variants in Complex Disease. PLoS ONE 2011, 6, e27134. [Google Scholar] [CrossRef] [PubMed]
  23. Lee, J.H.; Cho, M.H.; Hersh, C.P.; McDonald, M.-L.N.; Wells, J.M.; Dransfield, M.T.; Bowler, R.P.; Lynch, D.A.; Lomas, D.A.; Crapo, J.D.; et al. IREB2 and GALC Are Associated with Pulmonary Artery Enlargement in Chronic Obstructive Pulmonary Disease. Am. J. Respir. Cell Mol. Biol. 2015, 52, 365–376. [Google Scholar] [CrossRef] [PubMed] [Green Version]
  24. Heller, G.J.; Marshall, M.S.; Issa, Y.; Marshall, J.N.; Nguyen, D.; Rue, E.; Pathmasiri, K.C.; Domowicz, M.S.; van Breemen, R.B.; Tai, L.M.; et al. Waning Efficacy in a Long-Term AAV-Mediated Gene Therapy Study in the Murine Model of Krabbe Disease. Mol. Ther. 2021, 29, 1883–1902. [Google Scholar] [CrossRef] [PubMed]
  25. Signorini, C.; Cardile, V.; Pannuzzo, G.; Graziano, A.C.E.; Durand, T.; Galano, J.-M.; Oger, C.; Leoncini, S.; Cortelazzo, A.; Lee, J.C.-Y.; et al. Increased Isoprostanoid Levels in Brain from Murine Model of Krabbe Disease-Relevance of Isoprostanes, Dihomo-Isoprostanes and Neuroprostanes to Disease Severity. Free Radic. Biol. Med. 2019, 139, 46–54. [Google Scholar] [CrossRef] [PubMed]
  26. Suzuki, K.; Taniike, M. Murine Model of Genetic Demyelinating Disease: The Twitcher Mouse. Microsc. Res. Tech. 1995, 32, 204–214. [Google Scholar] [CrossRef] [PubMed]
  27. Kodama, S.; Igisu, H.; Siegel, D.A.; Suzuki, K. Glycosylceramide Synthesis in the Developing Spinal Cord and Kidney of the Twitcher Mouse, an Enzymatically Authentic Model of Human Krabbe Disease. J. Neurochem. 1982, 39, 1314–1318. [Google Scholar] [CrossRef]
  28. Marshall, M.S.; Bongarzone, E.R. Beyond Krabbe’s Disease: The Potential Contribution of Galactosylceramidase Deficiency to Neuronal Vulnerability in Late-Onset Synucleinopathies. J. Neurosci. Res. 2016, 94, 1328–1332. [Google Scholar] [CrossRef] [Green Version]
  29. Chiu, F.C.; Sacchi, R.S.; Claudio, L.; Kobayashi, S.; Suzuki, K. Coexpression of Glial Fibrillary Acidic Protein and Vimentin in the Central and Peripheral Nervous Systems of the Twitcher Mutant. Glia 1988, 1, 105–112. [Google Scholar] [CrossRef]
  30. Rama Rao, K.V.; Kielian, T. Astrocytes and Lysosomal Storage Diseases. Neuroscience 2016, 323, 195–206. [Google Scholar] [CrossRef] [Green Version]
  31. Hol, E.M.; Pekny, M. Glial Fibrillary Acidic Protein (GFAP) and the Astrocyte Intermediate Filament System in Diseases of the Central Nervous System. Curr. Opin. Cell Biol. 2015, 32, 121–130. [Google Scholar] [CrossRef]
  32. Landi, C.; Luddi, A.; Bianchi, L.; Pannuzzo, G.; Pavone, V.; Piomboni, P.; Bini, L. Proteostasis Network Alteration in Lysosomal Storage Disorders: Insights from the Mouse Model of Krabbe Disease. J. Neurosci. Res. 2020, 98, 718–733. [Google Scholar] [CrossRef] [PubMed]
  33. Saffari, A.; Kölker, S.; Hoffmann, G.F.; Ebrahimi-Fakhari, D. Linking Mitochondrial Dysfunction to Neurodegeneration in Lysosomal Storage Diseases. J. Inherit. Metab. Dis. 2017, 40, 631–640. [Google Scholar] [CrossRef] [PubMed]
  34. Benitez-King, G.; Ramírez-Rodríguez, G.; Ortíz, L.; Meza, I. The Neuronal Cytoskeleton as a Potential Therapeutical Target in Neurodegenerative Diseases and Schizophrenia. Curr. Drug. Targets CNS Neurol. Disord. 2004, 3, 515–533. [Google Scholar] [CrossRef] [PubMed]
  35. Kounakis, K.; Tavernarakis, N. The Cytoskeleton as a Modulator of Aging and Neurodegeneration. Adv. Exp. Med. Biol. 2019, 1178, 227–245. [Google Scholar] [CrossRef]
  36. Peter, F.; Rost, S.; Rolfs, A.; Frech, M.J. Activation of PKC Triggers Rescue of NPC1 Patient Specific IPSC Derived Glial Cells from Gliosis. Orphanet. J. Rare Dis. 2017, 12, 145. [Google Scholar] [CrossRef]
  37. Bauer, P.O.; Hudec, R.; Goswami, A.; Kurosawa, M.; Matsumoto, G.; Mikoshiba, K.; Nukina, N. ROCK-Phosphorylated Vimentin Modifies Mutant Huntingtin Aggregation via Sequestration of IRBIT. Mol. Neurodegener. 2012, 7, 43. [Google Scholar] [CrossRef] [Green Version]
  38. Jang, B.; Kim, M.J.; Lee, Y.J.; Ishigami, A.; Kim, Y.S.; Choi, E.K. Vimentin Citrullination Probed by a Novel Monoclonal Antibody Serves as a Specific Indicator for Reactive Astrocytes in Neurodegeneration. Neuropathol. Appl. Neurobiol. 2020, 46, 751–769. [Google Scholar] [CrossRef]
  39. Feuillette, S.; Deramecourt, V.; Laquerriere, A.; Duyckaerts, C.; Delisle, M.-B.; Maurage, C.-A.; Blum, D.; Buée, L.; Frébourg, T.; Campion, D.; et al. Filamin-A and Myosin VI Colocalize with Fibrillary Tau Protein in Alzheimer’s Disease and FTDP-17 Brains. Brain Res. 2010, 1345, 182–189. [Google Scholar] [CrossRef]
  40. Tsujikawa, K.; Hamanaka, K.; Riku, Y.; Hattori, Y.; Hara, N.; Iguchi, Y.; Ishigaki, S.; Hashizume, A.; Miyatake, S.; Mitsuhashi, S.; et al. Actin-Binding Protein Filamin-A Drives Tau Aggregation and Contributes to Progressive Supranuclear Palsy Pathology. Sci. Adv. 2022, 8, eabm5029. [Google Scholar] [CrossRef]
  41. Zaka, M.; Rafi, M.A.; Rao, H.Z.; Luzi, P.; Wenger, D.A. Insulin-like Growth Factor-1 Provides Protection against Psychosine-Induced Apoptosis in Cultured Mouse Oligodendrocyte Progenitor Cells Using Primarily the PI3K/Akt Pathway. Mol. Cell. Neurosci. 2005, 30, 398–407. [Google Scholar] [CrossRef]
  42. Wan, H.-L.; Hong, X.-Y.; Zhao, Z.-H.; Li, T.; Zhang, B.-G.; Liu, Q.; Wang, Q.; Zhao, S.; Wang, J.-Z.; Shen, X.-F.; et al. STAT3 Ameliorates Cognitive Deficits via Regulation of NMDAR Expression in an Alzheimer’s Disease Animal Model. Theranostics 2021, 11, 5511–5524. [Google Scholar] [CrossRef] [PubMed]
  43. Czubowicz, K.; Jęśko, H.; Wencel, P.; Lukiw, W.J.; Strosznajder, R.P. The Role of Ceramide and Sphingosine-1-Phosphate in Alzheimer’s Disease and Other Neurodegenerative Disorders. Mol. Neurobiol. 2019, 56, 5436–5455. [Google Scholar] [CrossRef] [PubMed] [Green Version]
  44. Herdegen, T.; Waetzig, V. AP-1 Proteins in the Adult Brain: Facts and Fiction about Effectors of Neuroprotection and Neurodegeneration. Oncogene 2001, 20, 2424–2437. [Google Scholar] [CrossRef] [Green Version]
  45. Zhang, Z.; Yan, J.; Chang, Y.; Yan, S.S.; Shi, H. Hypoxia Inducible Factor-1 as a Target for Neurodegenerative Diseases. Curr. Med. Chem. 2011, 18, 4335–4343. [Google Scholar] [CrossRef] [PubMed] [Green Version]
  46. Liu, Y.; Yu, L.; Xu, Y.; Tang, X.; Wang, X. Substantia Nigra Smad3 Signaling Deficiency: Relevance to Aging and Parkinson’s Disease and Roles of Microglia, Proinflammatory Factors, and MAPK. J. Neuroinflamm. 2020, 17, 342. [Google Scholar] [CrossRef]
  47. Kaleli, H.N.; Ozer, E.; Kaya, V.O.; Kutlu, O. Protein Kinase C Isozymes and Autophagy during Neurodegenerative Disease Progression. Cells 2020, 9, 553. [Google Scholar] [CrossRef] [Green Version]
  48. Rai, S.N.; Dilnashin, H.; Birla, H.; Singh, S.S.; Zahra, W.; Rathore, A.S.; Singh, B.K.; Singh, S.P. The Role of PI3K/Akt and ERK in Neurodegenerative Disorders. Neurotox. Res. 2019, 35, 775–795. [Google Scholar] [CrossRef]
  49. Torrent, L.; Ferrer, I. PP2A and Alzheimer Disease. Curr. Alzheimer Res. 2012, 9, 248–256. [Google Scholar] [CrossRef]
  50. Ma, J.; Wu, R.; Zhang, Q.; Wu, J.; Lou, J.; Zheng, Z.; Ding, J.; Yuan, Z. DJ-1 Interacts with RACK1 and Protects Neurons from Oxidative-Stress-Induced Apoptosis. Biochem. J. 2014, 462, 489–497. [Google Scholar] [CrossRef]
  51. Sklan, E.H.; Podoly, E.; Soreq, H. RACK1 Has the Nerve to Act: Structure Meets Function in the Nervous System. Prog Neurobiol 2006, 78, 117–134. [Google Scholar] [CrossRef]
  52. Osmanagic-Myers, S.; Wiche, G. Plectin-RACK1 (Receptor for Activated C Kinase 1) Scaffolding: A Novel Mechanism to Regulate Protein Kinase C Activity. J. Biol. Chem. 2004, 279, 18701–18710. [Google Scholar] [CrossRef] [PubMed] [Green Version]
  53. McCahill, A.; Warwicker, J.; Bolger, G.B.; Houslay, M.D.; Yarwood, S.J. The RACK1 Scaffold Protein: A Dynamic Cog in Cell Response Mechanisms. Mol. Pharmacol. 2002, 62, 1261–1273. [Google Scholar] [CrossRef] [PubMed] [Green Version]
  54. Battaini, F.; Pascale, A.; Paoletti, R.; Govoni, S. The Role of Anchoring Protein RACK1 in PKC Activation in the Ageing Rat Brain. Trends Neurosci. 1997, 20, 410–415. [Google Scholar] [CrossRef]
  55. Kishimoto, A.; Nishiyama, K.; Nakanishi, H.; Uratsuji, Y.; Nomura, H.; Takeyama, Y.; Nishizuka, Y. Studies on the Phosphorylation of Myelin Basic Protein by Protein Kinase C and Adenosine 3′:5′-Monophosphate-Dependent Protein Kinase. J. Biol. Chem. 1985, 260, 12492–12499. [Google Scholar] [CrossRef]
  56. Whitaker, J.N. Myelin Basic Protein and Multiple Sclerosis. Ital. J. Neurol. Sci. 1983, 4, 153–157. [Google Scholar] [CrossRef]
  57. Gaboreanu, A.-M.; Hrstka, R.; Xu, W.; Shy, M.; Kamholz, J.; Lilien, J.; Balsamo, J. Myelin Protein Zero/P0 Phosphorylation and Function Require an Adaptor Protein Linking It to RACK1 and PKC Alpha. J. Cell Biol. 2007, 177, 707–716. [Google Scholar] [CrossRef] [Green Version]
  58. Tomás, J.; Durães, J.; Lacerda, L.; Macário, M.C. Adolescent-Onset Krabbe Disease with an Initial Diagnosis of Multiple Sclerosis and a Novel Mutation. BMJ Case Rep. 2015, 2015, bcr2015210625. [Google Scholar] [CrossRef] [Green Version]
  59. Vassall, K.A.; Bamm, V.V.; Harauz, G. MyelStones: The Executive Roles of Myelin Basic Protein in Myelin Assembly and Destabilization in Multiple Sclerosis. Biochem. J. 2015, 472, 17–32. [Google Scholar] [CrossRef]
  60. Smirnova, E.V.; Rakitina, T.V.; Ziganshin, R.H.; Arapidi, G.P.; Saratov, G.A.; Kudriaeva, A.A.; Belogurov, A.A. Comprehensive Atlas of the Myelin Basic Protein Interaction Landscape. Biomolecules 2021, 11, 1628. [Google Scholar] [CrossRef]
  61. Harauz, G.; Ladizhansky, V.; Boggs, J.M. Structural Polymorphism and Multifunctionality of Myelin Basic Protein. Biochemistry 2009, 48, 8094–8104. [Google Scholar] [CrossRef]
  62. GS Chirivi, R. Citrullination: A Target for Disease Intervention in Multiple Sclerosis and Other Inflammatory Diseases? J. Clin. Cell Immunol. 2013, 4, 146. [Google Scholar] [CrossRef]
  63. Moscarello, M.A.; Mastronardi, F.G.; Wood, D.D. The Role of Citrullinated Proteins Suggests a Novel Mechanism in the Pathogenesis of Multiple Sclerosis. Neurochem. Res. 2007, 32, 251–256. [Google Scholar] [CrossRef] [PubMed] [Green Version]
  64. Harauz, G.; Musse, A.A. A Tale of Two Citrullines—Structural and Functional Aspects of Myelin Basic Protein Deimination in Health and Disease. Neurochem. Res. 2007, 32, 137–158. [Google Scholar] [CrossRef] [PubMed]
  65. Traina, G.; Federighi, G.; Macchi, M.; Bernardi, R.; Durante, M.; Brunelli, M. Modulation of Myelin Basic Protein Gene Expression by Acetyl-L-Carnitine. Mol. Neurobiol. 2011, 44, 1–6. [Google Scholar] [CrossRef] [PubMed]
  66. Al-Abdi, L.; Al Murshedi, F.; Elmanzalawy, A.; Al Habsi, A.; Helaby, R.; Ganesh, A.; Ibrahim, N.; Patel, N.; Alkuraya, F.S. CNP Deficiency Causes Severe Hypomyelinating Leukodystrophy in Humans. Hum. Genet. 2020, 139, 615–622. [Google Scholar] [CrossRef]
  67. Mustapha, O.; Oke, B.; Offen, N.; Sirén, A.-L.; Olopade, J. Neurobehavioral and Cytotoxic Effects of Vanadium during Oligodendrocyte Maturation: A Protective Role for Erythropoietin. Environ. Toxicol. Pharmacol. 2014, 38, 98–111. [Google Scholar] [CrossRef]
  68. Disruption of Cnp1 Uncouples Oligodendroglial Functions in Axonal Support and Myelination|Nature Genetics. Available online: https://www.nature.com/articles/ng1095z (accessed on 15 June 2022).
  69. Jones, R.L.; Wong, E.K.; Ibsen, K.H.; Leopold, I.H. Erythrocyte Membrane 2′, 3′-Cyclic Nucleotide 3′-Phosphodiesterase Activity in Multiple Sclerosis. Metab. Pediatr. Syst. Ophthalmol. 1983, 7, 25–30. [Google Scholar]
  70. Muraro, P.A.; Kalbus, M.; Afshar, G.; McFarland, H.F.; Martin, R. T Cell Response to 2′,3′-Cyclic Nucleotide 3′-Phosphodiesterase (CNPase) in Multiple Sclerosis Patients. J. Neuroimmunol. 2002, 130, 233–242. [Google Scholar] [CrossRef]
  71. Mori, K.; Muto, Y.; Kokuzawa, J.; Yoshioka, T.; Yoshimura, S.; Iwama, T.; Okano, Y.; Sakai, N. Neuronal Protein NP25 Interacts with F-Actin. Neurosci. Res. 2004, 48, 439–446. [Google Scholar] [CrossRef]
  72. Ratié, L.; Ware, M.; Jagline, H.; David, V.; Dupé, V. Dynamic Expression of Notch-Dependent Neurogenic Markers in the Chick Embryonic Nervous System. Front. Neuroanat. 2014, 8, 158. [Google Scholar] [CrossRef]
  73. Arnaud, L.; Benech, P.; Greetham, L.; Stephan, D.; Jimenez, A.; Jullien, N.; García-González, L.; Tsvetkov, P.O.; Devred, F.; Sancho-Martinez, I.; et al. The Alzheimer’s Disease Risk Factor APOE4 Drives pro-Inflammation in Human Astrocytes via HDAC-Dependent Repression of TAGLN3. bioRxiv 2021. [Google Scholar] [CrossRef]
  74. Krugmann, B.; Radulescu, A.; Appavou, M.-S.; Koutsioubas, A.; Stingaciu, L.R.; Dulle, M.; Förster, S.; Stadler, A.M. Membrane Stiffness and Myelin Basic Protein Binding Strength as Molecular Origin of Multiple Sclerosis. Sci. Rep. 2020, 10, 16691. [Google Scholar] [CrossRef] [PubMed]
  75. Ellen, T.P.; Ke, Q.; Zhang, P.; Costa, M. NDRG1, a Growth and Cancer Related Gene: Regulation of Gene Expression and Function in Normal and Disease States. Carcinogenesis 2008, 29, 2–8. [Google Scholar] [CrossRef] [PubMed] [Green Version]
  76. Kim, K.-T.; Ongusaha, P.P.; Hong, Y.-K.; Kurdistani, S.K.; Nakamura, M.; Lu, K.P.; Lee, S.W. Function of Drg1/Rit42 in P53-Dependent Mitotic Spindle Checkpoint. J. Biol. Chem. 2004, 279, 38597–38602. [Google Scholar] [CrossRef] [Green Version]
  77. Jeon, H.-J.; You, S.Y.; Park, Y.S.; Chang, J.W.; Kim, J.-S.; Oh, J.S. TCTP Regulates Spindle Microtubule Dynamics by Stabilizing Polar Microtubules during Mouse Oocyte Meiosis. Biochim. Et Biophys. Acta BBA-Mol. Cell Res. 2016, 1863, 630–637. [Google Scholar] [CrossRef]
  78. Schonkeren, S.L.; Massen, M.; van der Horst, R.; Koch, A.; Vaes, N.; Melotte, V. Nervous NDRGs: The N-Myc Downstream-Regulated Gene Family in the Central and Peripheral Nervous System. Neurogenetics 2019, 20, 173–186. [Google Scholar] [CrossRef] [Green Version]
  79. Okuda, T.; Higashi, Y.; Kokame, K.; Tanaka, C.; Kondoh, H.; Miyata, T. Ndrg1-Deficient Mice Exhibit a Progressive Demyelinating Disorder of Peripheral Nerves. Mol. Cell. Biol. 2004, 24, 3949–3956. [Google Scholar] [CrossRef] [Green Version]
  80. Marechal, D.; Dansu, D.K.; Castro, K.; Patzig, J.; Magri, L.; Inbar, B.; Gacias, M.; Moyon, S.; Casaccia, P. N-Myc Downstream Regulated Family Member 1 (NDRG1) Is Enriched in Myelinating Oligodendrocytes and Impacts Myelin Degradation in Response to Demyelination. Glia 2022, 70, 321–336. [Google Scholar] [CrossRef]
  81. Haq, E.; Giri, S.; Singh, I.; Singh, A.K. Molecular Mechanism of Psychosine-Induced Cell Death in Human Oligodendrocyte Cell Line. J. Neurochem. 2003, 86, 1428–1440. [Google Scholar] [CrossRef]
  82. March-Diaz, R.; Lara-Ureña, N.; Romero-Molina, C.; Heras-Garvin, A.; Ortega-de San Luis, C.; Alvarez-Vergara, M.I.; Sanchez-Garcia, M.A.; Sanchez-Mejias, E.; Davila, J.C.; Rosales-Nieves, A.E.; et al. Hypoxia Compromises the Mitochondrial Metabolism of Alzheimer’s Disease Microglia via HIF1. Nat. Aging. 2021, 1, 385–399. [Google Scholar] [CrossRef]
  83. Graziano, A.C.E.; Parenti, R.; Avola, R.; Cardile, V. Krabbe Disease: Involvement of Connexin43 in the Apoptotic Effects of Sphingolipid Psychosine on Mouse Oligodendrocyte Precursors. Apoptosis 2016, 21, 25–35. [Google Scholar] [CrossRef] [PubMed]
  84. Hatami, M.; Salmani, T.; Arsang-Jang, S.; Davood Omrani, M.; Mazdeh, M.; Ghafouri-Fard, S.; Sayad, A.; Taheri, M. STAT5a and STAT6 Gene Expression Levels in Multiple Sclerosis Patients. Cytokine 2018, 106, 108–113. [Google Scholar] [CrossRef] [PubMed]
  85. Giri, S.; Jatana, M.; Rattan, R.; Won, J.-S.; Singh, I.; Singh, A.K. Galactosylsphingosine (Psychosine)-Induced Expression of Cytokine-Mediated Inducible Nitric Oxide Synthases via AP-1 and C/EBP: Implications for Krabbe Disease. FASEB J. 2002, 16, 661–672. [Google Scholar] [CrossRef]
  86. Skedsmo, F.S.; Tranulis, M.A.; Espenes, A.; Prydz, K.; Matiasek, K.; Gunnes, G.; Hermansen, L.C.; Jäderlund, K.H. Cell and Context-Dependent Sorting of Neuropathy-Associated Protein NDRG1–Insights from Canine Tissues and Primary Schwann Cell Cultures. BMC Vet. Res. 2019, 15, 121. [Google Scholar] [CrossRef]
  87. MA, W.; NA, M.; TANG, C.; WANG, H.; LIN, Z. Overexpression of N-Myc Downstream-Regulated Gene 1 Inhibits Human Glioma Proliferation and Invasion via Phosphoinositide 3-Kinase/AKT Pathways. Mol. Med. Rep. 2015, 12, 1050–1058. [Google Scholar] [CrossRef] [PubMed] [Green Version]
  88. Deng, Z.; Purtell, K.; Lachance, V.; Wold, M.S.; Chen, S.; Yue, Z. Autophagy Receptors and Neurodegenerative Diseases. Trends Cell Biol. 2017, 27, 491–504. [Google Scholar] [CrossRef] [Green Version]
  89. Chang, J.R.; Ghafouri, M.; Mukerjee, R.; Bagashev, A.; Chabrashvili, T.; Sawaya, B.E. Role of P53 in Neurodegenerative Diseases. Neurodegener. Dis. 2012, 9, 68–80. [Google Scholar] [CrossRef] [Green Version]
  90. Raivich, G.; Behrens, A. Role of the AP-1 Transcription Factor c-Jun in Developing, Adult and Injured Brain. Prog. Neurobiol. 2006, 78, 347–363. [Google Scholar] [CrossRef]
  91. Qin, L.; Shu, L.; Zhong, J.; Pan, H.; Guo, J.; Sun, Q.; Yan, X.; Tang, B.; Xu, Q. Association of HIF1A and Parkinson’s Disease in a Han Chinese Population Demonstrated by Molecular Inversion Probe Analysis. Neurol. Sci. 2019, 40, 1927–1931. [Google Scholar] [CrossRef]
  92. Luckhaus, C.; Sand, P.G. Estrogen Receptor 1 Gene (ESR1) Variants in Alzheimer’s Disease. Results of a Meta-Analysis. Aging Clin. Exp. Res. 2007, 19, 165–168. [Google Scholar] [CrossRef]
  93. Wetzel, M.K.; Naska, S.; Laliberté, C.L.; Rymar, V.V.; Fujitani, M.; Biernaskie, J.A.; Cole, C.J.; Lerch, J.P.; Spring, S.; Wang, S.-H.; et al. P73 Regulates Neurodegeneration and Phospho-Tau Accumulation during Aging and Alzheimer’s Disease. Neuron 2008, 59, 708–721. [Google Scholar] [CrossRef]
  94. Natarajan, C.; Sriram, S.; Muthian, G.; Bright, J.J. Signaling through JAK2-STAT5 Pathway Is Essential for IL-3-Induced Activation of Microglia. Glia 2004, 45, 188–196. [Google Scholar] [CrossRef] [PubMed]
  95. Kokame, K.; Kato, H.; Miyata, T. Homocysteine-Respondent Genes in Vascular Endothelial Cells Identified by Differential Display Analysis. GRP78/BiP and Novel Genes. J. Biol. Chem. 1996, 271, 29659–29665. [Google Scholar] [CrossRef] [Green Version]
  96. Kurdistani, S.K.; Arizti, P.; Reimer, C.L.; Sugrue, M.M.; Aaronson, S.A.; Lee, S.W. Inhibition of Tumor Cell Growth by RTP/Rit42 and Its Responsiveness to P53 and DNA Damage. Cancer Res. 1998, 58, 4439–4444. [Google Scholar] [PubMed]
  97. Piquemal, D.; Joulia, D.; Balaguer, P.; Basset, A.; Marti, J.; Commes, T. Differential Expression of the RTP/Drg1/Ndr1 Gene Product in Proliferating and Growth Arrested Cells. Biochim. Biophys. Acta 1999, 1450, 364–373. [Google Scholar] [CrossRef] [Green Version]
  98. Hara, K.; Hasegawa, T.; Ooi, H.; Koya, T.; Tanabe, Y.; Tsukada, H.; Igarashi, K.; Suzuki, E.; Arakawa, M.; Gejyo, F. Inhibitory Role of Eosinophils on Cell Surface Plasmin Generation by Bronchial Epithelial Cells: Inhibitory Effects of Transforming Growth Factor β. Lung 2001, 179, 9–20. [Google Scholar] [CrossRef]
  99. van Belzen, N.; Dinjens, W.N.; Diesveld, M.P.; Groen, N.A.; van der Made, A.C.; Nozawa, Y.; Vlietstra, R.; Trapman, J.; Bosman, F.T. A Novel Gene Which Is Up-Regulated during Colon Epithelial Cell Differentiation and down-Regulated in Colorectal Neoplasms. Lab. Investig. 1997, 77, 85–92. [Google Scholar]
  100. King, R.H.M.; Chandler, D.; Lopaticki, S.; Huang, D.; Blake, J.; Muddle, J.R.; Kilpatrick, T.; Nourallah, M.; Miyata, T.; Okuda, T.; et al. Ndrg1 in Development and Maintenance of the Myelin Sheath. Neurobiol. Dis. 2011, 42, 368–380. [Google Scholar] [CrossRef]
  101. Mitchelmore, C.; Büchmann-Møller, S.; Rask, L.; West, M.J.; Troncoso, J.C.; Jensen, N.A. NDRG2: A Novel Alzheimer’s Disease Associated Protein. Neurobiol. Dis. 2004, 16, 48–58. [Google Scholar] [CrossRef]
  102. Merlot, A.M.; Porter, G.M.; Sahni, S.; Lim, E.G.; Peres, P.; Richardson, D.R. The Metastasis Suppressor, NDRG1, Differentially Modulates the Endoplasmic Reticulum Stress Response. Biochim. Biophys. Acta Mol. Basis Dis. 2019, 1865, 2094–2110. [Google Scholar] [CrossRef]
  103. Hunter, M.; Angelicheva, D.; Tournev, I.; Ingley, E.; Chan, D.C.; Watts, G.F.; Kremensky, I.; Kalaydjieva, L. NDRG1 Interacts with APO A-I and A-II and Is a Functional Candidate for the HDL-C QTL on 8q24. Biochem. Biophys. Res. Commun 2005, 332, 982–992. [Google Scholar] [CrossRef] [PubMed]
  104. Chun, J.; Giovannoni, G.; Hunter, S.F. Sphingosine 1-Phosphate Receptor Modulator Therapy for Multiple Sclerosis: Differential Downstream Receptor Signalling and Clinical Profile Effects. Drugs 2021, 81, 207–231. [Google Scholar] [CrossRef] [PubMed]
  105. White, A.B.; Givogri, M.I.; Lopez-Rosas, A.; Cao, H.; van Breemen, R.; Thinakaran, G.; Bongarzone, E.R. Psychosine Accumulates in Membrane Microdomains in the Brain of Krabbe Patients, Disrupting the Raft Architecture. J. Neurosci. 2009, 29, 6068–6077. [Google Scholar] [CrossRef] [PubMed] [Green Version]
  106. Tanaka, K.; Webster, H. deF. Effects of Psychosine (Galactosylsphingosine) on the Survival and the Fine Structure of Cultured Schwann Cells. J. Neuropathol. Exp. Neurol. 1993, 52, 490–498. [Google Scholar] [CrossRef] [PubMed]
  107. Wenger, D.A.; Luzi, P.; Rafi, M.A. Advances in the Diagnosis and Treatment of Krabbe Disease. Int. J. Neonatal. Screen 2021, 7, 57. [Google Scholar] [CrossRef]
  108. Martinez, L.O.; Jacquet, S.; Esteve, J.-P.; Rolland, C.; Cabezón, E.; Champagne, E.; Pineau, T.; Georgeaud, V.; Walker, J.E.; Tercé, F.; et al. Ectopic Beta-Chain of ATP Synthase Is an Apolipoprotein A-I Receptor in Hepatic HDL Endocytosis. Nature 2003, 421, 75–79. [Google Scholar] [CrossRef]
  109. Ebanks, B.; Chakrabarti, L. Mitochondrial ATP Synthase Is a Target of Oxidative Stress in Neurodegenerative Diseases. Front. Mol. Biosci. 2022, 9, 854321. [Google Scholar] [CrossRef]
  110. Cai, K.; El-Merahbi, R.; Loeffler, M.; Mayer, A.E.; Sumara, G. Ndrg1 Promotes Adipocyte Differentiation and Sustains Their Function. Sci. Rep. 2017, 7, 7191. [Google Scholar] [CrossRef] [Green Version]
  111. Bartz, F.; Kern, L.; Erz, D.; Zhu, M.; Gilbert, D.; Meinhof, T.; Wirkner, U.; Erfle, H.; Muckenthaler, M.; Pepperkok, R.; et al. Identification of Cholesterol-Regulating Genes by Targeted RNAi Screening. Cell Metabolism. 2009, 10, 63–75. [Google Scholar] [CrossRef] [Green Version]
  112. Pietiäinen, V.; Vassilev, B.; Blom, T.; Wang, W.; Nelson, J.; Bittman, R.; Bäck, N.; Zelcer, N.; Ikonen, E. NDRG1 Functions in LDL Receptor Trafficking by Regulating Endosomal Recycling and Degradation. J. Cell Sci. 2013, 126, 3961–3971. [Google Scholar] [CrossRef] [Green Version]
  113. Martins-de-Souza, D.; Cassoli, J.S.; Nascimento, J.M.; Hensley, K.; Guest, P.C.; Pinzon-Velasco, A.M.; Turck, C.W. The Protein Interactome of Collapsin Response Mediator Protein-2 (CRMP2/DPYSL2) Reveals Novel Partner Proteins in Brain Tissue. Proteom. Clin. Appl. 2015, 9, 817–831. [Google Scholar] [CrossRef] [PubMed]
  114. Chang, Y.-H.; Tsai, J.-N.; Chang, S.-W.; Hsu, W.-T.; Yang, C.-P.; Hsiao, C.-W.; Shiau, M.-Y. Regulation of Adipogenesis and Lipid Deposits by Collapsin Response Mediator Protein 2. Int. J. Mol. Sci. 2020, 21, 2172. [Google Scholar] [CrossRef] [PubMed]
  115. Hensley, K.; Gabbita, S.P.; Venkova, K.; Hristov, A.; Johnson, M.F.; Eslami, P.; Harris-White, M.E. A Derivative of the Brain Metabolite Lanthionine Ketimine Improves Cognition and Diminishes Pathology in the 3 × Tg-AD Mouse Model of Alzheimer Disease. J. Neuropathol. Exp. Neurol. 2013, 72, 955–969. [Google Scholar] [CrossRef] [PubMed] [Green Version]
  116. Jayaraj, G.G.; Hipp, M.S.; Hartl, F.U. Functional Modules of the Proteostasis Network. Cold Spring Harb. Perspect. Biol. 2020, 12, a033951. [Google Scholar] [CrossRef] [Green Version]
  117. Martínez, G.; Khatiwada, S.; Costa-Mattioli, M.; Hetz, C. ER Proteostasis Control of Neuronal Physiology and Synaptic Function. Trends Neurosci. 2018, 41, 610–624. [Google Scholar] [CrossRef]
  118. Ross, C.A.; Poirier, M.A. Protein Aggregation and Neurodegenerative Disease. Nat. Med. 2004, 10, S10–S17. [Google Scholar] [CrossRef]
  119. Roussel, B.D.; Kruppa, A.J.; Miranda, E.; Crowther, D.C.; Lomas, D.A.; Marciniak, S.J. Endoplasmic Reticulum Dysfunction in Neurological Disease. Lancet Neurol. 2013, 12, 105–118. [Google Scholar] [CrossRef] [Green Version]
  120. Bingol, B.; Sheng, M. Deconstruction for Reconstruction: The Role of Proteolysis in Neural Plasticity and Disease. Neuron 2011, 69, 22–32. [Google Scholar] [CrossRef] [Green Version]
  121. Engelender, S.; Stefanis, L.; Oddo, S.; Bellucci, A. Can We Treat Neurodegenerative Proteinopathies by Enhancing Protein Degradation? Mov. Disord. 2022, 37, 1346–1359. [Google Scholar] [CrossRef]
  122. Ruan, J.; Schlüter, D.; Wang, X. Deubiquitinating Enzymes (DUBs): DoUBle-Edged Swords in CNS Autoimmunity. J. Neuroinflamm. 2020, 17, 102. [Google Scholar] [CrossRef] [Green Version]
  123. Gadhave, K.; Kumar, P.; Kapuganti, S.K.; Uversky, V.N.; Giri, R. Unstructured Biology of Proteins from Ubiquitin-Proteasome System: Roles in Cancer and Neurodegenerative Diseases. Biomolecules 2020, 10, 796. [Google Scholar] [CrossRef] [PubMed]
  124. Kumar, D.; Ambasta, R.K.; Kumar, P. Ubiquitin Biology in Neurodegenerative Disorders: From Impairment to Therapeutic Strategies. Ageing Res. Rev. 2020, 61, 101078. [Google Scholar] [CrossRef] [PubMed]
  125. Volpi, V.G.; Touvier, T.; D’Antonio, M. Endoplasmic Reticulum Protein Quality Control Failure in Myelin Disorders. Front. Mol. Neurosci. 2017, 9, 162. [Google Scholar] [CrossRef] [PubMed] [Green Version]
  126. Papadopoulos, C.; Kirchner, P.; Bug, M.; Grum, D.; Koerver, L.; Schulze, N.; Poehler, R.; Dressler, A.; Fengler, S.; Arhzaouy, K.; et al. VCP/P97 Cooperates with YOD1, UBXD1 and PLAA to Drive Clearance of Ruptured Lysosomes by Autophagy. EMBO J. 2017, 36, 135–150. [Google Scholar] [CrossRef] [PubMed] [Green Version]
  127. Ferrari, V.; Cristofani, R.; Tedesco, B.; Crippa, V.; Chierichetti, M.; Casarotto, E.; Cozzi, M.; Mina, F.; Piccolella, M.; Galbiati, M.; et al. Valosin Containing Protein (VCP): A Multistep Regulator of Autophagy. Int. J. Mol. Sci. 2022, 23, 1939. [Google Scholar] [CrossRef]
  128. Xia, D.; Tang, W.K.; Ye, Y. Structure and Function of the AAA+ ATPase P97/Cdc48p. Gene 2016, 583, 64–77. [Google Scholar] [CrossRef] [Green Version]
  129. Buchan, J.R.; Kolaitis, R.-M.; Taylor, J.P.; Parker, R. Eukaryotic Stress Granules Are Cleared by Autophagy and Cdc48/VCP Function. Cell 2013, 153, 1461–1474. [Google Scholar] [CrossRef] [Green Version]
  130. Hillert, E.-K.; Brnjic, S.; Zhang, X.; Mazurkiewicz, M.; Saei, A.A.; Mofers, A.; Selvaraju, K.; Zubarev, R.; Linder, S.; D’Arcy, P. Proteasome Inhibitor B-AP15 Induces Enhanced Proteotoxicity by Inhibiting Cytoprotective Aggresome Formation. Cancer Lett. 2019, 448, 70–83. [Google Scholar] [CrossRef] [Green Version]
  131. Deol, K.K.; Crowe, S.O.; Du, J.; Bisbee, H.A.; Guenette, R.G.; Strieter, E.R. Proteasome-Bound UCH37/UCHL5 Debranches Ubiquitin Chains to Promote Degradation. Mol. Cell 2020, 80, 796–809.e9. [Google Scholar] [CrossRef]
  132. Bello, A.I.; Goswami, R.; Brown, S.L.; Costanzo, K.; Shores, T.; Allan, S.; Odah, R.; Mohan, R.D. Deubiquitinases in Neurodegeneration. Cells 2022, 11, 556. [Google Scholar] [CrossRef]
  133. Yao, T. A Timer to Coordinate Substrate Processing by the 26S Proteasome. Nat. Struct. Mol. Biol. 2015, 22, 652–653. [Google Scholar] [CrossRef] [PubMed]
  134. Al-Shami, A.; Jhaver, K.G.; Vogel, P.; Wilkins, C.; Humphries, J.; Davis, J.J.; Xu, N.; Potter, D.G.; Gerhardt, B.; Mullinax, R.; et al. Regulators of the Proteasome Pathway, Uch37 and Rpn13, Play Distinct Roles in Mouse Development. PLoS ONE 2010, 5, e13654. [Google Scholar] [CrossRef] [PubMed]
  135. Ristic, G.; Tsou, W.-L.; Todi, S.V. An Optimal Ubiquitin-Proteasome Pathway in the Nervous System: The Role of Deubiquitinating Enzymes. Front. Mol. Neurosci. 2014, 7, 72. [Google Scholar] [CrossRef] [PubMed] [Green Version]
  136. Mazumdar, T.; Gorgun, F.M.; Sha, Y.; Tyryshkin, A.; Zeng, S.; Hartmann-Petersen, R.; Jørgensen, J.P.; Hendil, K.B.; Eissa, N.T. Regulation of NF-KappaB Activity and Inducible Nitric Oxide Synthase by Regulatory Particle Non-ATPase Subunit 13 (Rpn13). Proc. Natl. Acad. Sci. USA 2010, 107, 13854–13859. [Google Scholar] [CrossRef] [PubMed] [Green Version]
  137. Benameur, T.; Soleti, R.; Panaro, M.A.; La Torre, M.E.; Monda, V.; Messina, G.; Porro, C. Curcumin as Prospective Anti-Aging Natural Compound: Focus on Brain. Molecules 2021, 26, 4794. [Google Scholar] [CrossRef]
  138. Factory, If Else RJLM. Available online: https://www.rjlm.ro/ (accessed on 27 September 2022).
  139. Priyam, N.; Savoy, A. The Role of Astrocytes in the Cause of Alzheimer’s Disease. J. Stud. Res. 2021, 10, 3. [Google Scholar] [CrossRef]
  140. Fang, Y.; Shen, X. Ubiquitin Carboxyl-Terminal Hydrolases: Involvement in Cancer Progression and Clinical Implications. Cancer Metastasis Rev. 2017, 36, 669–682. [Google Scholar] [CrossRef]
  141. Kim, W.-Y.; Snider, W.D. Functions of GSK-3 Signaling in Development of the Nervous System. Front. Mol. Neurosci. 2011, 4, 44. [Google Scholar] [CrossRef] [Green Version]
  142. Fomenkov, A.; Zangen, R.; Huang, Y.-P.; Osada, M.; Guo, Z.; Fomenkov, T.; Trink, B.; Sidransky, D.; Ratovitski, E.A. RACK1 and Stratifin Target DeltaNp63alpha for a Proteasome Degradation in Head and Neck Squamous Cell Carcinoma Cells upon DNA Damage. Cell Cycle 2004, 3, 1285–1295. [Google Scholar] [CrossRef]
  143. Liu, Y.V.; Semenza, G.L. RACK1 vs. HSP90: Competition for HIF-1α Degradation vs. Stabilization. Cell Cycle 2007, 6, 656–659. [Google Scholar] [CrossRef]
  144. Lachat, P.; Shaw, P.; Gebhard, S.; van Belzen, N.; Chaubert, P.; Bosman, F.T. Expression of NDRG1, a Differentiation-Related Gene, in Human Tissues. Histochem. Cell Biol. 2002, 118, 399–408. [Google Scholar] [CrossRef] [PubMed]
  145. Hawkins-Salsbury, J.A.; Qin, E.Y.; Reddy, A.S.; Vogler, C.A.; Sands, M.S. Oxidative Stress as a Therapeutic Target in Globoid Cell Leukodystrophy. Exp. Neurol. 2012, 237, 444–452. [Google Scholar] [CrossRef] [PubMed]
  146. Del Grosso, A.; Angella, L.; Tonazzini, I.; Moscardini, A.; Giordano, N.; Caleo, M.; Rocchiccioli, S.; Cecchini, M. Dysregulated Autophagy as a New Aspect of the Molecular Pathogenesis of Krabbe Disease. Neurobiol. Dis. 2019, 129, 195–207. [Google Scholar] [CrossRef] [PubMed]
  147. Erskine, D.; Koss, D.; Korolchuk, V.I.; Outeiro, T.F.; Attems, J.; McKeith, I. Lipids, Lysosomes and Mitochondria: Insights into Lewy Body Formation from Rare Monogenic Disorders. Acta Neuropathol. 2021, 141, 511–526. [Google Scholar] [CrossRef] [PubMed]
  148. Shahmoradian, S.H.; Lewis, A.J.; Genoud, C.; Hench, J.; Moors, T.E.; Navarro, P.P.; Castaño-Díez, D.; Schweighauser, G.; Graff-Meyer, A.; Goldie, K.N.; et al. Lewy Pathology in Parkinson’s Disease Consists of Crowded Organelles and Lipid Membranes. Nat. Neurosci. 2019, 22, 1099–1109. [Google Scholar] [CrossRef] [Green Version]
  149. Cheng, A.; Kawahata, I.; Fukunaga, K. Fatty Acid Binding Protein 5 Mediates Cell Death by Psychosine Exposure through Mitochondrial Macropores Formation in Oligodendrocytes. Biomedicines 2020, 8, 635. [Google Scholar] [CrossRef]
  150. Voccoli, V.; Tonazzini, I.; Signore, G.; Caleo, M.; Cecchini, M. Role of Extracellular Calcium and Mitochondrial Oxygen Species in Psychosine-Induced Oligodendrocyte Cell Death. Cell Death Dis. 2014, 5, e1529. [Google Scholar] [CrossRef] [Green Version]
  151. Head, R.A.; Brown, R.M.; Zolkipli, Z.; Shahdadpuri, R.; King, M.D.; Clayton, P.T.; Brown, G.K. Clinical and Genetic Spectrum of Pyruvate Dehydrogenase Deficiency: Dihydrolipoamide Acetyltransferase (E2) Deficiency. Ann. Neurol. 2005, 58, 234–241. [Google Scholar] [CrossRef]
  152. Singhi, P.; De Meirleir, L.; Lissens, W.; Singhi, S.; Saini, A.G. Pyruvate Dehydrogenase-E1α Deficiency Presenting as Recurrent Demyelination: An Unusual Presentation and a Novel Mutation. JIMD Rep. 2013, 10, 107–111. [Google Scholar] [CrossRef] [Green Version]
  153. Xie, Y.; Zhang, J.; Yang, L.; Chen, Q.; Hao, Q.; Zhang, L.; Sun, H. A Dual-Function Chemical Probe for Detecting Erasers of Lysine Lipoylation. Front. Chem. Sci. Eng. 2022, 16, 121–127. [Google Scholar] [CrossRef]
  154. Udow, S.; Bunge, M.; Ryner, L.; Mhanni, A.A.; Salman, M.S. Prolonged Survival and Serial Magnetic Resonance Imaging/Magnetic Resonance Spectroscopy Changes in Infantile Krabbe Disease. Pediatr. Neurol. 2012, 47, 299–302. [Google Scholar] [CrossRef] [PubMed]
  155. Wang, C.; Melberg, A.; Weis, J.; Månsson, J.-E.; Raininko, R. The Earliest MR Imaging and Proton MR Spectroscopy Abnormalities in Adult-Onset Krabbe Disease. Acta Neurol. Scand. 2007, 116, 268–272. [Google Scholar] [CrossRef] [PubMed]
  156. Kang, P.B.; Hunter, J.V.; Kaye, E.M. Lactic Acid Elevation in Extramitochondrial Childhood Neurodegenerative Diseases. J. Child Neurol. 2001, 16, 657–660. [Google Scholar] [CrossRef] [PubMed]
  157. Meisingset, T.W.; Ricca, A.; Neri, M.; Sonnewald, U.; Gritti, A. Region- and Age-Dependent Alterations of Glial-Neuronal Metabolic Interactions Correlate with CNS Pathology in a Mouse Model of Globoid Cell Leukodystrophy. J. Cereb. Blood Flow Metab. 2013, 33, 1127–1137. [Google Scholar] [CrossRef] [Green Version]
  158. Bahr, L.S.; Bock, M.; Liebscher, D.; Bellmann-Strobl, J.; Franz, L.; Prüß, A.; Schumann, D.; Piper, S.K.; Kessler, C.S.; Steckhan, N.; et al. Ketogenic Diet and Fasting Diet as Nutritional Approaches in Multiple Sclerosis (NAMS): Protocol of a Randomized Controlled Study. Trials 2020, 21, 3. [Google Scholar] [CrossRef] [Green Version]
  159. Iñarrea, P.; Alarcia, R.; Alava, M.A.; Capablo, J.L.; Casanova, A.; Iñiguez, C.; Iturralde, M.; Larrodé, P.; Martín, J.; Mostacero, E.; et al. Mitochondrial Complex Enzyme Activities and Cytochrome c Expression Changes in Multiple Sclerosis. Mol. Neurobiol. 2014, 49, 1–9. [Google Scholar] [CrossRef]
  160. Park, J.S.; Kim, M.J.; Kim, S.Y.; Lim, B.C.; Kim, K.J.; Seong, M.-W.; Lee, J.S.; Chae, J.-H. Novel Compound Heterozygous ACO2 Mutations in an Infant with Progressive Encephalopathy: A Newly Identified Neurometabolic Syndrome. Brain Dev. 2020, 42, 680–685. [Google Scholar] [CrossRef]
  161. Quan, W.; Li, J.; Jin, X.; Liu, L.; Zhang, Q.; Qin, Y.; Pei, X.; Chen, J. Identification of Potential Core Genes in Parkinson’s Disease Using Bioinformatics Analysis. Parkinsons Dis. 2021, 2021, 1690341. [Google Scholar] [CrossRef]
  162. Bogenhagen, D.F.; Rousseau, D.; Burke, S. The Layered Structure of Human Mitochondrial DNA Nucleoids. J. Biol. Chem. 2008, 283, 3665–3675. [Google Scholar] [CrossRef] [Green Version]
  163. Bradford, M.M. A Rapid and Sensitive Method for the Quantitation of Microgram Quantities of Protein Utilizing the Principle of Protein-Dye Binding. Anal. Biochem. 1976, 72, 248–254. [Google Scholar] [CrossRef]
  164. Oakley, B.R.; Kirsch, D.R.; Morris, N.R. A Simplified Ultrasensitive Silver Stain for Detecting Proteins in Polyacrylamide Gels. Anal. Biochem. 1980, 105, 361–363. [Google Scholar] [CrossRef]
  165. Gharahdaghi, F.; Weinberg, C.R.; Meagher, D.A.; Imai, B.S.; Mische, S.M. Mass Spectrometric Identification of Proteins from Silver-Stained Polyacrylamide Gel: A Method for the Removal of Silver Ions to Enhance Sensitivity. Electrophoresis 1999, 20, 601–605. [Google Scholar] [CrossRef]
  166. Ihaka, R.; Gentleman, R. R: A Language for Data Analysis and Graphics. J. Comput. Graph. Stat. 1996, 5, 299–314. Available online: https://www.tandfonline.com/doi/abs/10.1080/10618600.1996.10474713 (accessed on 15 June 2022).
  167. Bianchi, L.; Bruzzese, F.; Leone, A.; Gagliardi, A.; Puglia, M.; Di Gennaro, E.; Rocco, M.; Gimigliano, A.; Pucci, B.; Armini, A.; et al. Proteomic Analysis Identifies Differentially Expressed Proteins after HDAC Vorinostat and EGFR Inhibitor Gefitinib Treatments in Hep-2 Cancer Cells. Proteomics 2011, 11, 3725–3742. [Google Scholar] [CrossRef] [PubMed]
  168. Bianchi, L.; Altera, A.; Barone, V.; Bonente, D.; Bacci, T.; De Benedetto, E.; Bini, L.; Tosi, G.M.; Galvagni, F.; Bertelli, E. Untangling the Extracellular Matrix of Idiopathic Epiretinal Membrane: A Path Winding among Structure, Interactomics and Translational Medicine. Cells 2022, 11, 2531. [Google Scholar] [CrossRef]
  169. Angeloni, C.; Turroni, S.; Bianchi, L.; Fabbri, D.; Motori, E.; Malaguti, M.; Leoncini, E.; Maraldi, T.; Bini, L.; Brigidi, P.; et al. Novel Targets of Sulforaphane in Primary Cardiomyocytes Identified by Proteomic Analysis. PLoS ONE 2013, 8, e83283. [Google Scholar] [CrossRef] [Green Version]
  170. Bini, L.; Schvartz, D.; Carnemolla, C.; Besio, R.; Garibaldi, N.; Sanchez, J.-C.; Forlino, A.; Bianchi, L. Intracellular and Extracellular Markers of Lethality in Osteogenesis Imperfecta: A Quantitative Proteomic Approach. Int. J. Mol. Sci. 2021, 22, 429. [Google Scholar] [CrossRef]
Figure 1. Reference whole brain lysate protein patterns of 33-day-old wild-type (WT) (A), heterozygous galc +/− (Het) (B) and Twitcher galc −/− (Twi) (C) mice. Red circles and numbers point out differentially abundant protein spots detected among the three sample classes. Numbers matched those listed in Table 1 and Figure 2.
Ijms 23 13537 g001
Figure 2. Histogram representing the %Vol ratios of Twi vs. Het (blue bar), Het vs. WT (orange bar), and Twi vs. WT (grey bar) as reported in Table 1. The numbers in the x axis correspond to those of differentially abundant protein spots identified by mass spectrometry, for more clarity: 1: Ubiquitin carboxyl-terminal hydrolase 5; 2: Transitional endoplasmic reticulum ATPase; 3: Aconitate hydratase, mitochondrial; 4: Aconitate hydratase, mitochondrial; 6: Aconitate hydratase, mitochondrial; 7: Albumin; 9: Dihydrolipoyllysine-residue acetyltransferase component of pyruvate dehydrogenase complex, mitochondrial; 10: Dihydropyrimidinase-related protein 2; 11: Lipoamide acyltransferase component of branched-chain alpha-keto acid dehydrogenase complex, mitochondrial; 12: 2′,3′-cyclic-nucleotide 3′-phosphodiesterase; 13: Vimentin; 14: ATP synthase subunit beta, mitochondrial; 15: Protein NDRG1; 16: NSFL1 cofactor p47; 17: Tropomodulin-2; 18: 60S acidic ribosomal protein P0; 19: Beta-soluble NSF attachment protein; 20: Creatine kinase B-type; 22: Receptor of activated protein C kinase 1; 23: Protein-L-isoaspartate(D-aspartate) O-methyltransferase; 24: Translationally-controlled tumor protein; 25: Transgelin-3; 27: Myelin basic protein. # and ¥ indicate statistical relevance, i.e. p ≤ 0.01 and 0.01 < p ≤ 0.05, respectively.
Ijms 23 13537 g002
Figure 3. Principal component analysis (PCA) performed on %Vols of spots matched among WT, Het, and Twi mouse samples. Plots highlight spatial distribution of the 21 whole brain analyzed samples—7 from WT mice (blue symbols); 7 from Het mice (green symbols); and 7 from Twi mice (red symbol)—along the PC1 and PC2 (A), PC1 and PC3 (B), and PC2 and PC3 (C).
Ijms 23 13537 g003
Figure 4. MetaCore protein network built by processing significant protein differences occurring among Twi, Het, and wild-type mice. Experimental proteins, circled in blue, were cross-linked by using the shortest-path-network (SPN) building tool. This generates hypothetical networks by cross-linking experimental factors and expanding protein interactions to other proteins, not present in the processed experimental list but supported by the MetaCore database, that are needed to functionally correlate user up-loaded proteins, which do not directly interact. Except for tropomodulin-2, all the processed proteins entered into the SPN.
Ijms 23 13537 g004
Figure 5. 2D Western blot analysis with anti-vimentin antibody on 33-day-old wild-type (WT) (A), heterozygous galc +/− (Het) (B) and twitcher galc −/− (Twi) (C) mice. Heatmap analysis (D) scaled values of spot intensity. Color changes from blue to red indicate less or higher signal intensity, respectively. Each row corresponds to a VIME protein species while each column corresponds to one of the three tested conditions, as highlighted by the colored bar from the horizontal dendrogram: Twi = red, WT = blue, and Het = green. Row spot numbers match those in (AC).
Ijms 23 13537 g005
Figure 6. 2D Western blot analysis by using anti-ubiquitin antibody on 33-day-old wild-type (WT) (A), heterozygous galc +/− (Het) (B), and Twitcher (Twi) (C) mice. Small signals are circled to facilitate their viewing. Circles are used to improve the visualization of weaker immunoreactive signals (C). Heatmap analysis (D) performed on scaled values of spot intensity. Color changes from blue to red indicate less or higher signal intensity, respectively. Each row corresponds to a ubiquitinated protein species while each column corresponds to one of the three tested conditions, as highlighted by the colored bar from the horizontal dendrogram: Twi = red, WT = blue, and Het = green. Row spot numbers match those in (AC). Spots from the same isoelectric series (i.e., 17 and 18 lines) are named in alphabetical order, from the most acid pI value to the most basic one.
Ijms 23 13537 g006
Table 1. Significant protein spot differences, from Twi vs. Het, Het vs. WT, and Twi vs. WT comparisons, identified by mass spectrometry.
a Spot
N.
b Protein Namec UniProtKB Accession Numberd MetaCore
Name
e Mascot Search Results f Fold Change
ScoreExpectedMatched Peptides/
Detected Peptides
Sequence
Coverage
%
Twi/HetHet/WTTwi/WT
1Ubiquitin carboxyl-terminal hydrolase 5P56399USP51446.8 × 10−1114/18154.05 ¥0.22 ¥0.86 NS
2Transitional endoplasmic reticulum ATPaseQ01853VCP2264.3 × 10−1922/27252.52 ¥0.59 NS1.48 NS
3Aconitate hydratase, mitochondrialQ99KI0ACON1882.7 × 10−1513/14250.70 NS2.89 #2.02 NS
4Aconitate hydratase, mitochondrialQ99KI0ACON1001.7 × 10−69/15162.32 ¥1.33 NS3.07 #
6Aconitate hydratase, mitochondrialQ99KI0ACON2582.7 × 10−2220/22312.58 ¥0.72 NS1.84 NS
7AlbuminP07724Albumin4146.8 × 10−3829/32522.66 NS0.26 ¥0.67 NS
9Dihydrolipoyllysine-residue acetyltransferase component of pyruvate dehydrogenase complex, mitochondrialQ8BMF4ODP21192.2 × 10−810/14201.34 NS1.50 NS2 ¥
10Dihydropyrimidinase-related protein 2O08553CRMP22338.6 × 10−2017/23432.00 #0.73 NS1.45 ¥
11Lipoamide acyltransferase component of branched-chain alpha-keto acid dehydrogenase complex, mitochondrialP53395BCKD-E21273.4 × 10−912/18170.32 #1.69 NS0.54 NS
122′,3′-cyclic-nucleotide 3′-phosphodiesteraseP16330CNP12101.7 × 10−1716/25412.47 #0.47 #1.14 NS
13VimentinP20152Vimentin983.00 × 10−67/91912.75 ¥0.46 NS5.77 ¥
14ATP synthase subunit beta, mitochondrialP56480ATP5B1711.4 × 10−1313/17323.98 ¥0.33 ¥1.29 NS
15Protein NDRG1Q62433NDRG11011.4 × 10−68/9240.91 NS2.61 #2.35 ¥
16NSFL1 cofactor p47Q9CZ44p471182.7 × 10−88/12293.74 ¥0.63 NS2.33 ¥
17Tropomodulin-2Q9JKK7Tropomodulin-21001.7 × 10−69/19333.06 ¥0.28 ¥0.86 NS
1860S acidic ribosomal protein P0P14869RPLP01946.8 × 10−1612/15470.52 NS2.01 ¥1.03 NS
19Beta-soluble NSF attachment proteinP28663NAPB2273.4 × 10−1918/22601.67 NS1.60 NS2.67 ¥
20Creatine kinase B-typeQ04447KCRB1273.4 × 10−97/7212.72 ¥0.67 NS1.82 NS
22Receptor of activated protein C kinase 1P68040RACK11892.2 × 10−1513/23593.14 #0.42 ¥1.30 NS
23Protein-L-isoaspartate(D-aspartate) O-methyltransferaseP23506PIMT1738.6 × 10−1412/15420.39 ¥1.71 NS0.66 NS
24Translationally-controlled tumor proteinP63028TPT11364.3 × 10−1010/18441.05 NS2.7 ¥2.83 #
25Transgelin-3Q9R1Q8Transgelin-31592.2 × 10−1216/30560.53 ¥2.24 ¥1.19 NS
27Myelin basic proteinP04370Myelin basic protein1511.4 × 10−1110/13300.59 ¥2.12 #1.25 NS
a Spot numbers match those used in Figure 1 to indicate protein spot differences; b UniProtKB protein name; c UniProtKB accession number; d MetaCore name; e Mascot search results: number of matched peptides, sequence coverage, and score; f Fold changes calculated on %Vol values computed for identified spot differences matched in inter-class analysis. Protein differences were considered significant according to a FC ≥ 2 and a p ≤ 0.01 (#) or 0.01 < p ≤ 0.05 (¥). NS: not significant.
Publisher’s Note: MDPI stays neutral with regard to jurisdictional claims in published maps and institutional affiliations.

