Article

Multiphoton Bleaching of Red Fluorescent Proteins and the Ways to Reduce It

1
Department of Microbiology and Cell Biology, Montana State University, Bozeman, MT 59717, USA
2
Vidrio Technologies LLC, 19955 Highland Vista Drive Suite 150, Ashburn, VA 20147, USA
*
Author to whom correspondence should be addressed.
Int. J. Mol. Sci. 2022, 23(2), 770; https://doi.org/10.3390/ijms23020770
Submission received: 24 December 2021 / Revised: 6 January 2022 / Accepted: 7 January 2022 / Published: 11 January 2022

Abstract

:
Red fluorescent proteins and biosensors built upon them are potentially beneficial for two-photon laser microscopy (TPLM) because they can image deeper layers of tissue, compared to green fluorescent proteins. However, some publications report on their very fast photobleaching, especially upon excitation at 750–800 nm. Here we study the multiphoton bleaching properties of mCherry, mPlum, tdTomato, and jREX-GECO1, measuring power dependences of photobleaching rates K at different excitation wavelengths across the whole two-photon absorption spectrum. Although all these proteins contain the chromophore with the same chemical structure, the mechanisms of their multiphoton bleaching are different. The number of photons required to initiate a photochemical reaction varies, depending on wavelength and power, from 2 (all four proteins) to 3 (jREX-GECO1) to 4 (mCherry, mPlum, tdTomato), and even up to 8 (tdTomato). We found that at sufficiently low excitation power P, the rate K often follows a quadratic power dependence, that turns into higher order dependence (K~Pα with α > 2) when the power surpasses a particular threshold P*. An optimum intensity for TPLM is close to the P*, because it provides the highest signal-to-background ratio and any further reduction of laser intensity would not improve the fluorescence/bleaching rate ratio. Additionally, one should avoid using wavelengths shorter than a particular threshold to avoid fast bleaching due to multiphoton ionization.

1. Introduction

Red fluorescent proteins (red FPs, RFPs) are genetically encoded molecular probes that find use in fluorescence microscopy of biological tissues, such as the brain [1,2,3,4,5]. Their red-shifted absorption and fluorescence provide structural and dynamic information from deeper layers of tissue, compared to their green counterparts, because red light penetrates better in scattering media. RFPs are particularly attractive for use in two-photon laser microscopy (TPLM) [6,7,8,9], where two near-infrared photons can effectively excite the RFP chromophore [10]. Two-photon excitation (2PE) spectra of RFPs fall in the range from 700 to 1200 nm [10,11] that matches the so-called tissue transparency window [
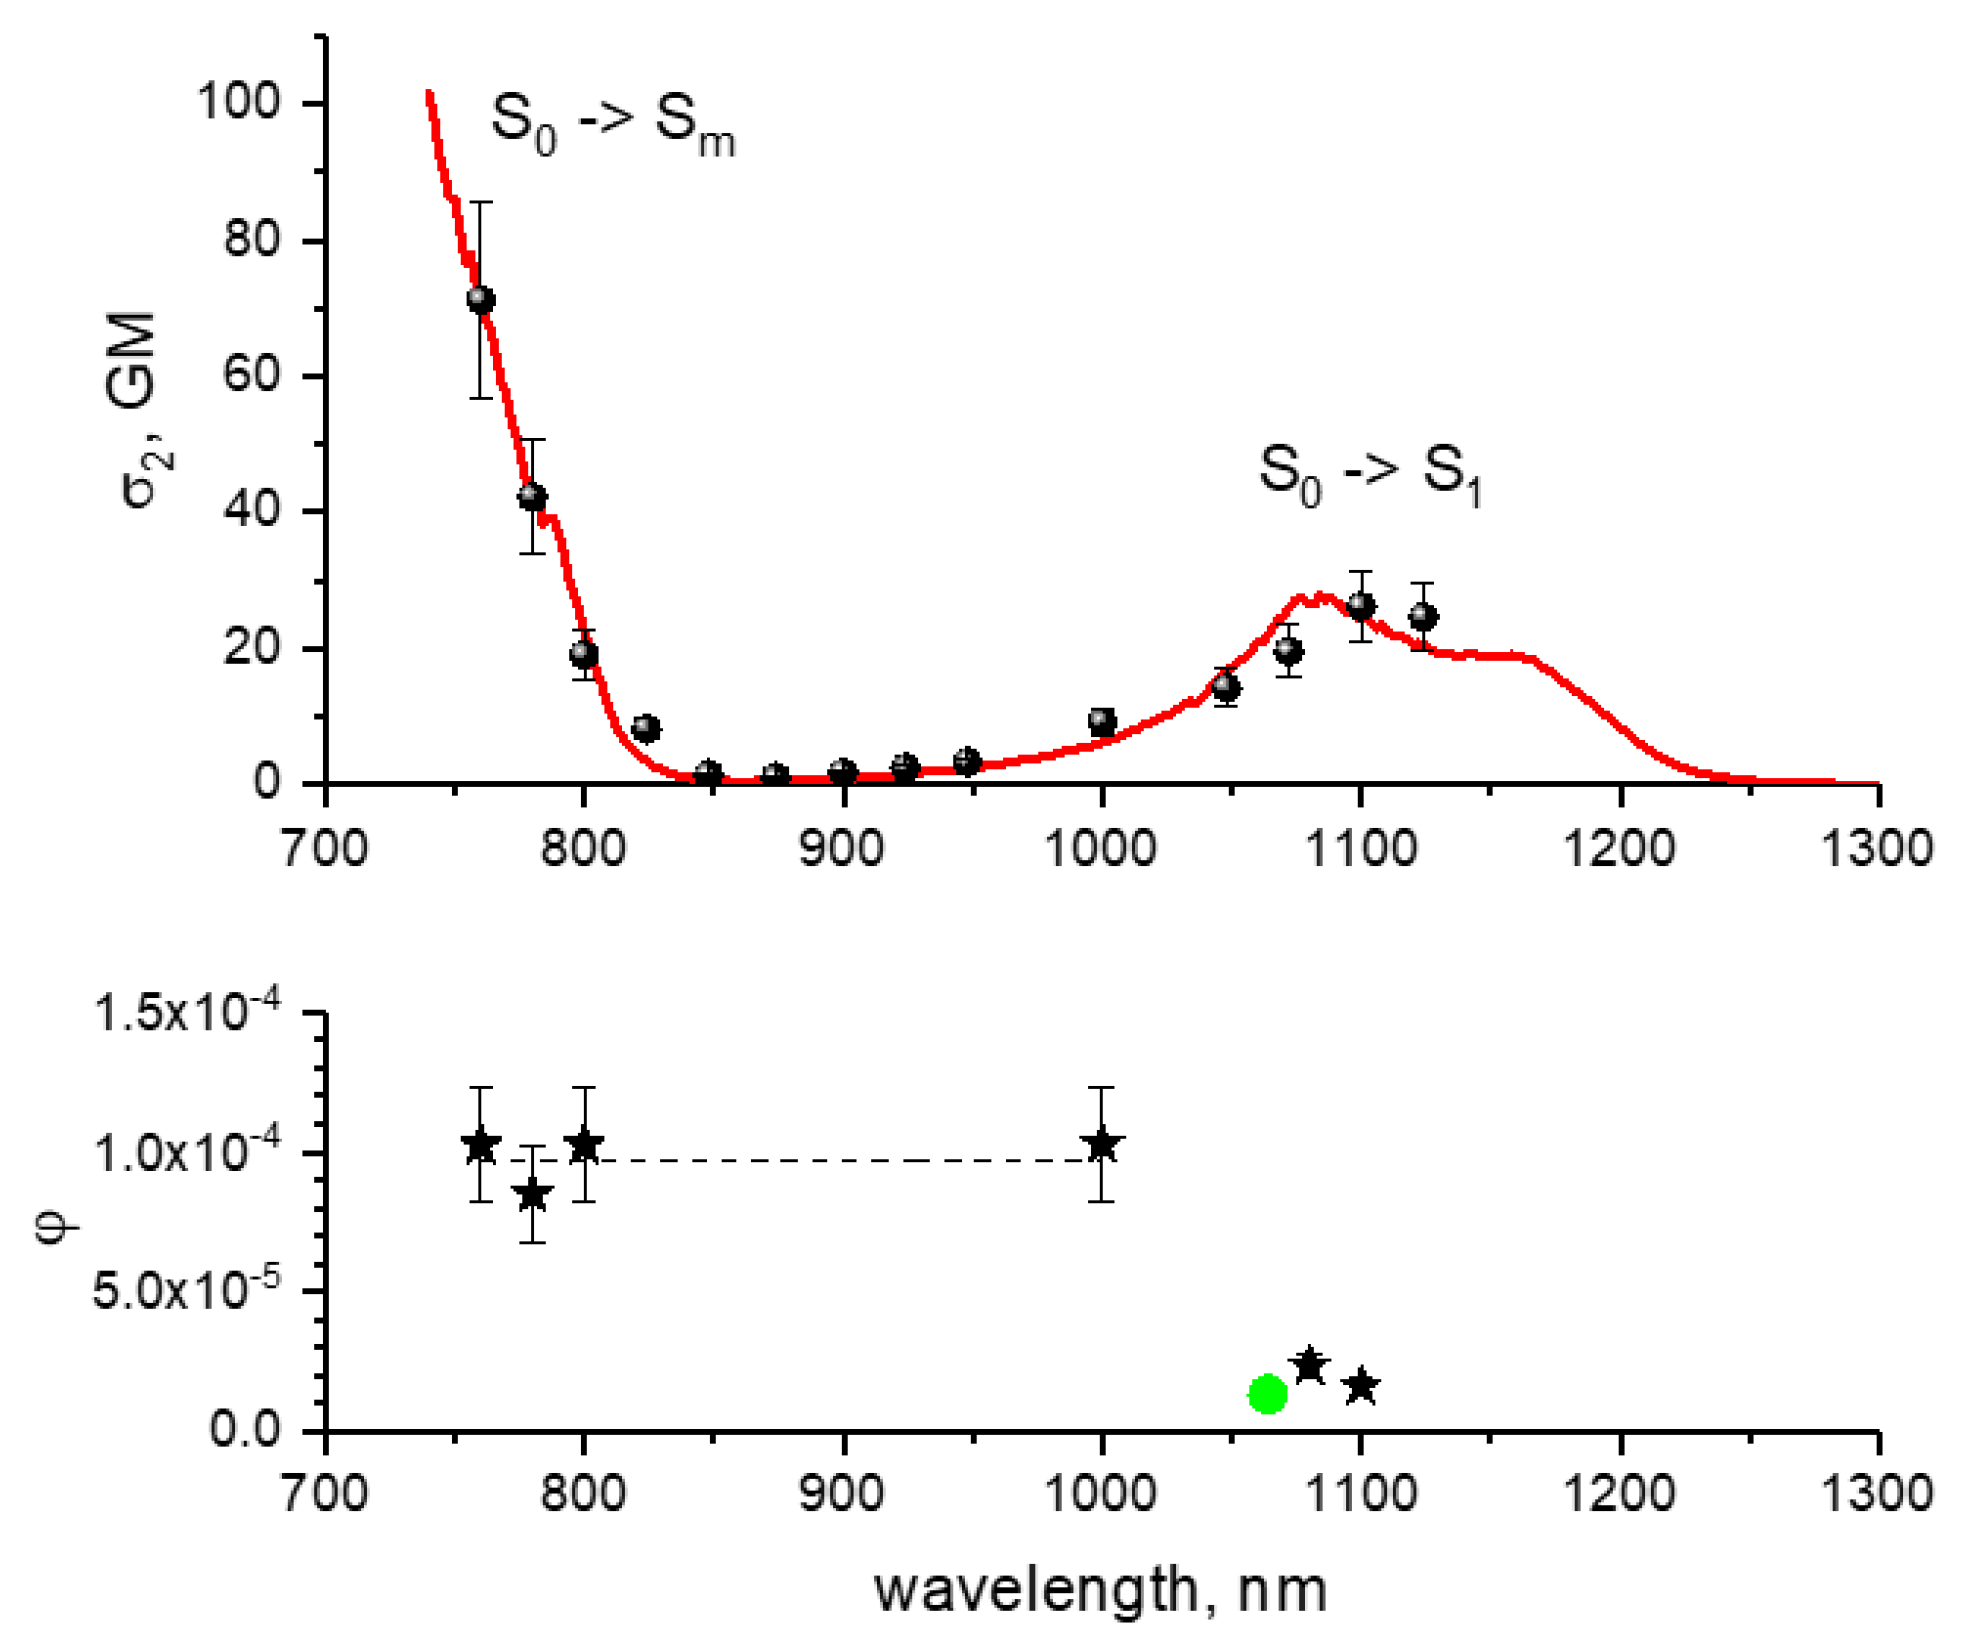
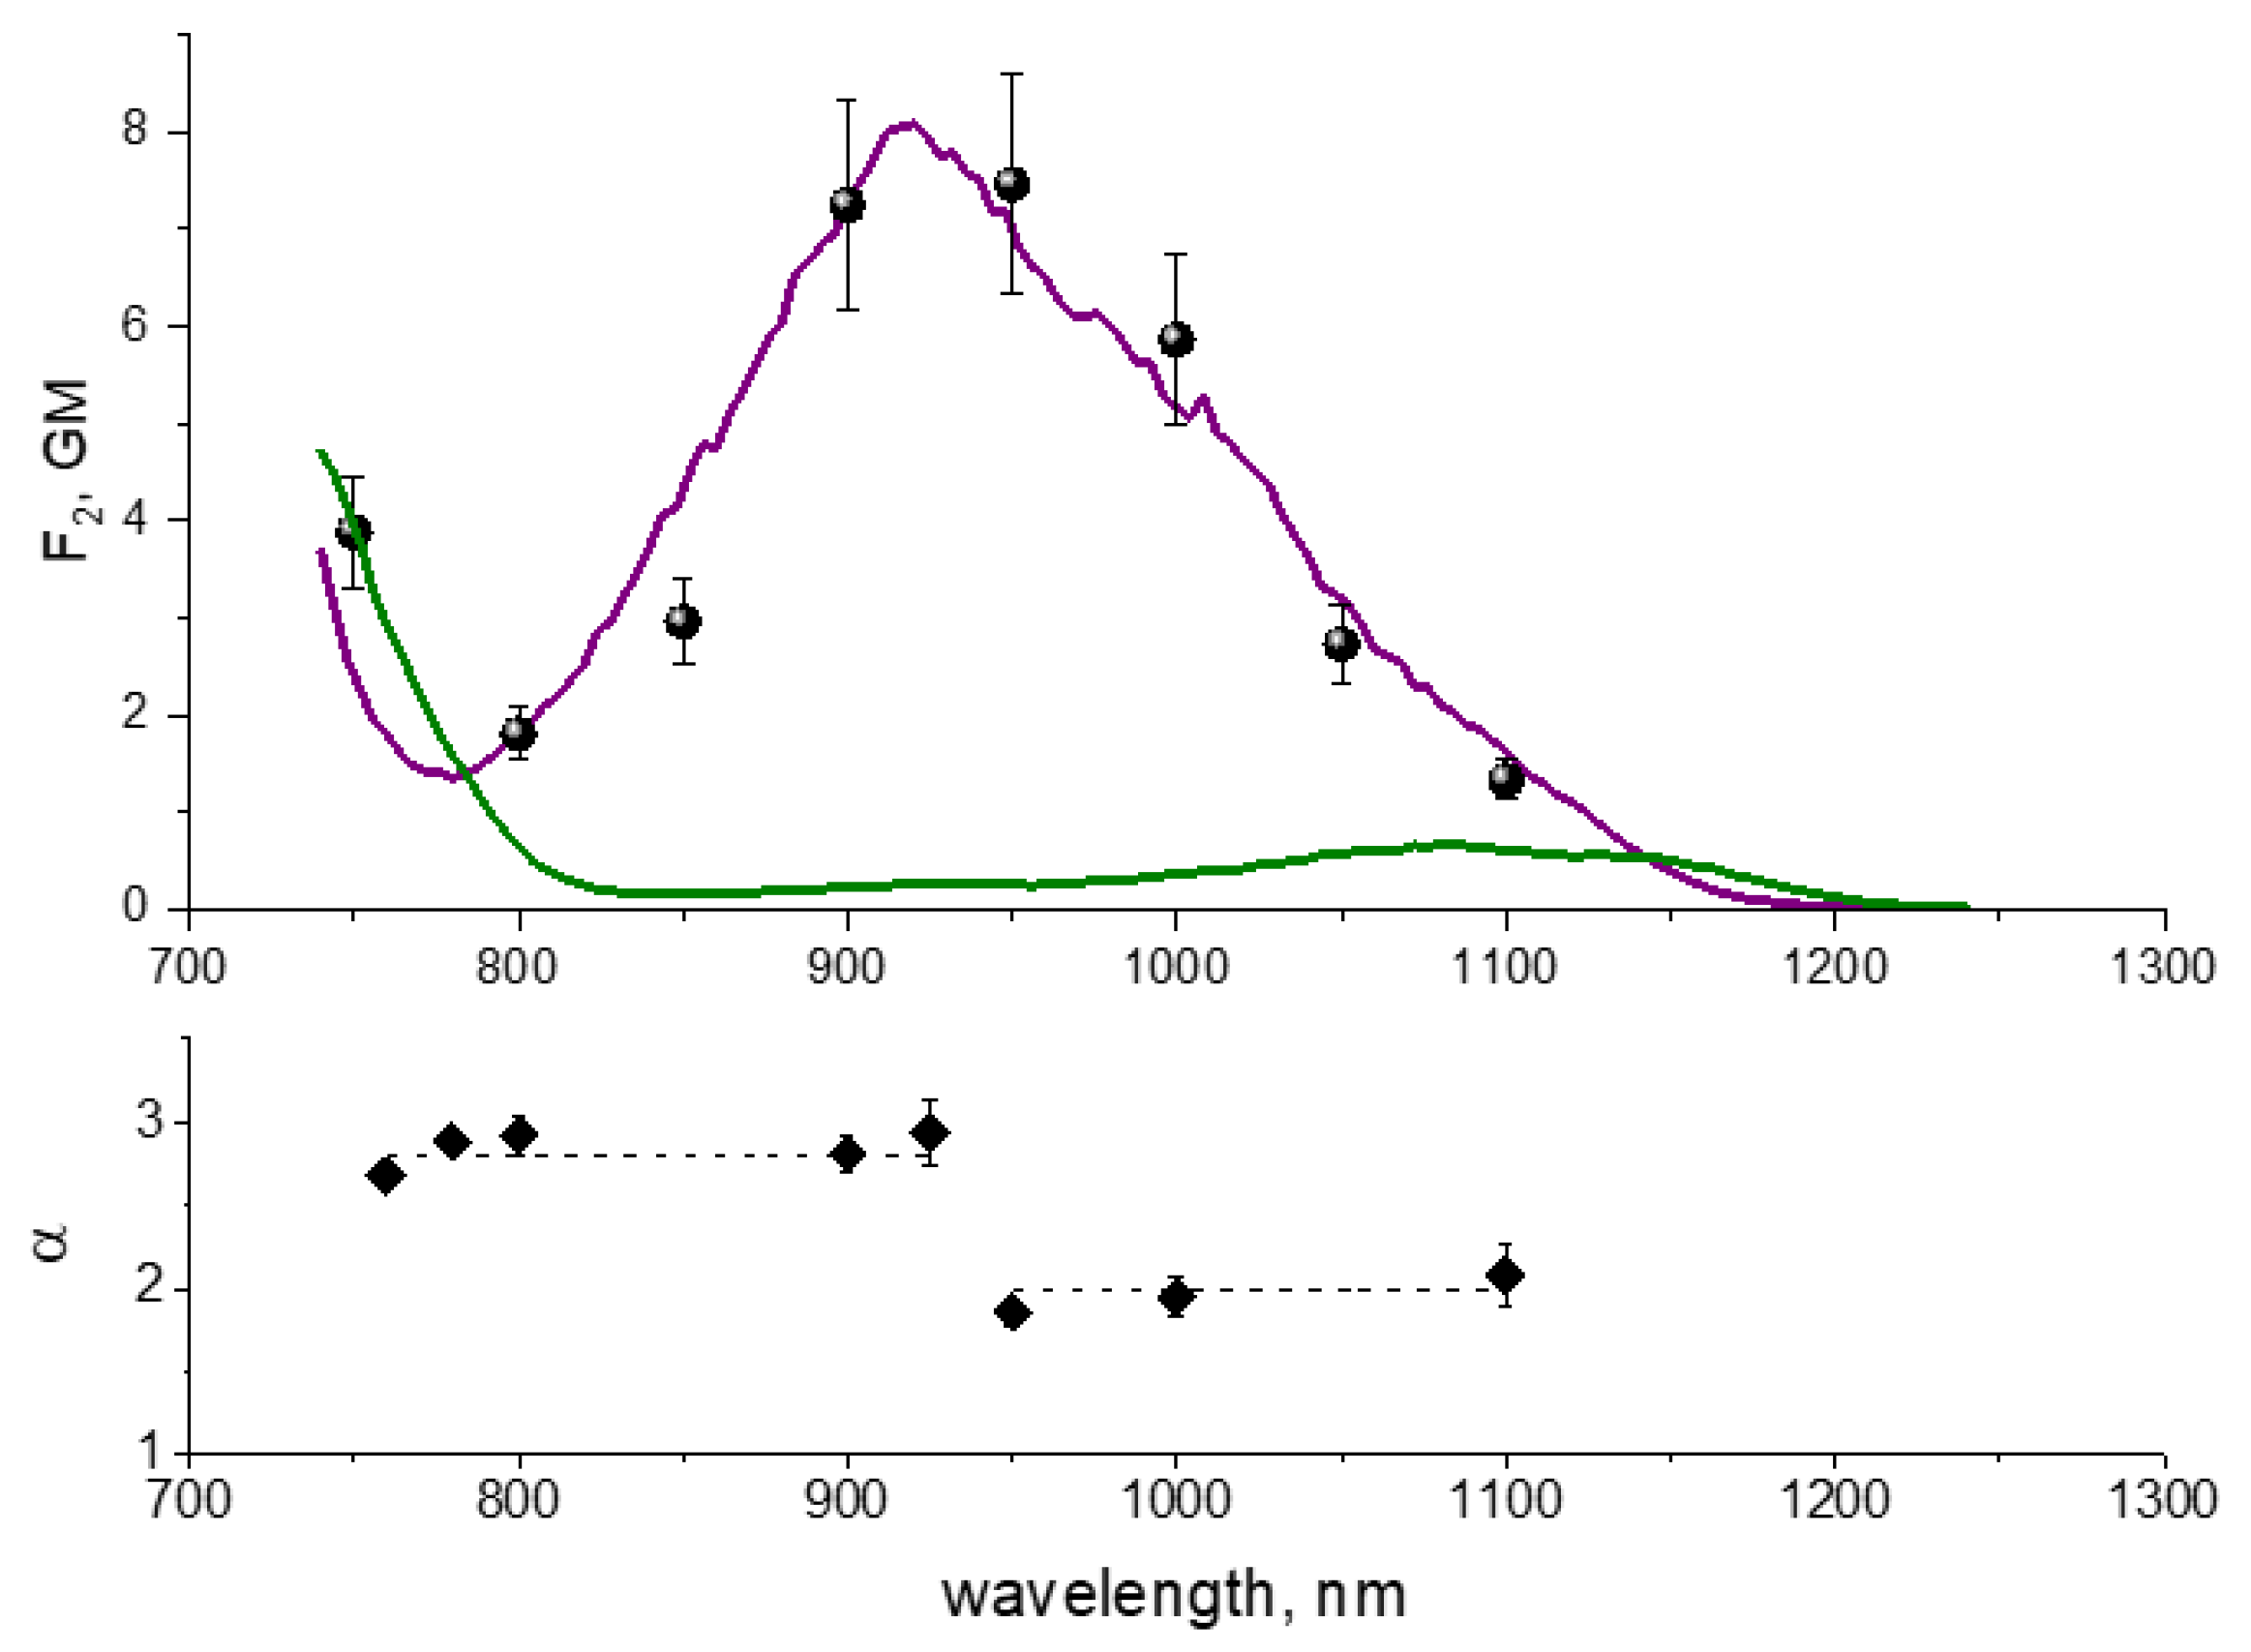
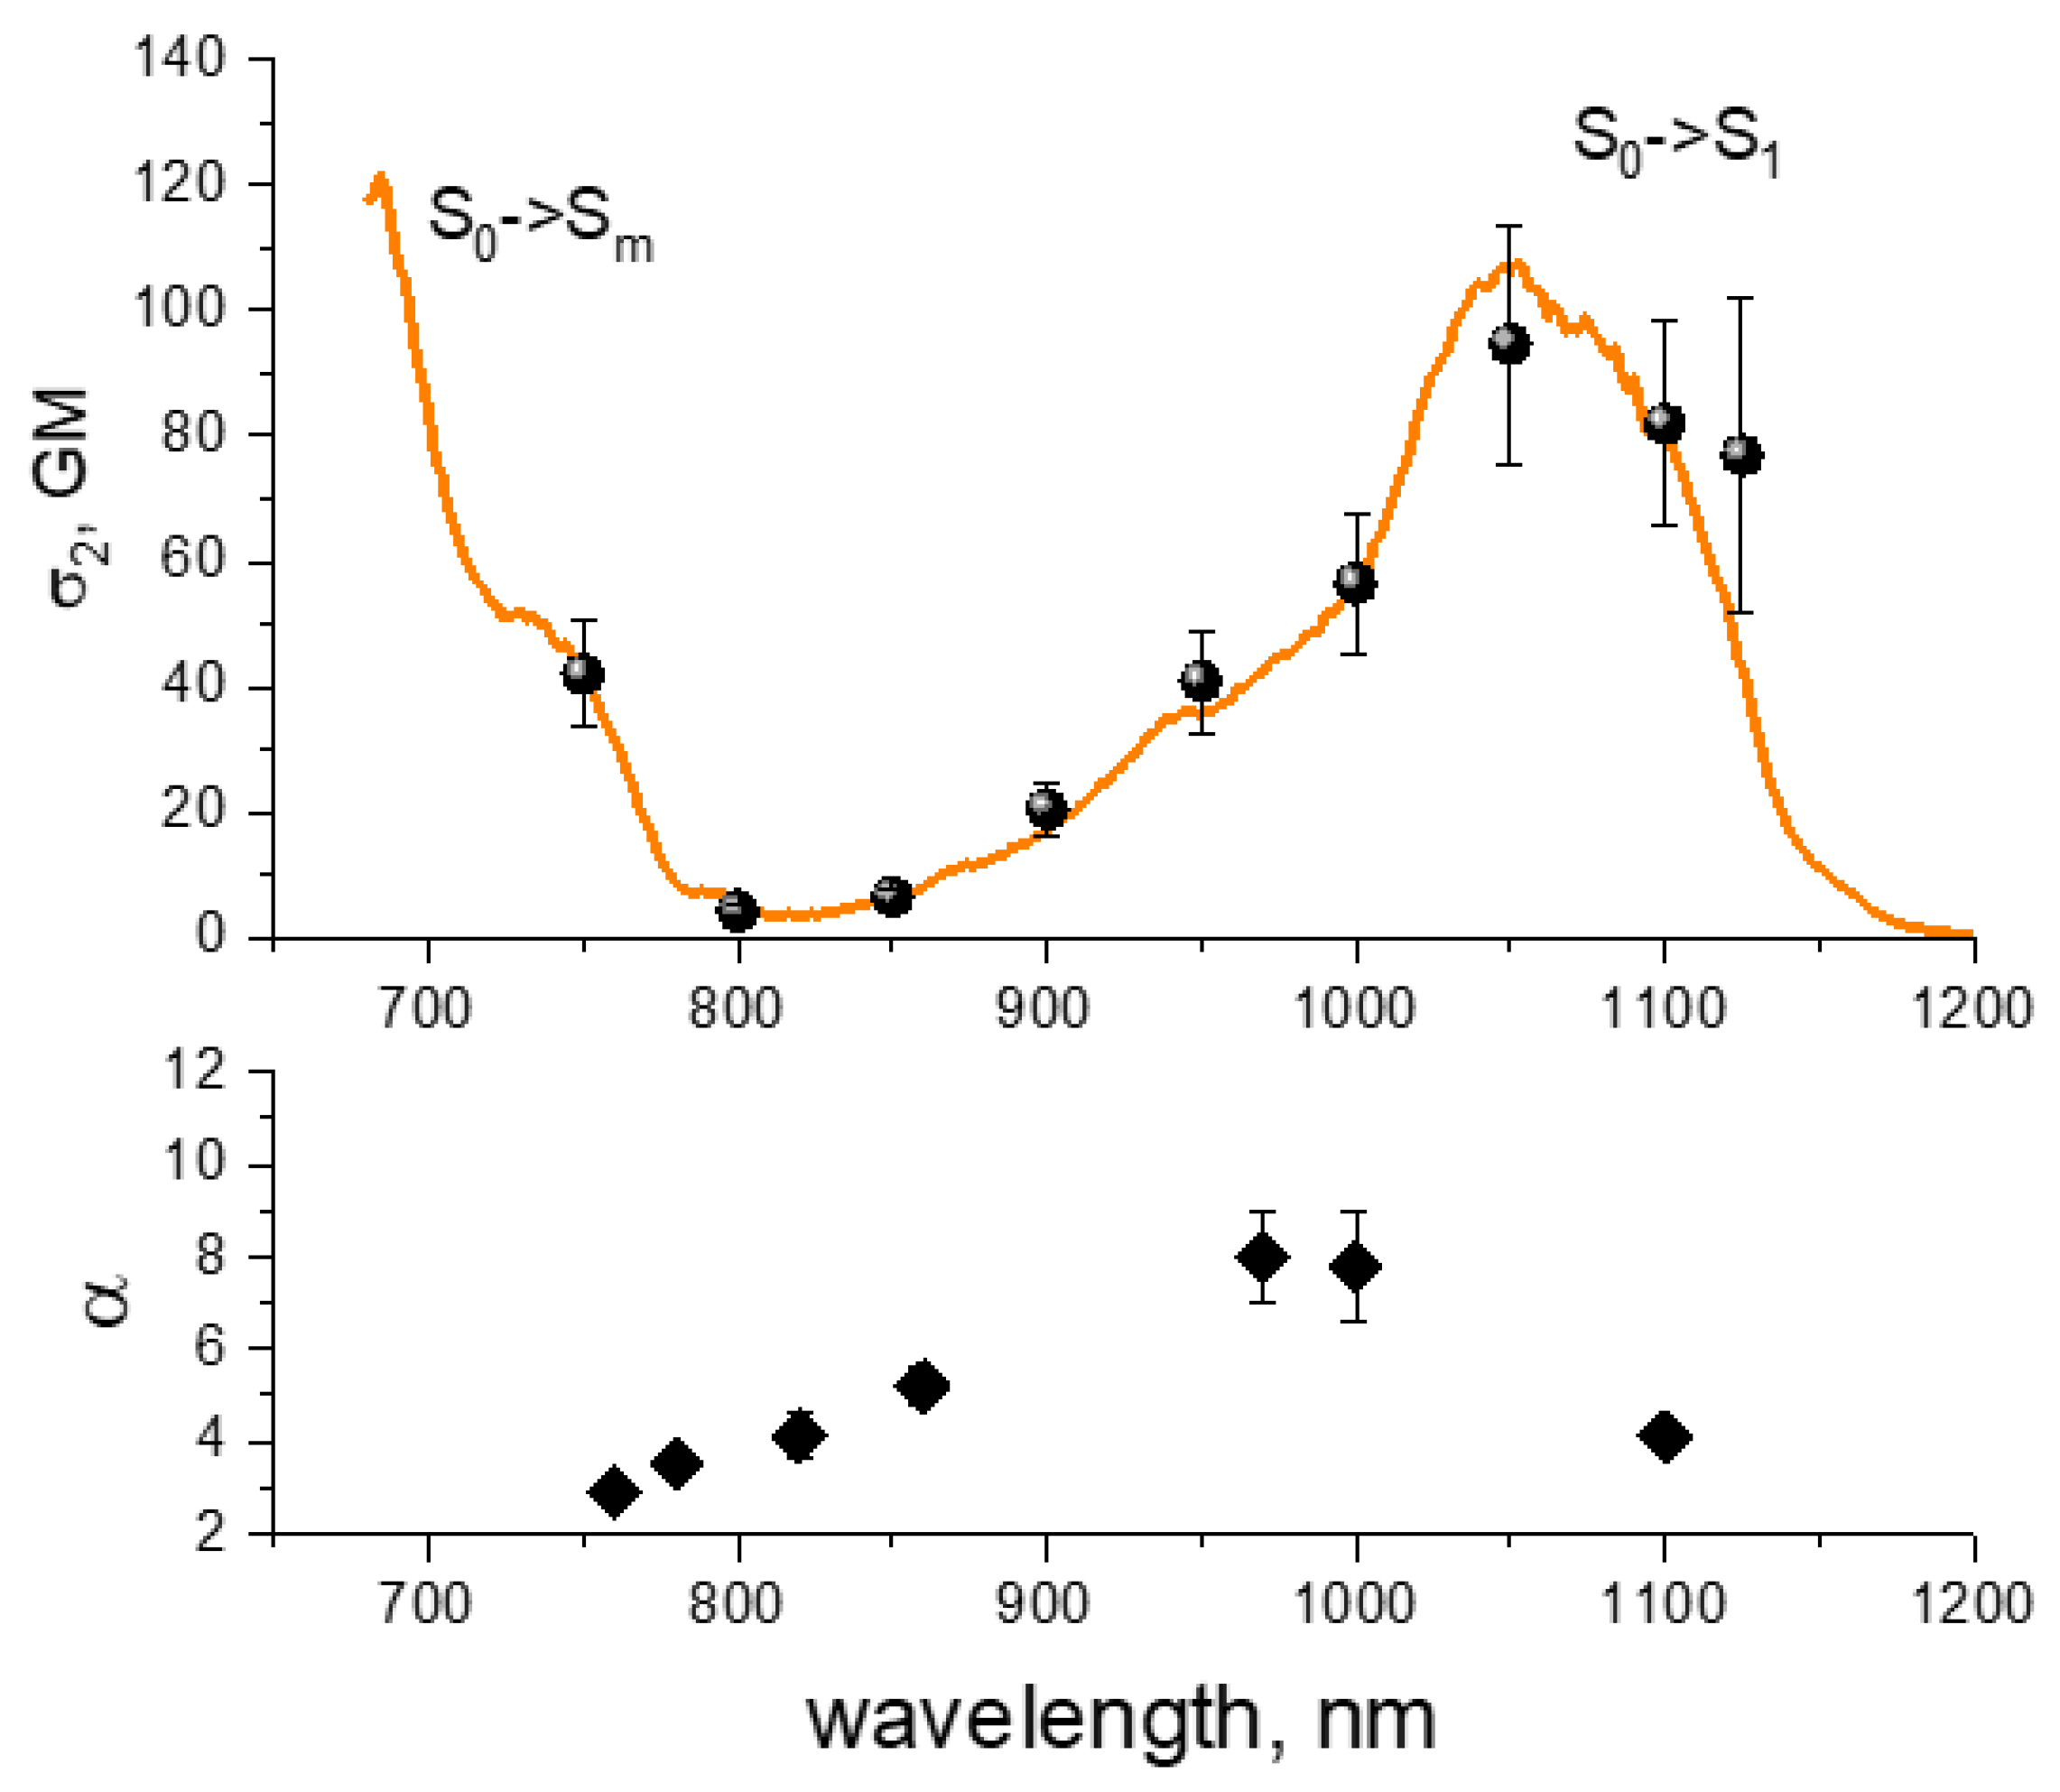
12]. They show two main peaks in this range. The first one, at 1050–1200 nm, typically has moderate two-photon absorption (2PA) cross section, σ2 = 10–100 GM (1 GM = 10−50 cm4 s). The second one, at 700–780 nm, is usually stronger, with σ2 reaching 100–300 GM in some RFPs. This latter region corresponds to a higher energy, S0 → Sm, transition that is also present in one-photon absorption spectra as a weak peak near 350–380 nm. When excited with two photons, it gains its intensity due to the nonlinear optical effect of pre-resonance enhancement that occurs when the laser photon energy approaches the lowest S0 → S1 transition energy from below, but still does not populate it [13,14]. Therefore, excitation at 700–780 nm still corresponds to a simultaneous two-photon absorption with all advantages offered by TPLM, including high spatial (3D) resolution, low out-of-focus damage of tissue, and low autofluorescence background. Given the availability of commercial femtosecond Ti:sapphire lasers, with the high output power and stable operation in this spectral region and the possibility of dual-color two-photon imaging with simultaneous excitation of red and blue FPs [15], excitation at 700–780 nm provides a very attractive opportunity for TPLM with RFPs. However, researchers quickly discovered that RFPs bleach extremely fast when using femtosecond lasers operating in this wavelength range, with typical pulse-peak photon fluxes of 1027–1029 photon/cm2/s at the sample.
There are a number of reports investigating multiphoton bleaching of fluorescent dyes and FPs, but the molecular mechanisms remain almost completely unexplored. In their seminal work, Patterson and Piston reported on multiphoton bleaching of fluorescein dextran, aminocoumarin dextran, NADH, and Indo-1 [
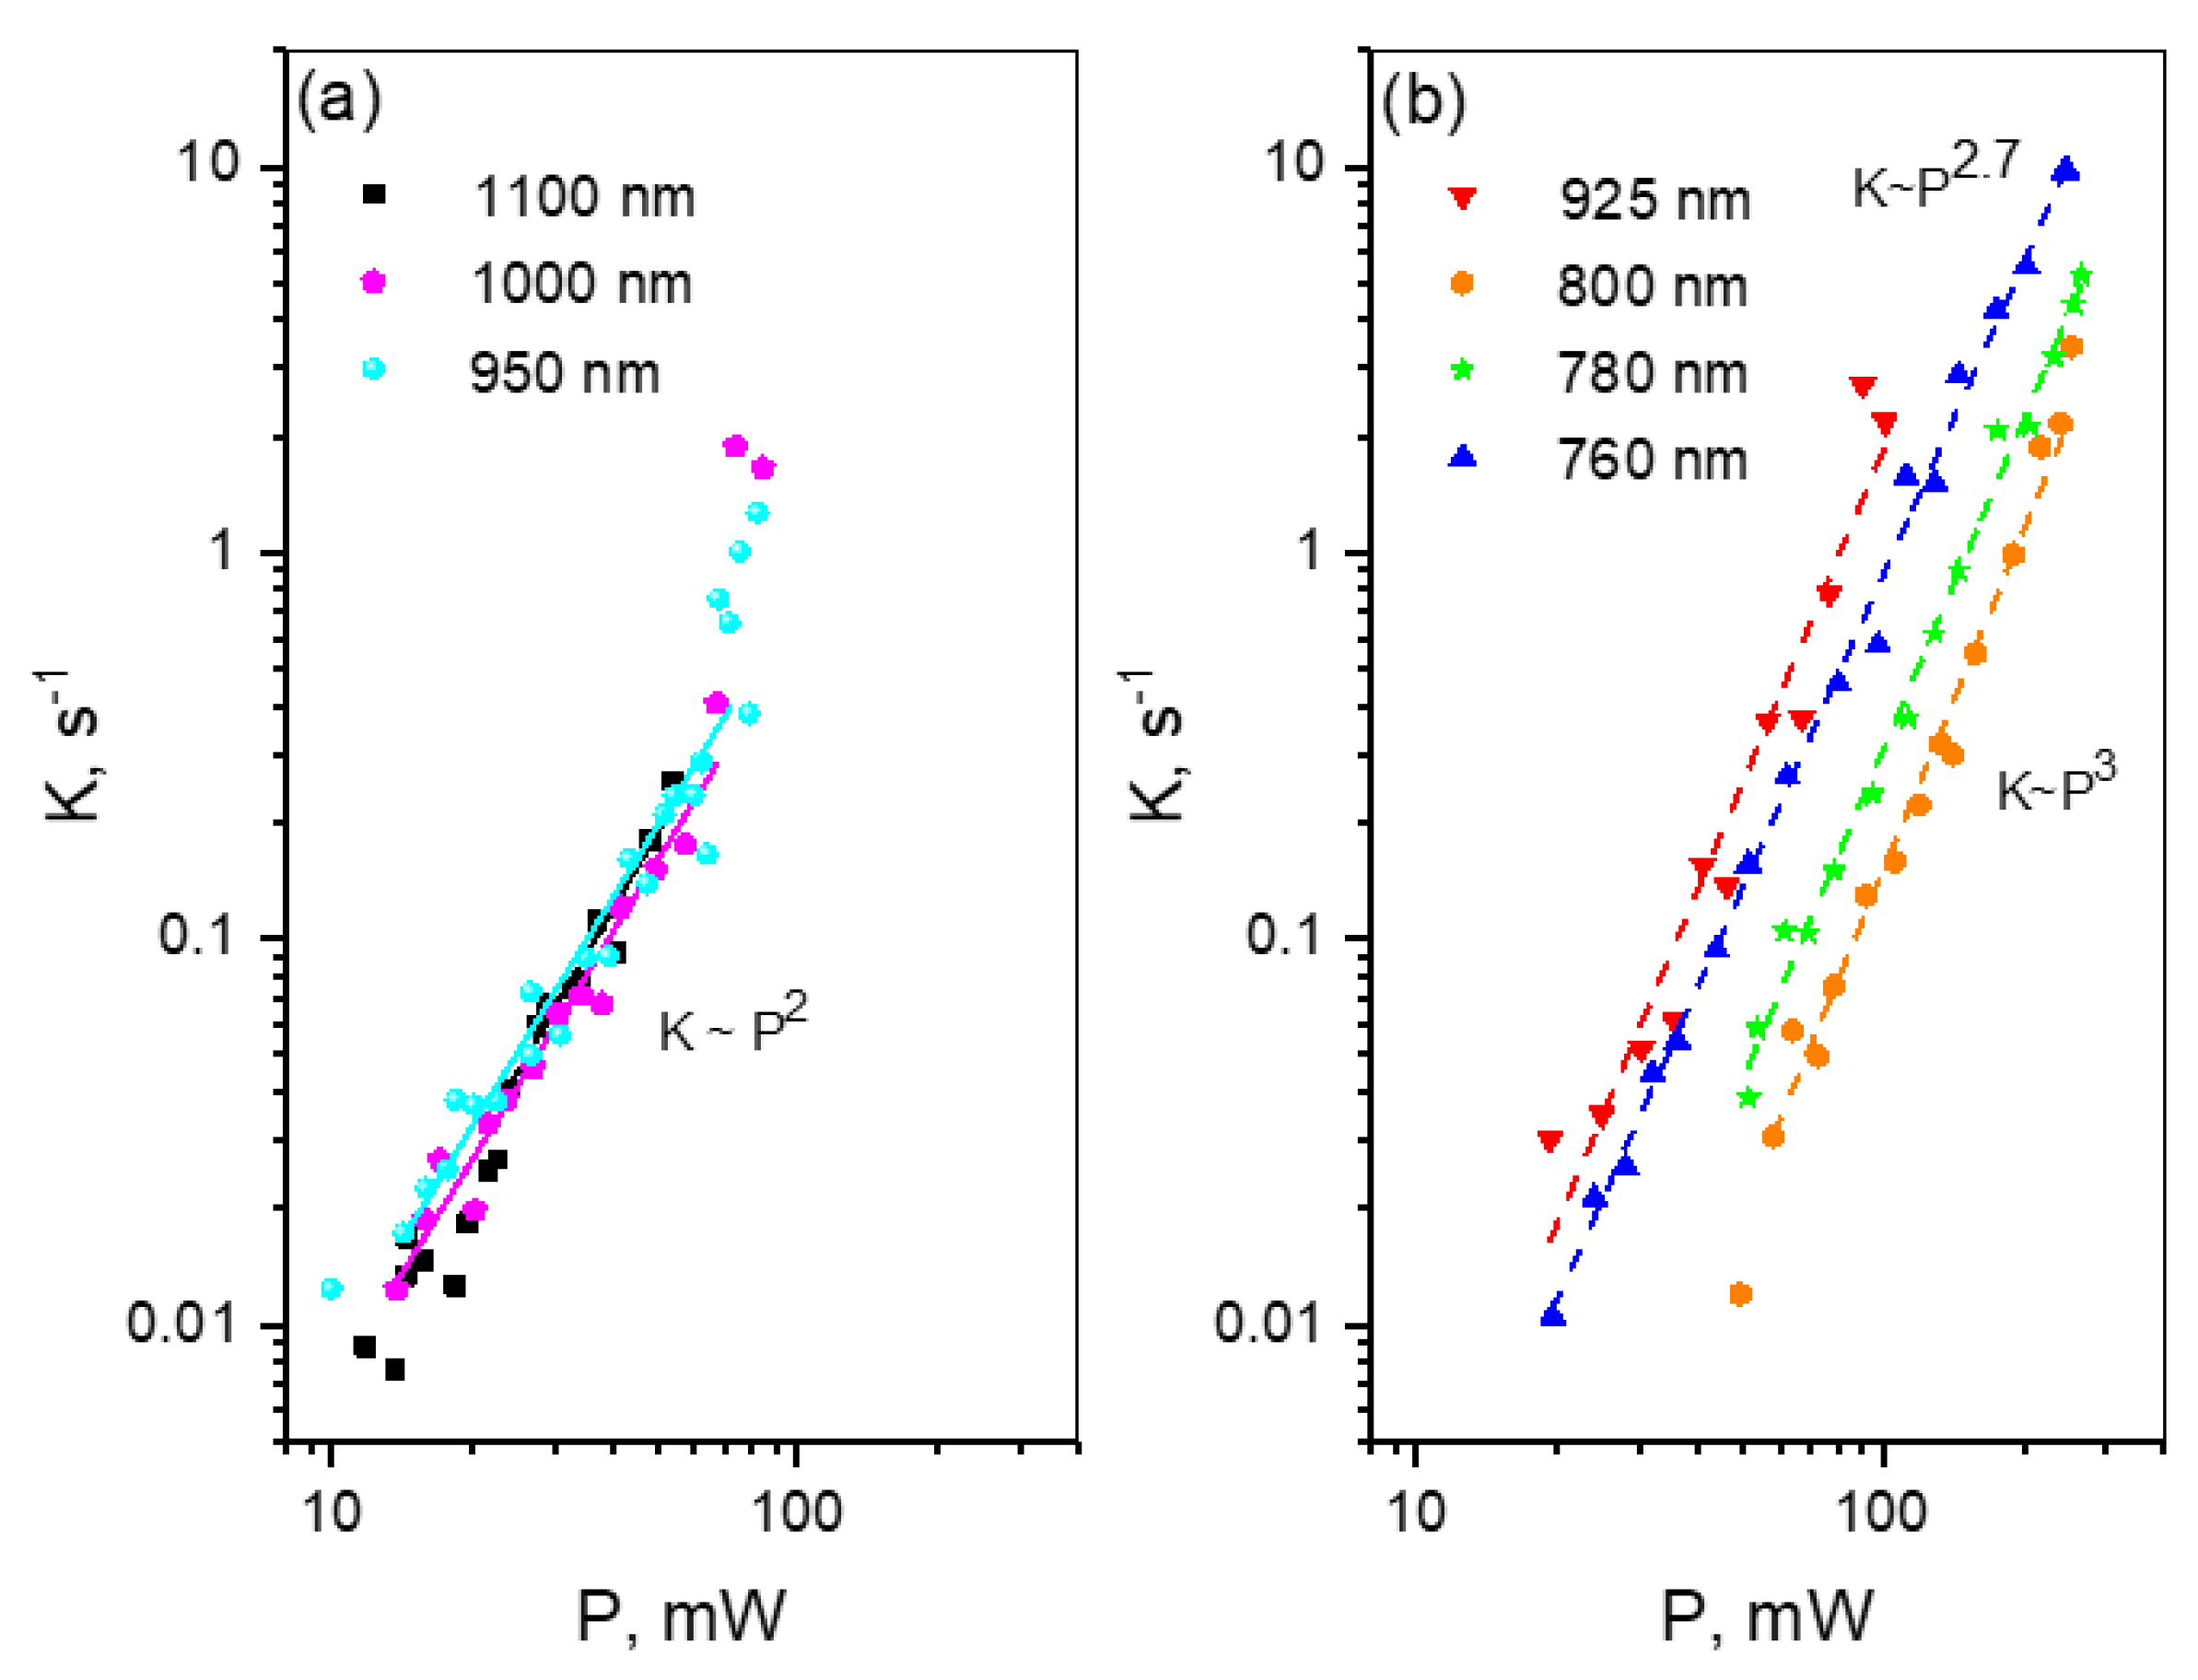
16]. Using a femtosecond 710 nm excitation, they found that although the initial fluorescence intensity increased quadratically with laser power P, the photobleaching rate K increased much faster (i.e., according to a power law, K~Pα with the exponents α ranging from 3 to 5). This super-quadratic dependence suggested involvement of multiphoton processes with number of photons n > 2. It is clear that after direct two-photon excitation, that requires very high photon flux, a large organic molecule can readily undergo several stepwise one-photon absorption events, through a ladder of electronic/vibrational excited states, that make a quasi-continuum above the S1 level. The most general photochemical outcome of this process is multiphoton ionization or electron detachment (for anionic chromophores) [17]. For example, fluorescein dextran required absorption of a total of three photons (power exponent 3.1 ± 0.1) for photobleaching. Photodetachment energy of fluorescein lies between 5.1 and 6.3 eV (depending on protonation state) [18]. For the 1.75 eV photon energy (used in the Patterson and Piston experiment) the above numbers translate into the number of photons, n ~3, thus supporting the photodetachment mechanism. Photobleaching of aminocoumarin requires five photons (power exponent 5.1 ± 0.2 at 710 nm) [16]. Given photoionization energy of aminocoumarin of 8.05 eV [19], a minimum of five photons are required to ionize this molecule, which supports our assumption that the photobleaching is caused by multiphoton ionization.
Marchant and co-authors [20] demonstrated that the wild-type red FP, DsRed, bleaches in CHO cells according to a third power law (α = 2.98 ± 0.10) when excited at 760 nm, in the range of average power densities 5–40 μW/μm2 (approximately corresponding to peak photon fluxes of I0 = 3 × 1026–2.5 × 1027 photon/cm2/s). This suggests a three-photon initiated process. The authors also found that, upon excitation at 950 nm, DsRed bleaches much slower than at 750 nm excitation, with the laser power adjusted to produce similar initial fluorescence signals at these two wavelengths. Later, Robinson and Marchant [21] extended this study to several DsRed mutants expressed in HEK-293 cells, and have shown that all of them bleach much faster at 750 nm compared to 950 nm. The power exponents observed for bleaching at 750 mn varied from 2.69 (for DsRed2) to 3.05 (for DsRed [N42Q]). A similar trend of slowing down the bleaching rate upon shifting excitation of DsRed2 to longer wavelengths, from 760 to 880 and further to 1100 nm, was found in [22]. Higher than quadratic power dependence (α = 2.9 ± 0.10) was also observed in another DsRed mutant, tdRFP, expressed in T cells and excited at 1100 nm with I0 = (2–3.5) × 1029 photon/cm2/s [23]. Interestingly, the same excitation fluxes resulted in much faster bleaching of enhanced green fluorescent protein (EGFP) at 850 nm, with α = 2.57 ± 0.25. Other groups also reported a super-quadratic dependence of photobleaching for EGFP and cyan FP (CFP) [24,25,26,27]. Kalies et al. correlated the power exponent of the EGFP bleaching rate with the multiphoton electron photodetachment from the chromophore or a nearby tryptophan residue [26].
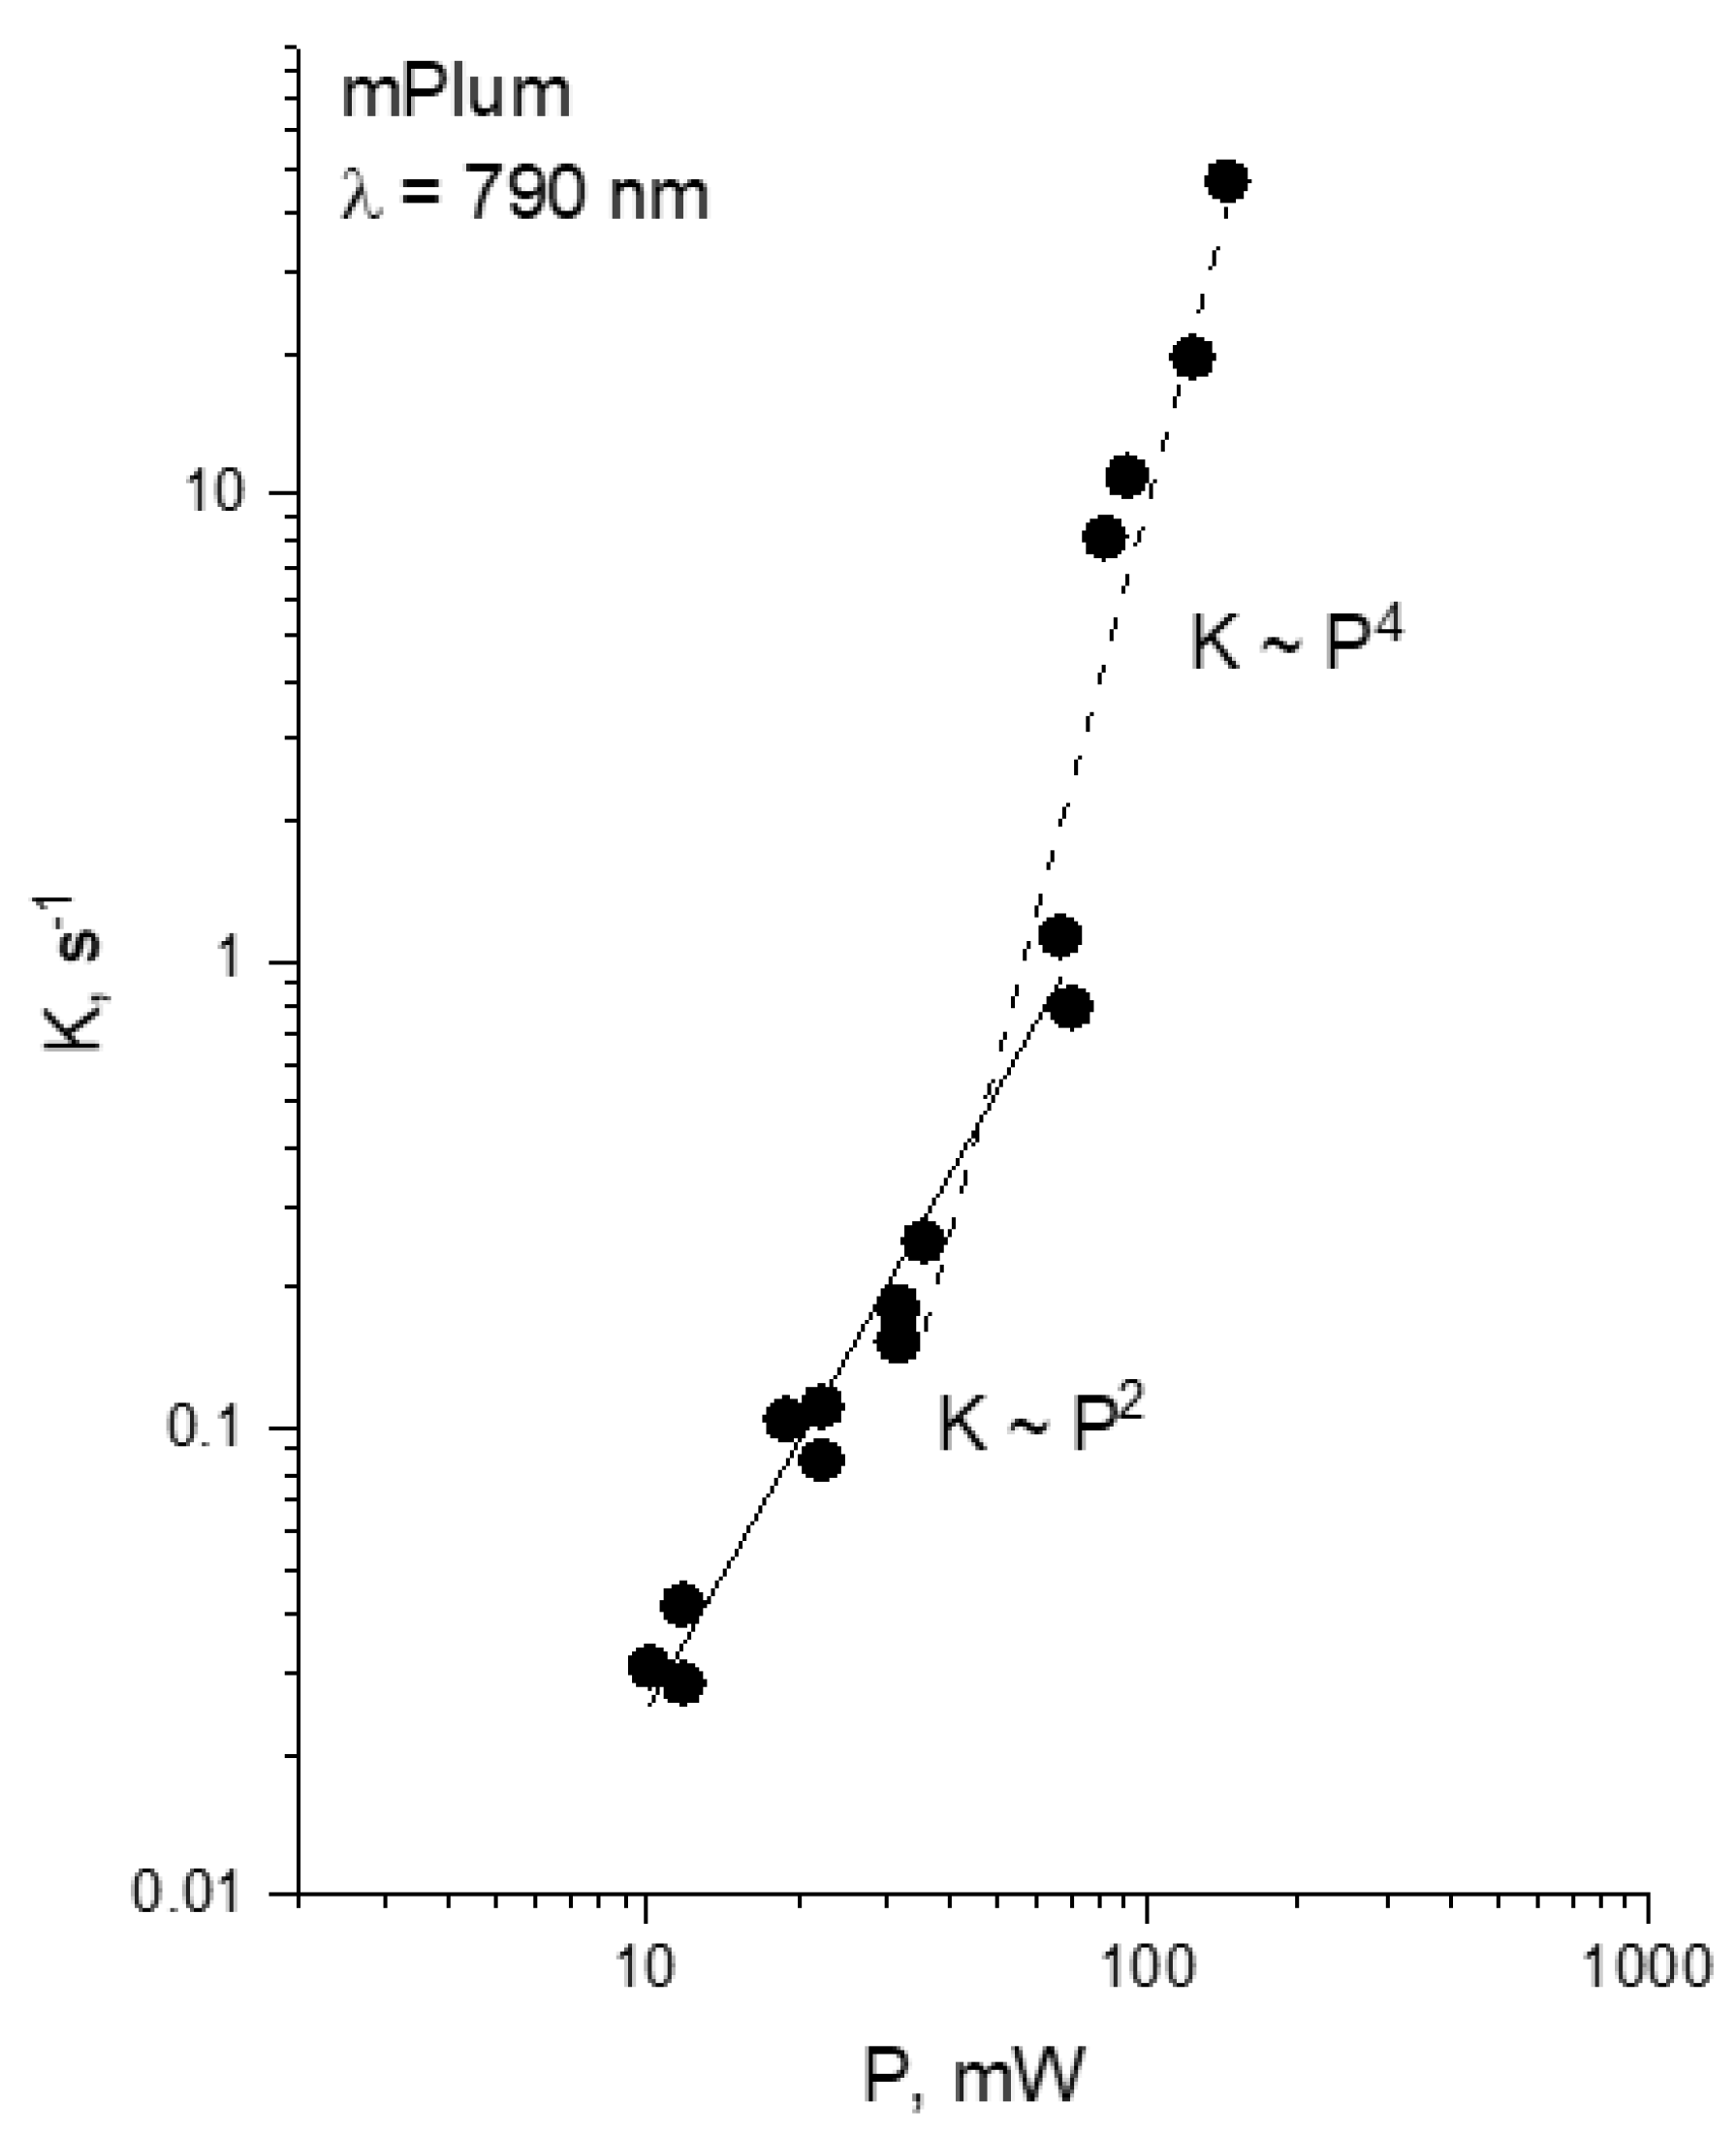
Drobizhev and co-authors characterized multiphoton bleaching of monomeric RFPs, mFruits (mCherry, mPlum, and mStrawberry) and DsRed2 in buffer solution and E. coli cells, with the emphasis on possible photochemical mechanisms [28]. The rate of the first step of a chain of photochemical reactions leading to photobleaching was measured as a function of laser intensity at 790 nm. The DsRed2 rate followed a power law with α = 2.84 ± 0.01, at I0 = (0.3–1.1) × 1029 photon/cm2/s, in agreement with previous observations [20,21]. In DsRed2, photobleaching occurs through the three-photon absorption process with a slight saturation of the one-photon Sm → Sn transition. Vertical detachment energy (VDE) of the anionic chromophore inside DsRed2 lies at ~7.24 eV [28], suggesting that at least five photons (of 790 nm) are needed to reach this threshold. A three-photon-induced electron transfer reaction starting from the bound Sn state of DsRed2 is probably a first step of phototransformation [28]. mFruits bleach according to a power law with α = 3.2–3.5, suggesting a four-photon mechanism with strong saturation of one or two one-photon transitions, following initial two-photon absorption step. Electron photodetachment energies of mFruits are found in the range 5.52 (mCherry)–5.61 eV (mPlum) [28]. Absorption of four photons (at 790 nm) can easily provide enough energy to overcome this threshold and, therefore, the four-photon photodetachment is suggested as a first step of photobleaching in mFruits [28]. The chromophore environment of DsRed2 contains more positive amino acid residues compared to mFruits, and this can be a reason of its higher photodetachment energy.
Since the fluorescence signal increases slower (quadratically), with the laser peak intensity compared to photobleaching rate, any reduction of the laser pulse-peak intensity should be beneficial until the moment where fluorescence signal becomes undetectable against the noise. Following this idea, several approaches to reduce photobleaching were suggested. Drummond et al. proposed to (1) block the laser with the programmed Pockels cell during the “flyback” time (when fluorescence is not collected but the laser still irradiates the sample); and (2) increase the sensitivity of detection by using an additional widefield detector in the transmission position, which made it possible to use less excitation power [25]. The use of passive pulse splitters, providing less peak intensity but higher repetition rate, resulted in faster reduction of photobleaching relatively to fluorescence signal [29]. On the other hand, if multiphoton absorption involves triplet manifold, lower pulse repetition rate can be beneficial [30]. Phase modulation or dispersion compensation of femtosecond pulses also helped reducing multiphoton bleaching [27,31,32,33]. Although these methods provide some improvement on the fluorescence/bleaching ratio, they require technical upgrades of commercial 2P microscopes.
Here we aim at finding simple solutions to the problem of rapid multiphoton bleaching in terms of optimization of laser intensity and excitation wavelength. They require the (phenomenological) knowledge of photochemical mechanisms and their dependence on laser intensity and wavelength. First, one can expect that at small laser intensities the bleaching rate should show a quadratic dependence on intensity, with the rate equal to that observed with one-photon excitation (with the 2P and 1P excitation rates being equal). A transition between quadratic and higher-order dependence defines a particular threshold for laser power, P*. An optimum intensity for TPLM should be chosen close to the P* value because it provides the highest signal-to-background ratio (SBR), and any further reduction of intensity would not improve the fluorescence/bleaching ratio. A particular value of threshold intensity is a function of wavelength because the corresponding laser and molecular parameters depend on wavelength. Second, if the bleaching is due to multiphoton ionization (electron detachment) with n photons involved (like in mFruits), one can look for a threshold photon energy (wavelength) where this process in not allowed energetically: nhν < VDE.
We check these ideas for a series of RFPs, including popular monomeric variants mCherry [1] and mPlum [34], one of the two-photon brightest RFP, tdTomato [1,10], and a new red Ca2+ sensor with the long Stokes shift in the Ca2+-bound state, jREX-GECO1 [35]. Compared to the previous work [28], we study photobleaching rates in a broader range of excitation intensities and at different excitation wavelengths across the 2PE spectrum. We found some important threshold values for the laser photon fluxes and wavelengths for these RFPs and show that in some cases one can predict these values if the molecular and laser parameters are known.

2. Results

2.1. Physical Model of Multiphoton Bleaching in a Thin Colony of Cells Containing Fluorescing Molecules

We use a physical model of multiphoton bleaching that was previously described in [28]. Here we briefly present its main points and summarize its results.
After absorption of n photons, a molecule can undergo a chain of chemical transformations leading to eventual bleaching of fluorophore,
A * B ( * ) C
where A is the concentrations of the initial form, and B, C, etc. are the concentrations of intermediate forms. The asterisk denotes an electronically excited state. This process results in a complex, non-monoexponential decay kinetics of the initial state A. For simplicity, here we measure the initial slope of the fluorescence decay curve F(t) normalized to 1 at t = 0 (method of initial rates of chemical reaction). This slope provides the observable rate K that, in turn, is related to molecular rate of the first reaction step, k1, corresponding to the A* → B(*) transition. To express k1 through molecular and laser parameters, we consider dynamics of populations in several different energy level diagrams displayed in Figure 1.
The diagram (a) represents a low intensity (lower than a certain threshold) two-photon excitation of molecule to the first excited electronic level S1, from which it can start a transformation with quantum yield φ1. The rate k1 depends quadratically on laser power in this regime. This process should obey the well-known Kasha’s rule that states that independently of the mode of excitation (i.e., one- or two-photon), the quantum yield φ1 should be the same.
The diagram (b) corresponds to a low-intensity two-photon excitation to a higher electronic level Sm. After such excitation, a molecule can either relax to the S1 state with subsequent transformation to B as in case (1) (standard Kasha’s pathway), or proceed to B with different quantum yield, φm (violating Kasha’s rule). The latter corresponds to a situation when the A* → B(*) transition efficiency depends on the excess excitation energy in the A* state relatively to the lowest level of the S1 state. One can think that this can only happen if the photochemical quantum yield φm ~1, because the photochemical rate should be on the picosecond scale (i.e., competing with intramolecular vibrational relaxation). However, the possibility of the reverse reaction B* → A* or even B* → BA removes that stringent requirement and the φm value is still allowed to be much less than 1. In other words, a violation of Kasha’s rule is related to a presence of a second specie, B* that is dynamically coupled to A*.
The third diagram (c) represents the three-photon process where the initial simultaneous two-photon excitation (0 → m) is followed by a third photon, absorbed linearly through the m → n transition. The quantum yield of the reaction, initiated from the excited state n, φn, can be different from φ1 and from φm, and the same considerations as applied to φm can be used here. This three-photon (2 + 1)-induced process occurs at moderate laser intensities, typical for TPLM. Even with moderately high intensities needed for the robust two-photon excitation (1028–1029 photons/sm2/s), once a molecule is in the m state, the probability of the m → n transition (bold up arrow in Figure 1c) can be very high. This will result in partial saturation of transition. In fact, for typical one-photon cross sections, σmn ~10−16 cm2, the probability of absorption during the pulse duration (10−13 s) becomes ~0.1–1, and the stimulated emission must be considered as well (bold down arrow in Figure 1c). As a result, the intensity dependence of the rate will show a power dependence with an exponent α between 2 and 3. The last diagram (d) demonstrates the process of four-photon (2 + 1 + 1)-induced bleaching involving initial two-photon absorption followed by sequential one-photon absorptions of two additional photons, eventually bringing the electron to an ionization continuum that lies above the ionization energy (electron detachment energy for anionic chromophores). The last step transition n → c typically has small cross sections, σnc ~10−20–10−19 cm2 ([17] and the data below).
Our estimation shows that with the intensities used here, it is difficult to saturate this transition. In the case of partial saturation of the m → n transition, the power exponent of the bleaching rate will be between 3 and 4.
The solution of the rate equations corresponding to cases (a)–(d) at a particular photon flux for “local” decay rates was given in [28]. In our experiment, we irradiate E. coli cells expressing a particular RFP in a 2PLM setup and measure the temporal decay of fluorescence signal. In the description of the observed multiphoton bleaching kinetics, we neglect the diffusion of FPs in and out of laser focal area during bleaching time because the laser beam diameter in our experiment is much larger than the E. coli cell size. However, because of the spatial distribution of intensity, different chromophore molecules will see different photon fluxes. To obtain the observed (average) rates we had to integrate the local rates over space and time. It is important that the colony thickness l in our experiments is comparable to the Rayleigh length zR of the laser intensity distribution. Therefore, we do not use a “thick sample” approximation and the integration results depend on geometrical parameter equal to the ratio η = l/2zR.
To proceed with integration, we describe the spatial and temporal distribution of laser intensity near the focal spot by a Gaussian-Lorentzian function in cylindrical coordinates,
I ( r , z , τ ) = I 0 w 0 2 w ( z ) 2 e x p ( 2 r 2 w ( z ) 2 ) , Δ τ / 2 τ < Δ τ / 2 ; I ( r , z , τ ) = 0 , o t h e r w i s e ,
where w(z) is the beam waist radius at distance z from the focal plane (in cm2), τ is the time lapse within the pulse (in s), I0 = I (0,0,0) is the peak photon density (in photons/cm2 s) in focal spot. For simplicity, we consider the laser pulse temporal profile as rectangular with a full width of ∆τ. Integration of (2) over time and cross-sectional area at focal plane z = 0 (w = w0) relates the peak photon density I0 to the average laser power P (in W), measured in experiment:
P = π 2 f h ν Δ τ w 0 2 I 0 ,
where f is the pulse repetition rate, h is the Planck constant, ν is the photon frequency (in Hz).
We now calculate the initial decay rate of the observed fluorescence signal normalized to initial signal (F(0)) as follows:
K = 1 F ( 0 ) d F d t | t = 0 = d V p u l s e d τ I 2 ( r , z , t ) n ( r , z , t ) t | t = 0 n ( 0 ) d V p u l s e d τ I 2 ( r , z , t ) ,
where t is the measurement time, dV is the element of volume dV = 2πrdrdz, n(r,z,t) is the time-dependent local concentration of unbleached molecules.
In general, the multiphoton rate can contain different terms corresponding to processes with different orders that potentially compete with each other:
K = K ( 2 ) + K ( 3 ) + K ( 4 ) +
We now provide the analytical results, corresponding to individual terms in the above equation without and with partial saturation of some of the intermediate transitions. In the case (a) of Figure 1, the observed rate of two-photon bleaching process reads
K ( 2 ) = 1 π 2 σ 2 φ 1 Γ 3 ( η ) Δ τ f ( h ν ) 2 w 0 4 P 2 ,
where all Γi(η) functions, i = 2, 3, 4, 5, appearing here and throughout depend only on the ratio η = l/2zR. They are presented in Supplementary Info. In the case (b) of Figure 1, one can use the same expression for K(2) where φ1 is replaced by φm.
In the case of three-photon initiated process (c) without saturation one obtains,
K ( 3 ) = 4 5 π 3 σ 2 σ mn φ n Γ 4 ( η ) Δ τ f 2 ( h ν ) 3 w 0 6 P 3 .
In the case of slight saturation of the m → n transition (i.e., when the observed power exponent is slightly less than 3), one can use the following fitting function:
K ( 3 ) = 1 π 2 σ 2 φ n Δ τ f ( h ν ) 2 w 0 4 [ 1 5 Γ 4 ( η ) P P s 1 18 Γ 5 ( η ) ( P P s ) 2   ] P 2 ,
where
P s = π 4 f h ν w 0 2 σ mn
is the saturation power (in W).
In the case of four-photon initiated process without saturation, Figure 1c, the observed rate reads
K ( 4 ) = 4 9 π 4 σ 2 σ mn σ nc Γ 5 ( η ) Δ τ f 3 ( h ν ) 4 w 0 8 P 4 .
For the strong saturation of the m → n transition, (i.e., when the observed power exponent is slightly larger than 3), one can use an approximation:
K ( 4 ) = 1 4 π σ 2 σ nc σ mn 2 1 Δ τ f ( h ν ) 2 w 0 4 [ 1 10 Γ 4 ( η ) ( P P s ) 2 1 4 Γ 3 ( η ) ( P P s ) + 1 3 Γ 2 ( η )   ] P .

2.2. Multiphoton Bleaching of mCherry in E. coli Colonies

We first measure the relative corrected 2PE spectrum of mCherry in E. coli cells from the same colony that we use in bleaching experiments and compare it to the spectrum previously observed in buffer solution [11]. Both spectra are shown in Figure 2 (top), with the spectrum in E. coli normalized to the 2PA cross section of mCherry in solution at 760 nm. The two spectra overlap quite well, confirming that the E. coli colony does express mCherry. The first electronic transition (S0 → S1) occurs at 1000–1200 nm, and the higher-energy and stronger electronic transition (S0 → Sm) emerges at wavelengths shorter than 800 nm.
Next, we measured the power dependences of the bleaching rates of mCherry expressed in E. coli cells in a broad range of powers and at several wavelengths across the 2PA spectrum. The bleaching wavelengths correspond to the positions of asterisks in the bottom panel of Figure 2. They fall in both the S0 → S1 and S0 → Sm absorption bands. Figure 3 shows an example of the six fluorescence decay curves obtained at 800 nm upon bleaching at six different points within one colony with different laser powers P. For two of them, corresponding to P = 37 and 70 mW, we show here the linear fits of the initial decay stage (dashed lines). The K values were determined as the negative slopes of these lines (cf. Equation (4)). A very sharp increase of the decay rate is observed with the increase of intensity.
Figure 4 shows the series of power dependences of the rate K obtained at different excitation wavelengths. We observe several interesting trends.
(1)
For each wavelength, there is a range of power values where the bleaching rate depends quadratically on power. Although this behavior is natural and reflects the fundamental bleaching limit corresponding to photochemical reaction starting just after absorption of two photons, to the best of our knowledge there are no publications where quadratic law was shown for any FP. After reaching a certain threshold, the dependence switches to super-quadratic, with α = 3.3–3.6. Note that previously the bleaching of mCherry was measured at 790 nm at similar excitation conditions (same objective lens, similar colony thickness and pulse duration) with the laser power of 40–150 mW [28], and the K~P3.4 dependence was observed. As one can see from Figure 4, these power levels were higher than the threshold (at 780–800 nm) and therefore the quadratic part was missed there.
(2)
The power threshold P* for the super-quadratic transition is observed for wavelengths 760–800 nm, and it shifts to lower power values as the wavelengths becomes shorter.
(3)
We did not observe a transition from quadratic to super quadratic dependence for wavelengths of 1100 (black squares) and 1000 nm (data not shown), at least for highest available power levels. Given the vertical electron detachment energy of mCherry is 5.52 eV [28], one can predict that the absorption of four photons with energy less than 1.57 eV (>900 nm) would not suffice to photodetach an electron. As a result, we would not anticipate the transition from P2 to P3.5 dependence for wavelengths longer than 900 nm. This imposes a critical wavelength for two-photon excitation of mCherry, λ = 900 nm, suggesting that using the lowest, S0 → S1 transition at 1000–1100 nm should result in slower (quadratic) multiphoton bleaching even at high powers.
To analyze the quadratic segments of the power dependences at different wavelengths (Figure 4), we plot the data obtained in the low power regime in the K vs. P2 coordinates and fit them to the straight line to obtain the slope that, according to (5), is
a 2 = 1 π 2 σ 2 φ 1 Γ 3 ( η ) Δ τ f ( h ν ) 2 w 0 4
(Supplementary Figures S2–S6). Knowing all of the laser parameters (Methods) and the 2PA cross sections for mCherry [11], we calculate the photochemical quantum yields φ1,m from the factor a2, see Table 1 and Figure 2, bottom.
Interestingly, upon excitation at 1100 nm, the photochemical quantum yield, φ1 = (1.6 ± 0.3) × 10−5, is within experimental error equal to the value previously obtained for mCherry in buffer solution using one-photon excitation (at 532 nm), φ1 = 1.3 × 10⁻⁵ [36]. Several important conclusions stem from this result: (1) Our physical model of multiphoton bleaching in thin films catches correctly the main factors. (2) Multiphoton bleaching rate (at least at low intensities) does not depend on local environment of an FP molecule, i.e., buffer vs. E. coli cell (cf. [28]). (3) The Kasha’s rule holds at long-wavelength excitation (i.e., the photochemical rate is the same for the excitation accomplished either with one or two photons).
However, in the shorter wavelengths region, 760–1000 nm, the quantum yield φm is ~five to six-fold larger, but does not depend on wavelength. Such violation of Kasha’s rule can be due to lowering of a potential barrier for photochemical reaction when the chromophore gains larger electronic/vibrational energy in the excited state, as discussed in Section 2.1, see Figure 1b. Similar effect was observed for DsRed protein in [37].
With the increasing laser intensity, the dependences in Figure 4 measured at 760, 780, and 800 nm start to grow faster than quadratic, with the power exponent between 3 and 4. When we subtract the K(2) = a2P2 term (with the a2 found above) from the observed K(P) dependence, we find that in a certain power range, where P is higher than the threshold, P*, but still is not saturated, the dependence is well described by a 4-th power law: K(4) = K-a2P2 = a4P4. The plot of K(4) vs. P4 (Supplementary Figures S7–S9) presents a straight line with the slope a4 that, according to Equation (9), reads
a 4 = 4 9 π 4 σ 2 σ mn σ nc Γ 5 ( η ) Δ τ f 3 ( h ν ) 4 w 0 8
After substitution of all the laser and geometric parameters, we find a product of two cross sections, σmnσnc, corresponding to two consecutive steps, see Table 1. This value strongly depends on wavelength, increasing by an order of magnitude upon tuning the laser from 800 to 760 nm.
Once the molecular parameters σmnσnc and φm are known, one can predict the P* value if the geometry of the sample illumination and laser parameters (beam waist at the sample, pulse repetition rate, and wavelength) are known. These estimations can provide useful guidelines for researchers aiming to avoid super-quadratic photobleaching. For example, if the multiphoton process at P > P* involves four-photon induced reaction, then equating right hand sides of Equations (5) and (9) gives:
P * = 3 π 2 φ m σ mn σ nc Γ 3 Γ 5 f   h ν   w 0 2 .
Using Equation (13), we calculated the predicted threshold power for mCherry for our specific experimental conditions. The results are shown in Table 2 together the with P* values estimated from the “bending” points of the power dependences of Figure 4. The predicted and observed P* values correlate well. This validates our estimation of the laser and sample parameters w0 and Γ35 entering Equation (13). As one can see, the main factor responsible for the reduction of P* at shorter wavelength is the increase of the σmnσnc value.
At even higher laser powers, the K(P) starts to saturate (i.e., becomes slower than the 4-th power). Fitting the power dependence in this region with the model Function (10) (Supplementary Figure S10) makes it possible to find individual values of the σmn and σnc cross sections, see Table 1.
Knowing these values, we can now compare the bleaching rates of mCherry in two very different experimental settings. (1) A high repetition rate (80 MHz) laser with relatively low pulse energy is focused to a few microns spot onto a thin film of live E. coli colony expressing mCherry; and (2) a low repetition rate (1 kHz) regenerative amplifier laser beam with very high pulse energy and uniform power density across the 3 mm diameter passes through a buffer solution of purified mCherry. For the case (2), mCherry bleaches at an initial rate of k1 = 2.8 × 10⁻³ s−1 when the laser intensity is 11.4 W/cm2 [28]. It is interesting to check if, by taking the molecular parameters obtained here for bleaching in setting (1), we still would be able to reproduce the rate found in solution with an amplifier setup. The rate k1 for the homogeneous distribution of power (i.e., without spatial averaging), but with possible saturation (Figure 1d), reads [28]:
k 1 ( 4 ) = 1 32 σ 2 σ nc σ mn 3 f Δ τ [ 1 2 X 3 X 2 + X X e X ] ,
where X = P/Ps and Ps is defined by Equation (8). We find that with a given intensity of an amplifier system (11.4 W/cm2) and molecular cross sections taken from Table 1 at 780 nm, saturation parameter is X = 4.5, and the resulting k1 = (2.9 ± 0.9) × 10−3 s−1, that is virtually the same as measured directly in [28]. This result demonstrates once again that the multiphoton bleaching rate does not depend on local environment of mCherry (E. coli cell or buffer). It is also not sensitive to the laser repetition rate even at high laser intensities (i.e., in super-quadratic regime).

2.3. Multiphoton Bleaching of mPlum in E. coli Colonies

Figure 5 shows the dependence of photobleaching rate on power for mPlum at 790 nm. Similar to mCherry, it shows a “bending” from the ~P2 to ~P4 law occurring at P* = 45 mW (I0* = 5.2 × 1028 photon/cm2/s). It has been previously shown that mPlum, similarly to mCherry, bleaches at this wavelength and at P = 40–150 mW as a result of four-photon induced electron detachment [28]. The vertical photodetachment energy (5.61 eV) requires photons with λ < 880 nm to initiate the process.
However, the quadratic part has not been observed before [28] because of the used laser powers were above the threshold. We applied the same approach as above to obtain bleaching parameters for both the quadratic and fourth-power regimes (Supplementary Figures S11 and S12). The quantum yield of the two-photon induced reaction is φm = (1.3 ± 0.2) × 10−4 (i.e., of the same order as for mCherry in this spectral region). The product of the two consecutive processes cross sections is, σmnσnc = (1.6 ± 0.2) × 10−35 cm4, that is also close to the value obtained for mCherry at 780 nm.

2.4. Multiphoton Bleaching of jREX-GECO1 in E. coli Colonies

JREX-GECO1 is a new red genetically encoded Ca2+ indicator, described in [35]. In a Ca2+-free state, its deprotonated chromophore is weakly fluorescent. Upon binding Ca2+, the chromophore becomes protonated and acquires strong fluorescence with a large Stokes shift. It was interesting to see in what state it is present in E. coli cells and characterize its multiphoton bleaching properties.
Figure 6 shows that the 2PE spectrum of jREX-GECO1 in E. coli cells (circles) closely follows the spectrum of the Ca2+-bound state in solution (purple line). This result suggests that in E. coli bacteria there is enough Ca2+ to saturate the sensor.
The nature of the broad 2PE band peaking at ~920 nm is not completely understood, but it looks similar to that observed in the one-photon absorption spectrum, peaking at ~490 nm [35]. It is assumed that it mainly belongs to a neutral chromophore. However, unusually broad wing at 1000–1100 nm suggests that the whole band could contain two or more hidden electronic transitions [35].
The power dependences of photobleaching rates are very different as compared to mCherry and mPlum. For the wavelengths longer than 925 nm, they are quadratic in the range of ~10–70 mW, see Figure 7a. At P > 70 mW, they start growing faster, but we were not able to determine a power exponent for this region because of insufficient range of available powers.
From the quadratic segments of power dependences, we obtained photochemical quantum yields φ1 by using the same procedure as in Section 2.2 (see Supplementary Figures S13–S15 for the fits). The results show that the quantum yield at 1100 nm is higher than that at 950–1000 nm by a factor of ~4, Table 3. This can be due to a presence of a small fraction of anionic chromophore dominating the absorption at 1100 nm, and bleaching faster than the neutral form (that mainly absorbs at 950–1000 nm).
Upon passing to a shorter wavelength range, a sharp threshold near λ* ≈ 950 nm is observed where the quadratic dependence switches to super-quadratic, see Figure 6, bottom, and Figure 7b. In contrast to mFruits (mCherry and mPlum) where the power exponent is larger than 3 in this spectral region, in jREX-GECO1 it is equal or less than 3. Therefore, we assume that the reaction requires only three photons, not four, and proceeds through a bound electronic state without reaching photodetachment continuum boundary. The wavelength threshold at 950 nm is probably related to a specific resonance where the photon energy becomes sufficient for excitation of this bound state via the S1 → Sn transition. We believe that the photobleaching mechanism in jREX-GECO1 is different from that in mFruits because the chromophore in the former is neutral (protonated) compared to anionic (deprotonated) one in mFruits. The protonation of chromophore in jREX-GECO1 is facilitated by the substitution of neutral amino acid residue at position 163 (Gln in mCherry or Met in mPlum) with negative Glu (see Supplementary Figure S37 and Table S2) that supposedly comes to a close contact with the chromophore phenolate oxygen in Ca2+-bound state. Since the electron detachment energy is much higher for the protonated chromophore than for the deprotonated one, because of strong electrostatic interaction between the electron and remaining molecular frame in the former, the four-photon detachment becomes forbidden there by energy conservation.
The power dependences at 780–925 nm, plotted as K vs. P3, were fitted to Equation (6) (Supplementary Figures S16–S18) to obtain the parameter σmnφn from the slope:
a 3 = 4 5 π 3 σ 2 σ mn φ n Γ 4 ( η ) Δ τ f 2 ( h ν ) 3 w 0 6
The values of σmnφn do not change systematically with the wavelength and fall in the range (0.8–2.0) × 10−20 cm2. The power dependence at 760 nm is slightly saturated, K~P2.7 (if the whole range is used for fitting). This makes it possible to obtain parameters σmn and φn separately, see Table 3, by using fitting Function (7), (Supplementary Figure S19). The 760 nm excitation corresponds to a different transition (S0 → Sm), compared to the one at 780–925 nm (S0 → S1), see Figure 6, and that can probably explain why the value of σmnφn is higher at 760 nm than the corresponding average value in the 780–925 region.

2.5. Multiphoton Bleaching of tdTomato in E. coli Colonies

The 2PE spectral shape of tdTomato in E. coli cells overlaps with that previously measured in purified solution at pH8 [11], Figure 8, top, suggesting the expression of this protein in the cells.
Compared to other proteins, tdTomato shows the most diverse and unexpected multiphoton bleaching behavior. When excited at the long-wavelength side of the S0 → S1 transition at 1100 nm, the power dependence follows a ~P4 law even at low power levels without any observable P2P4 transition, Figure 9a, black squares. This behavior is very different from mCherry, where the rate followed the quadratic law at 1100 nm in the same range of powers and the P4 dependence emerged only for the wavelengths ≤800 nm. This observation suggests that the four-photon electron detachment energy lies much lower in tdTomato than in mCherry. We estimate the VDE < 4 = 4.5 eV (for = 1.13 eV, corresponding to 1100 nm) for tdTomato vs. VDE = 5.5 eV in mCherry. Physically a decrease in VDE can mean that the electrostatic environment of the chromophore in tdTomato is less electro-positive than in mCherry. The main differences in electrostatic environment of the chromophore in RFPs are due to the charges of residues of amino acids 83, 163, and 215 and their distances from the chromophore [28] (Supplementary Figure S37 and Table S2). In mCherry, residues L83 and E215 are both neutral (E215 is protonated [38] at pH7), and in tdTomato K83 is positive and E215 is negative (deprotonated, according to our alkaline titration experiment, not shown). Although the total charge of the two residues is zero in both proteins, the negative charge of E215 in tdTomato is much closer to the chromophore than the positive charge of K83 (Table S2), which makes the environment of tdTomaato less positive than mCherry. Plotting of K vs. P4 (Supplementary Figure S20) makes it possible to find the value of the product σmnσnc at this wavelength, see Table 4.
At shorter wavelengths, 970–1000 nm, the photobleaching rate changes very dramatically as a function of power, see Figure 9a for 1000 nm data (magenta pentagons) and Supplementary Figure S21 for 970 nm data. First, at P = 10–40 mW the dependence is quadratic (Supplementary Figure S22), with the quantum yields of the reaction starting from S1 state similar to those of mCherry (φ1 ~10−5), see Table 4.
As the laser power exceeds P* = 45 mW (I0 * = 6.5 × 1028 photon/cm2/s), the dependence suddenly becomes extremely sharp, following the power law with the exponent α = 8 ± 1. To the best of our knowledge, the photobleaching with the involvement of such a high number of photons has not been observed for any organic molecule. Interestingly, the initial (unbleached) fluorescence signal follows a perfect quadratic dependence, Supplementary Figure S23. This suggests that other spurious processes, like harmonic or white continuum generation, can be excluded and most probably the observed kinetics are due to photochemical reaction. When the power reaches ~60 mW, the dependence quickly saturates and becomes either quadratic or slightly super-quadratic, (α ≈ 2.3 ± 0.3). This suggests that all the electronic transitions involved in the ladder-type excitation saturate, including the last one that leads to ionization.
An intriguing question of why the four-photon electron detachment observed at longer wavelengths (1100 nm) turns to a much higher-order process at shorter wavelengths remains open and deserves further investigation. We can only speculate that in tdTomato the chromophore can co-exist in the anionic and neutral forms. The anionic form has the 2PE maximum at ~1050–1100 nm and bleaches according to a K~P4 law. The neutral chromophore, with the 2PE at 900–1000 nm (corresponding to a shoulder at 950 nm in Figure 8, top), bleaches according to a K~P8 law. The RFP chromophore in its protonated (neutral) form has much larger vacuum electron detachment energy compared to deprotonated (anionic) form, VDE = 7.64 vs. 3.27 eV, respectively [39]. The first value translates into the number of photons n = VDE/ = 6.2, with = 1.24 eV for the 1000 nm photon. This suggests that at least seven photons are needed to ionize the RFP chromophore in vacuum, close to our observation. Slightly positive chromophore surrounding in tdTomato, that electrostatically interacts with the positive molecular frame left after ionization, can further increase the VDE, and consequently n. We estimate that an electrostatic energy of ~1.2 eV would be enough to make n = 8.
At shorter wavelengths, 760–820 nm, the power dependence reflects the n = 4 process with moderate (α = 3.5 at 780 nm) or strong (α = 3.0 at 760 nm) saturation. At these wavelengths, the anionic specie probably dominates in the 2PA spectrum. The corresponding values for the σmn and σnc cross sections are obtained (Supplementary Figures S24–S26) and presented in Table 4. At an intermediate wavelength of 860 nm, we observe the power exponent α ≈ 5, which possibly reflects a competition between the bleaching of anionic and neutral chromophore species. The dependence of α on wavelength, Figure 8 bottom, shows a resonance at 950–1000 nm, probably depicting the position of neutral chromophore 2PA maximum. It is interesting that a recent paper [40] found that the neutral chromophore of tdTomato has a one-photon absorption peak in the same spectral region, at ~480 nm. However, it is not clear yet to what extent the neutral specie can contribute to the 2PE spectrum.

3. Discussion

Our results show that even within a set of red FPs with the same chemical structure of the chromophore, the mechanisms of multiphoton bleaching are quite different. This includes different numbers of photons involved in the process and different power dependences observed at various excitation wavelengths even for a particular protein. Nevertheless, we try to compare here the performance of one protein at different wavelengths or different proteins at similar wavelength using a specific “figure of merit” (FOM) that reflects the maximum possible number of fluorescence photons collected from an FP during a given pixel dwell time in a TPLM experiment. The FOM parameter involves the molecular fluorescence brightness and photobleaching parameters (see Supplementary Information for derivation of equations). In the case of quadratic power dependence of photobleaching rate, the FOM is equal to the ratio of fluorescence quantum yield and photochemical reaction quantum yield starting either from state 1 or m (see Figure 1a,b):
FOM ( 2 ) = φ F φ 1 , m .
For the third-order process without saturation, Figure 1c, the FOM reads
FOM ( 3 ) = φ F σ 2 1 / 3 ( σ mn φ n ) 2 / 3 .
In the fourth-order process without saturation, we have
FOM ( 4 ) = φ F σ 2 1 / 2 ( σ mn σ nc ) 1 / 2 .
Using these equations, we estimated the FOM values of the fourth-order process observed experimentally for mCherry, mPlum, and tdTomato at several wavelengths, see Table 5. It should be kept in mind that the comparison between different wavelengths and different proteins using these numbers is possible only for the same laser peak photon flux and the same mechanism of the process.
For the S0 → Sm transition, excitation of mCherry at 800 nm is slightly beneficial, compared to 780 nm, because of smaller σmnσnc parameter for the former. At 790 nm, mPlum shows about two-times smaller FOM (4) compared to mCherry because of proportionally smaller fluorescence quantum yield. tdTomato has the FOM (4) similar to mCherry at 780–820 nm, but much larger at 1100 nm. This strong enhancement is due to much higher 2PA cross section of tdTomato compared to mCherry at this wavelength.
Table 6 presents the FOM (2) values obtained for the RFPs under study in the power ranges where the bleaching rate follows quadratic power dependence.
In this regime, mCherry has much higher FOM (2) at 1100 nm than at 760–1000 nm. This is explained by much lower φ1 for the reaction starting from the S1 level relatively to Sm level. Compared to mCherry, mPlum shows lower FOM (2) at 790 nm, and jREX-GECO1—higher at 950–1000 nm. Excitation of tdTomato with low powers at 970–1000 nm (Figure 9a), provides extremely large relative FOM (2) values thanks to high fluorescence quantum yield and relatively low photobleaching yield.
In summary, we developed a method of quantitative characterization of multiphoton bleaching of FPs expressed in E. coli colonies that one can use to compare bleaching rates of different mutants in standardized experimental conditions. Our physical model proposed in [28] and further developed here, makes it possible to obtain key molecular parameters involved in photobleaching process. Knowing laser parameters, such as wavelength, pulse duration and peak photon flux in focal plane in addition to molecular bleaching parameters, makes it possible to predict the bleaching rate in a specific experiment. In addition to quantitative estimations of FOM provided above, we can further suggest some general, qualitative, approaches to reduce the bleaching rates. We have shown here, for a first time to the best of our knowledge, that there is often a range of laser photon fluxes where the power dependence of bleaching follows quadratic law. After a critical threshold, P = P*, is passed, the dependence turns to a much faster, super-quadratic one that was observed in several previous studies. We suggest that in the TPLM experiments the working laser intensity should be selected close to this threshold to provide the best SBR. We also found that, in agreement with previous observations [20,21,22], it is more advantageous (in terms of brightness/photobleaching ratio) to excite RFPs at their longer wavelength transition, S0 → S
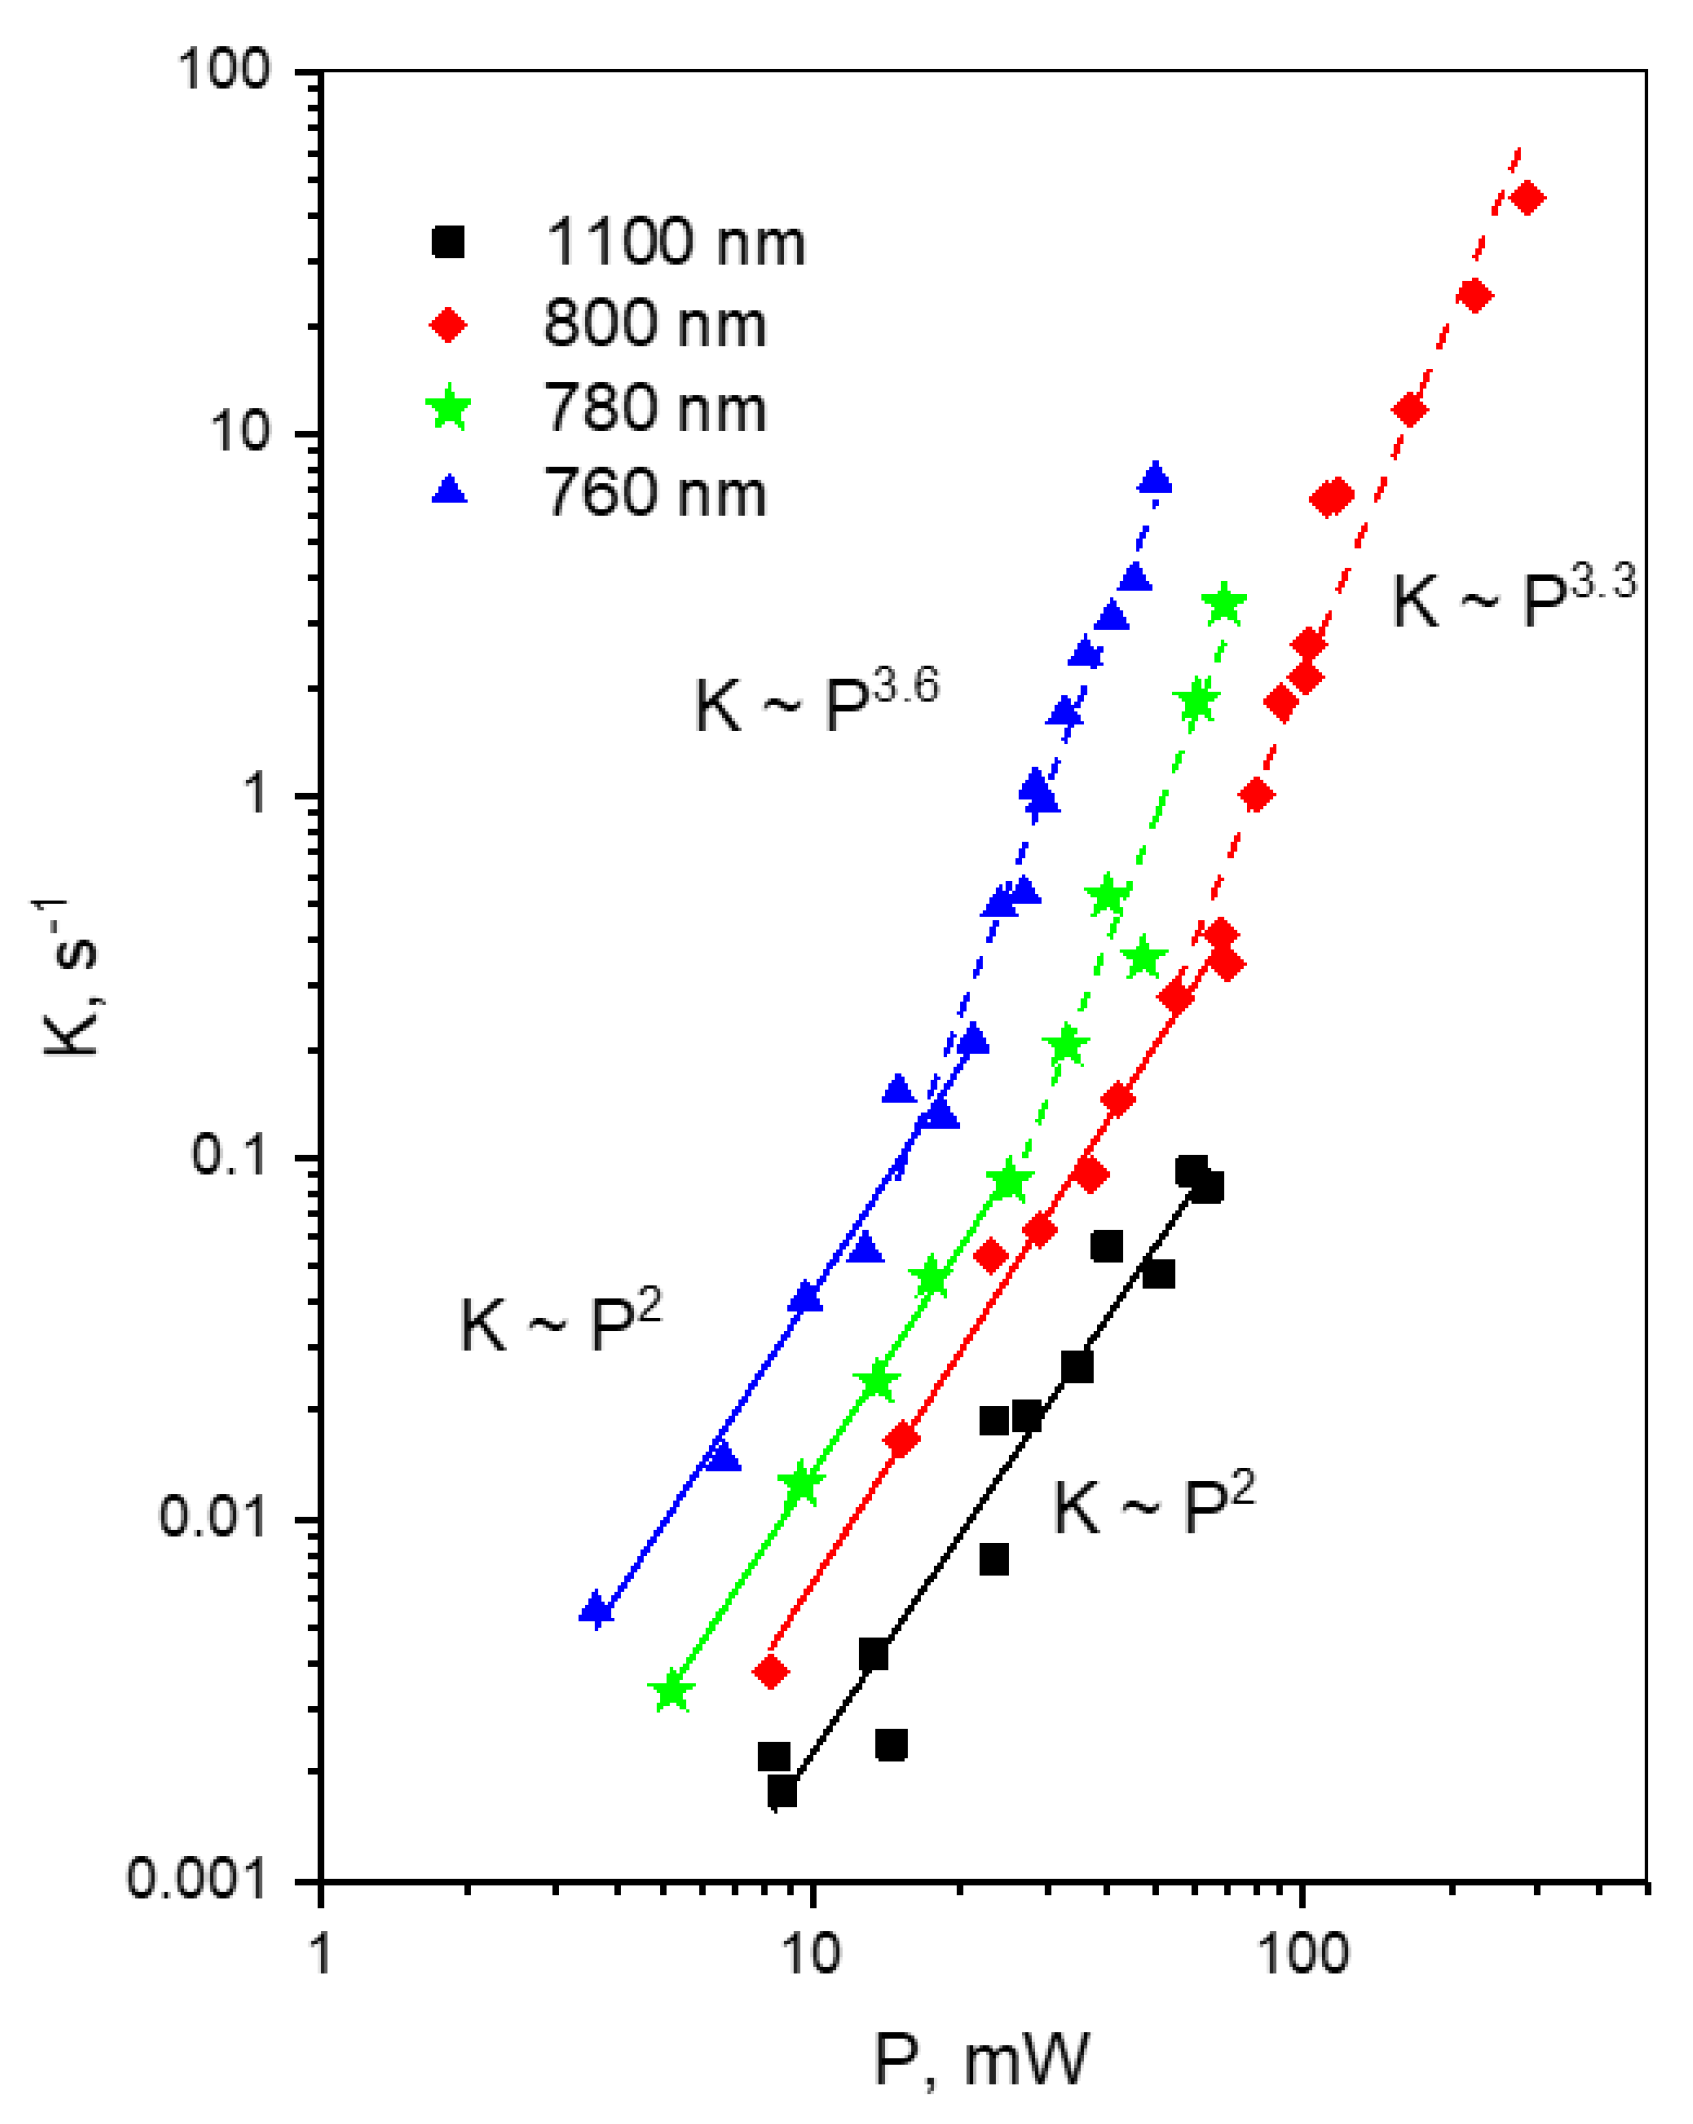
1 (near 1050–1100 nm). In particular, in the case of mCherry, excitation at 1100 nm does not activate a detrimental four-photon electron photodetachment process, and the power dependence follows a quadratic law where any increase in laser intensity provides better SBR ratio, but does not change the brightness/photobleaching rate ratio. At shorter wavelengths, corresponding to a higher, S0 → Sm transition (760–800 nm), there exists a laser intensity threshold, specific for each wavelength, where the power dependence switches from quadratic to much faster law, corresponding to four-photon process. Such switching was also observed for mPlum.
For the new, red genetically-encoded Ca2+-sensor, jREX-GECO1, with a long Stokes shift in the Ca2+-bound state, we observe slow photobleaching, following quadratic power law in a broad spectral region from 950–1100 nm. At shorter wavelengths, λ < 950 nm, the bleaching rate starts to grow faster, i.e., according to a third power law. Therefore, excitation at these wavelengths should be avoided.
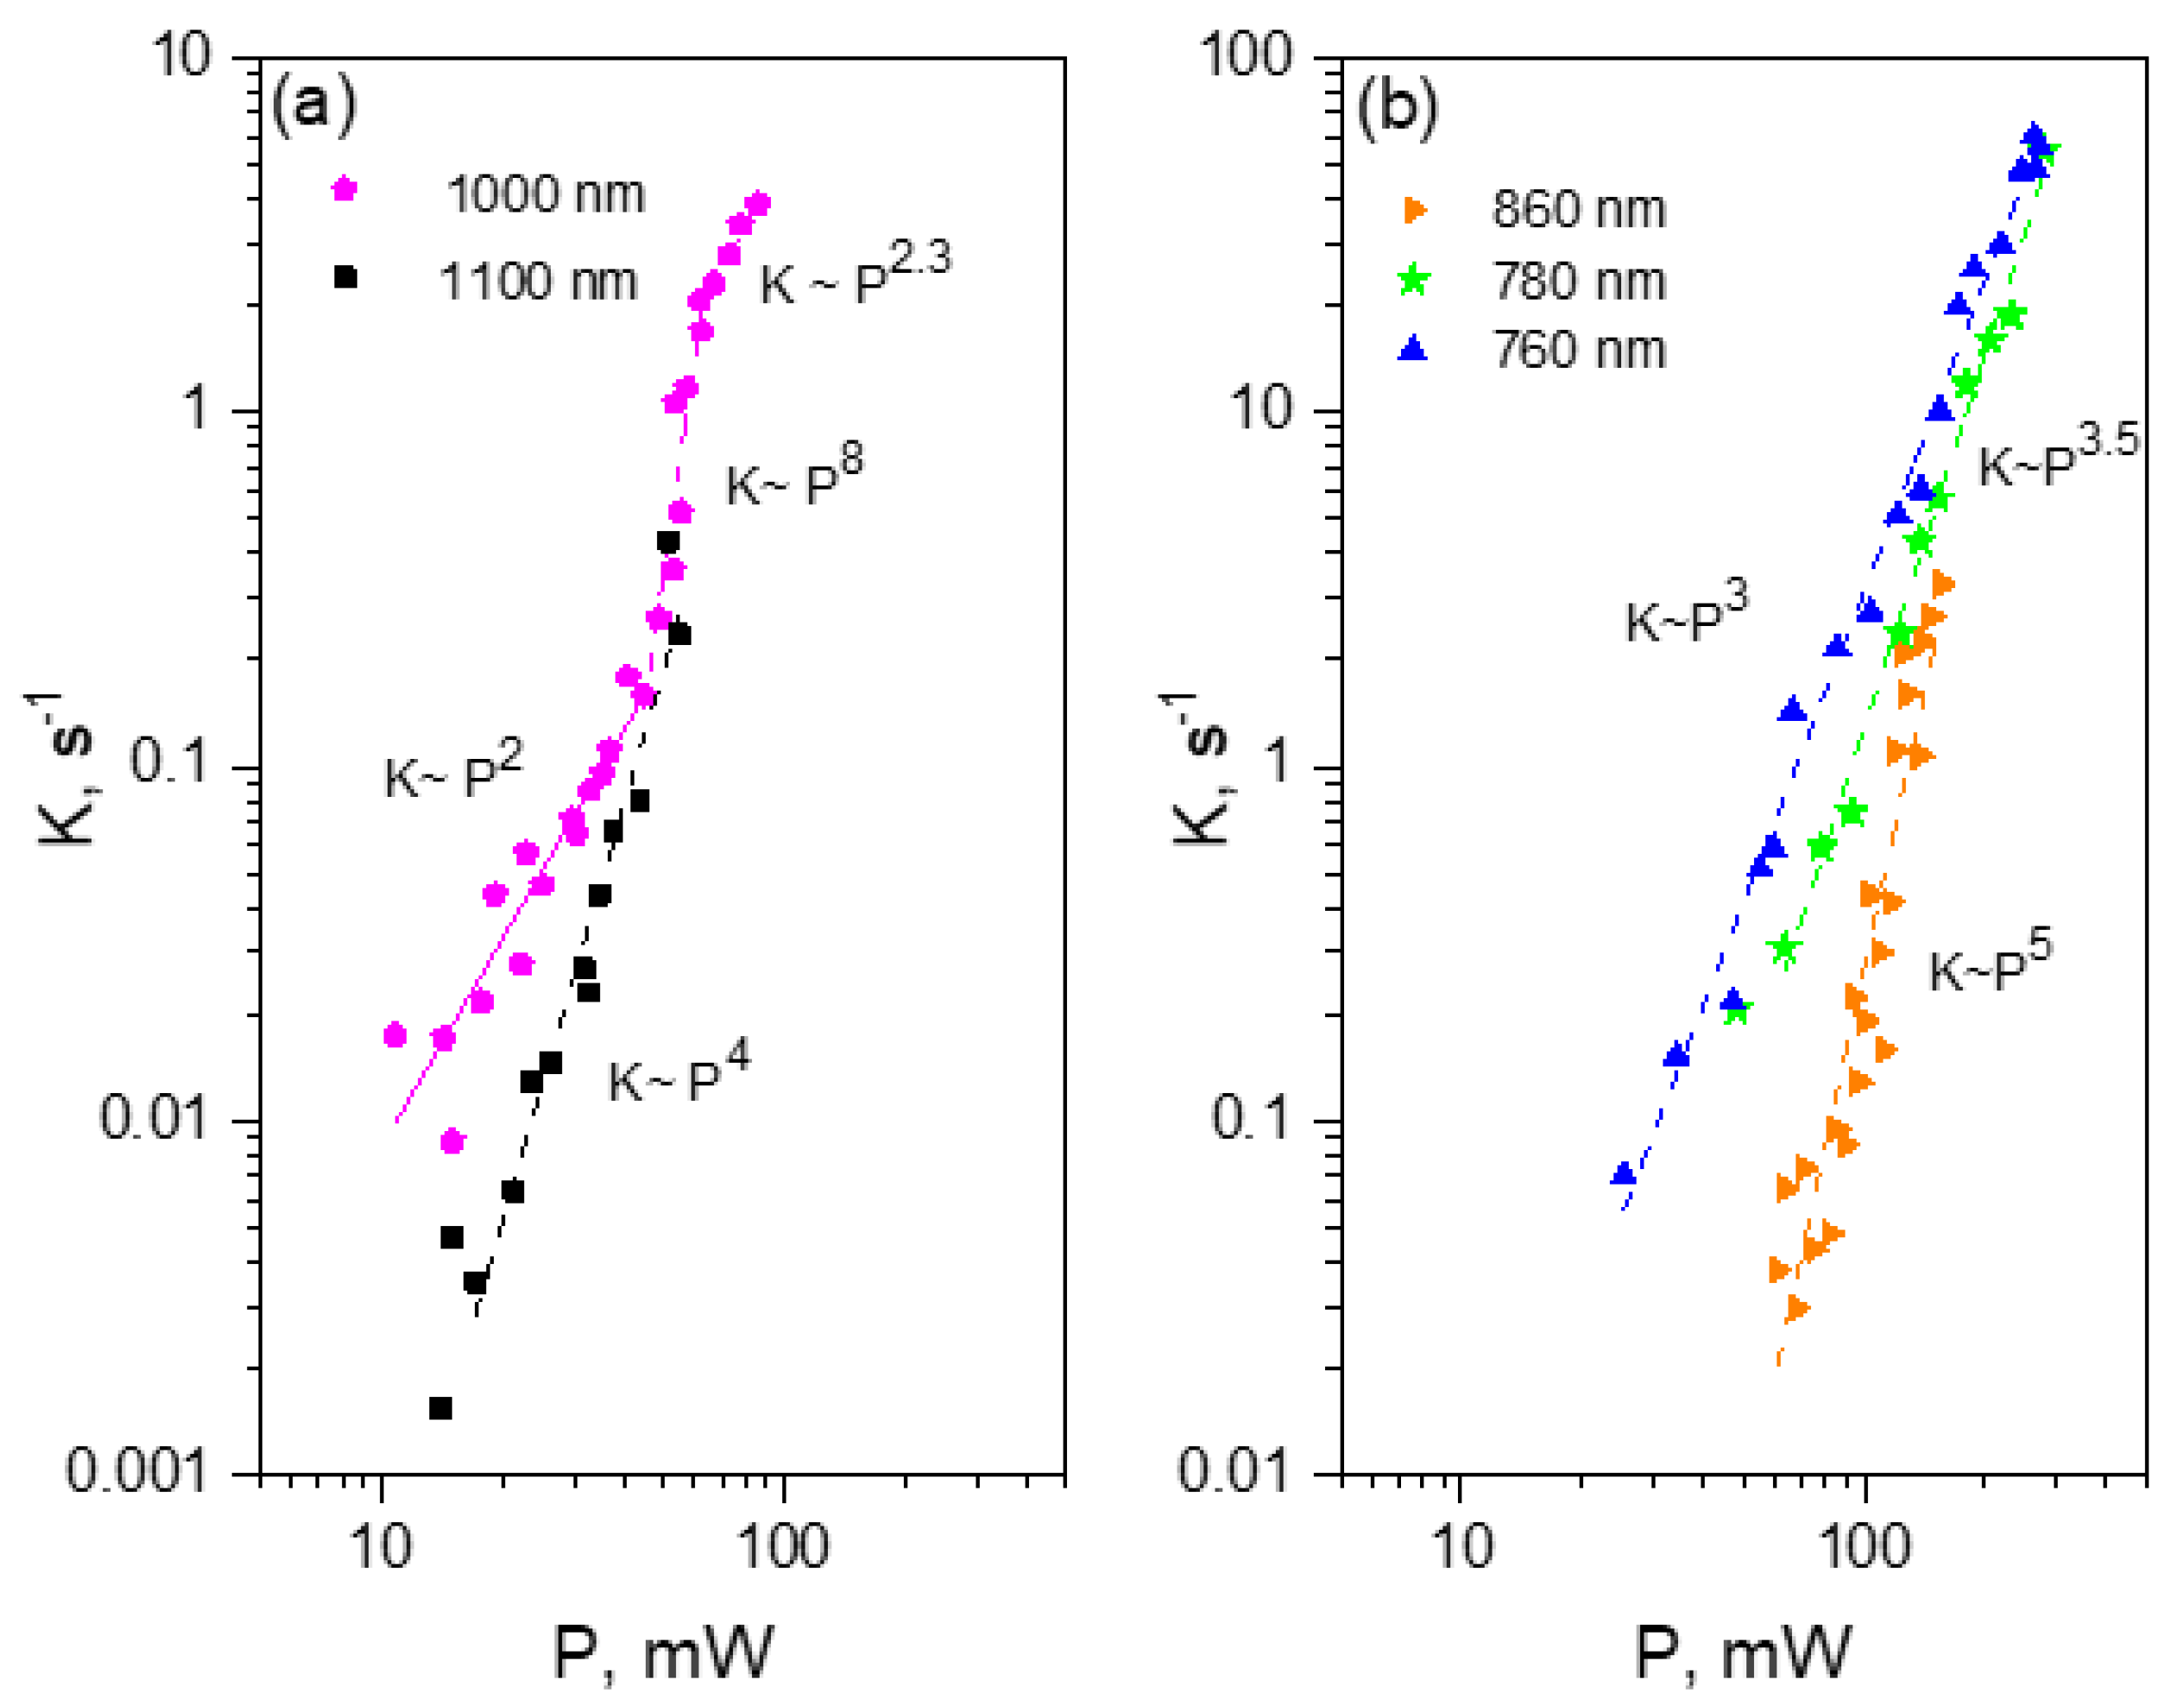
One of the brightest under two-photon excitation red FP, tdTomato, shows unexpected power dependences of the bleaching rate at some particular wavelengths. At the longest wavelength studied, λ = 1100 nm, the bleaching follows a K~P4 dependence, reflecting four-photon process. At 970–1000 nm, the dependence starts as quadratic, and then after passing some critical power, becomes very sharp, following the K~P8 law. At even higher powers, it quickly saturates to become close to quadratic again. At shorter wavelength region, 760–820 nm, the power dependence follows the K~P4 law with some signs of saturation, typical for mCherry and mPlum. We tentatively explain these observations by a presence of two forms of the chromophore in tdTomato, with the neutral form dominating in the region of 950–1000 nm.

4. Materials and Methods

In this work, we studied multiphoton bleaching of RFPs expressed in E. coli cells. The cells make colonies on the surface of agar in a square Petri dish. Typically, a colony measures ~1 mm in diameter and ~0.2 mm in thickness. The rod-shaped E. coli cell is ~2 μm long with a diameter of <1 μm.

4.1. Expressing RFPs in E. coli Colonies

His-tagged RFPs were expressed in DH10B E. coli cells with bacterial expression plasmids encoding each protein. mCherry was encoded on the pNCS vector, which contains a promoter for constitutive expression. tdTomato, mPlum, and jREX-GECO1 were encoded on pBAD. tdTomato-pBAD was a gift from Michael Davidson and Nathan Shaner and Roger Tsien (Addgene plasmid # 54856; http://n2t.net/addgene:54856 (accessed on 23 December 2021); RRID:Addgene_54856), mPlum-pBAD was a gift from Michael Davidson and Roger Tsien (Addgene plasmid # 54564; http://n2t.net/addgene:54564 (accessed on 23 December 2021); RRID:Addgene_54564). jREX-GECO1 was grown into a modified pBAD backbone pTorPE with restriction cloning. jpTorPE-jREX-GECO1 was a gift from Robert Campbell and Thomas Hughes (Addgene plasmid # 113941; http://n2t.net/addgene:113941 (accessed on 23 December 2021); RRID:Addgene_113941). E. coli expressing an RFP were cultured in Terrific Broth (BD, Sparks, MD, USA) for 18 h at 37°. To induce expression of the pBAD plasmids, 0.1% w/v of L-arabinose was added to the media before inoculating.

4.2. Preparing Plates with E. coli Colonies

Square 10 × 10 cm Petri dishes (Simport, Beloeil, QC, Canada) were filled with 80 mL of LB agar at 50 °C with the appropriate antibiotic and, in the case of pBAD vector expression, 0.02% w/v of L-arabinose added. The plates were set on a horizontal surface for 20 min. Transformed E. coli suspension was diluted 1:10, 1:100, and 1:1000 times with Terrific Broth and were spread onto the plate using 3 mm glass beads (Fisher Scientific, Walthman, MA, USA), and then the plates were incubated for 20 h at 37 °C. After incubation, the plates with colonies were put in refrigerator at 4 °C for 2 days. After 2 days, the colonies acquired a color and fluorescence corresponding to a mature RFP chromophore and were ready for optical experiments. The plates with E. coli colonies could be stored at 4 °C for a few months without losing the ability to fluoresce.

4.3. Optical Instrument

The customized optical instrument, called the GIZMO, was previously designed and implemented for screening of large libraries of FP mutants for their two-photon brightness. It was described in detail in [41]. Its complete CAD model as well as software and analysis programs can be found at github.com/rosanamolina/gizmo-paper (accessed on 23 December 2021). Here we used this instrument to characterize multiphoton bleaching parameters of a particular FP expressed in several colonies on the same plate. Briefly, the GIZMO consists of two optical arms used for one- and two-photon excitation, respectively. The micrometer stage can move the sample (a Petri dish) between the two arms. While in the one-photon arm, a brief illumination of the dish with an LED array provides fluorescence of individual colonies, captured with a CCD camera. The x and y coordinates of each colony are then accurately represented in the image. The two-photon arm is a variant of two-photon laser scanning microscope. A femtosecond laser (Insight DeepSee, Spectra-Physics, Milpitas, CA, USA) beam first gets attenuated with a computer-controlled Pockels cell, then passing through two galvo mirrors, a scan lens, and a tube lens, hits the objective lens mounted on a piezo stage allowing to scan the focal spot of a laser in z-direction with a range of 400 μm. The image obtained at the one-photon arm is used to bring a particular colony into the laser focus, using the xy movement of the stage. The fluorescence is collected by the same objective and directed through a reflecting dichroic mirror and a combination of a 570–680 nm band pass and a 745 nm short pass filters to PMT.

4.4. Photobleaching Experiments

The customized photobleaching program (written in MATLAB) makes it possible to run photobleaching kinetics consecutively at six different spots (x,y,z) inside one colony. We first selected a bright colony on the plate by using an image acquired in the one-photon arm, then in the two-photon arm moved the stage in the x and y directions, such that the center of this colony came to the laser beam axis. Next, we adjusted the z position of the stage to get the strongest fluorescence signal. The photobleaching program calculated the coordinates (x,y) of six points arranged in the apices of a hexagon with the diameter of 80 μm around the initial point. At each point, the program found an optimum z position (with maximum fluorescence signal) and then at this position recorded the fluorescence decay curve with a particular, program-controlled (with Pockels cell) laser power, and then moved sequentially to the next spots where it recorded the decay at different power levels. In most of the cases we used 10 s for a dwell time per point, but for some slow kinetics, 30 s. Typically, the binning of 100 data points (with averaging) was used to get totally 25,000 points per 10 s of scan. The program runs on top of a legacy version of ScanImage (Vidrio Technologies, Ashburn, VA, USA). In these bleaching experiments we used a low numerical aperture objective lens, Plan-Neofluar 2.5 ×/0.075 (Carl Zeiss, White Plains, NY, USA). A low NA value helps to keep the laser waist diameter in focus (7–11 μm), much larger than the size of an E. coli cell (0.5–2 μm). Homogeneous irradiation of a cell allows disregarding of diffusion artifacts in quantitative description of bleaching kinetics. This particular lens has a good transmittance in NIR and its low NA causes less group velocity dispersion (GVD) [42].

4.5. Characterizing Laser Beam Parameters in Focal Area

The laser waist w in focal area was measured with the razor blade method. The razor was fixed onto a GIZMO micron stage and the power meter was mounted underneath. The stage was moved in x direction at a fixed z position. The resulting dependence of power on x was fit to a function
P ( x ) = A x exp ( 2 ( t x c ) 2 w 2 ) d t .
This scan was performed at several positions of z, and the resulting dependence of w on z was plotted and fit to a function
w ( z ) = w 0 1 + ( λ ( z z 0 ) π w 0 2 ) 2
The best-fit parameters z0 and w0 provide the focal plane position and the beam waist radius at focal plane, respectively. This procedure was repeated for several laser wavelengths, and the dependence of w0 on wavelength is shown in Supplementary Figure S27. The resulting waist parameter w0 varies between 3.5 and 5.5 μm. The Rayleigh length, z R = π w 0 2 / λ , was calculated and plotted as a function of λ, see Supplementary Figure S28. The focal spot size (w0) is a critical parameter in calculating multiphoton bleaching cross sections and quantum yields. The razor blade method used here could give a distorted w0 value because of diffraction effects if the beam size on the back aperture of objective lens is not very small [43]. Therefore, we developed and employed an independent method of direct evaluation of zR and w0 in E. coli colonies, Section 4.6.
The pulse duration at 1100 nm was estimated as the transform-limited value for the Gaussian pulse shape. Using spectral widths measurements (Ocean Optics spectrometer, Ocean Insight, Rochester, NY, USA) of the laser output from 850 to 1000 nm, we obtained an almost constant value of pulse duration, ∆τ = (109 ± 1) fs. We assume that the pulse duration after the beam expander and objective lens in our optical system does not acquire any GVD broadening at 1100 nm [42] and, therefore, is equal to 109 fs. To evaluate the relative pulse duration ∆τ as a function of wavelength at the sample positions, we measured the two-photon excited fluorescence signal from a solution of Rhodamine 6G in methanol, cf. [23]. The solution, contained in a 1 mm thick optical cuvette, was placed in the focus of the objective lens and the power P was kept constant when going from one wavelength to another. In this situation, the thickness of layer l was much larger than the Rayleigh length, l >> zR, and integrated fluorescence signal over time and space (taking into account the Gaussian-Lorentzian intensity distribution (2)), reads
F 2 = C σ 2 ( λ ) λ Δ τ ( λ ) P 2   ,
where C is a constant. To find the pulse duration as a function of wavelength, we regroup the previous equation to obtain:
Δ τ ( λ ) = C P 2 λ σ 2 ( λ ) F 2 ( λ ) .
Figure S29 shows the ∆τ values calculated according to this equation (with the σ2(λ) values taken from [44]), and normalized to the value of 109 fs at 1100 nm.

4.6. Colony Thickness, Rayleigh Length, and Focal Spot Size inside a Colony

To measure colony thickness and independently estimate the Rayleigh length, we performed a z-scan of fluorescence signal across several colonies expressing different FPs. This was done by changing the z position with a step of 200 or 250 μm (using the stage movement) and scanning a 400 μm region with the piezo scan of the lens. Those 400 μm segments were then “glued” together to obtain the z-profile of fluorescence intensity, Supplementary Figures S30–S35. These profiles were normalized to 1 and fitted to a model function that is obtained as a convolution of the Gaussian-Lorentzian distribution squared and a rectangular function of width l, describing the distribution of fluorophores inside a colony, see Supplementary Data. Colony thicknesses vary between 150 and 240 μm. The Rayleigh range obtained inside the colonies is ~30% larger than that in air, found in Section 5. We explain this effect by the dependence of wavelength of light on refractive index of medium. In fact, the general expression for zR in a medium reads [45]:
z R = n 0 π w 0 2 λ
where n0 is the refractive index of medium and λ is the wavelength of light in vacuum. Since the refractive index of water is 1.33, the zR measured in a colony should be 1.33 times larger than in air, as observed (Supplementary Figure S28). Finally, we calculate the w0 values from the zR measured in colonies, as
w 0 = λ z R / n 0 π .
The results match quite well those obtained with the razor blade method, see Figure S27.

4.7. Two-Photon Excitation Spectra of RFPs inside E. coli Colonies

To obtain relative shape of the 2PE spectrum of an RFPP inside a colony, we first measured its two-photon excited fluorescence signal F2,S(λ) (100 ms acquisition time, no bleaching) at several excitation wavelengths. In this measurement, position z was adjusted to give the maximum signal (different at different λ). Then, exactly in the same excitation conditions (laser power) we measured the two-photon excited signal from the solution of Rhodamine 6G in methanol in 1 mm cuvette, F2,R(λ). The cuvette was mounted inside an empty Petri dish and placed in focus of the laser instead of the plate with colonies. The z position was again adjusted to the maximum signal. This sample was used as a reference to calibrate variations of the laser power and beam spatial and temporal profile as a function of wavelength. The corrected 2PE spectrum of an RFP sample in cells was then calculated according to
f 2 P E , S ( λ ) = F 2 , S ( λ ) F 2 , R ( λ ) f 2 P E , R ( λ ) ,
where f 2 P E , R ( λ ) is the corrected 2PE spectrum of the reference solution, presented in [44].

Supplementary Materials

The following supporting information can be downloaded at: https://www.mdpi.com/article/10.3390/ijms23020770/s1.

Author Contributions

Conceptualization, M.D.; Methodology, M.D. and R.S.M.; Software, J.F. and R.S.M.; Validation, M.D., R.S.M. and J.F.; Formal Analysis, M.D.; Investigation, M.D. and R.S.M.; Resources, M.D., R.S.M., and J.F.; Data Curation, M.D., R.S.M. and J.F.; Writing—Original Draft Preparation, M.D.; Writing—Review and Editing, M.D.; Visualization, M.D.; Supervision, M.D.; Project Administration, M.D.; Funding Acquisition, M.D. All authors have read and agreed to the published version of the manuscript.

Funding

This work was supported by the NINDS grants U01 NS094246 for MD, RSM, and JF and U24 NS109107 for MD and RSM.

Institutional Review Board Statement

Not applicable.

Informed Consent Statement

Not applicable.

Conflicts of Interest

The authors declare no conflict of interest.

References

  1. Shaner, N.C.; Campbell, R.E.; Steinbach, P.A.; Giepmans, B.N.G.; Palmer, A.E.; Tsien, R.Y. Improved monomeric red, orange and yellow fluorescent proteins derived from Discosoma sp. red fluorescent protein. Nat. Biotechnol. 2004, 22, 1567–1572. [Google Scholar] [CrossRef]
  2. Lin, M.Z.; McKeown, M.R.; Ng, H.-L.; Aguilera, T.A.; Shaner, N.C.; Campbell, R.E.; Adams, S.R.; Gross, L.A.; Ma, W.; Alber, T.; et al. Autofluorescent proteins with excitation in the optical window for intravital imaging in mammals. Chem. Biol. 2009, 16, 1169–1179. [Google Scholar] [CrossRef] [Green Version]
  3. Chudakov, D.M.; Matz, M.V.; Lukyanov, S.; Lukyanov, K.A. Fluorescent proteins and their applications in imaging living cells and tissues. Physiol. Rev. 2010, 90, 1103–1163. [Google Scholar] [CrossRef]
  4. Dana, H.; Mohar, B.; Sun, Y.; Narayan, S.; Gordus, A.; Hasseman, J.P.; Tsegaye, G.; Holt, G.T.; Hu, A.; Walpita, D.; et al. Sensitive red protein calcium indicators for imaging neural activity. eLife 2016, 5, e12727. [Google Scholar] [CrossRef] [PubMed]
  5. Shen, Y.; Nasu, Y.; Shkolnikov, I.; Kim, A.; Campbell, R.E. Engineering genetically encoded fluorescent indicators for imaging of neuronal activity: Progress and prospects. Neurosci. Res. 2020, 152, 3–14. [Google Scholar] [CrossRef] [PubMed]
  6. Denk, W.; Strickler, J.H.; Webb, W.W. Two-photon laser scanning fluorescence microscopy. Science 1990, 248, 73–76. [Google Scholar] [CrossRef] [Green Version]
  7. Xu, C.; Zipfel, W.; Shear, J.B.; Williams, R.M.; Webb, W.W. Multiphoton fluorescence excitation: New spectral windows for biological nonlinear microscopy. Proc. Natl. Acad. Sci. USA 1996, 93, 10763–10768. [Google Scholar] [CrossRef] [Green Version]
  8. Kazemipour, A.; Novak, O.; Flickinger, D.; Marvin, J.S.; Abdelfattah, A.S.; King, J.; Borden, P.M.; Kim, J.J.; Al-Abdullatif, S.H.; Deal, P.E.; et al. Kilohertz frame-rate two-photon tomography. Nat. Methods 2019, 16, 778–786. [Google Scholar] [CrossRef]
  9. Lu, R.; Liang, Y.; Meng, G.; Zhou, P.; Svoboda, K.; Paninski, L.; Ji, N. Rapid mesoscale volumetric imaging of neural activity with synaptic resolution. Nat. Methods 2020, 17, 291–294. [Google Scholar] [CrossRef]
  10. Drobizhev, M.; Makarov, N.S.; Tillo, S.E.; Hughes, T.E.; Rebane, A. Two-photon absorption properties of fluorescent proteins. Nat. Methods 2011, 8, 393–399. [Google Scholar] [CrossRef] [PubMed]
  11. Drobizhev, M.; Tillo, S.; Makarov, N.S.; Hughes, T.E.; Rebane, A. Absolute two-photon absorption spectra and two-photon brightness of orange and red fluorescent proteins. J. Phys. Chem. B 2009, 113, 855–859. [Google Scholar] [CrossRef] [PubMed] [Green Version]
  12. Smith, A.M.; Mancini, M.C.; Nie, S. Bioimaging: Second window for in vivo imaging. Nat. Nanotechnol. 2009, 4, 710–711. [Google Scholar] [CrossRef] [PubMed] [Green Version]
  13. Nifosì, R.; Luo, Y. Predictions of novel two-photon absorption bands in fluorescent proteins. J. Phys. Chem. B 2007, 111, 14043–14050. [Google Scholar] [CrossRef] [PubMed]
  14. Drobizhev, M.; Makarov, N.S.; Hughes, T.; Rebane, A. Resonance enhancement of two-photon absorption in fluorescent proteins. J. Phys. Chem. B 2007, 111, 14051–14054. [Google Scholar] [CrossRef]
  15. Tillo, S.E.; Hughes, T.E.; Makarov, N.S.; Rebane, A.; Drobizhev, M. A new approach to dual-color two-photon microscopy with fluorescent proteins. BMC Biotechnol. 2010, 10, 6. [Google Scholar] [CrossRef] [Green Version]
  16. Patterson, G.H.; Piston, D.W. Photobleaching in two-photon excitation microscopy. Biophys. J. 2000, 78, 2159–2162. [Google Scholar] [CrossRef] [Green Version]
  17. Goodman, L.; Philis, J. Multiphoton Absorption Spectroscopy: Techniques, Instrumentation, and Applications. In Applied Laser Spectroscopy; Andrews, D.L., Ed.; VCH Publishers: New York, NY, USA, 1992; Chapter 8; pp. 319–364. [Google Scholar]
  18. Lougnot, D.-J.; Goldschmidt, C.R. Photoionization of fluorescein via excited triplet and singlet states. J. Photochem. 1980, 12, 215–224. [Google Scholar] [CrossRef]
  19. Redchenko, V.V.; Safronov, A.I.; Kirpichenok, M.A.; Grandberg, I.I.; Traven, V. Electronic Structure of π-Systems. XV. Photoelectron spectra of 7-aminocoumarin derivatives. J. Gen. Chem. USSR 1992, 62, 2313–2318. [Google Scholar]
  20. Marchant, J.S.; Stutzmann, G.E.; Leissring, M.A.; LaFerla, F.M.; Parker, I. Multiphoton-evoked color change of DsRed as an optical highlighter for cellular and subcellular labeling. Nat. Biotechnol. 2001, 19, 645–649. [Google Scholar] [CrossRef]
  21. Robinson, L.C.; Marchant, J.S. Improved “optical highlighter” probes derived from discosoma red fluorescent protein. Biophys. J. 2005, 88, 1444–1457. [Google Scholar] [CrossRef] [Green Version]
  22. Andresen, V.; Alexander, S.; Heupel, W.-M.; Hirschberg, M.; Hoffman, R.M.; Friedl, P. Infrared multiphoton microscopy: Subcellular-resolved deep tissue imaging. Curr. Opin. Biotechnol. 2009, 20, 54–62. [Google Scholar] [CrossRef]
  23. Herz, J.; Siffrin, V.; Hauser, A.E.; Brandt, A.U.; Leuenberger, T.; Radbruch, H.; Zipp, F.; Niesner, R.A. Expanding two-photon intravital microscopy to the infrared by means of optical parametric oscillator. Biophys. J. 2010, 98, 715–723. [Google Scholar] [CrossRef] [Green Version]
  24. Chen, T.-S.; Zeng, S.-Q.; Luo, Q.-M.; Zhang, Z.-H.; Zhou, W. High-order photobleaching of green fluorescent protein inside live cells in two-photon excitation microscopy. Biochem. Biophys. Res. Commun. 2002, 291, 1272–1275. [Google Scholar] [CrossRef] [PubMed]
  25. Drummond, D.R.; Carter, N.; Cross, R.A. Multiphoton versus confocal high resolution z-sectioning of enhanced green fluorescent microtubules: Increased multiphoton photobleaching within the focal plane can be compensated using a Pockels cell and dual widefield detectors. J. Microsc. 2002, 206, 161–169. [Google Scholar] [CrossRef]
  26. Kalies, S.; Kuetemeyer, K.; Heisterkamp, A. Mechanisms of high-order photobleaching and its relationship to intracellular ablation. Biomed. Opt. Express 2011, 2, 805–816. [Google Scholar] [CrossRef] [PubMed]
  27. Graham, D.J.L.; Tseng, S.-F.; Hsieh, J.-T.; Chen, D.J.; Alexandrakis, G. Dependence of Two-Photon eGFP Bleaching on Femtosecond Pulse Spectral Amplitude and Phase. J. Fluoresc. 2015, 25, 1775–1785. [Google Scholar] [CrossRef] [PubMed]
  28. Drobizhev, M.; Stoltzfus, C.; Topol, I.; Collins, J.; Wicks, G.; Mikhaylov, A.; Barnett, L.; Hughes, T.E.; Rebane, A. Multiphoton photochemistry of red fluorescent proteins in solution and live cells. J. Phys. Chem. B 2014, 118, 9167–9179. [Google Scholar] [CrossRef] [PubMed]
  29. Ji, N.; Magee, J.C.; Betzig, E. High-speed, low-photodamage nonlinear imaging using passive pulse splitters. Nat. Methods 2008, 5, 197–202. [Google Scholar] [CrossRef] [PubMed]
  30. Donnert, G.; Eggeling, C.; Hell, S.W. Major signal increase in fluorescence microscopy through dark-state relaxation. Nat. Methods 2007, 4, 81–86. [Google Scholar] [CrossRef]
  31. Kawano, H.; Nabekawa, Y.; Suda, A.; Oishi, Y.; Mizuno, H.; Miyawaki, A.; Midorikawa, K. Attenuation of photobleaching in two-photon excitation fluorescence from green fluorescent protein with shaped excitation pulses. Biochem. Biophys. Res. Commun. 2003, 311, 592–596. [Google Scholar] [CrossRef]
  32. Field, J.J.; Carriles, R.; Sheetz, K.E.; Chandler, E.V.; Hoover, E.E.; Tillo, S.E.; Hughes, T.E.; Sylvester, A.W.; Kleinfeld, D.; Squier, J.A. Optimizing the fluorescent yield in two-photon laser scanning microscopy with dispersion compensation. Opt. Express 2010, 18, 13661–13672. [Google Scholar] [CrossRef] [Green Version]
  33. Xi, P.; Andegeko, Y.; Weisel, L.R.; Lozovoy, V.V.; Dantus, M. Greater signal, increased depth, and less photobleaching in two-photon microscopy with 10fs pulses. Opt. Commun. 2008, 281, 1841–1849. [Google Scholar] [CrossRef]
  34. Wang, L.; Jackson, W.C.; Steinbach, P.A.; Tsien, R.Y. Evolution of new nonantibody proteins via iterative somatic hypermutation. Proc. Natl. Acad. Sci. USA 2004, 101, 16745–16749. [Google Scholar] [CrossRef] [Green Version]
  35. Molina, R.S.; Qian, Y.; Wu, J.; Shen, Y.; Campbell, R.E.; Drobizhev, M.; Hughes, T.E. Understanding the Fluorescence Change in Red Genetically Encoded Calcium Ion Indicators. Biophys. J. 2019, 116, 1873–1886. [Google Scholar] [CrossRef] [Green Version]
  36. Drobizhev, M.; Hughes, T.E.; Stepanenko, Y.; Wnuk, P.; O’Donnell, K.; Scott, J.N.; Callis, P.R.; Mikhaylov, A.; Dokken, L.; Rebane, A. Primary role of the chromophore bond length alternation in reversible photoconversion of red fluorescence proteins. Sci. Rep. 2012, 2, 688. [Google Scholar] [CrossRef] [PubMed] [Green Version]
  37. Habuchi, S.; Cotlet, M.; Gensch, T.; Bednarz, T.; Haber-Pohlmeier, S.; Rozenski, J.; Dirix, G.; Michiels, J.; Vanderleyden, J.; Heberle, J.; et al. Evidence for the isomerization and decarboxylation in the photoconversion of the red fluorescent protein DsRed. J. Am. Chem. Soc. 2005, 127, 8977–8984. [Google Scholar] [CrossRef] [Green Version]
  38. Shu, X.; Shaner, N.C.; Yarbrough, C.A.; Tsien, R.Y.; Remington, S.J. Novel chromophores and buried charges control color in mFruits. Biochemistry 2006, 45, 9639–9647. [Google Scholar] [CrossRef] [PubMed]
  39. Ghosh, D.; Acharya, A.; Tiwari, S.C.; Krylov, A.I. Toward understanding the redox properties of model chromophores from the green fluorescent protein family: An interplay between conjugation, resonance stabilization, and solvent effects. J. Phys. Chem. B 2012, 116, 12398–12405. [Google Scholar] [CrossRef] [PubMed]
  40. Fuenzalida Werner, J.P.; Huang, Y.; Mishra, K.; Janowski, R.; Vetschera, P.; Heichler, C.; Chmyrov, A.; Neufert, C.; Niessing, D.; Ntziachristos, V.; et al. Challenging a Preconception: Optoacoustic Spectrum Differs from the Optical Absorption Spectrum of Proteins and Dyes for Molecular Imaging. Anal. Chem. 2020, 92, 10717–10724. [Google Scholar] [CrossRef]
  41. Molina, R.S.; King, J.; Franklin, J.; Clack, N.; McRaven, C.; Goncharov, V.; Flickinger, D.; Svoboda, K.; Drobizhev, M.; Hughes, T.E. High throughput instrument to screen fluorescent proteins under two-photon excitation. Biomed. Opt. Express 2020, 11, 7192–7203. [Google Scholar] [CrossRef]
  42. Guild, J.B.; Xu, C.; Webb, W.W. Measurement of group delay dispersion of high numerical aperture objective lenses using two-photon excited fluorescence. Appl. Opt. 1997, 36, 397–401. [Google Scholar] [CrossRef]
  43. Dickson, L.D. Characteristics of a propagating gaussian beam. Appl. Opt. 1970, 9, 1854–1861. [Google Scholar] [CrossRef]
  44. Drobizhev, M.; Molina, R.S.; Hughes, T.E. Characterizing the Two-photon Absorption Properties of Fluorescent Molecules in the 680–1300 nm Spectral Range. Bio-Protocol 2020, 10, e3498. Available online: https://www.ncbi.nlm.nih.gov/pmc/articles/PMC7409827/ (accessed on 23 December 2021). [CrossRef]
  45. Xu, C.; Webb, W.W. Multiphoton Excitation of Molecular Fluorophores and Nonlinera Laser Microscopy. In Topics in Fluorescence Spectroscopy, Vol. 5, Nonlinear and Two-Photon Induced Fluorescence; Lakowicz, J.R., Ed.; Plenum Press: New York, NY, USA; London, UK, 1997; Chapter 11; pp. 471–540. [Google Scholar]
Figure 1. Energy level diagrams for some multiphoton induced photobleaching processes. Panels (a,b) correspond to two-photon bleaching following initial two-photon absorption with the cross section σ2. Panel (c) corresponds to a three-photon bleaching where initial 2P excitation to level m (m can be equal to 1) is followed by a one-photon transition m → n with the 1PA cross section, σmn. The bold arrows connecting m and n states designate strong absorption (up) and stimulated emission (down) resulting in possible saturation of the m → n transition. Panel (d) shows a four-photon bleaching process, where, after three-photon excitation to level n, an electron leaves a molecule with photoionization (photodetachment) cross section σnc, and transits into a continuum of states (c).
Ijms 23 00770 g001
Figure 2. Top: Two-photon absorption spectrum of mCherry in purified buffer solution at pH8, (red line) [11] and two-photon excitation spectrum of mCherry measured in E. coli cells (symbols) (normalized to the 2PA cross section of solution spectrum at 760 nm). Bottom: Quantum yield of the first step of photobleaching process initiated by absorption of two photons as a function of excitation wavelength (black asterisks) for mCherry in E. coli. Quantum yield of the first step of one-photon induced photobleaching process upon laser excitation at 532 nm [36] is shown by a green circle at double wavelength (1064 nm).
Ijms 23 00770 g002
Figure 3. Fluorescence decay kinetic curves obtained at λ = 800 nm at different power values at the sample, shown in the inset. The kinetics are normalized to the F(0) = 1 values. The dashed lines illustrate the derivatives of the decay curves at t = 0, corresponding to 37 and 70 mW.
Ijms 23 00770 g003
Figure 4. Power dependences of the initial bleaching rate of mCherry at different excitation wavelengths (see legend in the inset), presented in double logarithmic scale.
Ijms 23 00770 g004
Figure 5. Power dependence of the initial bleaching rate of mPlum at 790 nm, presented in double logarithmic scale.
Ijms 23 00770 g005
Figure 6. Top: Two photon action spectra of jREX-GECO1 measured in Ca2+-free (green line) and Ca2+-bound (purple line) states in buffer [35] and in E. coli cells (normalized to Ca2+-bound spectrum at 900 nm). Bottom: Power exponent of the bleaching rate power dependence as a function of wavelength.
Ijms 23 00770 g006
Figure 7. Power dependences of the bleaching rates of jREX-GECO1 at different wavelengths presented in double logarithmic scale. (a) Long wavelength range; (b) Short wavelength range.
Ijms 23 00770 g007
Figure 8. Top: Two-photon absorption spectrum of tdTomato in purified buffer solution at pH8, (orange line) [11] and two-photon excitation spectrum of tdTomato measured in E. coli cells (symbols) (normalized to the 2PA cross section of solution spectrum at 750 nm). Bottom: Power exponent α of the dependence of photobleaching rate on laser power (see text for details).
Ijms 23 00770 g008
Figure 9. Power dependences of the bleaching rates of tdTomato at different wavelengths (see legends in the insets) presented in double logarithmic scale. (a) Long wavelength range; (b) Short wavelength range.
Ijms 23 00770 g009
Table 1. Molecular photobleaching parameters of mCherry at different wavelengths.
λ, nmnσ2, GM (a)φ1,m (b)σmnσnc, cm4 (c)σmn, cm2 (d)σnc, cm2 (d)
1100224(1.6 ± 0.3) × 10−5------
10002 6.2(1.0 ± 0.2) × 10−4------
8002 to 422(1.0 ± 0.2) × 10−4(5.0 ± 0.8) × 10−36(3.7 ± 1.4) × 10−17(1.3 ± 0.5) × 10−19 *
7802 to 442(8.5 ± 1.7) × 10−5(1.7 ± 0.3) × 10−35(5.0 ± 1.6) × 10−17(3.4 ± 0.9) × 10−19
7602 to 471(1.0 ± 0.2) × 10−4(3.3 ± 0.5) × 10−35(8.8 ± 1.9) × 10−17(7.3 ± 1.2) × 10−19
Column 2 shows the number of photons n involved in the process. (a) 2PA cross sections are taken from [11]. (b) Found from the fits of K(P) dependences to Function (5) in the low power range below the threshold. (c) Found from the fits of K(P) dependences to Function (9) in the power range just above the threshold. (d) Found from the fits of K(P) dependences to Function (10) in the power range above the threshold. * Obtained by dividing σmnσnc (column 5) by σmn (column 6).
Table 2. Threshold laser powers P* and peak photon flux I0* for the transition from quadratic to super-quadratic dependence of the photobleaching rate for mCherry.
λ, nm(φm/σmnσnc)1/2, cm−2w02, cm2P* Predicted, mW (I0*, photons/cm2/s)P* Observed, mW (I0*, photons/cm2/s)
7601.7 × 10151.32 × 10−726 (3.6 × 1028)19 (2.6 × 1028)
7802.2 × 10151.37 × 10−734 (3.9 × 1028)28 (3.2 × 1028)
8004.5 × 10151.43 × 10−768 (5.4 × 1028)61 (4.8 × 1028)
Column 2 presents a combination of molecular parameters that define the P* value. Column 3 shows the laser waist squared that is also responsible for P*.
Table 3. Molecular photobleaching parameters of jREX-GECO1 at different wavelengths.
λ, nmnσ2, GM (a)φ1 (b)σmnφn, cm2 (c)σmn, cm2 (d)φn
110027.9(2.1 ± 0.3) × 10−4------
1000225(5.7 ± 0.9) × 10−5------
950234(5.0 ± 0.8) × 10−5------
925338--(1.2 ± 0.2) × 10−20 (m = 1)----
900335 (2.0 ± 0.3) × 10−20 (m = 1)----
80038.8--(7.7 ± 1.1) × 10−21 (m = 1)----
78036.5--(1.5 ± 0.2) × 10−20 (m = 1)----
76038.7--(3.0 ± 0.5) × 10−20 (m > 1)(1.4 ± 0.4) × 10−17(2.2 ± 0.7) × 10−3
Column 2 shows the number of photons n involved in the process. (a) 2PA cross sections of Ca2+-saturated state are taken from [35]. (b) Found from the fits of K(P) dependences to Function (5) in power range below the threshold. (c) Found from the fits of K(P) dependences to Function (6). (d) Found from the fits of K(P) dependences to Function (7).
Table 4. Molecular photobleaching parameters of tdTomato at different wavelengths.
λ, nmnσ2, GM (a)φ1,m (b)σmnσnc, cm4 (c)σmn, cm2 (d)σnc, cm2 (d)
1100480--(2.3 ± 0.4) × 10−36----
10002 to 856(3.7 ± 0.6) × 10−5------
9702 to 1042(1.6 ± 0.2) × 10−5--
860522--------
82043.2--(4.3 ± 0.2) × 10−36----
78048.7--(1.6 ± 0.8) × 10−35(4.3 ± 1.5) × 10−17(3.8 ± 1.3) × 10−20
7604 (α = 3)31------(4.8 ± 0.7) × 10−19
Column 2 shows the number of photons n involved in the process. (a) 2PA cross sections are taken from [11]. (b) Found from the fits of K(P) dependences to Function (5) in power range below the threshold. (c) Found from the fits of K(P) dependences to Function (9). (d) Found from the fits of K(P) dependences to Function (10).
Table 5. Figure of Merit for TPLM applications of FPs showing fourth-order power dependence of multiphoton bleaching rate.
Proteinλ, nmσ2, GM (a)σmnσnc, cm4φF (b)FOM (4) [×10−8]
mCherry800225.0 × 10−360.245
780421.7 × 10−350.243.8
760713.3 × 10−350.243.5
mPlum790431.6 × 10−350.132.1
tdTomato1100802.3 × 10−360.7243
8203.24.3 × 10−360.726.2
7808.71.6 × 10−350.725.3
(a) Taken from [11]. (b) Taken from [10].
Table 6. Figure of Merit for TPLM applications of FPs showing second-order power dependence of multiphoton bleaching rate.
Proteinλ, nmφ1,m(a)φF(b)FOM (2) [×103]
mCherry11001.6 × 10−50.2415
10001.0 × 10−40.242.4
8001.0 × 10−40.242.4
7808.5 × 10−50.242.8
7601.0 × 10−40.242.4
mPlum7901.3 × 10−40.131
jREX-GECO111002.1 × 10−40.211
tdTomato 10005.7 × 10−50.213.7
9505.0 × 10−50.214.2
10003.7 × 10−50.7220
9701.6 × 10−50.7245
(a) Taken from [11]. (b) For mFruits and tdTomato taken from [10] and for jREX-GECO1—from [35].
Publisher’s Note: MDPI stays neutral with regard to jurisdictional claims in published maps and institutional affiliations.

