Article

Genomic Analysis of the Glutathione S-Transferase Family in Pear (Pyrus communis) and Functional Identification of PcGST57 in Anthocyanin Accumulation

1
Zhengzhou Fruit Research Institute, Chinese Academy of Agricultural Sciences, Zhengzhou 450009, China
2
College of Horticulture and Plant Conservation, Henan University of Science and Technology, Luoyang 471023, China
*
Author to whom correspondence should be addressed.
These authors contributed equally to this work.
Int. J. Mol. Sci. 2022, 23(2), 746; https://doi.org/10.3390/ijms23020746
Submission received: 24 November 2021 / Revised: 7 January 2022 / Accepted: 9 January 2022 / Published: 11 January 2022
(This article belongs to the Topic Plant Functional Genomics and Crop Genetic Improvement)

Abstract

:
Anthocyanin accumulation in vacuoles results in red coloration in pear peels. Glutathione S-transferase (GST) proteins have emerged as important regulators of anthocyanin accumulation. Here, a total of 57 PcGST genes were identified in the European pear ‘Bartlett’ (Pyrus communis) through comprehensive genomic analysis. Phylogenetic analysis showed that PcGST genes were divided into 10 subfamilies. The gene structure, chromosomal localization, collinearity relationship, cis-elements in the promoter region, and conserved motifs of PcGST genes were analyzed. Further research indicated that glutamic acid (Glu) can significantly improve anthocyanin accumulation in pear peels. RNA sequencing (RNA-seq) analysis showed that Glu induced the expression of most PcGST genes, among which PcGST57 was most significantly induced. Further phylogenetic analysis indicated that PcGST57 was closely related to GST genes identified in other species, which were involved in anthocyanin accumulation. Transcript analysis indicated that PcGST57 was expressed in various tissues, other than flesh, and associated with peel coloration at different developmental stages. Silencing of PcGST57 by virus-induced gene silencing (VIGS) inhibited the expression of PcGST57 and reduced the anthocyanin content in pear fruit. In contrast, overexpression of PcGST57 improved anthocyanin accumulation. Collectively, our results demonstrated that PcGST57 was involved in anthocyanin accumulation in pear and provided candidate genes for red pear breeding.

1. Introduction

Pear is one of the most cultivated fruit species worldwide for its economic benefit and valuable nutrition [1]. It has been cultivated for more than 3000 years, with an annual world production of approximately 23.9 million tons (FAOSTAT 2019). As an important commercial characteristic, pears with a red pericarp are more favored by consumers [2]. Developing red-colored cultivars has been an important target of pear-breeding programs due to the growing demands for high-quality pear fruit.
Anthocyanin accumulation in vacuoles results in red coloration in different tissues, including flowers, leaves, and pericarps. Anthocyanins act as important attractants or repellants to insects and animals [3]. Moreover, anthocyanins are involved in resistance to biotic and abiotic stress, including pathogen damage, ultraviolet radiation, and low temperature [4,5]. Additionally, anthocyanins serve as an important source of antioxidant compounds, which are responsible for human health and contribute to the economic value of horticultural products [5,6,7].
Anthocyanins are produced starting from phenylalanine in the cytoplasm through the flavonoid biosynthetic pathway [8], which involves the catalytic reaction of enzymes encoded by PAL, C4H, 4CL, CHS, CHI, F3H, F3′H, DFR, ANS, UFGT, and other structural genes [9]. The expression of these structural genes is regulated by the MYB-bHLH-WD40 (MBW) regulatory complex, which consists of R2R3-MYB transcriptional factors, bHLH, and WD40 proteins [10]. Anthocyanins are transported to the vacuole by anthocyanin transporters [11]. Currently, three different mechanisms of flavonoid transportation have been proposed, namely vesicle trafficking, membrane transporters, and glutathione S-transferase (GST) mediated transporters [12,13]. These mechanisms function in coordination and cooperate with each other [13]. Cytoplasmic vesicle-like structures containing anthocyanins have been observed to fuse into the vacuole in lisianthus petals (Eustoma grandiflorum) [14] and Arabidopsis [15]. Members of the plant MATE family proteins were involved in flavonoid/H+ exchange and acylated anthocyanin transportation [13,16]. An ABCC-type transporter (ZmMrp3) is required for anthocyanin transport to the vacuole in Zea mays [17], and two-fruit specificity anthoMATE1 (AM1) and AM3 proteins were also investigated in grapevine [18]. Recently, several studies revealed the involvement of GST genes in anthocyanin accumulation [11,19,20,21,22]. GST can combine with flavonoids to form a GST-flavonoid complex to protect flavonoids from oxidation or guide them into the central vacuole [23].
Glutathione S-transferases (GSTs) are a superfamily that encodes multifunctional enzymes, which recruit the tripeptide glutathione as a coenzyme or co-substrate to participate in cell activities [24,25]. GST genes have been identified in many species and function in various aspects of plant growth and development, including detoxification of xenobiotic [26,27], biotic and abiotic stress responses [28,29], and secondary metabolism [25]. Recent studies have indicated that GST genes play important roles in plant anthocyanin accumulation. It was first demonstrated in Zea mays that ZmBZ2 encodes a GST protein, which is involved in the transportation of anthocyanins to vacuoles [30]. Subsequently, studies of GST genes related to anthocyanin transportation were reported in many other species, including PhAN9 in petunia [31], AtTT19 in Arabidopsis [32], CkmGST3 in cyclamen [33], VviGST4 in grape [34], PpGST1 in peach [20], FvRAP in strawberry [21,35], and MdGSTF6 in apple [36]. Although GST is involved in anthocyanin accumulation in many species, information on GST in European pear and the role of GST genes in pear coloration is still lacking.
In this study, a total of 57 GST genes were identified in the genome of the ‘Bartlett’ pear and divided into 10 subfamilies. The phylogenetic evolution, syntenic relationships, gene structure, chromosome location, protein domain, cis-elements, and conserved motifs of PcGST genes were comprehensively analyzed. A PcGST57 gene was selected based on RNA sequencing (RNA-seq) analysis, sequence alignment, and phylogenetic analysis. The transcript patterns of PcGST57 in various pear cultivars, tissues, and different developmental stages were analyzed. Transient expression analysis indicated that PcGST57 overexpression improved pear coloration, while PcGST57 silencing reduced anthocyanin accumulation. These results provide a systematic analysis of the pear GST gene family and provide candidate GST genes for anthocyanin accumulation, thereby improving red pear breeding.

2. Results

2.1. Identification and Sequence Characterization of PcGST Family Members

To identify the GST family genes in the ‘Bartlett’ DH pear genome, an HMM search was conducted based on the HMM profiles (PF00043 and PF02798) from the Pfam database, and a local BLASTP search was performed using 63 Arabidopsis GST protein sequences as queries [36]. The ‘Bartlett’ DH was derived from the double haploid pear ‘Bartlett’ as described by Bouvier et al. [37]. A total of 78 candidate protein sequences were obtained with E-values under the threshold of 10−5. To further examine the completeness of the conserved domain, the 78 candidate proteins were searched in the NCBI Conserved Domain Search and Pfam database. Finally, a total of 57 PcGST genes (named PcGST1PcGST57) were identified in the ‘Bartlett’ DH pear genome. The 57 PcGST genes were renamed based on their chromosomal location (Table 1).
The coding sequence (CDS), protein length, isoelectric point (pI), and molecular weight (MW) of PcGST members were analyzed (Table 1). In the ‘Bartlett’ DH pear genome, PcGST12 was predicted to be the smallest GST protein with 100 amino acids (aa) and 11.6 kDa, and PcGST22 was the largest with 786 aa and 91.2 kDa. The pI of GST proteins varied from 4.92 (PcGST27) to 9.75 (PcGST46).

2.2. Phylogenetic Analysis of the PcGST Family

To clarify the phylogenetic relationship of PcGST proteins, a neighbor-joining (NJ) tree, comprising 63 AtGST proteins and 57 PcGST proteins, was constructed using MEGAX software (Figure 1). The PcGST family was divided into 10 subfamilies, including lambda (L), dehydroascorbate reductase (DHAR), metaxin (M), tetrachlorohydroquinone dehalogenase-like (TCHQD), glutathionyl hydroquinone reductase (GHR), γ-subunit of the eukaryotic translation elongation factor 1B (EF1Bγ), Zeta (Z), Theta (T), Phi (F), and Tau (U). These were consistent with the GST subfamily in other species, including tomato, strawberry, and apple [21,28,36]. Among these subfamilies, the Tau subfamily contained the most PcGST genes (24), accounting for more than half of the total PcGST genes, followed by 11 PcGST genes in the Phi subfamily. The TCHQD subfamily was the smallest subfamily with one PcGST gene.

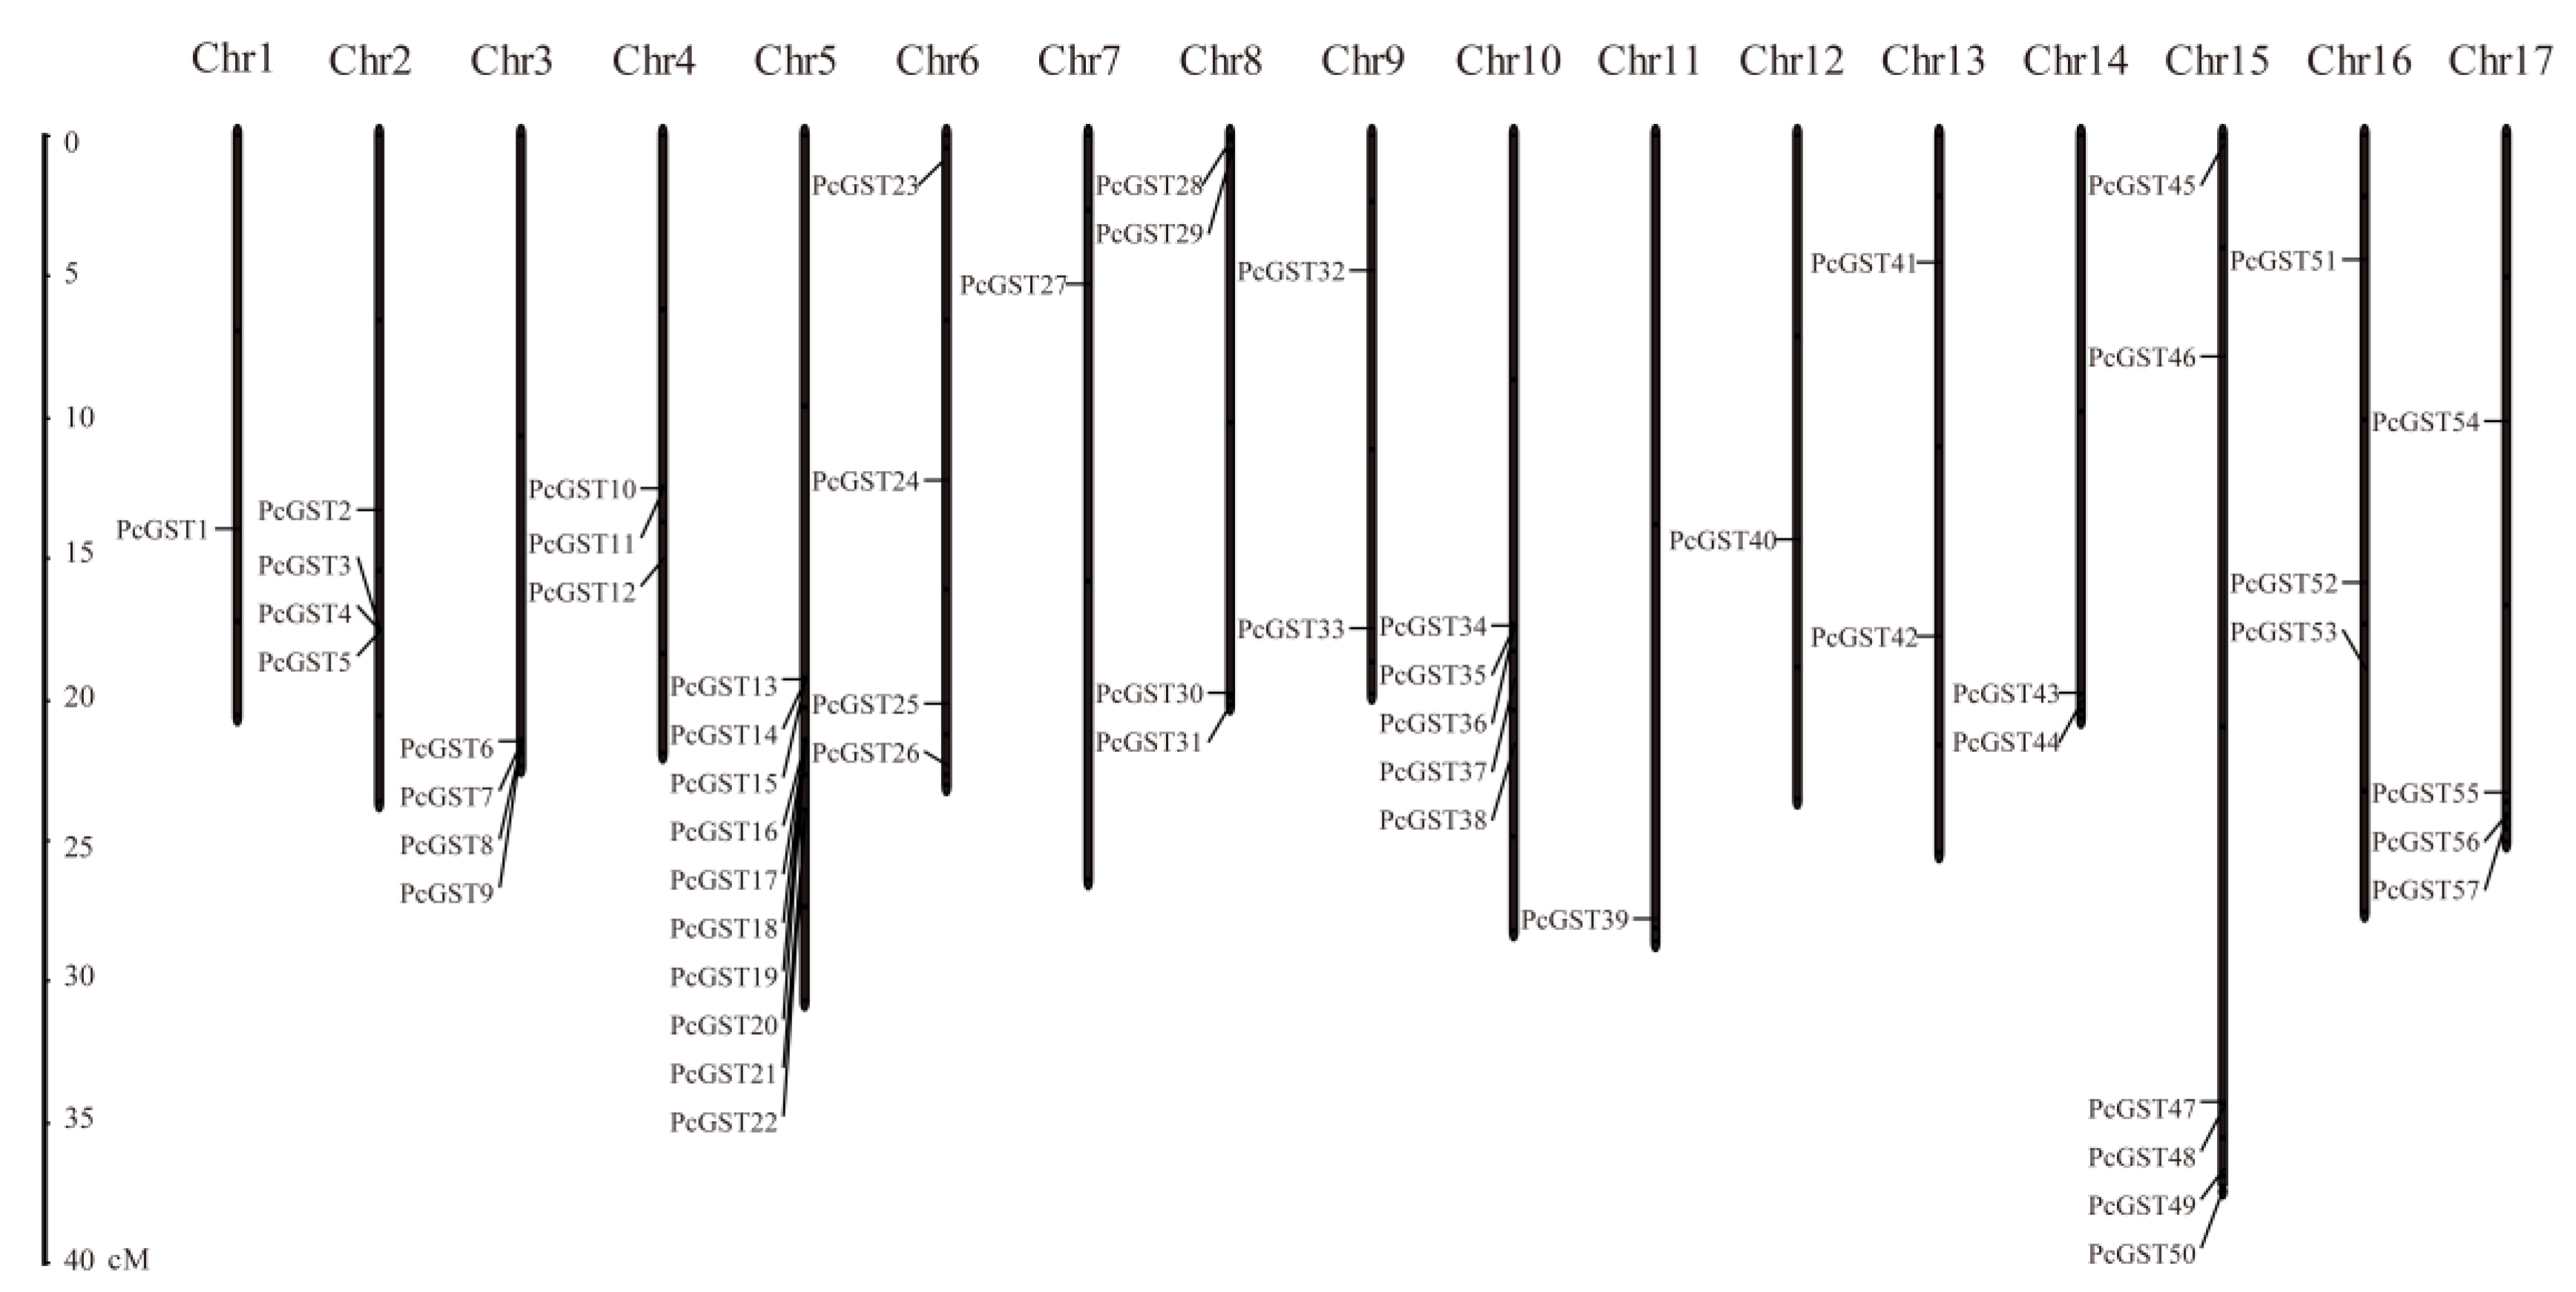
2.3. Chromosomal Location and Collinearity Analysis of PcGST Genes

The chromosomal location of 57 PcGST genes was analyzed based on the annotations of the ‘Bartlett’ pear genome, and the PcGST genes were unevenly distributed on the 17 pear chromosomes (Figure 2). Chromosome 5 contained the most PcGST genes with 10 GST members, followed by six PcGST genes on chromosome 15. There was only one PcGST gene located on chromosomes 1, 7, 11, and 12.
The collinearity of PcGST genes was analyzed, and a total of 15 segmental duplication events were identified, involving 26 of the PcGST genes (Figure 3A). PcGST1, PcGST10, PcGST13, and PcGST40 were involved in multiple repetitive events (Table S1). Two or more genes located within 20 kb were defined as gene clusters [38]. A total of 11 PcGST gene clusters were identified, involving 18 genes, such as PcGST10/11 on chromosome 4 and PcGST17/18 on chromosome 5. Three linear GST genes were identified on chromosomes 2 (PcGST3/4/5), 3 (PcGST6/7/8), and 5 (PcGST13/14/15), indicating that they originated from continuous replication events.
To further analyze the evolutionary and collinearity relationship of PcGST genes, synteny analyses were conducted using the orthologous GST gene pairs among Arabidopsis, pear, and apple. A total of 22 PcGST genes had a homologous relationship with Arabidopsis, involving 33 pairs of homologous genes. A total of 42 PcGST genes had a homologous relationship with apple, involving 80 pairs of homologous genes (Figure 3B). Some collinear gene pairs appeared only in Arabidopsis or apple gene pairs (Table S2). There were 38 collinear gene pairs, involving 22 PcGST genes that were only detected between apple and pear, such as PcGST2/MD02G1204200, which was not found in Arabidopsis. In addition, 14 PcGST genes had no collinearity relationship with Arabidopsis and apple.

2.4. Structure and Motif Analysis of PcGST Genes

The MEME motifs search was performed to analyze the conservative motifs in PcGST genes, and a total of 10 conservative motifs were identified (Figure 4A). Motif 3 existed in all subfamilies, indicating that the motif is conserved in the GST proteins. Motifs 5, 6, and 8 only existed in the Tau subfamily, suggesting that they might be the specific motifs of the Tau subfamily. Motifs 1, 2, 5, and 7 appeared in the Tau subfamily, except in PcGST47. Motifs 1 and 4 were present in all members of the Phi subfamily. The GST family members of the same subfamily had similarities in exon/intron structures and conservative motifs, which supports the reliability of subgroup classification.
To elucidate the structural characteristics of the PcGST genes, the gene structure of the PcGST family was analyzed (Figure 4B). The exon number of most PcGST genes ranged from two to 10, with wo exceptions: PcGST47 with 11 exons and PcGST22 with 21 exons. Most PcGST genes in the same subfamily showed a similar exon/intron structure. Among the plant-specific GST genes in the Phi subfamily, PcGST6 had two exons; PcGST39, PcGST28, PcGST32, PcGST54, PcGST57, and PcGST23 had three exons, and PcGST7, PcGST8, PcGST9, and PcGST45 had four exons. In the Tau subfamily, most GST members contained two exons, except for PcGST14, PcGST36, PcGST15, PcGST51, PcGST19, and PcGST47, with exons ranging from three to 11.

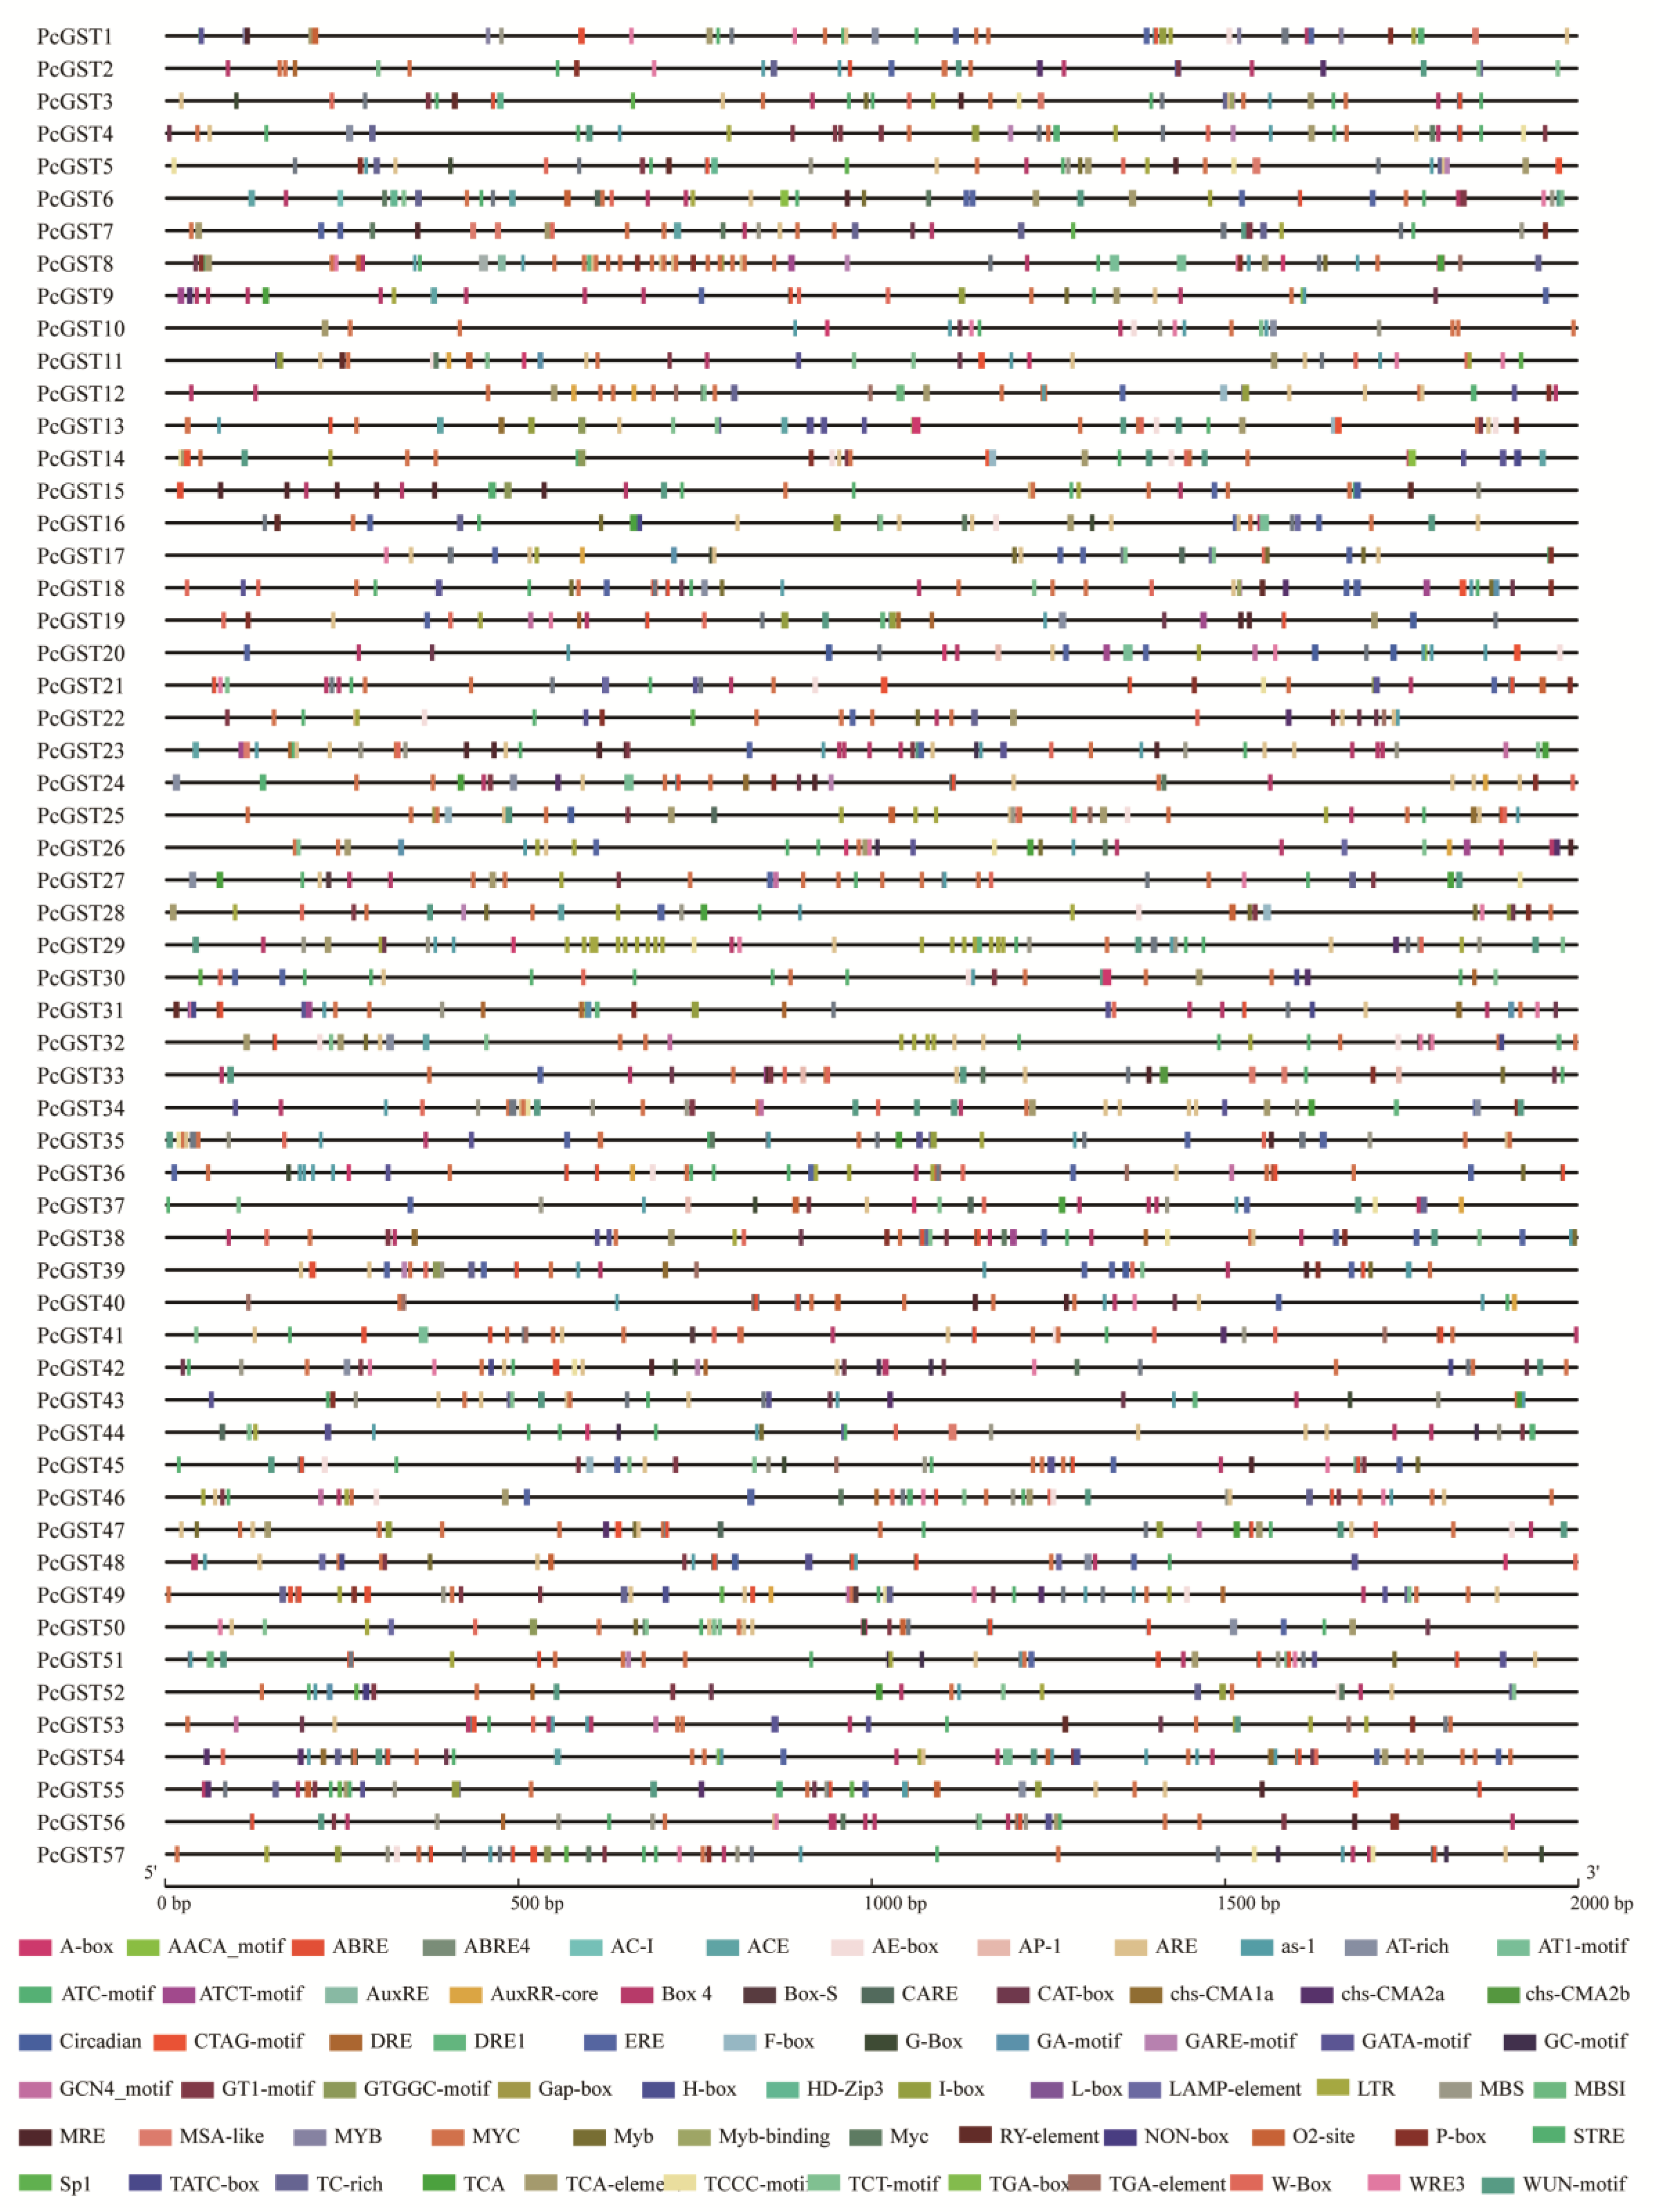
2.5. Cis-Element Analysis of PcGST Promoters

To understand the potential regulation mechanism of PcGST genes, cis-elements in the promoter regions of PcGST genes were analyzed. Various types of cis-elements were identified (Figure 5), including defense and stress responsive elements (e.g., W-box, ARE element, TC-rich repeats, GC-motif, and LTR element), hormone-related responsive elements (e.g., ABRE, GARE-motif, P-box, TATC-box, AuxRE, AuxRR-core, TGA-box, TGA-element, ERE, TCA-element), and light responsive elements (e.g., ACE, G-box, GT1-motif, MRE), indicating the possible function of GST members. Additionally, many MYB binding site elements involved in flavonoid biosynthesis were identified, which might be related to the promotion of anthocyanin accumulation.

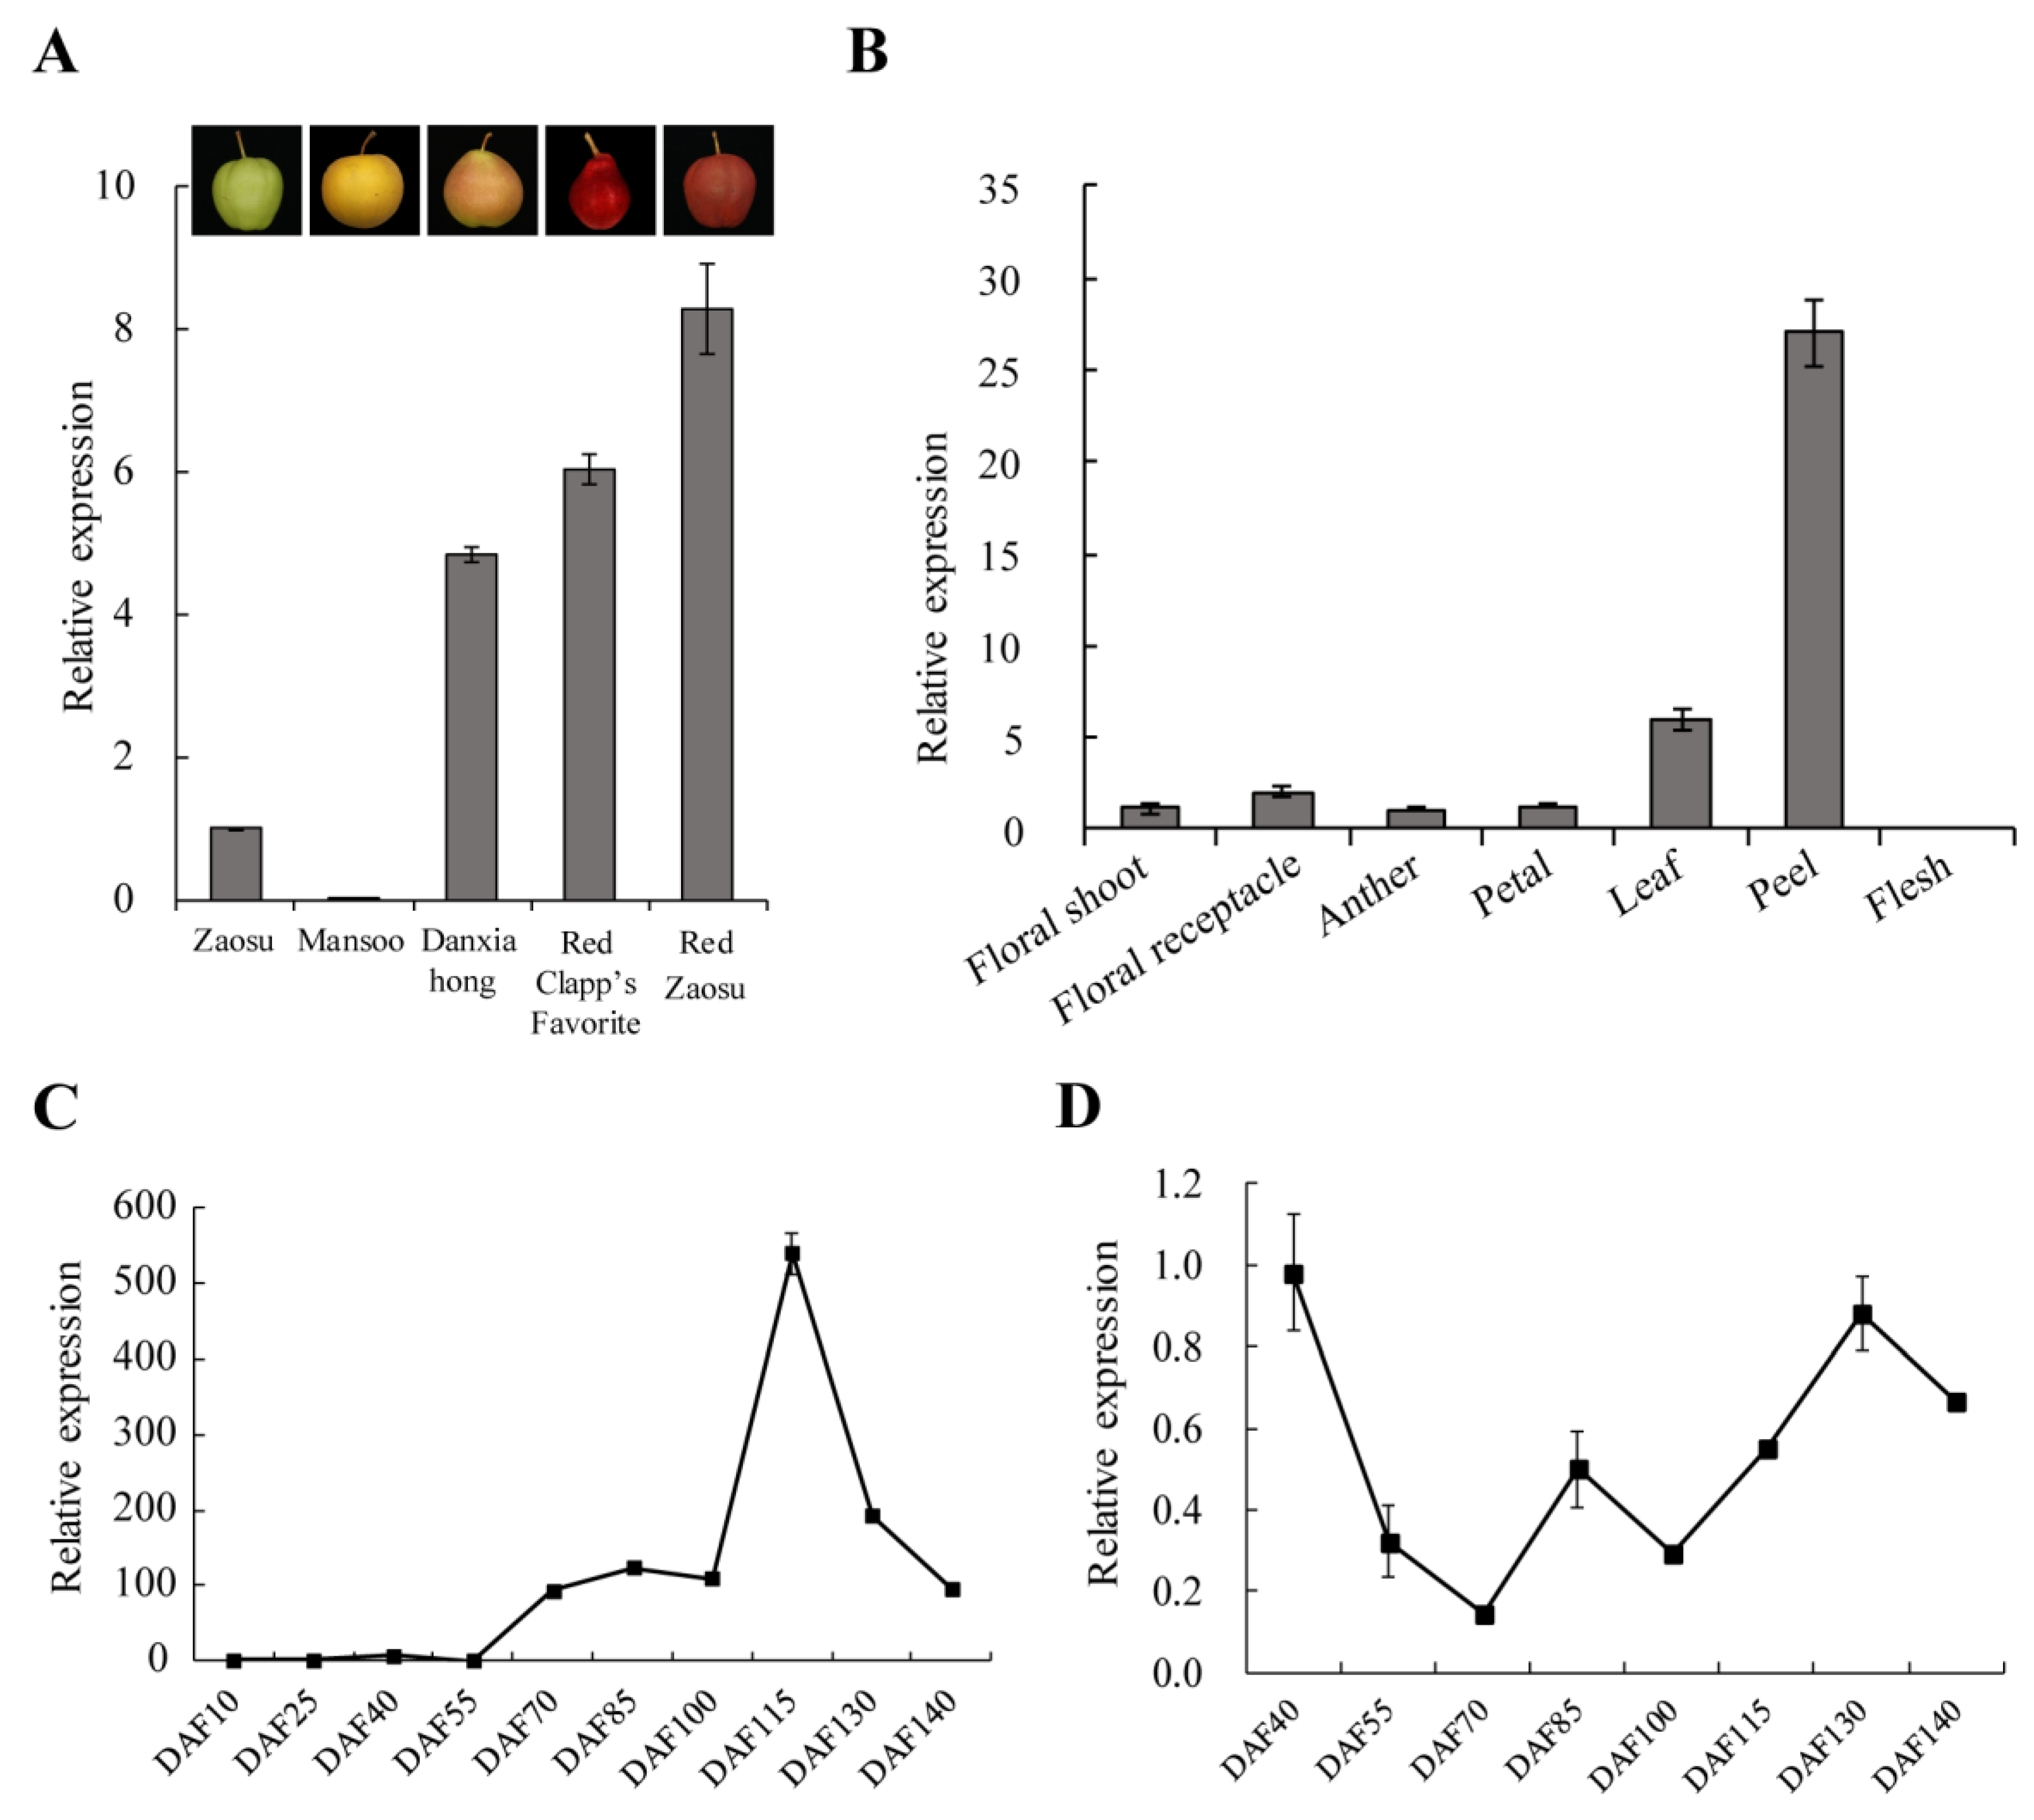
2.6. Expression Analysis of the PcGST Family by Glutamic Acid (Glu)-Induced Coloration

Our previous study revealed that an appropriate concentration of Glu can promote anthocyanin accumulation in the red blush pear peel. To reveal the underlying mechanism, ‘Danxiahong’ pears were treated with 0.06% Glu or sterilized water and then transferred to a light incubator at 17 °C with continuous light. The peels were sampled at indicated time points, namely 0, 3, 12, 24, and 72 h, for RNA-seq analysis.
RNA-seq analysis demonstrated that the expression of most GST genes, structural genes and some regulatory genes, which were associated with anthocyanin accumulation, were significantly upregulated following Glu treatment. Increasing studies have suggested that GST proteins are involved in anthocyanin accumulation in many plant species. Thus, all PcGST members were analyzed based on RNA-seq. The results revealed that 53 PcGST genes were expressed in at least one period, and four PcGST genes were not expressed at any time (Figure 6). Remarkably, most PcGST members of the Phi subfamily, which were associated with anthocyanin accumulation, exhibited increased expression levels. Notably, PcGST57 in the Phi subfamily was significantly upregulated, with a fold change of more than 18, which was the highest at 72 h, indicating that PcGST57 might play an essential role in anthocyanin accumulation.

2.7. Phylogenetic Analysis and Sequence Alignment of PcGST57 and Anthocyanin-Related GST Genes

To elucidate the relationship between PcGST57 and GST genes as distinct from other species, a phylogenetic tree was constructed with PcGST57 and GST genes associated with anthocyanin accumulation from different species, including apple [36], peach [20], Arabidopsis [32], grape [39], strawberry [35], and other plant species. PcGST57 had the closest relationship with apple MdGSTF6, followed by peach PpGST1 (Figure 7A). MdGSTF6 and PpGST1 were the highest targets of PcGST57 in apple and peach by a BLASTP search, respectively. Sequence alignment indicated that PcGST57 shared the same conserved domain with anthocyanin-related GST genes (Figure 7B), indicating that PcGST57 may play an important role in anthocyanin accumulation, and it was selected as the candidate GST gene for further analysis.

2.8. Expression Patterns of PcGST57

To determine the expression levels of PcGST57 in pears with different peel colors, pears, including ‘Zaosu’, ‘Mansoo’, ‘Danxiahong’, ‘Red Clapp’s Favorite’, and ‘Red Zaosu’ were selected for analysis. RT-qPCR analysis showed that the expression level of PcGST57 was low in the green pear ‘Zaosu’ and gradually increased in the red blushed pear ‘Danxiahong’ and the full red pear ‘Red Clapp’s Favorite’ (Figure 8). Expression was highest in the purple–red pear ‘Red Zaosu’. The expression level in the russet pear ‘Mansoo’ was significantly lower than that in the other pears (Figure 8A). The peel color and expression level of PcGST57 showed a positive correlation.
To examine the expression levels of PcGST57 in different tissues, various tissues from pear ‘Danxiahong’ were sampled, including leaves, petals, anthers, floral shoots, and floral receptacles sampled at 0 DAF, and peels and flesh sampled at 100 days after full blossom (DAF). RT-qPCR analysis showed that PcGST57 exhibited a low transcript level in the floral shoot, floral receptacle, anther, and petal (Figure 8B). The expression level in young leaves was 2.90–5.72 times that of the above tissues. Notably, PcGST57 was most highly expressed in the peel, while the lowest expression level was observed in the flesh, indicating that PcGST57 was specifically expressed in various pear tissues and possibly involved in anthocyanin accumulation in the peel.
The transcript levels of PcGST57 in ‘Danxiahong’ pear peels at different developmental stages were analyzed. PcGST57 exhibited a low expression level at early developmental stages (before 55 DAF). The expression level gradually increased and reached its highest point at more than 500-fold in the color transition period (115 DAF) compared to 10 DAF, and then declined at later stages (Figure 8C). Moreover, the expression of PcGST57 in pear flesh at different developmental stages was also investigated. The transcript level of PcGST57 showed no significant correlation with fruit coloring during pear development (Figure 8D). The specific expression of PcGST57 indicated that PcGST57 was associated with fruit coloring and anthocyanin accumulation.

2.9. Function Identification of PcGST57 in Anthocyanin Accumulation

To gain insight into the biological function of PcGST57 in fruit coloring and anthocyanin accumulation, PcGST57 was cloned from ‘Danxiahong’ pear. Sequence alignment indicated that the coding sequence of PcGST57 in ‘Danxiahong’ was identical to that of ‘Bartlett’ DH genome, which has an open reading frame (ORF) of 648 bp encoding 215 amino acids. The coding sequence of PcGST57 was inserted into the overexpressing vector pCAMBIA1302 and transformed into Agrobacterium tumefaciens strain GV3101. The A. tumefaciens strain containing recombinant vector was transiently overexpressed in ‘Danxiahong’ peel as described by Zhang et al. [40]. Fifteen days after injection, the transcript abundance of PcGST57 in overexpressing pear peels (PcGST57-OE) was significantly higher than that of the empty vector (Figure 9C). Correspondingly, the pear peels of overexpressing PcGST57 exhibited improved coloration compared to pears overexpressing the empty vector (Figure 9A). Physiological measurements showed that peels overexpressing PcGST57 accumulated a higher total phenol and anthocyanin content than the empty vector (Figure 9D,E), indicating that PcGST57 overexpression promoted anthocyanin accumulation in pear.
To further determine the biological function of PcGST57 in anthocyanin accumulation, tobacco rattle virus (TRV) mediated virus-induced gene silencing (VIGS) technology was applied to silence PcGST57 expression in ‘Danxiahong’ pear. The transient VIGS assay indicated that the PcGST57-TRV pear peel exhibited green pigmentation around the injection sites, while the pear peel injected with the empty vector showed normal pigmentation (Figure 9B). Meanwhile, the transcription level of PcGST57 was significantly decreased in PcGST57-TRV pear peels compared to empty vector peels (Figure 9F). The measurement of anthocyanins and total phenol indicated that PcGST57 silencing decreased fruit coloration (Figure 9G,H). Furthermore, the results suggested that PcGST57 plays an important role in anthocyanin accumulation in pear coloration.

3. Discussion

GST genes were first reported in animals for their metabolism and detoxification effects of drugs [41]. Afterwards, GST was reported in plants for its ability to protect maize from herbicide effects [42]. Initially, only three GST subfamilies were identified, including Theta, Tau, and Zeta [43]. Subsequently, the GST gene family was systematically and comprehensively analyzed, and increasing GST members were identified in various plant species, including maize [42], soybean [44], Arabidopsis [45], apple [36], strawberry [21], tomato [28], Citrus sinensis [46], kiwifruit [47], cotton [19], radish [22], wheat [48], and pepper [49]. The number of GST family members and the number of subfamilies vary in different plant species. There are 61 GST genes involved in six subfamilies in Citrus sinensis [46], 90 GST genes involved in 10 subfamilies in tomato [28], and 69 GST genes involved in nine subfamilies in apple [36]. In this research, 57 PcGST genes were identified in European pear and were divided into 10 subfamilies. The different members and subfamilies might be caused by species specificity.
Whole-genome duplication, segmental duplication, and tandem duplication events were the main sources of expansion of new genes and gene families [50]. In this research, two manners of duplication events in PcGST genes were identified, and the number of segmental duplication events was more than tandem duplication event, which was consistent with SlGST genes in tomato [28]. Collinearity analysis revealed the evolutionary relationship among GST genes in different species. More than three-fifths of the PcGST genes had collinear relationships with apple GST genes, while less than half of the PcGST genes had collinear relationships with Arabidopsis GST genes. This may be due to the close genetic relationship between pear and apple, as they are both Rosaceae species. Some GST genes were only present in Arabidopsis or apple gene pairs, indicating that they might have been lost in their ancestors during evolution or may have been generated by species differentiation. Interestingly, some PcGST genes had multiple counterparts in apple, and these genes might have undergone different amplification processes during evolution.
GST genes in the same group with similar exon/intron structures and conserved motifs may have similar functions. PcGST57 was clustered in the Phi family and grouped with MdGSTF6, PpGST1, and GST members associated with anthocyanin accumulation, which supports the accuracy of our analysis. Interestingly, some GST members within the same subfamily shared different conserved motifs and exon/intron structures, indicating specific functions. More than half of the PcGST genes contained no more than three exons, which was consistent with previous studies [28,51], indicating the conservation of the GST family during evolution.
The application of exogenous Glu has been shown to promote anthocyanin accumulation in ‘Fuji’ apple and peach leaves [52,53]. Exogenous Glu promoted peel coloring and total sugar accumulation in litchi [54]. Our research indicated that Glu could induce anthocyanin accumulation in pear. RNA-seq also revealed that most structural genes and partial regulatory genes were induced by Glu treatment (Figure 6), and most GST genes showed upregulation, suggesting the important role of the GST family in Glu-induced anthocyanin accumulation.
The GST genes in the same subfamily sharing the same conserved domain may have similar functions. The Tau subfamily, as the biggest GST subclass, was reported to be related to xenobiotic metabolism and detoxification [55]. The Phi subfamily is a plant-specific class, and most GST genes in the Phi subfamily were reported to be related to anthocyanin transportation. The Phi subfamily GST members in Arabidopsis, apple, peach, strawberry, and other species have been associated with anthocyanin accumulation. PcGST57 exhibited a close relationship with AtGSTF12 (AtTT19), which transports anthocyanins from the cytosol to the vacuole as a carrier protein [56]. In our research, PcGST57 was clustered with most Phi subfamily members and participated in anthocyanin accumulation, which was consistent with the function of GST genes in other plants.
The expression of PcGST57 was significantly induced by more than 18-fold under Glu treatment (Figure 6). In pear cultivars with different colors, the expression level of PcGST57 showed a positive correlation with peel color, and PcGST57 showed a significantly higher expression level in peels than in other tissues. Similarly, the expression of PcGST57 increased in the early stage of fruit development, reaching the highest level in the fruit color transition period (more than 500-fold), and then gradually decreased but still maintained a high expression pattern (Figure 8). These results indicate that PcGST57 might be vital in anthocyanin accumulation in peels rather than in other tissues.
Although our research showed that Glu could promote anthocyanin accumulation in red blush pear, it was unclear how plants respond to Glu signals to regulate the expression of PcGST57 and other genes. Glu can be converted into intermediate substances, such as 5-aminolevulinic acid (ALA), which is the synthetic precursor of plant phytochromes, and can regulate anthocyanin synthesis [57]. Glu can also increase the sugar content in fruits, which could provide an abundant sugar base for anthocyanin synthesis [54,58]. In plants, many secondary metabolites are essential for targeting vacuoles for their phytotoxic characteristics, even for cells that produce them [59]. Anthocyanin retention in the cytoplasm is toxic to the cell and prevents the biosynthesis of new anthocyanins [30]. Some studies have shown that GST functions by directly binding to anthocyanins or transferring glutathione to anthocyanins to form glutathione S-conjugates [30,31]. Anthocyanin accumulation in the cytoplasm drives PcGST57 to transport anthocyanins. This might be why pear peels respond to Glu signals to regulate the expression of PcGST57, affecting anthocyanin accumulation, but further experimental verification is required.
Most PcGST members were induced by Glu application and were upregulated in RNA-seq analysis. It has been reported in many plants that anthocyanin-related GST genes could be activated by MYB transcription factors. Overexpression of PAP1 activated the expression of TT19 in Arabidopsis, which was required for anthocyanin transportation [60]. LcMYB1 was involved in anthocyanin accumulation by activating the expression of LcGST4 in litchi, and two MYB binding sites were found in the promoter region of LcGST4 [8]. LhMYB12-lat could improve anthocyanin transportation by upregulating the transcriptional activity of LhGST and activating LcGST expression in lilies [11]. PpMYB10.1 could bind to the promoter and transactivate the transcription of anthocyanin-related PpGST1 [20]. Ten MYB binding sites were identified in PcGST57 (Figure 5), indicating that the expression of PcGST57 might be regulated by MYB transcription factors, further affecting anthocyanin accumulation. Whether MYB transcription factors directly regulate PcGST57 in pear involving anthocyanin accumulation remains to be further studied.

4. Materials and Methods

4.1. Plant Materials

The red blush pear ‘Danxiahong’ was planted in the orchard of Zhengzhou Fruit Research Institute, Chinese Academy of Agricultural Sciences, and was used as the experimental material. The green fruits of ‘Danxiahong’ pear that were not in direct sunlight were collected 20 days before full maturity on 30 July 2020 from six-year-old pear trees. The fruits were treated with distilled water or a 0.06% glutamic acid (Glu) solution and then incubated in a light incubator with continuous light and 80% relative humidity at 17 °C, as described by Bai et al. [61]. The peels were collected at indicated time points, including 0, 3, 12, 24, and 72 h for RNA extraction and RNA-seq analysis. RNA-seq reads were aligned to the Pyrus communis ‘Bartlett’ DH Genome v2.0 from Genome Database for Rosaceae (GDR, https://www.rosaceae.org/, accessed on 5 December 2020).
Tender leaves, floral shoots, floral receptacles, anthers, and petals were sampled at 0 day after full blossom (DAF) from the ‘Danxiahong’ pear tree. Young fruits were first collected at 10 DAF, and then the peels and flesh were collected every two weeks until fruit maturity. These samples were immediately frozen in liquid nitrogen and transferred to a −80 °C freezer for further RNA extraction and transcription analysis.

4.2. Identification and Chromosomal Location of Pear PcGST Genes

The genome data of pear (Pyrus communis ‘Bartlett’ DH Genome v2.0) and apple (Malus domestica GDDH13 v1.1) were downloaded from the Genome Database for Rosaceae (GDR, https://www.rosaceae.org/, accessed on 5 December 2020). Arabidopsis genome data was downloaded from the Arabidopsis Information Resource (TAIR, https://www.arabidopsis.org/index.jsp, accessed on 5 December 2020). Hidden Markov Model (HMM) profiles (PF00043 and PF02798) were obtained from the Pfam database (http://pfam.xfam.org/, accessed on 18 January 2021), and the PcGST candidate genes were identified using HMMER 3.0 software. Genes obtained by the BLAST program with E-values under the threshold of 10−5 were used for further filter analysis. The online CD search (https://www.ncbi.nlm.nih.gov/Structure/cdd/wrpsb.cgi, accessed on 3 February 2021) and Pfam search were used to examine the GST domain and further identify candidate GST genes.
The chromosomal location of PcGST genes was obtained from the ‘Bartlett’ pear genome in the GDR database. PcGST genes were mapped to pear chromosomes by MapInspect software (https://mapinspect.software.informer.com, accessed on 12 February 2021).

4.3. Phylogenetic and Evolutionary Analysis of Pear PcGST Genes

The GST protein sequences of pear and Arabidopsis were aligned using the Clustal X version 2.0 program. A phylogenetic tree was constructed to analyze the evolutionary relationships of the GST genes using the neighbor-joining method with 1000 bootstrap by MEGAX [38].
The Multiple Collinearity Scan toolkit (MCScanX) was used for collinear analysis, and the replication patterns of PcGST genes were analyzed according to the method of Wang et al. [62]. The collinear relationship of the PcGST genes was visualized using the advanced circus and multiple synteny plot packages in TBtools [63].

4.4. Gene Structure and Cis-Element Analysis of PcGST Members

The conserved domain and exon/intron structure organization of PcGST genes were determined by Gene Structure Display Server 2.0 (GSDS: http://gsds.cbi.pku.edu.cn/, accessed on 2 March 2021). The conserved motifs of PcGST proteins were determined by MEME online software version 5.4.1 (https://meme-suite.org/meme/tools/meme, accessed on 15 March 2021). The gene structure of the PcGST genes was visualized using the gene structure view package in TBtools.
For cis-element analysis, a 2000-bp sequence 5′ upstream from the start codon of the PcGST gene was extracted from the Pyrus communis ‘Bartlett’ DH Genome by TBtools [63], and the cis-acting elements were identified by the online database PlantCARE (http://bioinformatics.psb.ugent.be/webtools/plantcare/html/, accessed on 3 April 2021).

4.5. RNA Isolation and Transcript Analysis

Total RNA was extracted from the pear peel using an RNA Extraction Kit (Zoman, Beijing, China) according to the manufacturer’s protocol. The genomic DNA was removed by DNase I (Zoman, Beijing, China), and the first-strand cDNA was synthesized using TransScript One-Step gDNA Removal and cDNA Synthesis SuperMix (TransGen Biotech, Beijing, China). RT-qPCR was performed with TransStart Top Green qPCR SuperMix (TransGen Biotech, Beijing, China) using the Roche LightCycler 480 system (Roche, Basel, Switzerland) according to the manufacturer’s instructions. The pear PcTubulin gene was used as an internal control for gene expression analysis. Transcript levels were analyzed using the 2−ΔΔCt method [64]. The primers used for RT-qPCR are listed in Table S3. The heatmap package of TBtools was conducted to analyze the expression level of PcGST genes based on the RNA-seq data.

4.6. Functional Characterization of PcGST57 by Transient Expression

For the transient overexpression assay, the full-length coding sequence of PcGST57 was inserted into the multiple cloning site (MCS; NcoI) of the pCAMBIA1302 vector driven by the cauliflower mosaic virus (CaMV) 35S promoter (PcGST57-OE). For the virus-induced gene silencing (VIGS) assay, the specific 300 bp PcGST57 fragment was inserted into the MCS (EcoRI and KpnI) of the pTRV2 VIGS vector to generate the PcGST57-VIGS vector. The recombinant plasmids were separately transformed into Agrobacterium tumefaciens strain GV3101 cells. Needle-free syringes were used to inject the ‘Danxiahong’ pear fruit before the color transition period with the transformed A. tumefaciens cells containing recombinant or empty vectors. The fruits were sampled for phenotypic observation, anthocyanin and phenol determination, and gene expression analysis for 15 days after injection. At least 30 fruits were injected for each strain with the corresponding vector, and the transient expression assays were repeated three times.

4.7. Measurement of Anthocyanin and Total Phenol Content

Anthocyanins were extracted from the peels of injected pear fruits, and the anthocyanin content was measured as described by Wang et al. [52] with minor modifications. Approximately 200 mg of peels were frozen in liquid nitrogen and ground into powders, then 1 mL methanol solution containing 1% (v/v) HCl was added in the tube and incubated at 4 °C in the dark for 1 h. The tubes were centrifuged at 9500× g at 4 °C for 10 min, then the supernatant was transferred to a new tube for anthocyanin measurement. The absorbance was measured at 530 and 600 nm with SpectraMax i3x Multi-Mode Detection Platform (Molecular Devices, USA).The total phenol content was determined as described by Xu et al. [65].

4.8. Statistical Analysis

Experiments in the research were repeated for at least three times, the data exhibited as the mean ± SD from three independent replicates. Significant differences were analyzed by Student’s t-test, and the significance between corresponding controls was labeled with * (p < 0.05) or ** (p < 0.01).

4.9. Accession Numbers

Sequence data from this work can be found in the NCBI database (BioProject ID: PRJNA781276).

5. Conclusions

We identified 57 GST genes in the Pyrus communis ‘Bartlett’ DH genome and divided them into 10 subfamilies. RNA-seq analysis showed that PcGST57 was significantly induced by Glu treatment. PcGST57 was closely related to MdGSTF6 and PpGST1 and other GST genes, which were involved in anthocyanin accumulation in other species. PcGST57 was associated with peel coloration rather than other tissues. Transient overexpression and silencing of PcGST57 in ‘Danxiahong’ pear improved and decreased coloration, respectively. The results indicated that PcGST57 is involved in anthocyanin accumulation in pear.

Supplementary Materials

The following are available online at https://www.mdpi.com/article/10.3390/ijms23020746/s1.

Author Contributions

H.X. designed and supervised the project. B.L. and X.Z. performed most experiments, analyzed the data and wrote the manuscript, R.D. and C.H. performed partial experiments, J.Y. and L.W. (Long Wang) provided scientific suggestions, S.W., Y.S. and Y.D. contributed to plant materials, reagents, and tools. L.W. (Lei Wang) revised the manuscript. All authors have read and agreed to the published version of the manuscript.

Funding

This research was financially supported by the National Natural Science Foundation of China (31971691), China Agriculture Research System of MOF and MARA, Central Public-Interest Scientific Institution Basal Research Fund (1610192021302), Collaborative Innovation Project of ZFRI, CAAS (ZGS202107), the Agricultural Science and Technology Innovation Program (CAAS-ASTIP), National Key R&D Program of China (2019YFD1001401), and Natural Science Foundation of Henan Province, China (202300410556).

Institutional Review Board Statement

Not applicable.

Informed Consent Statement

Not applicable.

Data Availability Statement

The datasets are available in the Sequence Read Archive (BioProject ID: PRJNA781276).

Conflicts of Interest

The authors declare no conflict of interest.

References

  1. Xue, H.; Wang, S.; Yao, J.L.; Zhang, X.; Yang, J.; Wang, L.; Su, Y.; Chen, L.; Zhang, H.; Li, X. The genetic locus underlying red foliage and fruit skin traits is mapped to the same location in the two pear bud mutants ‘Red Zaosu’ and ‘Max Red Bartlett’. Hereditas 2018, 155, 25. [Google Scholar] [CrossRef] [PubMed]
  2. Xue, H.; Shi, T.; Wang, F.; Zhou, H.; Yang, J.; Wang, L.; Wang, S.; Su, Y.; Zhang, Z.; Qiao, Y.; et al. Interval mapping for red/green skin color in Asian pears using a modified QTL-seq method. Hortic. Res. 2017, 4, 17053. [Google Scholar] [CrossRef] [PubMed] [Green Version]
  3. Takos, A.M.; Jaffe, F.W.; Jacob, S.R.; Bogs, J.; Robinson, S.P.; Walker, A.R. Light-induced expression of a MYB gene regulates anthocyanin biosynthesis in red apples. Plant Physiol. 2006, 142, 1216–1232. [Google Scholar] [CrossRef] [PubMed] [Green Version]
  4. Winkel-Shirley, B. Flavonoid biosynthesis. A colorful model for genetics, biochemistry, cell biology, and biotechnology. Plant Physiol. 2001, 126, 485–493. [Google Scholar] [CrossRef] [Green Version]
  5. Ma, Y.; Ma, X.; Gao, X.; Wu, W.; Zhou, B. Light Induced Regulation Pathway of Anthocyanin Biosynthesis in Plants. Int. J. Mol. Sci. 2021, 22, 11116. [Google Scholar] [CrossRef]
  6. Ubi, B.E.; Honda, C.; Bessho, H.; Kondo, S.; Wada, M.; Kobayashi, S.; Moriguchi, T. Expression analysis of anthocyanin biosynthetic genes in apple skin: Effect of UV-B and temperature. Plant Sci. 2006, 170, 571–578. [Google Scholar] [CrossRef]
  7. Harborne, J.B.; Williams, C.A. Advances in flavonoid research since 1992. Phytochemistry 2000, 55, 481–504. [Google Scholar] [CrossRef]
  8. Hu, B.; Zhao, J.; Lai, B.; Qin, Y.; Wang, H.; Hu, G. LcGST4 is an anthocyanin-related glutathione S-transferase gene in Litchi chinensis Sonn. Plant Cell Rep. 2016, 35, 831–843. [Google Scholar] [CrossRef]
  9. Holton, T.A.; Cornish, E.C. Genetics and Biochemistry of Anthocyanin Biosynthesis. Plant Cell 1995, 7, 1071–1083. [Google Scholar] [CrossRef]
  10. Gonzalez, A.; Zhao, M.; Leavitt, J.M.; Lloyd, A.M. Regulation of the anthocyanin biosynthetic pathway by the TTG1/bHLH/Myb transcriptional complex in Arabidopsis seedlings. Plant J. 2008, 53, 814–827. [Google Scholar] [CrossRef]
  11. Cao, Y.; Xu, L.; Xu, H.; Yang, P.; He, G.; Tang, Y.; Qi, X.; Song, M.; Ming, J. LhGST is an anthocyanin-related glutathione S-transferase gene in Asiatic hybrid lilies (Lilium spp.). Plant Cell Rep. 2021, 40, 85–95. [Google Scholar] [CrossRef]
  12. Zhao, J. Flavonoid transport mechanisms: How to go, and with whom. Trends Plant Sci. 2015, 20, 9. [Google Scholar] [CrossRef] [PubMed]
  13. Zhao, J.; Dixon, R.A. The ‘ins’ and ‘outs’ of flavonoid transport. Trends Plant Sci. 2010, 15, 2. [Google Scholar] [CrossRef] [PubMed] [Green Version]
  14. Zhang, H.; Wang, L.; Deroles, S.; Bennett, R.; Davies, K. New insight into the structures and formation of anthocyanic vacuolar inclusions in flower petals. BMC Plant Biol. 2006, 6, 29. [Google Scholar] [CrossRef] [PubMed] [Green Version]
  15. Poustka, F.; Irani, N.G.; Feller, A.; Lu, Y.; Pourcel, L.; Frame, K.; Grotewold, E. A trafficking pathway for anthocyanins overlaps with the endoplasmic reticulum-to-vacuole protein-sorting route in Arabidopsis and contributes to the formation of vacuolar inclusions. Plant Physiol. 2007, 145, 1323–1335. [Google Scholar] [CrossRef] [Green Version]
  16. Baxter, I.R.; Young, J.C.; Armstrong, G.; Foster, N.; Bogenschutz, N.; Cordova, T.; Peer, W.A.; Hazen, S.P.; Murphy, A.S.; Harper, J.F. A plasma membrane H+-ATPase is required for the formation of proanthocyanidins in the seed coat endothelium of Arabidopsis thaliana. Proc. Natl. Acad. Sci. USA 2005, 102, 2649–2654. [Google Scholar] [CrossRef] [Green Version]
  17. Goodman, C.D.; Casati, P.; Walbot, V. A multidrug resistance-associated protein involved in anthocyanin transport in Zea mays. Plant Cell 2004, 16, 1812–1826. [Google Scholar] [CrossRef] [Green Version]
  18. Gomez, C.; Terrier, N.; Torregrosa, L.; Vialet, S.; Fournier-Level, A.; Verries, C.; Souquet, J.M.; Mazauric, J.P.; Klein, M.; Cheynier, V.; et al. Grapevine MATE-type proteins act as vacuolar H+-dependent acylated anthocyanin transporters. Plant Physiol. 2009, 150, 402–415. [Google Scholar] [CrossRef] [Green Version]
  19. Shao, D.; Li, Y.; Zhu, Q.; Zhang, X.; Liu, F.; Xue, F.; Sun, J. GhGSTF12, a glutathione S-transferase gene, is essential for anthocyanin accumulation in cotton (Gossypium hirsutum L.). Plant Sci. 2021, 305, 110827. [Google Scholar] [CrossRef]
  20. Zhao, Y.; Dong, W.; Zhu, Y.; Allan, A.C.; Lin-Wang, K.; Xu, C. PpGST1, an anthocyanin-related glutathione S-transferase gene, is essential for fruit coloration in peach. Plant Biotechnol. J. 2020, 18, 1284–1295. [Google Scholar] [CrossRef] [Green Version]
  21. Lin, Y.; Zhang, L.; Zhang, J.; Zhang, Y.; Wang, Y.; Chen, Q.; Luo, Y.; Zhang, Y.; Li, M.; Wang, X.; et al. Identification of Anthocyanins-Related Glutathione S-Transferase (GST) Genes in the Genome of Cultivated Strawberry (Fragaria × ananassa). Int. J. Mol. Sci. 2020, 21, 8708. [Google Scholar] [CrossRef]
  22. Gao, J.; Chen, B.; Lin, H.; Liu, Y.; Wei, Y.; Chen, F.; Li, W. Identification and characterization of the glutathione S-Transferase (GST) family in radish reveals a likely role in anthocyanin biosynthesis and heavy metal stress tolerance. Gene 2020, 743, 144484. [Google Scholar] [CrossRef]
  23. Mueller, L.A.; Goodman, C.D.; Silady, R.A.; Walbot, V. AN9, a petunia glutathione S-transferase required for anthocyanin sequestration, is a flavonoid-binding protein. Plant Physiol. 2000, 123, 1561–1570. [Google Scholar] [CrossRef] [Green Version]
  24. Dixon, D.P.; Lapthorn, A.; Edwards, R. Plant glutathione transferases. Genome Biol. 2002, 3, reviews3004.1. [Google Scholar] [CrossRef] [Green Version]
  25. Vaish, S.; Gupta, D.; Mehrotra, R.; Mehrotra, S.; Basantani, M.K. Glutathione S-transferase: A versatile protein family. 3 Biotech 2020, 10, 321. [Google Scholar] [CrossRef] [PubMed]
  26. Andrews, C.J.; Cummins, I.; Skipsey, M.; Grundy, N.M.; Jepson, I.; Townson, J.; Edwards, R. Purification and characterisation of a family of glutathione transferases with roles in herbicide detoxification in soybean (Glycine max L.); selective enhancement by herbicides and herbicide safeners. Pestic. Biochem. Physiol. 2005, 82, 205–219. [Google Scholar] [CrossRef]
  27. Dixon, D.P.; Cummins, L.; Cole, D.J.; Edwards, R. Glutathione-mediated detoxification systems in plants. Curr. Opin. Plant Biol. 1998, 1, 258–266. [Google Scholar] [CrossRef]
  28. Islam, S.; Rahman, I.A.; Islam, T.; Ghosh, A. Genome-wide identification and expression analysis of glutathione S-transferase gene family in tomato: Gaining an insight to their physiological and stress-specific roles. PLoS ONE 2017, 12, e0187504. [Google Scholar] [CrossRef] [Green Version]
  29. Chronopoulou, E.; Madesis, P.; Tsaftaris, A.; Labrou, N.E. Cloning and characterization of a biotic-stress-inducible glutathione transferase from Phaseolus vulgaris. Appl. Biochem. Biotechnol. 2014, 172, 595–609. [Google Scholar] [CrossRef] [PubMed] [Green Version]
  30. Marrs, K.A.; Alfenito, M.R.; Lloyd, A.M.; Walbot, V. A glutathione S-transferase involved in vacuolar transfer encoded by the maize gene Bronze-2. Nature 1995, 375, 397–400. [Google Scholar] [CrossRef] [PubMed]
  31. Alfenito, M.R.; Souer, E.; Goodman, C.D.; Buell, R.; Mol, J.; Koes, R.; Walbot, V. Functional complementation of anthocyanin sequestration in the vacuole by widely divergent glutathione S-transferases. Plant Cell 1998, 10, 1135–1149. [Google Scholar] [CrossRef] [Green Version]
  32. Kitamura, S.; Shikazono, N.; Tanaka, A. TRANSPARENT TESTA 19 is involved in the accumulation of both anthocyanins and proanthocyanidins in Arabidopsis. Plant J. 2004, 37, 104–114. [Google Scholar] [CrossRef]
  33. Kitamura, S.; Akita, Y.; Ishizaka, H.; Narumi, I.; Tanaka, A. Molecular characterization of an anthocyanin-related glutathione S-transferase gene in cyclamen. J. Plant Physiol. 2012, 169, 636–642. [Google Scholar] [CrossRef]
  34. Perez-Diaz, R.; Madrid-Espinoza, J.; Salinas-Cornejo, J.; Gonzalez-Villanueva, E.; Ruiz-Lara, S. Differential Roles for VviGST1, VviGST3, and VviGST4 in Proanthocyanidin and Anthocyanin Transport in Vitis vinifera. Front. Plant Sci. 2016, 7, 1166. [Google Scholar] [CrossRef] [Green Version]
  35. Luo, H.; Dai, C.; Li, Y.; Feng, J.; Liu, Z.; Kang, C. Reduced Anthocyanins in Petioles codes for a GST anthocyanin transporter that is essential for the foliage and fruit coloration in strawberry. J. Exp. Bot. 2018, 69, 2595–2608. [Google Scholar] [CrossRef] [Green Version]
  36. Jiang, S.; Chen, M.; He, N.; Chen, X.; Wang, N.; Sun, Q.; Zhang, T.; Xu, H.; Fang, H.; Wang, Y.; et al. MdGSTF6, activated by MdMYB1, plays an essential role in anthocyanin accumulation in apple. Hortic. Res. 2019, 6, 40. [Google Scholar] [CrossRef] [Green Version]
  37. Bouvier, L.; Guérif, P.; Djulbic, M.; Durel, C.-E.; Chevreau, E.; Lespinasse, Y. Chromosome doubling of pear haploid plants and homozygosity assessment using isozyme and microsatellite markers. Euphytica 2002, 123, 255–262. [Google Scholar] [CrossRef]
  38. Liu, C.; Hao, J.; Qiu, M.; Pan, J.; He, Y. Genome-wide identification and expression analysis of the MYB transcription factor in Japanese plum (Prunus salicina). Genomics 2020, 112, 4875–4886. [Google Scholar] [CrossRef]
  39. Conn, S.; Curtin, C.; Bezier, A.; Franco, C.; Zhang, W. Purification, molecular cloning, and characterization of glutathione S-transferases (GSTs) from pigmented Vitis vinifera L. cell suspension cultures as putative anthocyanin transport proteins. J. Exp. Bot. 2008, 59, 3621–3634. [Google Scholar] [CrossRef] [Green Version]
  40. Zhang, Z.; Shi, Y.; Ma, Y.; Yang, X.; Yin, X.; Zhang, Y.; Xiao, Y.; Liu, W.; Li, Y.; Li, S.; et al. The strawberry transcription factor FaRAV1 positively regulates anthocyanin accumulation by activation of FaMYB10 and anthocyanin pathway genes. Plant Biotechnol. J. 2020, 18, 2267–2279. [Google Scholar] [CrossRef] [Green Version]
  41. Wilce, M.C.; Parker, M.W. Structure and function of glutathione S-transferases. Biochim. Biophys. Acta 1994, 1205, 1–18. [Google Scholar] [CrossRef]
  42. Frear, D.S.; Swanson, H.R. Biosynthesis of S-(4-ethylamino-6-isopropylamino-2-s-triazino) glutathione: Partial purification and properties of a glutathione S-transferase from corn. Phytochemistry 1970, 9, 2123–2132. [Google Scholar] [CrossRef]
  43. Droog, F. Plant glutathione S-transferases, a tale of theta and tau. J. Plant Growth Regul. 1997, 16, 95–107. [Google Scholar] [CrossRef]
  44. McGonigle, B.; Keeler, S.J.; Lau, S.M.; Koeppe, M.K.; O’Keefe, D.P. A genomics approach to the comprehensive analysis of the glutathione S-transferase gene family in soybean and maize. Plant Physiol. 2000, 124, 1105–1120. [Google Scholar] [CrossRef] [Green Version]
  45. Wagner, U.; Edwards, R.; Dixon, D.P.; Mauch, F. Probing the diversity of the Arabidopsis glutathione S-transferase gene family. Plant Mol. Biol. 2002, 49, 515–532. [Google Scholar] [CrossRef]
  46. Licciardello, C.; D’Agostino, N.; Traini, A.; Recupero, G.R.; Frusciante, L.; Chiusano, M.L. Characterization of the glutathione S-transferase gene family through ESTs and expression analyses within common and pigmented cultivars of Citrus sinensis (L.) Osbeck. BMC Plant Biol. 2014, 14, 39. [Google Scholar] [CrossRef] [Green Version]
  47. Liu, Y.; Qi, Y.; Zhang, A.; Wu, H.; Liu, Z.; Ren, X. Molecular cloning and functional characterization of AcGST1, an anthocyanin-related glutathione S-transferase gene in kiwifruit (Actinidia chinensis). Plant Mol. Biol. 2019, 100, 451–465. [Google Scholar] [CrossRef]
  48. Hao, Y.; Xu, S.; Lyu, Z.; Wang, H.; Kong, L.; Sun, S. Comparative Analysis of the Glutathione S-Transferase Gene Family of Four Triticeae Species and Transcriptome Analysis of GST Genes in Common Wheat Responding to Salt Stress. Int. J. Genom. 2021, 2021, 6289174. [Google Scholar] [CrossRef]
  49. Islam, S.; Sajib, S.D.; Jui, Z.S.; Arabia, S.; Islam, T.; Ghosh, A. Genome-wide identification of glutathione S-transferase gene family in pepper, its classification, and expression profiling under different anatomical and environmental conditions. Sci. Rep. 2019, 9, 9101. [Google Scholar] [CrossRef]
  50. Rensing, S.A. Gene duplication as a driver of plant morphogenetic evolution. Curr. Opin. Plant Biol. 2014, 17, 43–48. [Google Scholar] [CrossRef]
  51. Fang, X.; An, Y.; Zheng, J.; Shangguan, L.; Wang, L. Genome-wide identification and comparative analysis of GST gene family in apple (Malus domestica) and their expressions under ALA treatment. 3 Biotech 2020, 10, 307. [Google Scholar] [CrossRef]
  52. Wang, L.; Wang, Z.; LI, Z.; Zhu, Y. Promotion of L-Glutamic acid on anthocyanin accumulation of Fuji apples. J. Fruit Sci. 2006, 23, 157–160. [Google Scholar] [CrossRef]
  53. Han, J.; Shang, G.; Zhang, B.; Weng, M.; Xie, Z.; Jiang, W. Effects of foliar spraying of L-glutamic acid and rhamnose solution on changes of pigment content and physiological properties in leaves of red-leaf peach in summer. J. Nanjing Agric. Univ. 2013, 35, 19–24. [Google Scholar] [CrossRef]
  54. Zeng, L.; Liao, J.; Chen, H. Effects of glutamic acid and TDZ (Thidiazuron) on the fruit coloration and quality of Litchi Chinensis Sonn. J. Trop. Subtrop. Bot. 2012, 20, 382–387. [Google Scholar] [CrossRef]
  55. Thom, R.; Cummins, I.; Dixon, D.P.; Edwards, R.; Cole, D.J.; Lapthorn, A.J. Structure of a tau class glutathione S-transferase from wheat active in herbicide detoxification. Biochemistry 2002, 41, 7008–7020. [Google Scholar] [CrossRef]
  56. Li, X.; Gao, P.; Cui, D.; Wu, L.; Parkin, I.; Saberianfar, R.; Menassa, R.; Pan, H.; Westcott, N.; Gruber, M.Y. The Arabidopsis tt19-4 mutant differentially accumulates proanthocyanidin and anthocyanin through a 3′ amino acid substitution in glutathione S-transferase. Plant Cell Environ. 2011, 34, 374–388. [Google Scholar] [CrossRef]
  57. Saure, M.C. External control of anthocyanin formation in apple. Sci. Hortic. 1990, 42, 181–218. [Google Scholar] [CrossRef]
  58. Kim, S.H.; Lee, J.R.; Hong, S.T.; Yoo, Y.K.; An, G.; Kim, S.R. Molecular cloning and analysis of anthocyanin biosynthesis genes preferentially expressed in apple skin. Plant Sci. 2003, 165, 403–413. [Google Scholar] [CrossRef]
  59. Martinoia, E.; Grill, E.; Tommasini, R.; Kreuz, K.; Amrhein, N. ATP-dependent glutathione S-conjugate ‘export’ pump in the vacuolar membrane of plants. Nature 1993, 364, 247–249. [Google Scholar] [CrossRef]
  60. Tohge, T.; Nishiyama, Y.; Hirai, M.Y.; Yano, M.; Nakajima, J.; Awazuhara, M.; Inoue, E.; Takahashi, H.; Goodenowe, D.B.; Kitayama, M.; et al. Functional genomics by integrated analysis of metabolome and transcriptome of Arabidopsis plants over-expressing an MYB transcription factor. Plant J. 2005, 42, 218–235. [Google Scholar] [CrossRef]
  61. Bai, S.; Tao, R.; Tang, Y.; Yin, L.; Ma, Y.; Ni, J.; Yan, X.; Yang, Q.; Wu, Z.; Zeng, Y.; et al. BBX16, a B-box protein, positively regulates light-induced anthocyanin accumulation by activating MYB10 in red pear. Plant Biotechnol. J. 2019, 17, 1985–1997. [Google Scholar] [CrossRef] [PubMed] [Green Version]
  62. Wang, Y.; Tang, H.; Debarry, J.D.; Tan, X.; Li, J.; Wang, X.; Lee, T.H.; Jin, H.; Marler, B.; Guo, H.; et al. MCScanX: A toolkit for detection and evolutionary analysis of gene synteny and collinearity. Nucleic Acids Res. 2012, 40, e49. [Google Scholar] [CrossRef] [Green Version]
  63. Chen, C.; Chen, H.; Zhang, Y.; Thomas, H.R.; Frank, M.H.; He, Y.; Xia, R. TBtools: An Integrative Toolkit Developed for Interactive Analyses of Big Biological Data. Mol. Plant 2020, 13, 1194–1202. [Google Scholar] [CrossRef]
  64. Livak, K.J.; Schmittgen, T.D. Analysis of relative gene expression data using real-time quantitative PCR and the 2−∆∆CT methods. Methods 2001, 25, 402–408. [Google Scholar] [CrossRef] [PubMed]
  65. Xu, F.; Dong, S.; Xu, Q.; Liu, S. Control of brown heart in Huangguan pears with 1-methylcyclopropene microbubbles treatment. Sci. Hortic. 2020, 259, 108820. [Google Scholar] [CrossRef]
Figure 1. Phylogenetic analysis of GST genes from European pear and Arabidopsis. An unrooted phylogenetic tree was constructed using the full-length protein sequences of GST by MEGAX using neighbor-joining method, with 1000 bootstrap replicates. The branches with different colors indicates 10 subfamilies of GST proteins.
Ijms 23 00746 g001
Figure 2. The chromosomal locations of PcGST genes in European pear. The position of PcGST genes was mapped to pear chromosomes based on the location information obtained from the genome of ‘Bartlett’ DH.
Ijms 23 00746 g002
Figure 3. Collinearity analysis of the pear PcGST gene family. (A) Collinearity relationships of PcGST genes in pear genome. The panel exhibited 17 pear chromosomes in a circle with red lines connecting PcGST genes with WGD/segmental duplication events. Chromosome numbers were indicated on the circle with blue color. The PcGST genes were mapped to the chromosomes outside the circle. (B) Collinearity relationships of PcGST genes in pear, Arabidopsis, and apple. The blue lines indicated the PcGST genes with homologous relationship with Arabidopsis or apple.
Ijms 23 00746 g003
Figure 4. Structure and conserved domain analysis of PcGST genes. (A) Phylogenetic relationship and conserved motif analysis of PcGST genes. The boxes with different colors indicated different motifs. (B) Exon–intron structure and conserved domain analysis of PcGST genes. The conserved GST domains were exhibited with indicated colors, and the introns were shown as black lines.
Ijms 23 00746 g004
Figure 5. Cis-elements analysis in the promoter region of PcGST genes. The 2-kb of 5′ flanking sequence upstream from the start codon was obtained for analysis, and the boxes with different colors indicated different cis-elements.
Ijms 23 00746 g005
Figure 6. Heatmap of transcript profiles of PcGST genes in response to Glu treatment at indicated time points. The transcript abundance of PcGST genes was represented by different colors. The red and blue color on the panel indicate high and low expression, respectively. The data was obtained from three biological replicates.
Ijms 23 00746 g006
Figure 7. Phylogenetic analysis and sequence alignment of PcGST57 and its paralogs. (A) Phylogenetic relationships of PcGST57 paralogs was shown by phylogenetic tree. GST proteins from Pyrus communis, Malus domestica, Arabidopsis, Prunus persica, Fragaria ananassa, and several other species were used for the construction of a neighbor-joining tree. (B) Sequence alignment of PcGST57 and its paralogs. The GST domain with accession number of cl31543 was indicated by blue box, the red box indicated as GST-N domain with accession number of cd03058, and green box indicated as GST-C domain with accession number of cd03185. The accession number of GST members used in the analysis were as follows, MdGSTF6 (MD17G1272100), PpGST1 (Prupe.3G013600.1), FvRAP (gene31672), VviGST4 (AAX81329), LcGST4 (ALY05893), PfGST1 (BAG14300), CkmGST3 (BAM14584), PhAN9 (CAA68993), IbGSTF4 (MG873448), AtGSTF12 (AED92398), ZmBZ2 (AAA50245), and GmGST26A (NP_001238439).
Ijms 23 00746 g007
Figure 8. The transcript patterns of PcGST57. (A) Transcript analysis of PcGST57 in different pears. Pears, including ‘Zaosu’, ‘Mansoo’, ‘Danxiahong’, ‘Red Clapp’s Favorite’, and ‘Red Zaosu’, with different colors were selected for analysis. (B) Transcript analysis of PcGST57 in various pear tissues of ‘Danxiahong’. Various pear tissues of ‘Danxiahong’, including floral shoot, floral receptacle, leaf, petal, and anther at 0 DAF, and peel, flesh of 100 DAF were sampled for transcript analysis. (C) Transcript analysis of PcGST57 in pear peels of ‘Danxiahong’ at different developmental periods. (D) Transcript analysis of PcGST57 in pear flesh of ‘Danxiahong’ at different developmental periods. PcTubulin was used as the internal control for gene expression analysis. All the data indicate means ± SD of three biological replicates.
Ijms 23 00746 g008
Figure 9. Functional identification of PcGST57 by transient expression in ‘Danxiahong’ pear peels. Transient overexpression (A) and TRV-mediated silencing (B) assays of PcGST57 in ‘Danxiahong’ pear peels. Transcript analysis of PcGST57 in overexpressing peels (C) and silencing peels (F). Measurement of anthocyanin content in PcGST57 overexpressing peels (D) and silencing peels (G). Measurement of total phenol content in PcGST57 overexpressing peels (E) and silencing peels (H). The photograph were captured 15-day post injection, and the peels around the injection sites were sampled for expression analysis and measurement of anthocyanin content and total phenol content. Pctubulin was used as the internal control for gene expression analysis. All the data indicate means ± SD of three biological replicates. Asterisks indicate statistical significance (*, p < 0.05; and **, p < 0.01) determined by student’s t-test compared with corresponding controls.
Ijms 23 00746 g009
Table 1. Molecular characteristics of the GST family genes identified in the ‘Bartlett’ DH pear genome.
Gene NameGene IDChromosome LocationCDS Length (bp)Amino Acid Length (aa)Isoelectric Point (pI)Molecular Weight (kDa)
PcGST1pycom01g14390Chr1:14570338-145726779123038.73 34.14
PcGST2pycom02g16660Chr2:13905061-139061093751246.04 13.86
PcGST3pycom02g20280Chr2:18414352-184153286602195.21 25.23
PcGST4pycom02g20290Chr2:18422356-184233336602195.19 25.04
PcGST5pycom02g20300Chr2:18435026-184360036602195.45 25.27
PcGST6pycom03g22330Chr3:22462862-224640015731906.66 21.33
PcGST7pycom03g22340Chr3:22484661-224860197922638.48 29.48
PcGST8pycom03g22350Chr3:22495188-224964197412469.38 27.94
PcGST9pycom03g22370Chr3:22518852-225201277322439.11 27.34
PcGST10pycom04g10330Chr4:13096341-130977625881955.82 22.40
PcGST11pycom04g10340Chr4:13102770-131039773661219.46 13.75
PcGST12pycom04g12760Chr4:15730309-157306613031009.10 11.60
PcGST13pycom05g16920Chr5:20182936-201837656662215.27 25.34
PcGST14pycom05g16930Chr5:20184941-2019065613654546.12 51.96
PcGST15pycom05g16940Chr5:20190776-201941796902295.96 26.86
PcGST16pycom05g19570Chr5:22475360-224762246632206.14 25.58
PcGST17pycom05g19590Chr5:22500115-225010776602195.28 25.27
PcGST18pycom05g19600Chr5:22511832-225128336602195.27 25.39
PcGST19pycom05g19620Chr5:22528365-225297247982655.68 30.74
PcGST20pycom05g19630Chr5:22532945-225341136602195.64 25.50
PcGST21pycom05g22990Chr5:25074385-2507670812664218.27 48.07
PcGST22pycom05g23030Chr5:25095525-2509911223617869.04 91.22
PcGST23pycom06g01020Chr6:1015178-10168746542176.36 24.45
PcGST24pycom06g07800Chr6:12765956-127697057922639.45 29.96
PcGST25pycom06g17080Chr6:21128796-211295706872285.86 26.05
PcGST26pycom06g20360Chr6:23436022-2343882411673888.90 42.74
PcGST27pycom07g06270Chr7:5539987-55407185221734.92 19.68
PcGST28pycom08g00510Chr8:453769-4546466572186.34 24.67
PcGST29pycom08g00850Chr8:661714-6636729753248.94 36.30
PcGST30pycom08g21180Chr8:20733707-2073668014374788.27 54.21
PcGST31pycom08g21730Chr8:21146282-211513906092026.10 22.84
PcGST32pycom09g06760Chr9:4995997-49973776782255.62 26.02
PcGST33pycom09g17830Chr9:18321111-183242407982658.78 29.32
PcGST34pycom10g14850Chr10:18226369-182271866602195.70 25.29
PcGST35pycom10g14860Chr10:18230656-182315156782256.11 25.86
PcGST36pycom10g14870Chr10:18235274-182362687382456.42 28.46
PcGST37pycom10g16980Chr10:20171035-201722476602195.55 25.42
PcGST38pycom10g19580Chr10:22635105-2263757611673886.38 44.02
PcGST39pycom11g26520Chr11:29074954-290756584831605.31 18.21
PcGST40pycom12g12570Chr12:15027339-150285173661219.45 13.74
PcGST41pycom13g07080Chr13:4692196-46930967022335.88 25.66
PcGST42pycom13g21680Chr13:18606904-186108179543175.27 35.80
PcGST43pycom14g19350Chr14:20703306-207039404291427.73 16.56
PcGST44pycom14g19760Chr14:21009613-210124109993328.28 36.49
PcGST45pycom15g00440Chr15:265642-2662703661217.69 13.54
PcGST46pycom15g12040Chr15:8191500-81925478042679.75 31.35
PcGST47pycom15g35830Chr15:35918255-3592236012244076.62 45.24
PcGST48pycom15g36060Chr15:36157385-361593839423139.06 34.82
PcGST49pycom15g38640Chr15:38398976-3840250116355449.30 61.98
PcGST50pycom15g39250Chr15:39135295-391390296962315.48 26.15
PcGST51pycom16g07010Chr16:4552487-45544996242075.15 22.69
PcGST52pycom16g19480Chr16:16579477-165804746662216.39 25.74
PcGST53pycom16g21400Chr16:19849382-198554129513165.62 36.15
PcGST54pycom17g12850Chr17:10560141-105626506302095.98 24.26
PcGST55pycom17g26130Chr17:24436789-244401047982658.94 29.30
PcGST56pycom17g26990Chr17:25250001-252510726632205.60 25.03
PcGST57pycom17g27080Chr17:25355973-253572976482155.50 24.54
Publisher’s Note: MDPI stays neutral with regard to jurisdictional claims in published maps and institutional affiliations.

