
Biochemical and Expression Analyses Revealed the Involvement of Proanthocyanidins and/or Their Derivatives in Fiber Pigmentation of Gossypium stocksii

 and
and 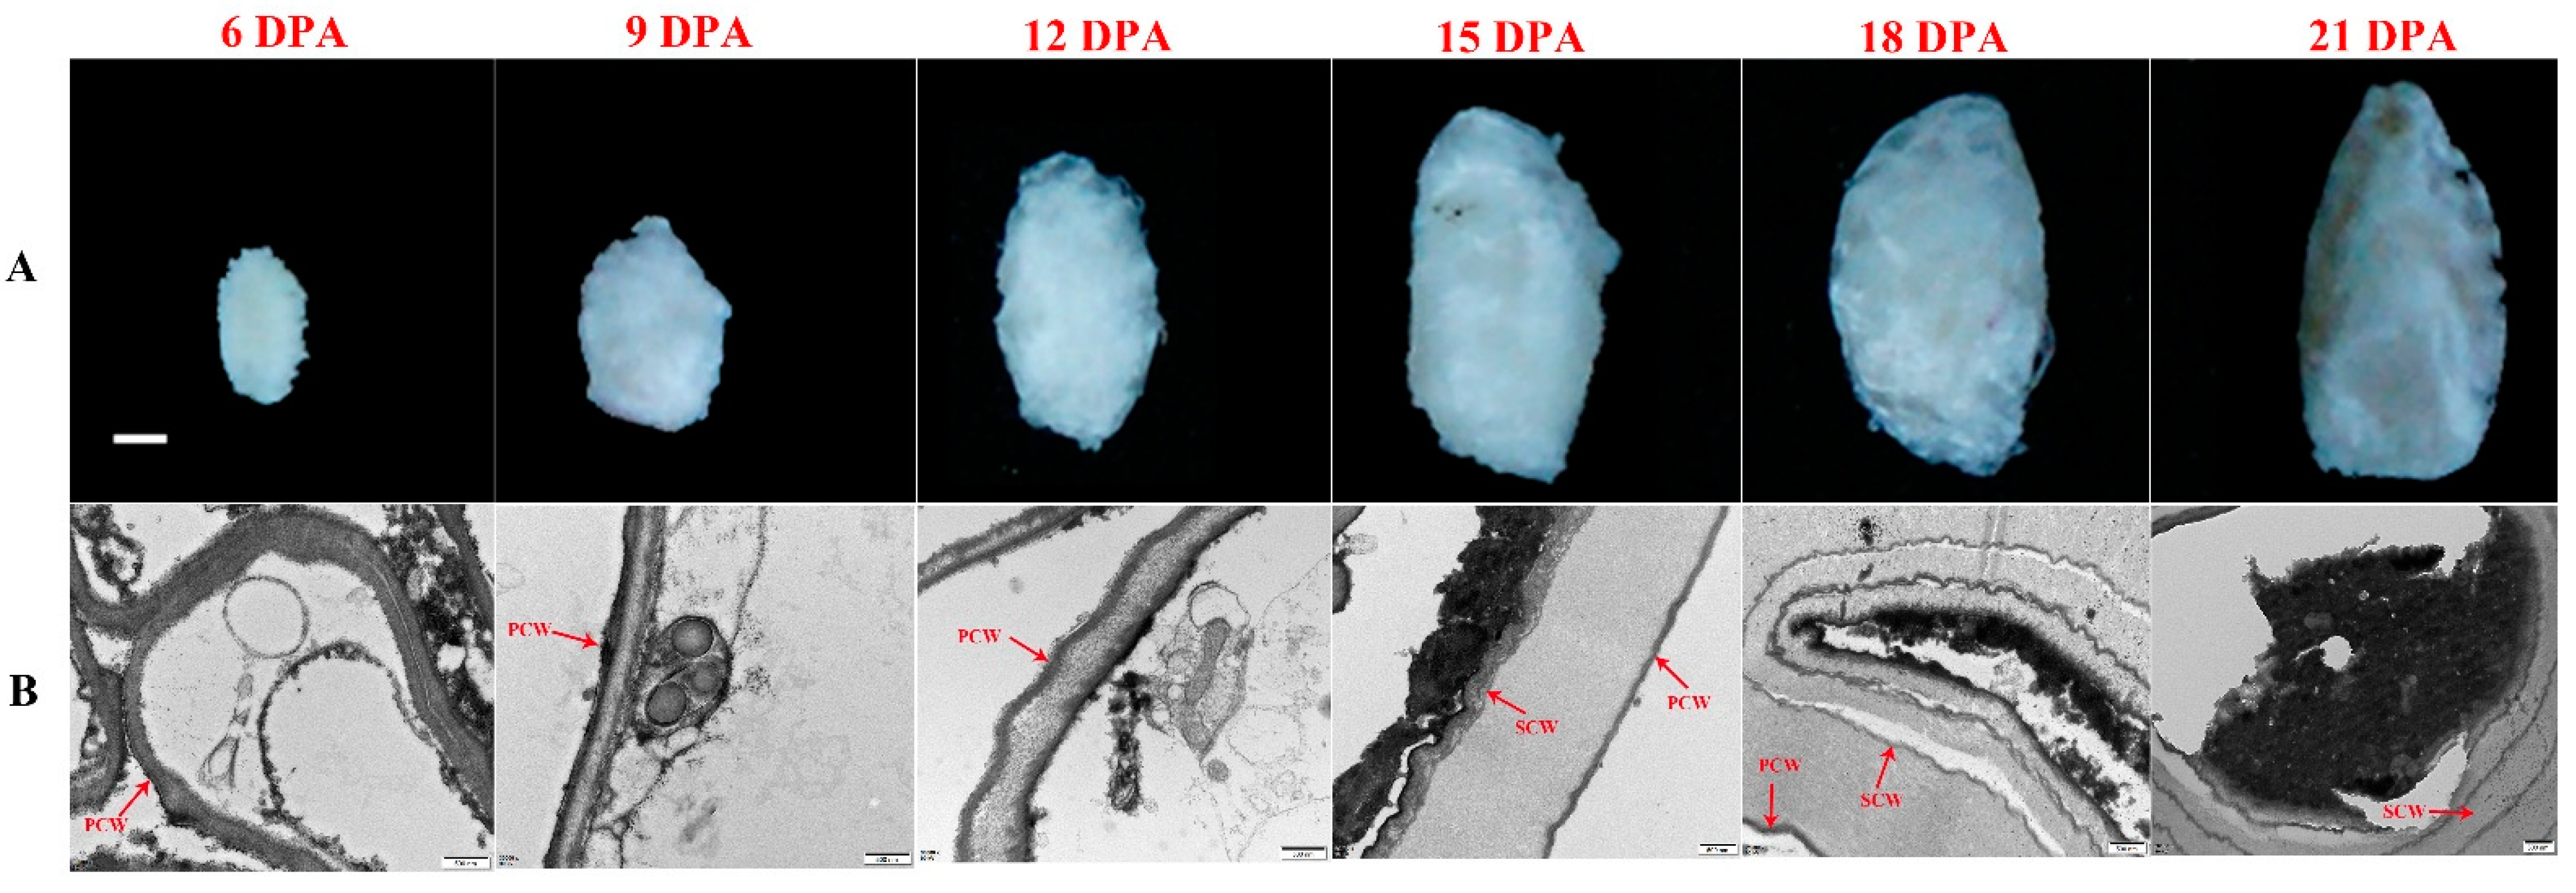
Abstract
:1. Introduction
2. Results
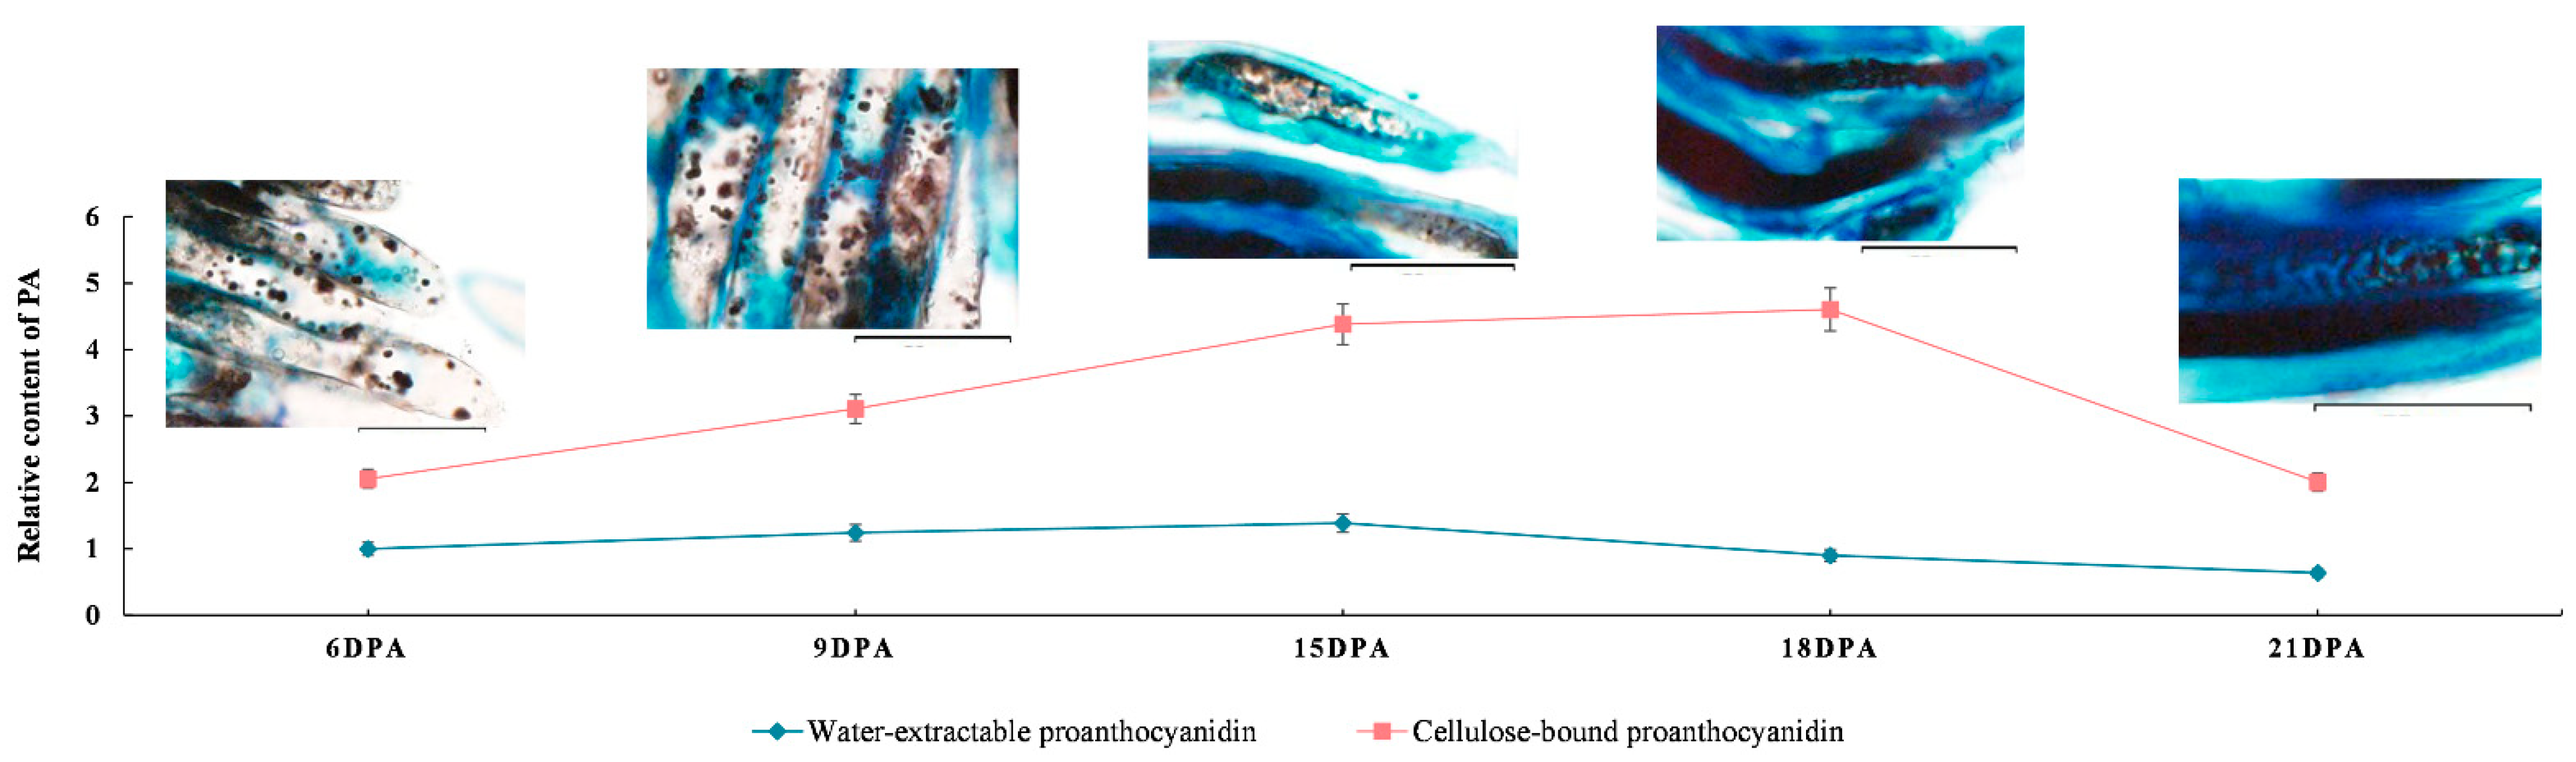
2.1. Accumulation of PAs in Developing G. stocksii Fibers
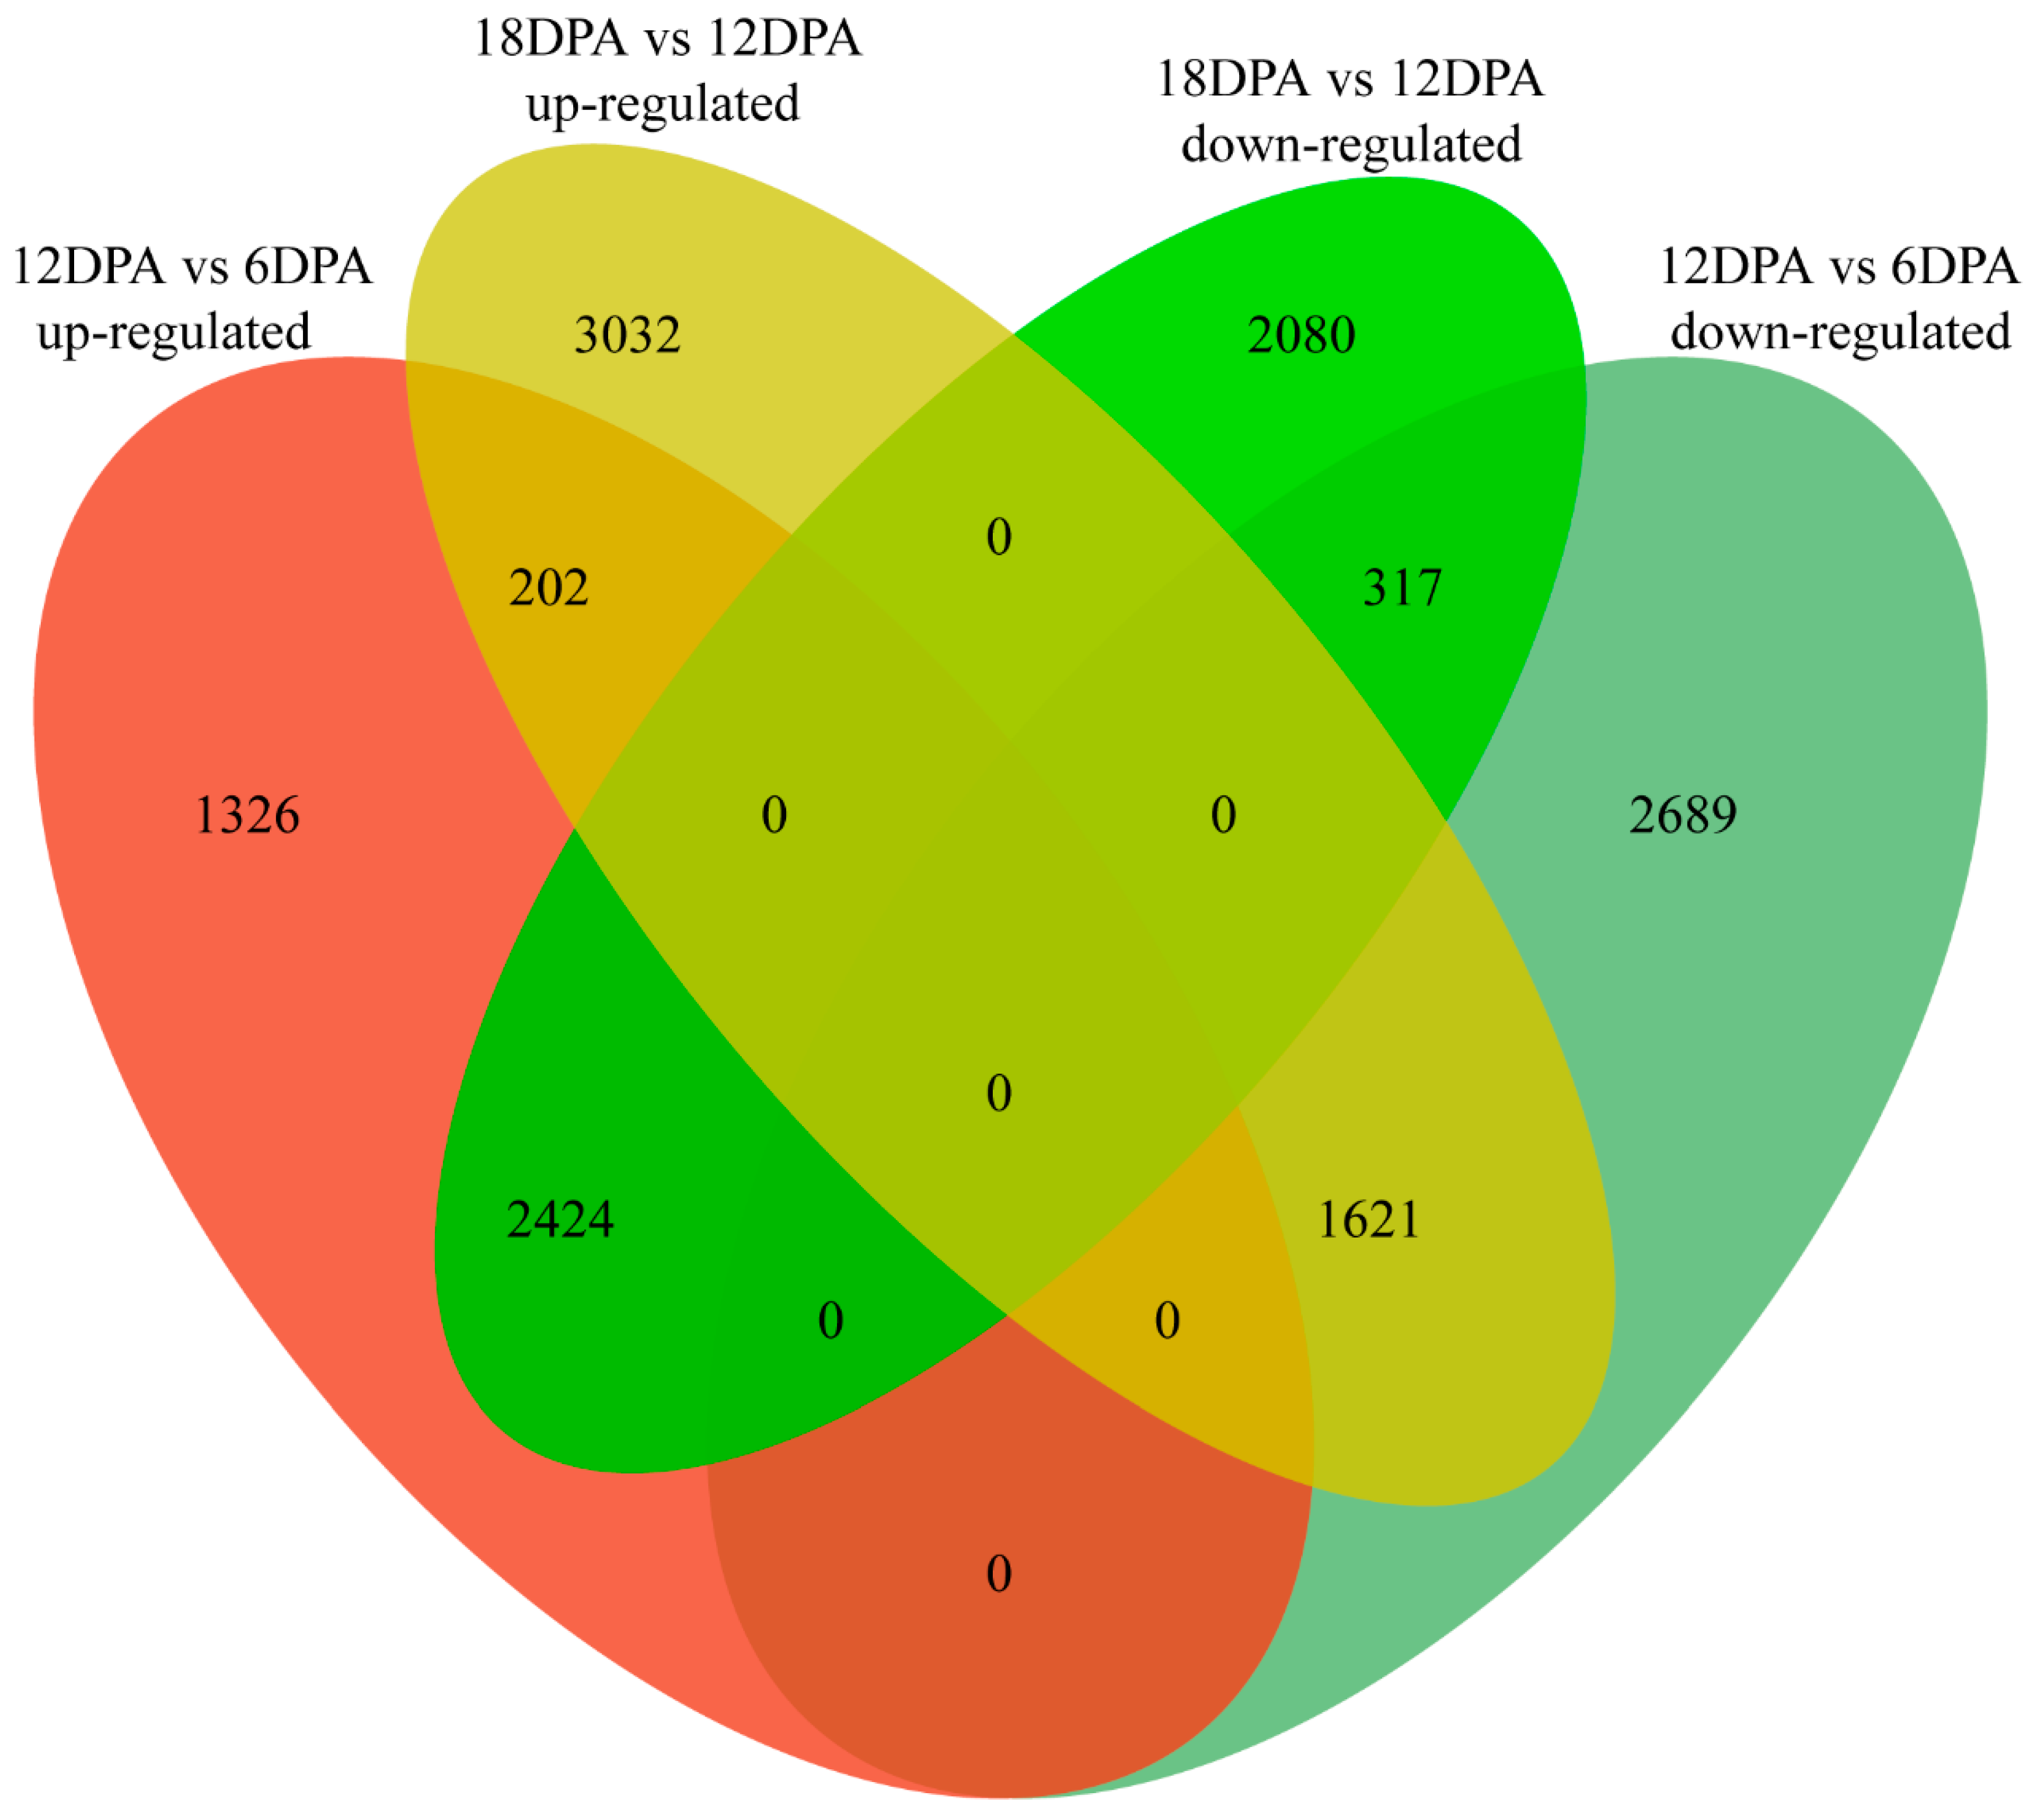
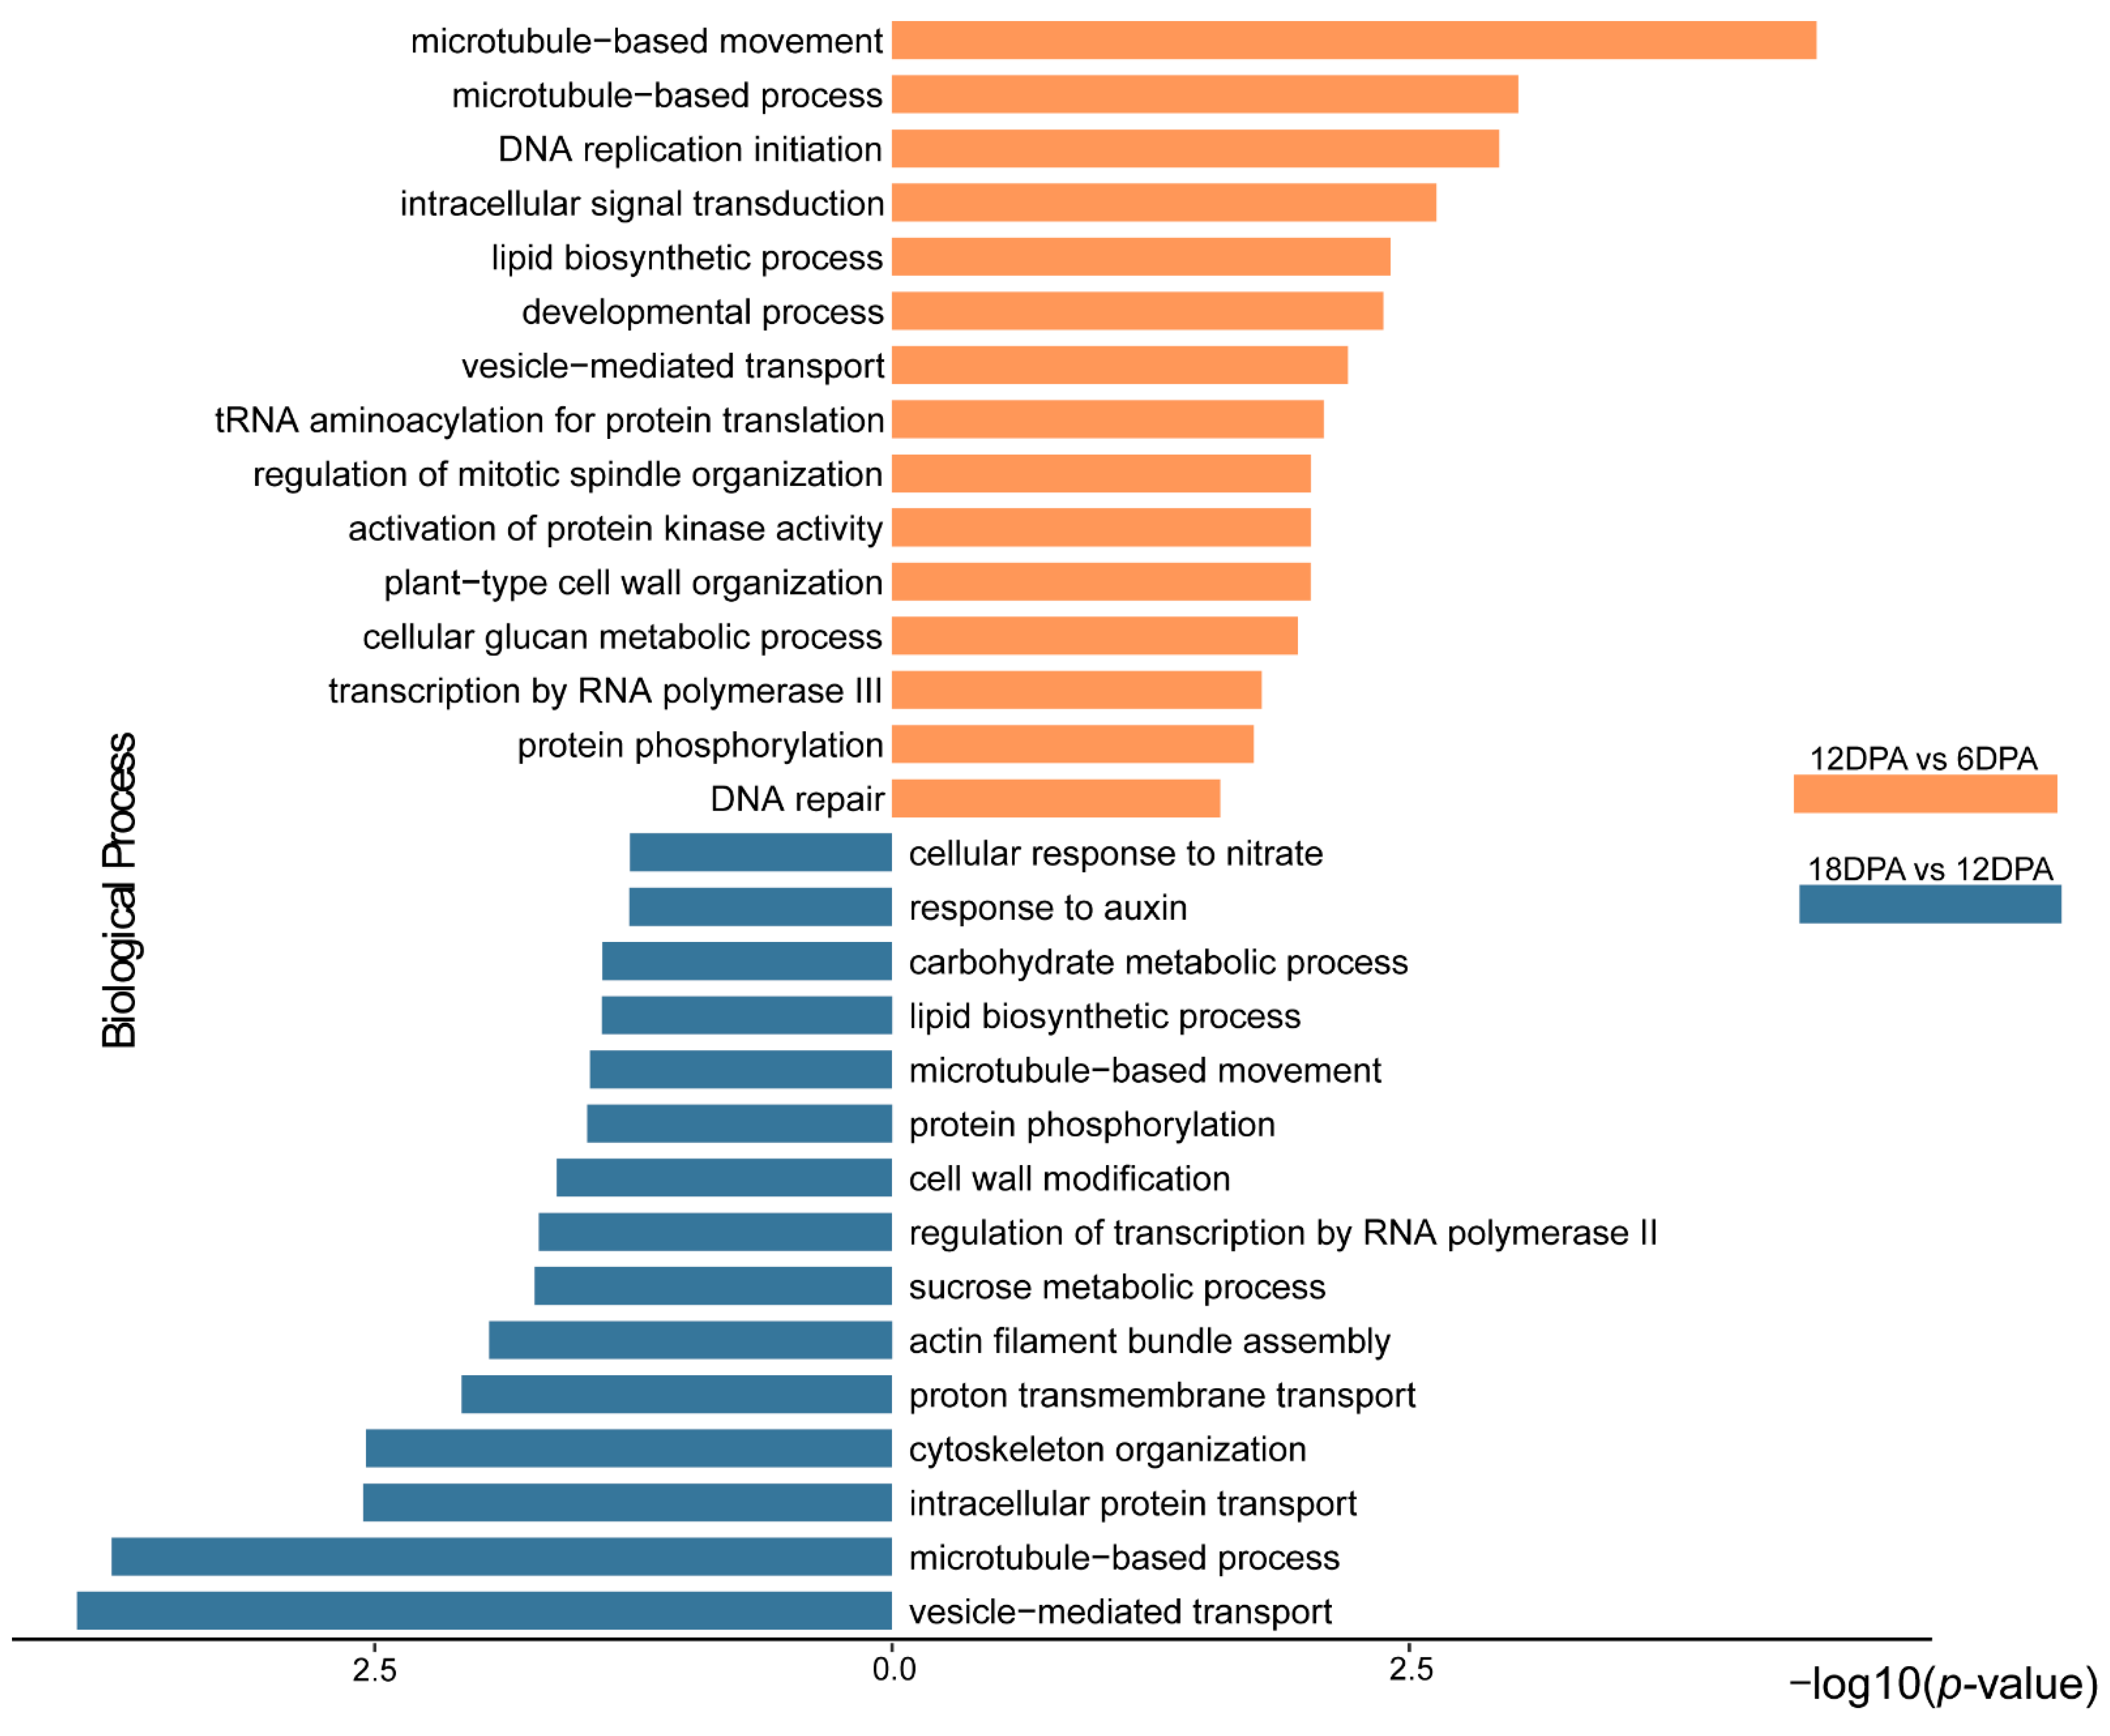
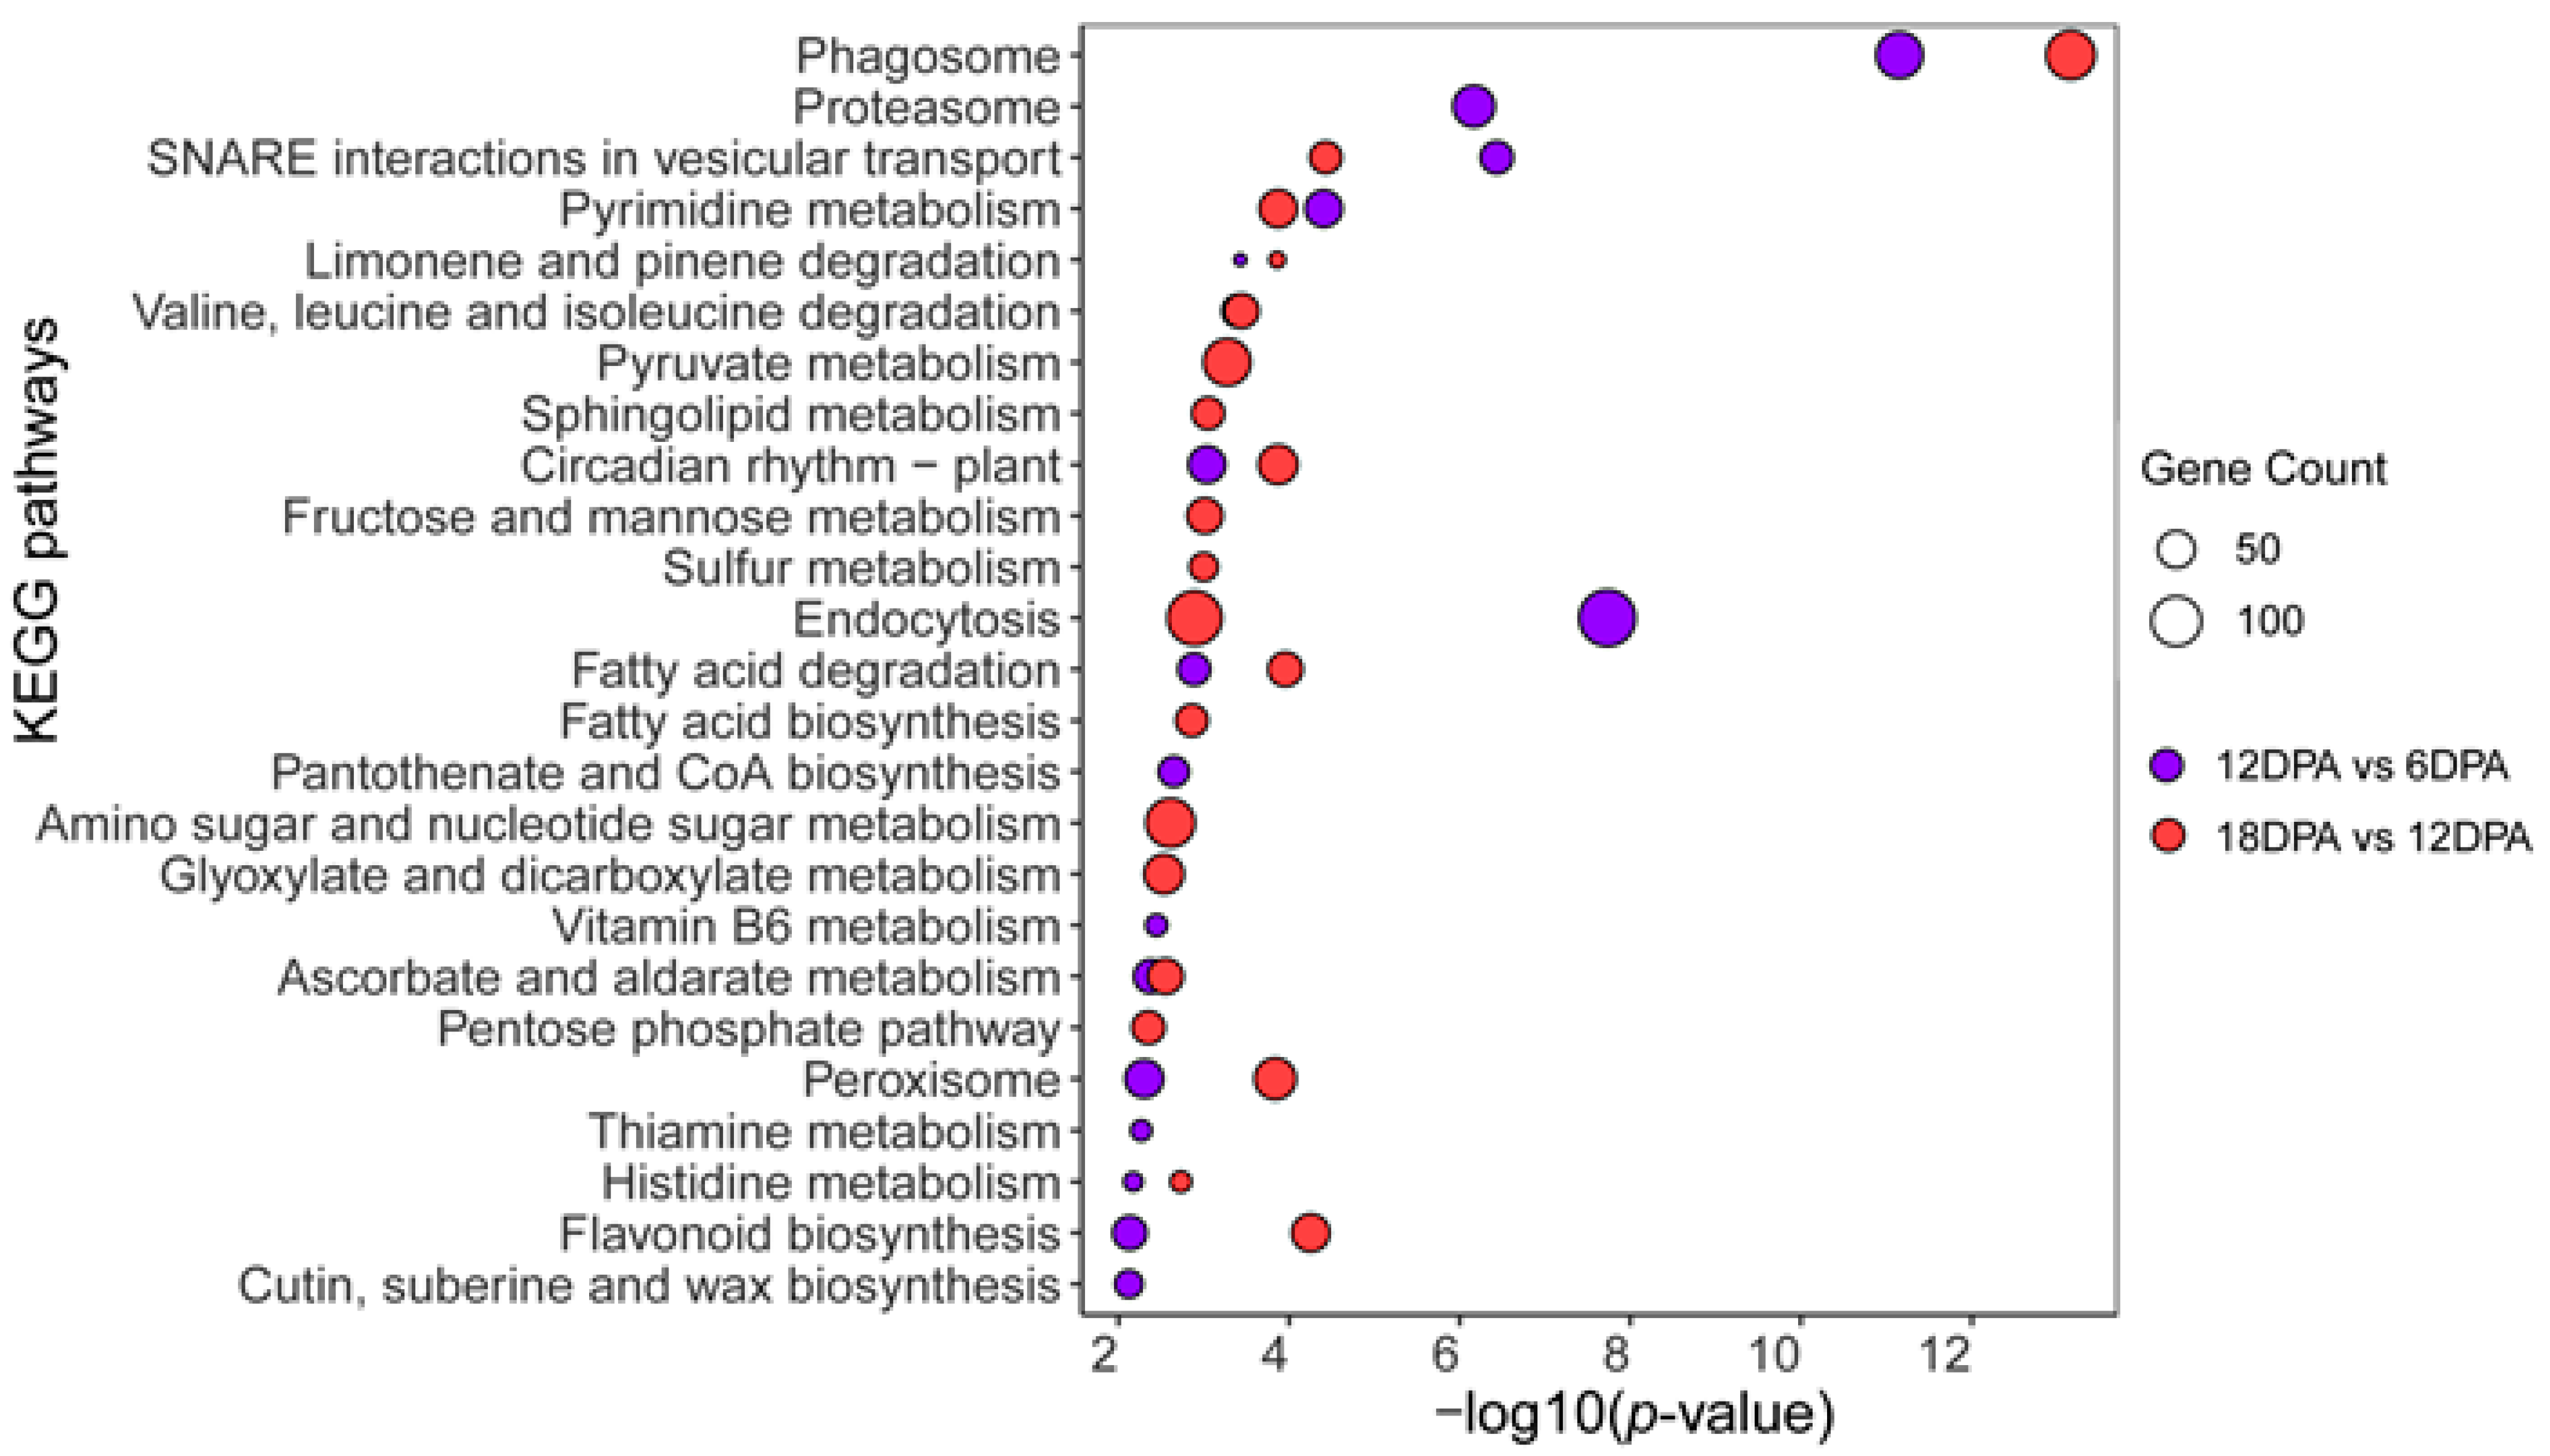
2.2. Gene Expression Variation during G. stocksii Fiber Development
2.3. Identification and Comparative Analyses of PA Biosynthetic Genes in Cotton Species
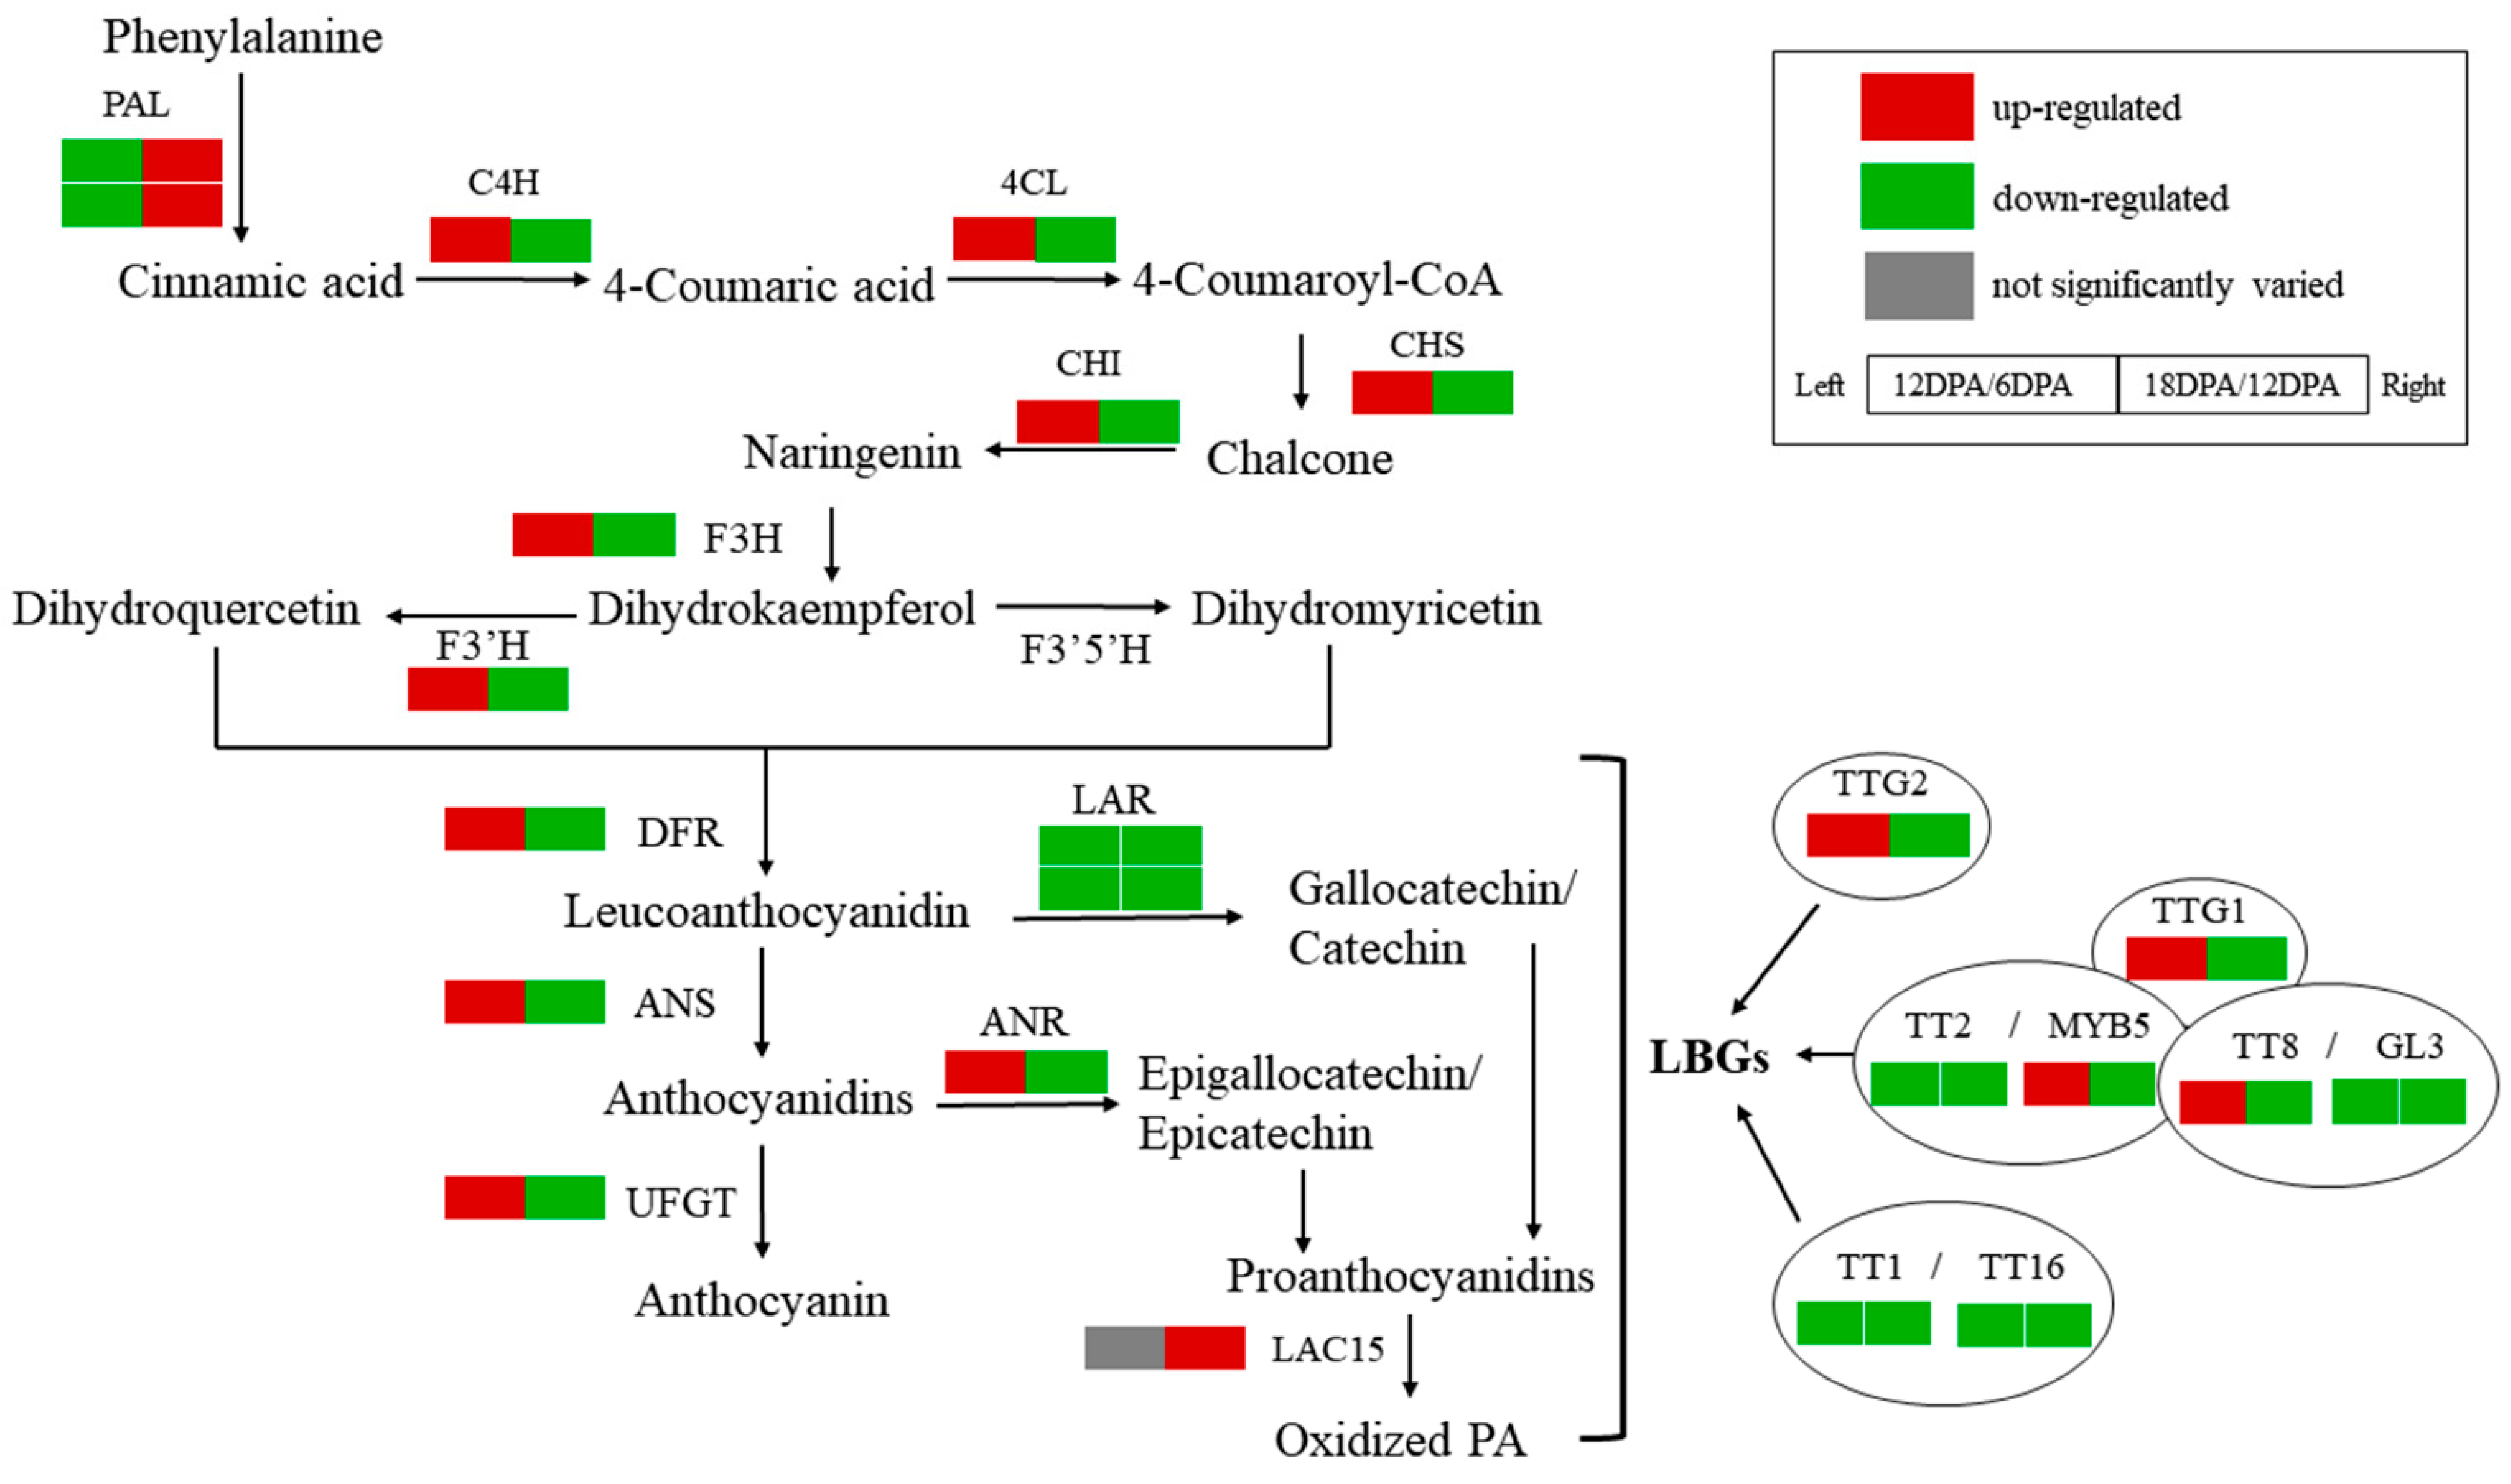
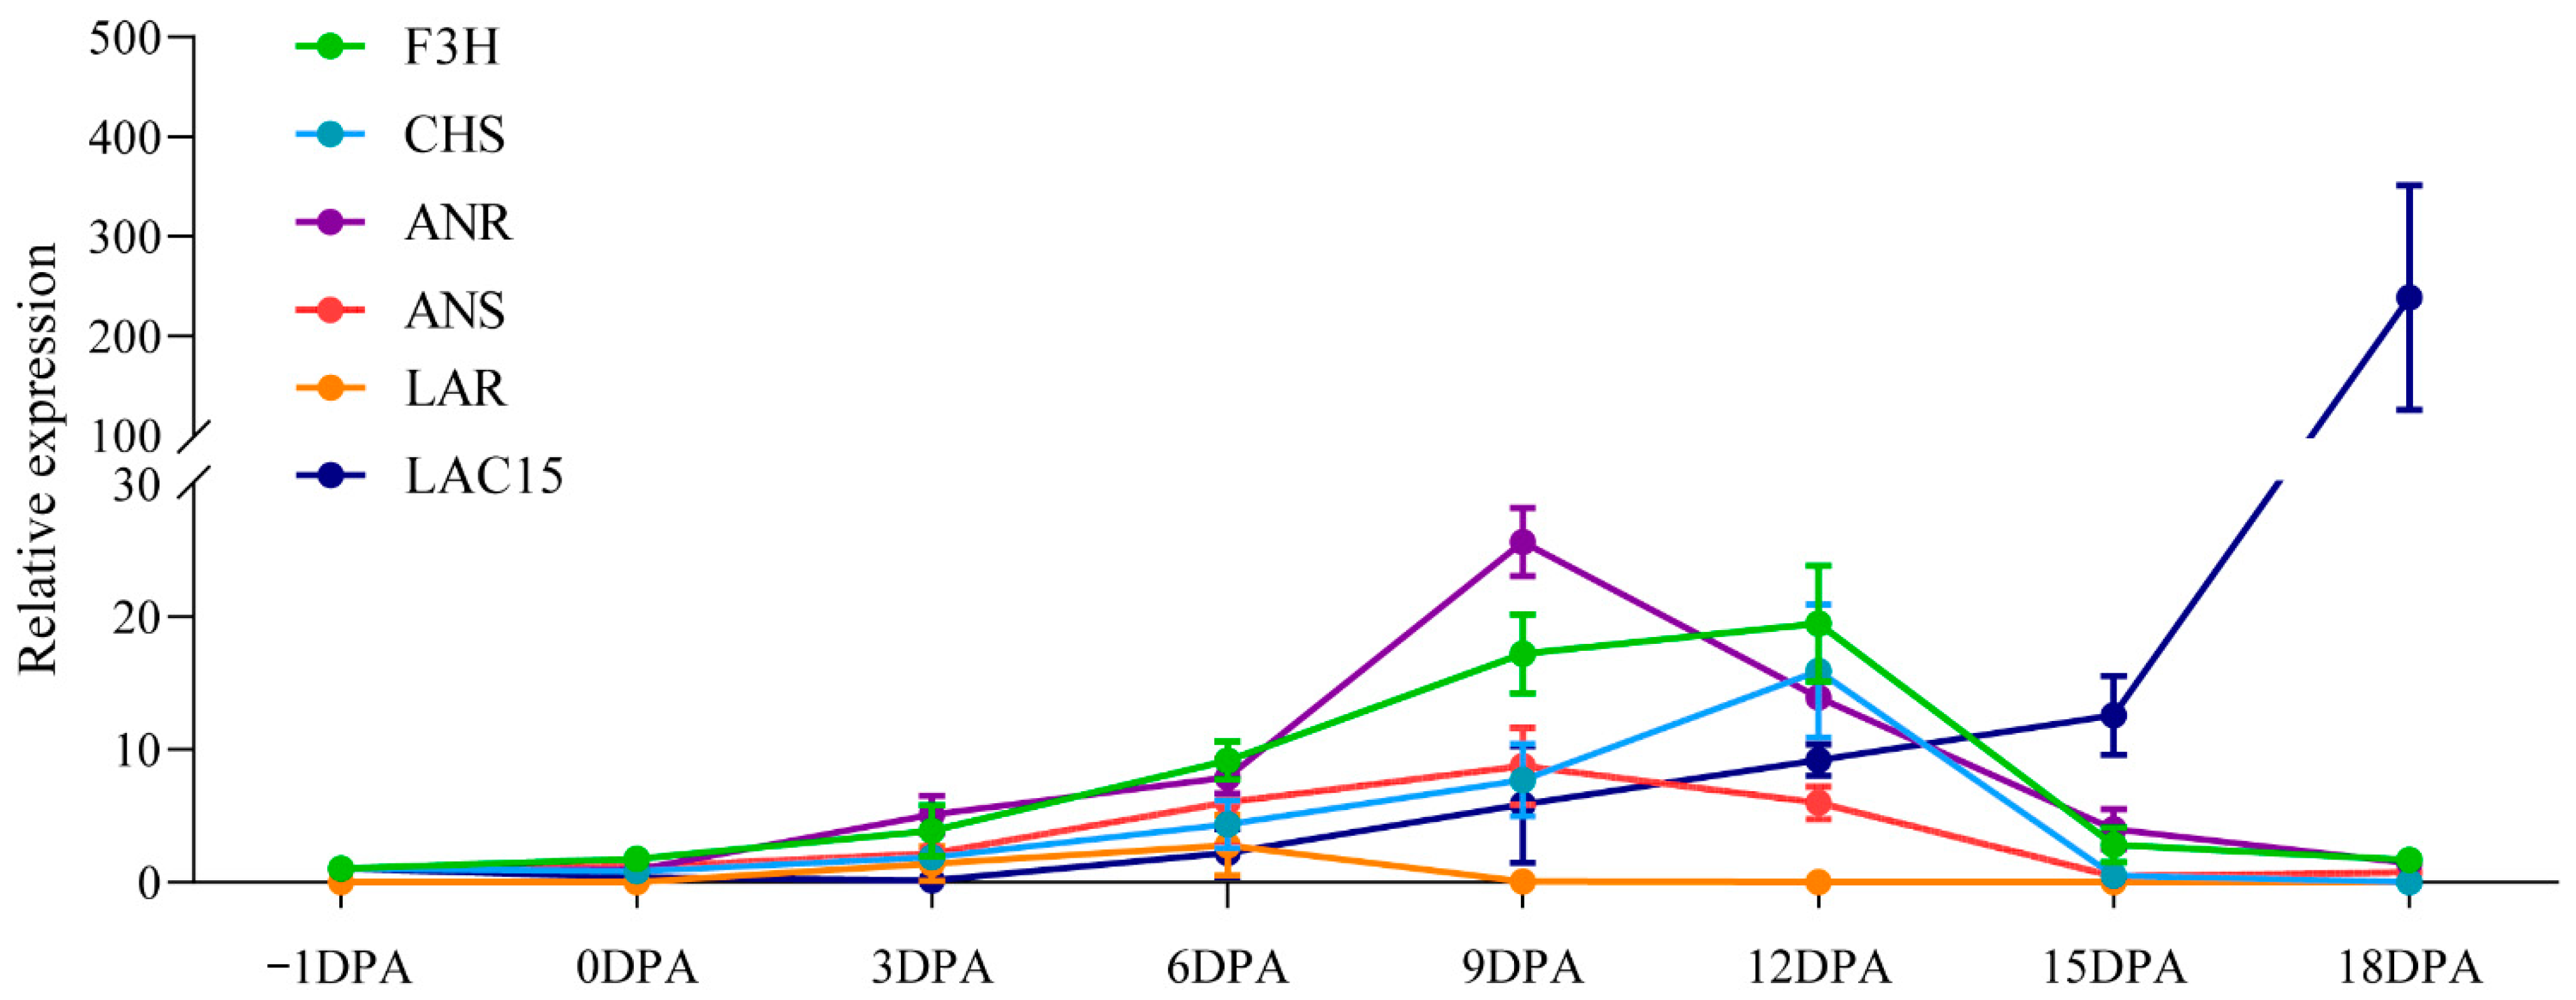
2.4. Expression Analyses of PA Biosynthetic Genes in Developing G. stocksii Fibers
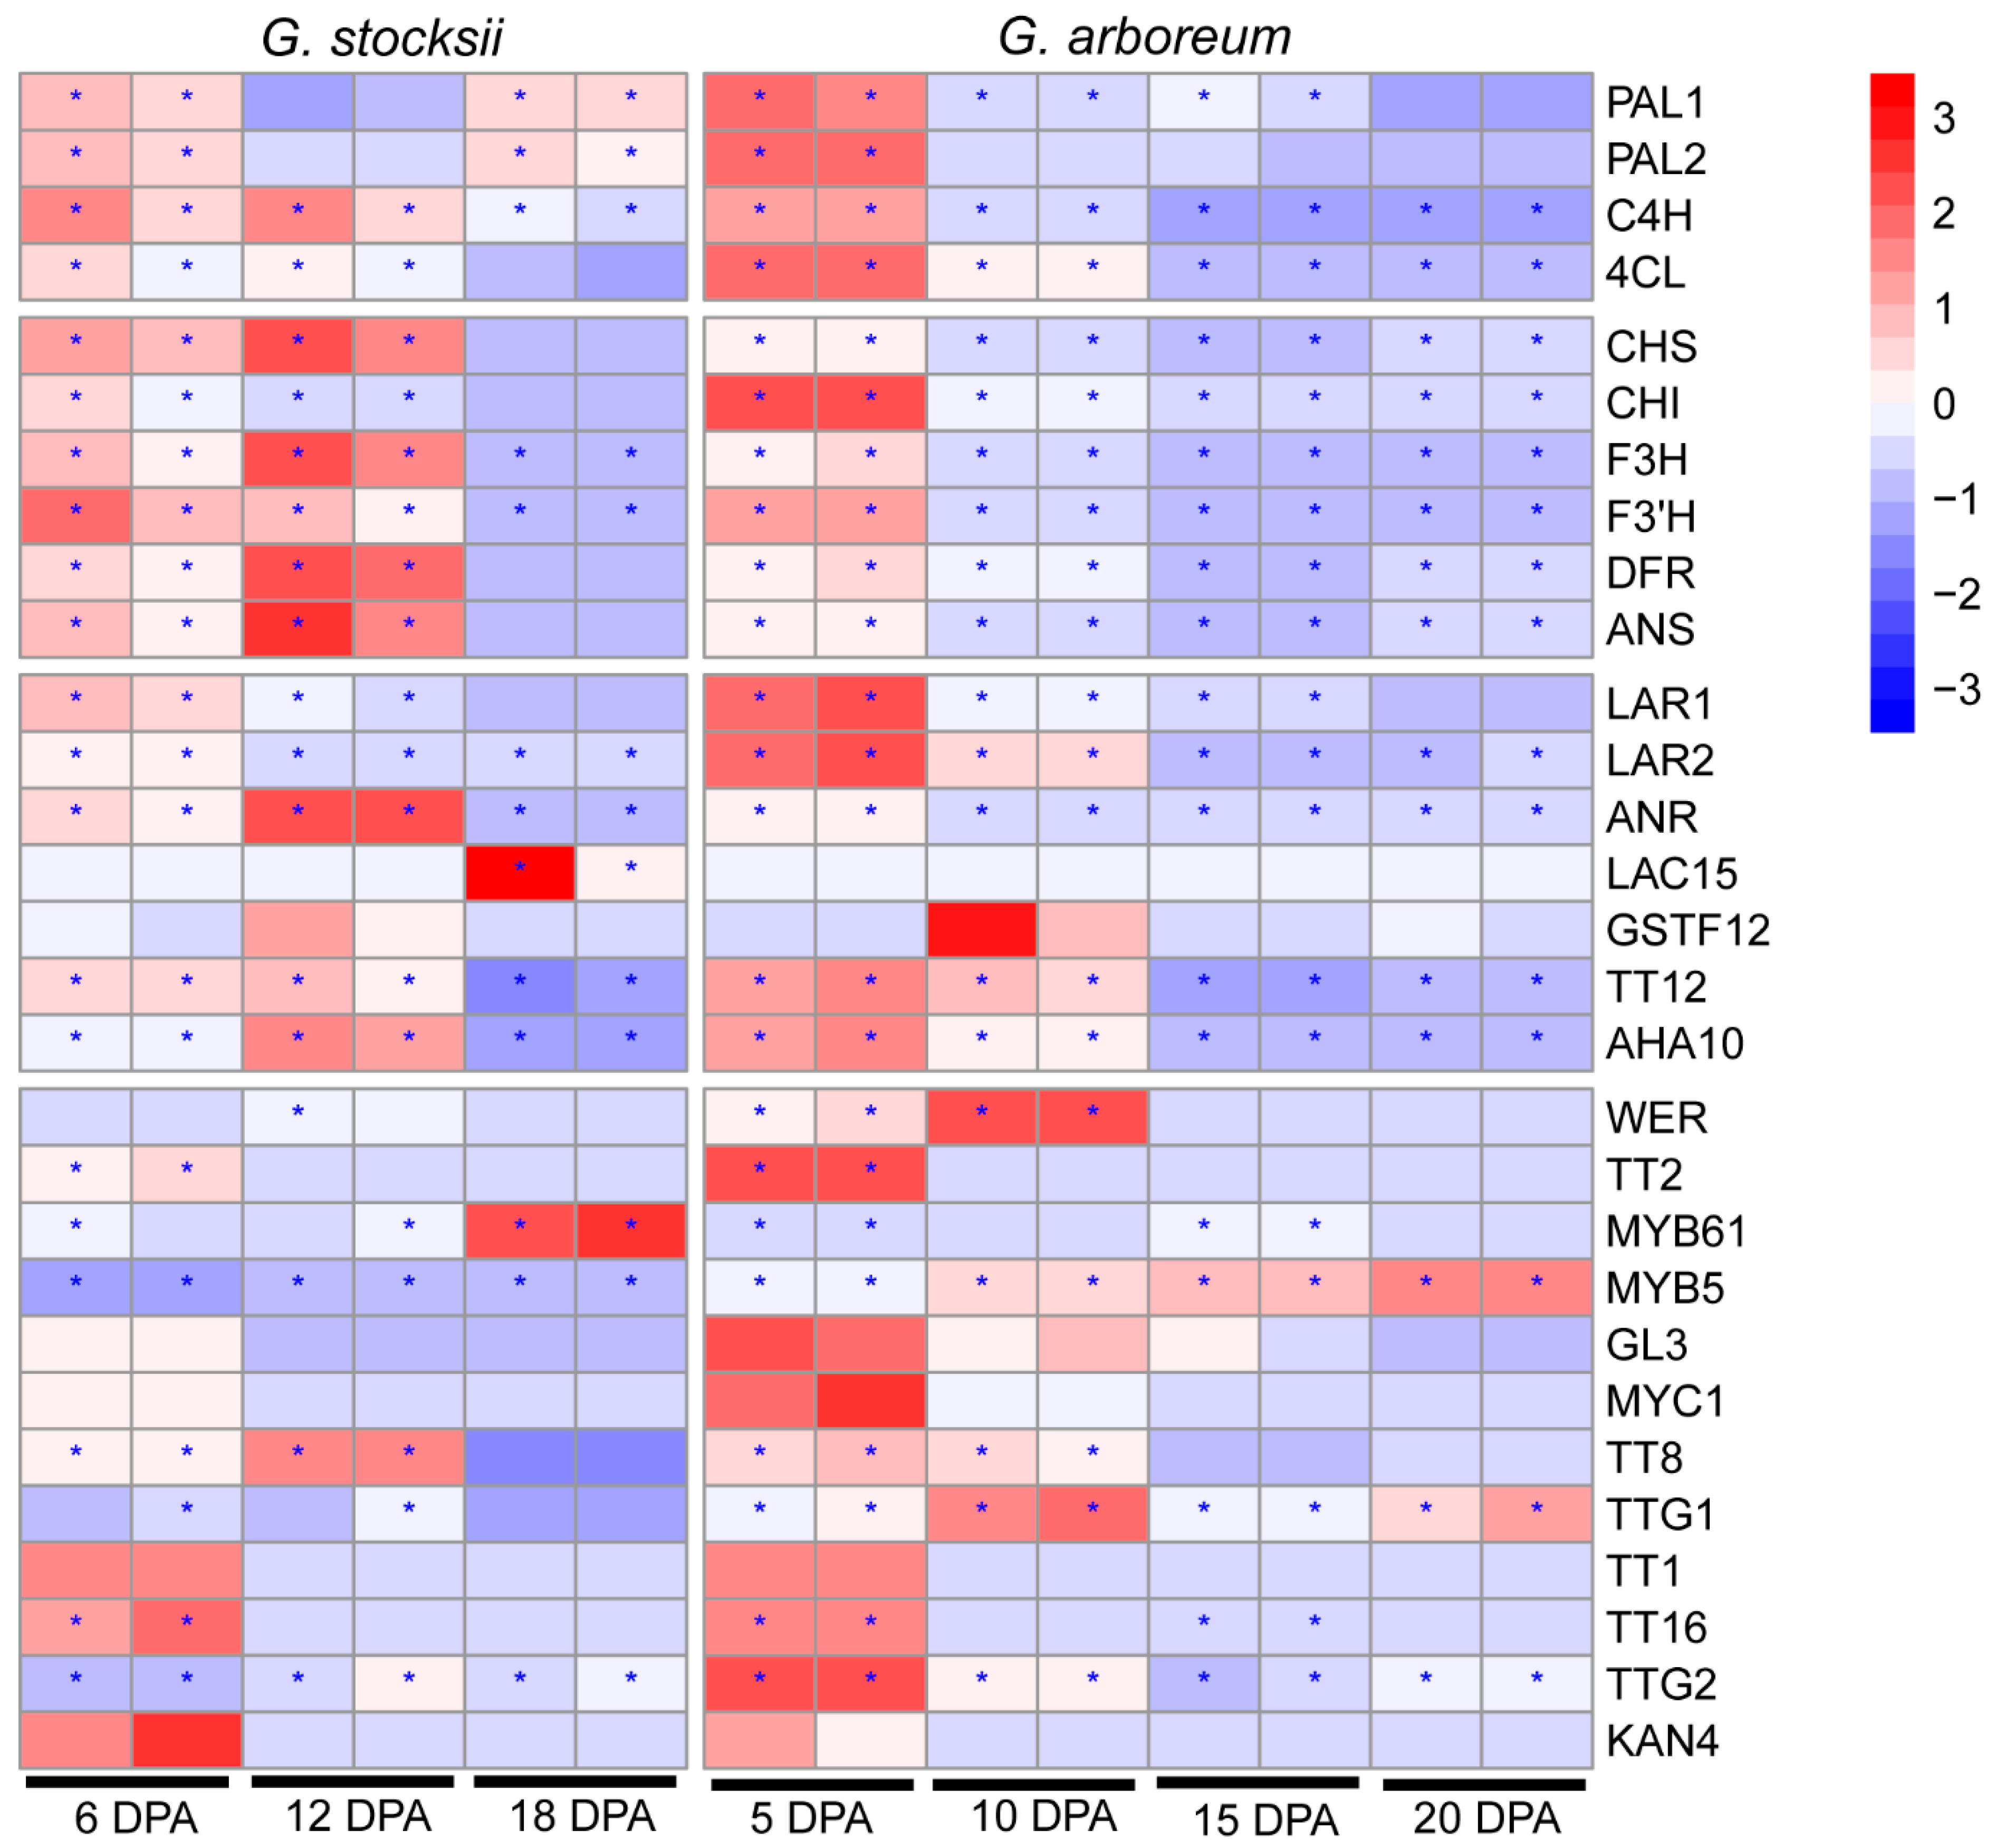
2.5. Variation of Gene Expression Modulation in Developing Fibers between G. stocksii and G. arboreum
3. Discussion
4. Materials and Methods
4.1. Plant Materials
4.2. Microstructure Observation and Histochemical Staining
4.3. Analyses of PA Content in G. stocksii Fibers
4.4. Identification of PA Biosynthetic Genes in Gossypium Species
4.5. RNA Extraction, cDNA Library Construction and RNA Sequencing
4.6. Identification of Differentially Expressed Genes (DEGs)
4.7. Quantitative Real-Time PCR Analyses
5. Conclusions
Supplementary Materials
Author Contributions
Funding
Institutional Review Board Statement
Informed Consent Statement
Data Availability Statement
Acknowledgments
Conflicts of Interest
References
- Gong, W.; Du, X.; Jia, Y.; Pan, Z. Color cotton and its utilization in China. In Cotton Fiber: Physics, Chemistry and Biology; Fang, D.D., Ed.; Springer: Cham, Switzerland, 2018; pp. 117–132. [Google Scholar]
- Sun, J.; Sun, Y.; Zhu, Q.H. Breeding Next-Generation Naturally Colored Cotton. Trends Plant Sci. 2021, 26, 539–542. [Google Scholar] [CrossRef]
- Zhao, X.; Wang, X. Composition analysis of pigment in colored cotton fiber. Acta Agron. Sin. 2005, 31, 456–462. [Google Scholar]
- Feng, H.; Yang, Y.; Sun, S.; Li, Y.; Zhang, L.; Tian, J.; Zhu, Q.; Feng, Z.; Zhu, H.; Sun, J. Molecular analysis of caffeoyl residues related to pigmentation in green cotton fibers. J. Exp. Bot. 2017, 68, 4559–4569. [Google Scholar] [CrossRef]
- Xiao, Y.H.; Zhang, Z.S.; Yin, M.H.; Luo, M.; Li, X.B.; Hou, L.; Pei, Y. Cotton flavonoid structural genes related to the pigmentation in brown fibers. Biochem. Biophys. Res. Commun. 2007, 358, 73–78. [Google Scholar] [CrossRef]
- Li, T.; Fan, H.; Li, Z.; Wei, J.; Lin, Y.; Cai, Y. The accumulation of pigment in fiber related to proanthocyanidins synthesis for brown cotton. Acta Physiol. Plant. 2012, 34, 813–818. [Google Scholar] [CrossRef]
- Li, Y.J.; Zhang, X.Y.; Wang, F.X.; Yang, C.L.; Liu, F.; Xia, G.X.; Sun, J. A comparative proteomic analysis provides insights into pigment biosynthesis in brown color fiber. J. Proteom. 2013, 78, 374–388. [Google Scholar] [CrossRef]
- Feng, H.; Li, Y.; Wang, S.; Zhang, L.; Liu, Y.; Xue, F.; Sun, Y.; Wang, Y.; Sun, J. Molecular analysis of proanthocyanidins related to pigmentation in brown cotton fibre (Gossypium hirsutum L.). J. Exp. Bot. 2014, 65, 5759–5769. [Google Scholar] [CrossRef]
- Peng, Z.; Gao, Q.; Luo, C.; Gong, W.; Tang, S.; Zhang, X.; Song, W.; Wang, Z.; Liu, H.; Du, X.; et al. Flavonoid biosynthetic and starch and sucrose metabolic pathways are involved in the pigmentation of naturally brown-colored cotton fibers. Ind. Crop. Prod. 2020, 158, 113045. [Google Scholar] [CrossRef]
- Chaves-Silva, S.; Santos, A.L.D.; Chalfun-Junior, A.; Zhao, J.; Peres, L.E.P.; Benedito, V.A. Understanding the genetic regulation of anthocyanin biosynthesis in plants—Tools for breeding purple varieties of fruits and vegetables. Phytochemistry 2018, 153, 11–27. [Google Scholar] [CrossRef] [PubMed]
- Winkel-Shirley, B. Flavonoid biosynthesis. A colorful model for genetics, biochemistry, cell biology, and biotechnology. Plant Physiol. 2001, 126, 485–493. [Google Scholar] [CrossRef] [PubMed] [Green Version]
- Holton, T.A.; Cornish, E.C. Genetics and Biochemistry of Anthocyanin Biosynthesis. Plant Cell 1995, 7, 1071–1083. [Google Scholar] [CrossRef] [PubMed]
- Zhang, Y.; Butelli, E.; Martin, C. Engineering anthocyanin biosynthesis in plants. Curr. Opin. Plant Biol. 2014, 19, 81–90. [Google Scholar] [CrossRef] [PubMed]
- Feng, H.; Tian, X.; Liu, Y.; Li, Y.; Zhang, X.; Jones, B.J.; Sun, Y.; Sun, J. Analysis of flavonoids and the flavonoid structural genes in brown fiber of upland cotton. PLoS ONE 2013, 8, e58820. [Google Scholar] [CrossRef] [PubMed] [Green Version]
- Liu, H.F.; Luo, C.; Song, W.; Shen, H.; Li, G.; He, Z.G.; Chen, W.G.; Cao, Y.Y.; Huang, F.; Tang, S.W.; et al. Flavonoid biosynthesis controls fiber color in naturally colored cotton. PeerJ 2018, 6, e4537. [Google Scholar] [CrossRef] [PubMed] [Green Version]
- Gao, J.; Shen, L.; Yuan, J.; Zheng, H.; Su, Q.; Yang, W.; Zhang, L.; Nnaemeka, V.E.; Sun, J.; Ke, L.; et al. Functional analysis of GhCHS, GhANR and GhLAR in colored fiber formation of Gossypium hirsutum L. BMC Plant Biol. 2019, 19, 455. [Google Scholar] [CrossRef] [Green Version]
- Xiao, Y.H.; Yan, Q.; Ding, H.; Luo, M.; Hou, L.; Zhang, M.; Yao, D.; Liu, H.S.; Li, X.; Zhao, J.; et al. Transcriptome and biochemical analyses revealed a detailed proanthocyanidin biosynthesis pathway in brown cotton fiber. PLoS ONE 2014, 9, e86344. [Google Scholar] [CrossRef] [PubMed]
- Yu, D.; Ke, L.; Zhang, D.; Wu, Y.; Sun, Y.; Mei, J.; Sun, J.; Sun, Y. Multi-omics assisted identification of the key and species-specific regulatory components of drought-tolerant mechanisms in Gossypium stocksii. Plant Biotechnol. J. 2021, 19, 1690–1692. [Google Scholar] [CrossRef]
- Samaj, J.; Read, N.D.; Volkmann, D.; Menzel, D.; Baluska, F. The endocytic network in plants. Trends Cell Biol. 2005, 15, 425–433. [Google Scholar] [CrossRef]
- Zhao, J.; Pang, Y.; Dixon, R.A. The mysteries of proanthocyanidin transport and polymerization. Plant Physiol. 2010, 153, 437–443. [Google Scholar] [CrossRef] [Green Version]
- Pourcel, L.; Routaboul, J.M.; Kerhoas, L.; Caboche, M.; Lepiniec, L.; Debeaujon, I. Transparent TESTA10 encodes a laccase-like enzyme involved in oxidative polymerization of flavonoids in Arabidopsis seed coat. Plant Cell 2005, 17, 2966–2980. [Google Scholar] [CrossRef] [PubMed] [Green Version]
- Zhang, K.; Lu, K.; Qu, C.; Liang, Y.; Wang, R.; Chai, Y.; Li, J. Gene silencing of BnTT10 family genes causes retarded pigmentation and lignin reduction in the seed coat of Brassica napus. PLoS ONE 2013, 8, e61247. [Google Scholar] [CrossRef] [Green Version]
- Wei, J.; Zhang, X.; Zhong, R.; Liu, B.; Zhang, X.; Fang, F.; Zhang, Z.; Pang, X. Laccase-Mediated Flavonoid Polymerization Leads to the Pericarp Browning of Litchi Fruit. J. Agric. Food Chem. 2021, 69, 15218–15230. [Google Scholar] [CrossRef]
- Xu, W.; Grain, D.; Bobet, S.; Le Gourrierec, J.; Thevenin, J.; Kelemen, Z.; Lepiniec, L.; Dubos, C. Complexity and robustness of the flavonoid transcriptional regulatory network revealed by comprehensive analyses of MYB-bHLH-WDR complexes and their targets in Arabidopsis seed. New Phytol. 2014, 202, 132–144. [Google Scholar] [CrossRef]
- Hinchliffe, D.J.; Condon, B.D.; Thyssen, G.; Naoumkina, M.; Madison, C.A.; Reynolds, M.; Delhom, C.D.; Fang, D.D.; Li, P.; McCarty, J. The GhTT2_A07 gene is linked to the brown colour and natural flame retardancy phenotypes of Lc1 cotton (Gossypium hirsutum L.) fibres. J. Exp. Bot. 2016, 67, 5461–5471. [Google Scholar] [CrossRef] [Green Version]
- Yan, Q.; Wang, Y.; Li, Q.; Zhang, Z.; Ding, H.; Zhang, Y.; Liu, H.; Luo, M.; Liu, D.; Song, W.; et al. Up-regulation of GhTT2-3A in cotton fibres during secondary wall thickening results in brown fibres with improved quality. Plant Biotechnol. J. 2018, 16, 1735–1747. [Google Scholar] [CrossRef] [Green Version]
- Lin, Y.M.; Liu, J.W.; Xiang, P.; Lin, P.; Ye, G.F.; da Sternberg, L.S.L. Tannin Dynamics of Propagules and Leaves of Kandelia candel and Bruguiera gymnorrhiza in the Jiulong River Estuary, Fujian, China. Biogeochemistry 2006, 78, 343–359. [Google Scholar] [CrossRef] [Green Version]
- Saito, K.; Yonekura-Sakakibara, K.; Nakabayashi, R.; Higashi, Y.; Yamazaki, M.; Tohge, T.; Fernie, A.R. The flavonoid biosynthetic pathway in Arabidopsis: Structural and genetic diversity. Plant Physiol. Biochem. PPB 2013, 72, 21–34. [Google Scholar] [CrossRef] [Green Version]
- Zhang, T.; Hu, Y.; Jiang, W.; Fang, L.; Guan, X.; Chen, J.; Zhang, J.; Saski, C.A.; Scheffler, B.E.; Stelly, D.M.; et al. Sequencing of allotetraploid cotton (Gossypium hirsutum L. acc. TM-1) provides a resource for fiber improvement. Nat. Biotechnol. 2015, 33, 531–537. [Google Scholar] [CrossRef] [Green Version]
- Yu, J.; Jung, S.; Cheng, C.H.; Ficklin, S.P.; Lee, T.; Zheng, P.; Jones, D.; Percy, R.G.; Main, D. CottonGen: A genomics, genetics and breeding database for cotton research. Nucleic Acids Res. 2014, 42, D1229–D1236. [Google Scholar] [CrossRef] [Green Version]
- Ke, L.; Lei, W.; Yang, W.; Wang, J.; Gao, J.; Cheng, J.; Sun, Y.; Fan, Z.; Yu, D. Genome-wide identification of cold responsive transcription factors in Brassica napus L. BMC Plant Biol. 2020, 20, 62. [Google Scholar] [CrossRef]
- Kim, D.; Langmead, B.; Salzberg, S.L. HISAT: A fast spliced aligner with low memory requirements. Nat. Methods 2015, 12, 357–360. [Google Scholar] [CrossRef] [Green Version]
- Anders, S.; Pyl, P.T.; Huber, W. HTSeq—A Python framework to work with high-throughput sequencing data. Bioinformatics 2015, 31, 166–169. [Google Scholar] [CrossRef]
- Love, M.I.; Huber, W.; Anders, S. Moderated estimation of fold change and dispersion for RNA-seq data with DESeq2. Genome Biol. 2014, 15, 550. [Google Scholar] [CrossRef] [Green Version]
- Pertea, M.; Pertea, G.M.; Antonescu, C.M.; Chang, T.C.; Mendell, J.T.; Salzberg, S.L. StringTie enables improved reconstruction of a transcriptome from RNA-seq reads. Nat. Biotechnol. 2015, 33, 290–295. [Google Scholar] [CrossRef] [Green Version]
- Yu, G.; Wang, L.G.; Han, Y.; He, Q.Y. clusterProfiler: An R package for comparing biological themes among gene clusters. OMICS 2012, 16, 284–287. [Google Scholar] [CrossRef]
- Huang, G.; Wu, Z.; Percy, R.G.; Bai, M.; Li, Y.; Frelichowski, J.E.; Hu, J.; Wang, K.; Yu, J.Z.; Zhu, Y. Genome sequence of Gossypium herbaceum and genome updates of Gossypium arboreum and Gossypium hirsutum provide insights into cotton A-genome evolution. Nat. Genet. 2020, 52, 516–524. [Google Scholar] [CrossRef] [Green Version]


Publisher’s Note: MDPI stays neutral with regard to jurisdictional claims in published maps and institutional affiliations. |
© 2022 by the authors. Licensee MDPI, Basel, Switzerland. This article is an open access article distributed under the terms and conditions of the Creative Commons Attribution (CC BY) license (https://creativecommons.org/licenses/by/4.0/).
Share and Cite
Sun, Y.; Zhang, D.; Zheng, H.; Wu, Y.; Mei, J.; Ke, L.; Yu, D.; Sun, Y. Biochemical and Expression Analyses Revealed the Involvement of Proanthocyanidins and/or Their Derivatives in Fiber Pigmentation of Gossypium stocksii. Int. J. Mol. Sci. 2022, 23, 1008. https://doi.org/10.3390/ijms23021008
Sun Y, Zhang D, Zheng H, Wu Y, Mei J, Ke L, Yu D, Sun Y. Biochemical and Expression Analyses Revealed the Involvement of Proanthocyanidins and/or Their Derivatives in Fiber Pigmentation of Gossypium stocksii. International Journal of Molecular Sciences. 2022; 23(2):1008. https://doi.org/10.3390/ijms23021008
Chicago/Turabian StyleSun, Yujie, Diandian Zhang, Hongli Zheng, Yuqing Wu, Jun Mei, Liping Ke, Dongliang Yu, and Yuqiang Sun. 2022. "Biochemical and Expression Analyses Revealed the Involvement of Proanthocyanidins and/or Their Derivatives in Fiber Pigmentation of Gossypium stocksii" International Journal of Molecular Sciences 23, no. 2: 1008. https://doi.org/10.3390/ijms23021008