
Synthesis, Molecular Docking, In Vitro and In Vivo Studies of Novel Dimorpholinoquinazoline-Based Potential Inhibitors of PI3K/Akt/mTOR Pathway

 ,
,  ,
,  , , ,
, , ,
Abstract
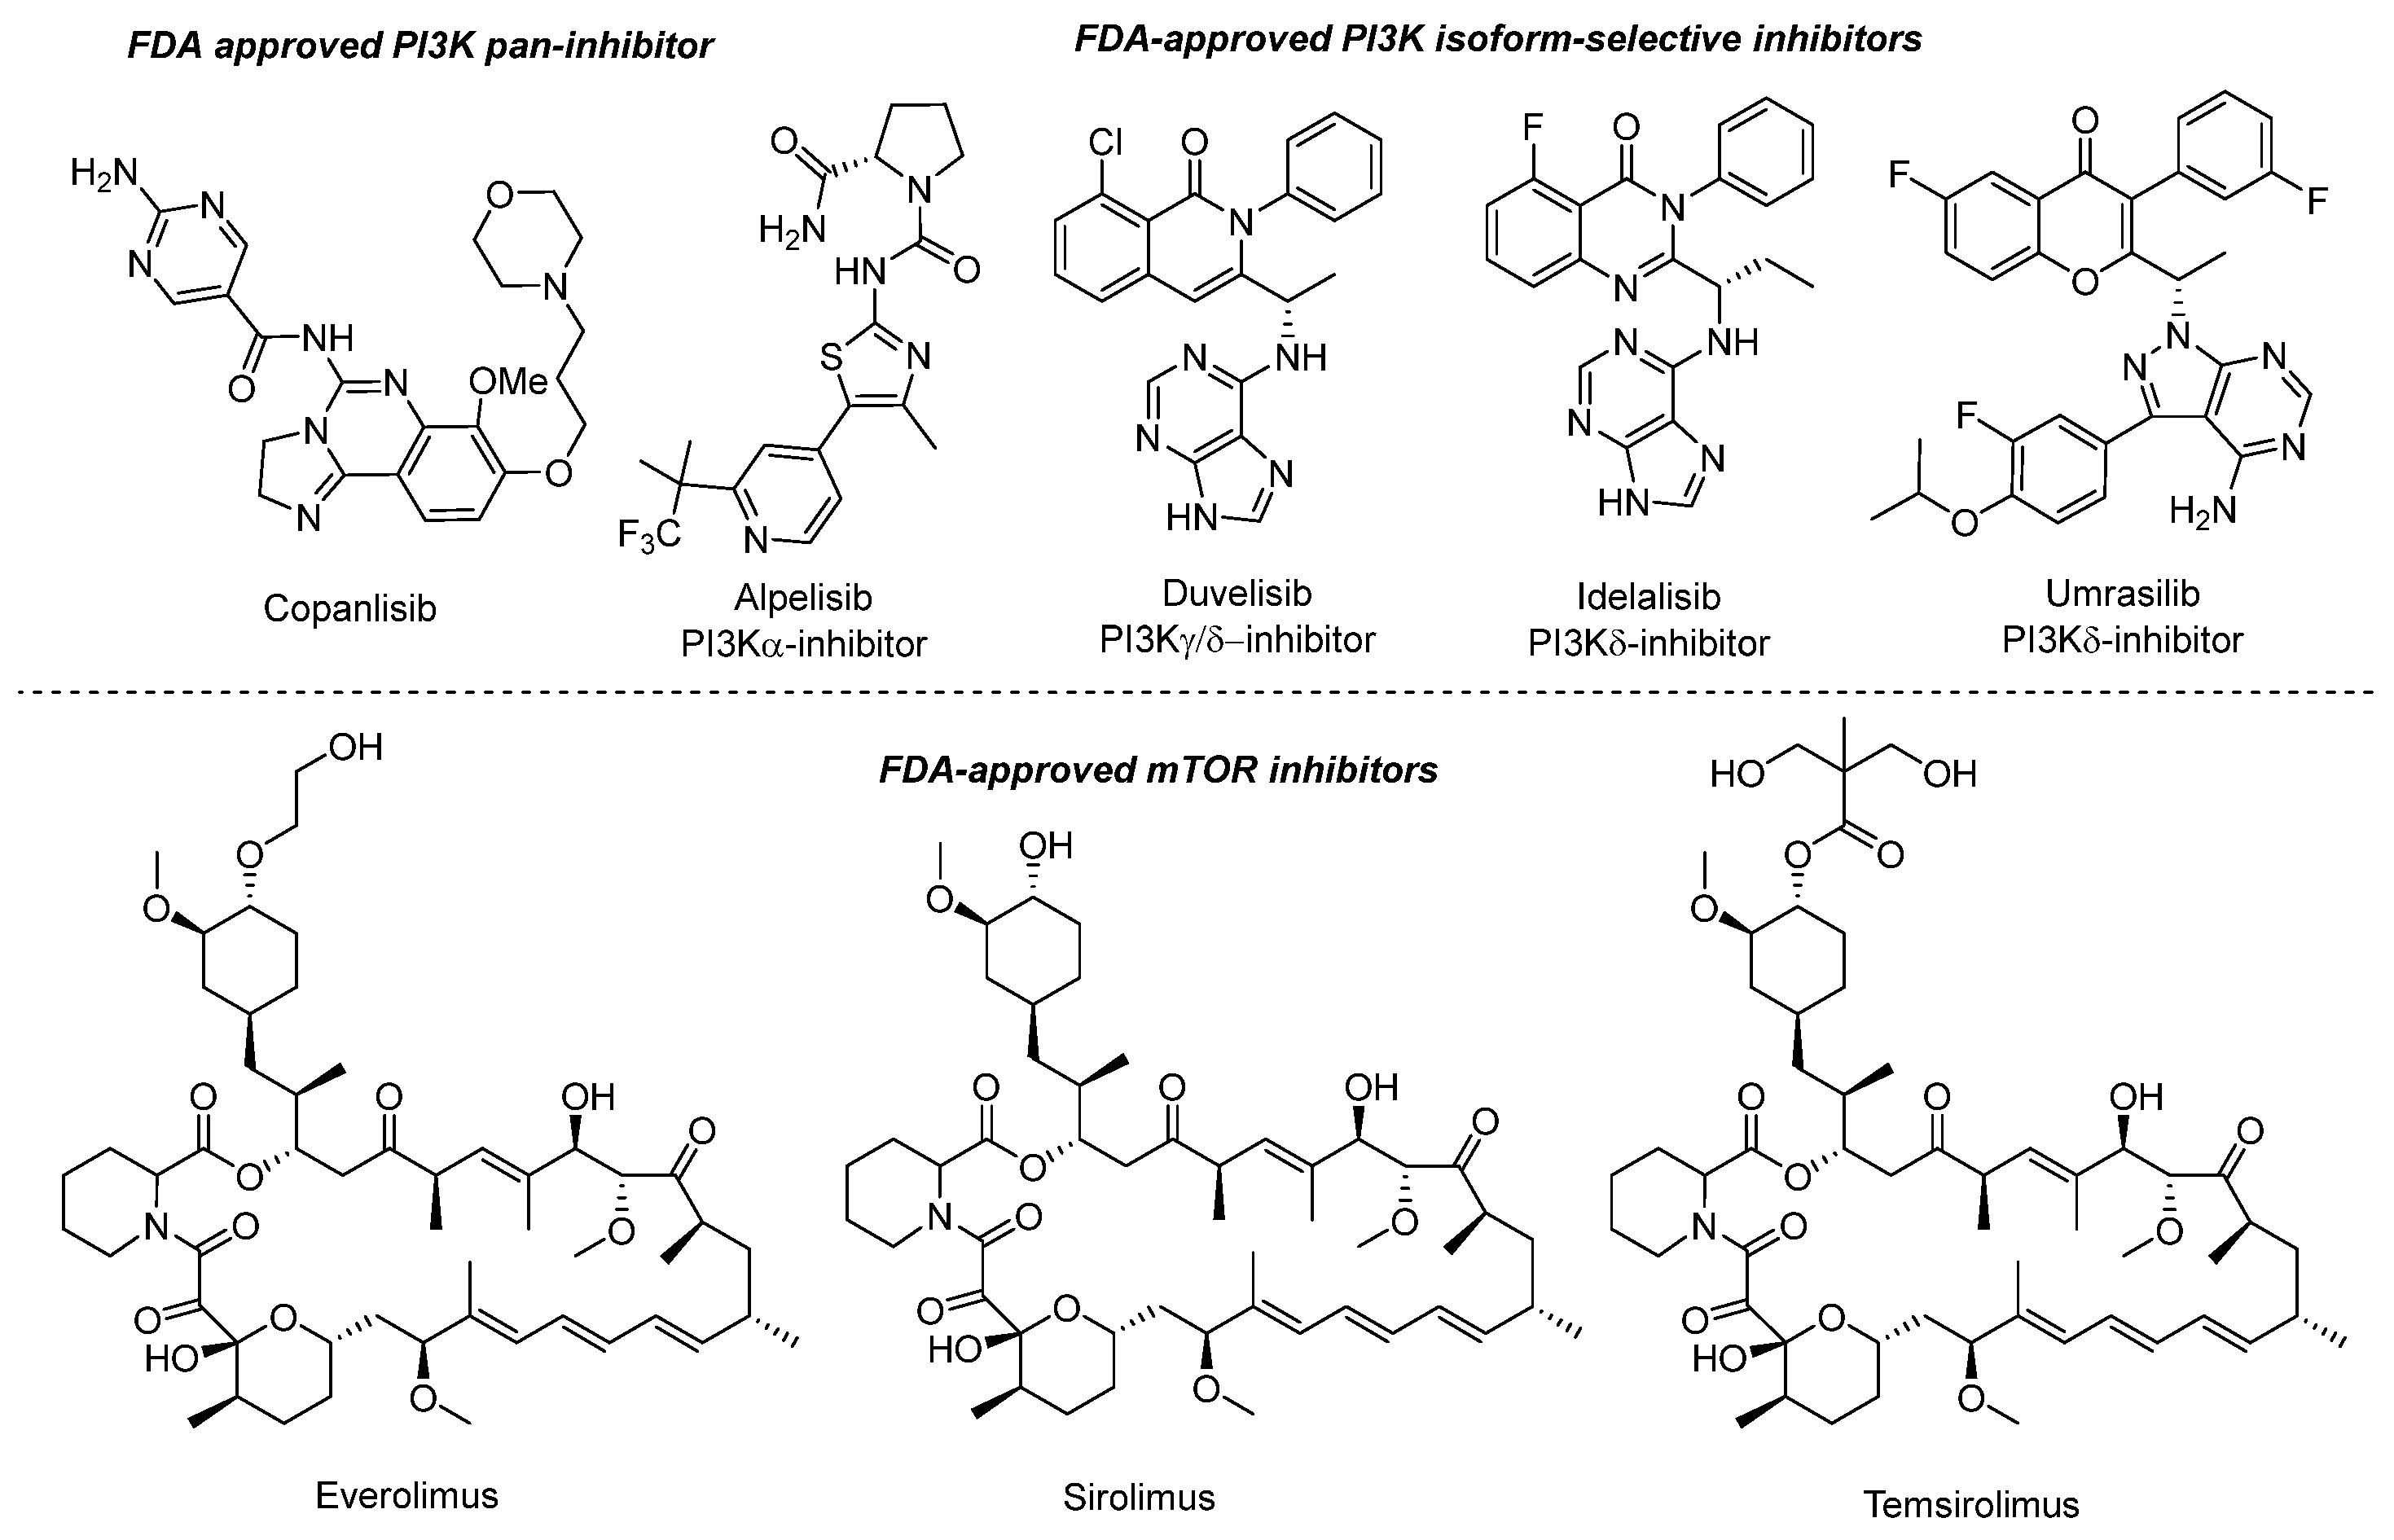
:1. Introduction
2. Results
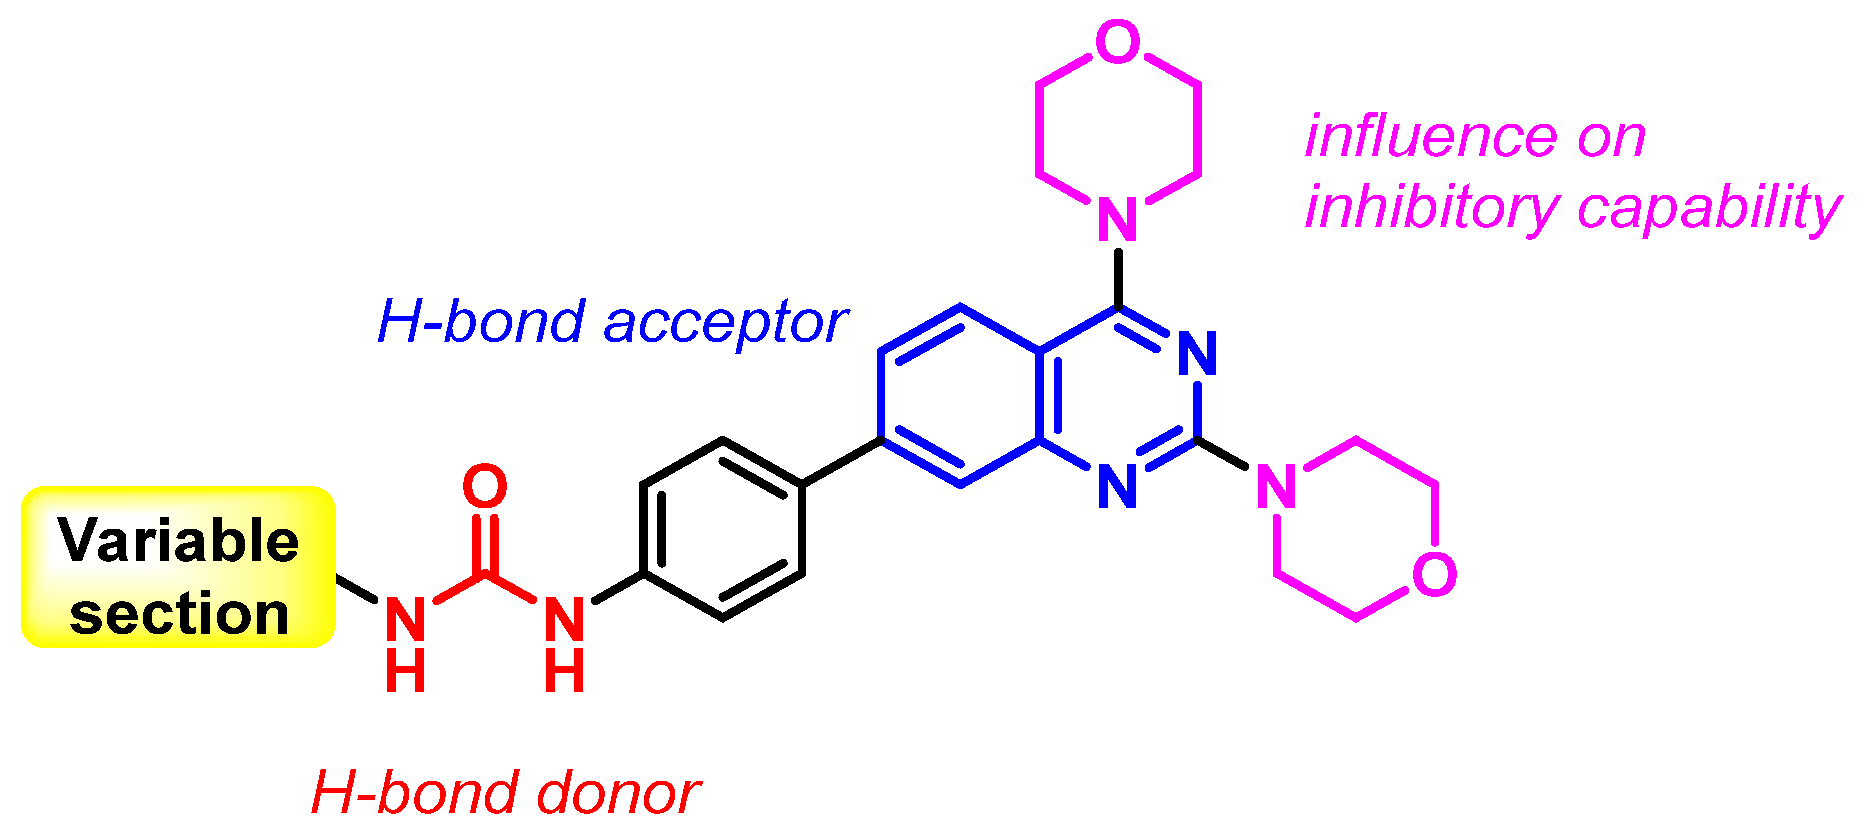
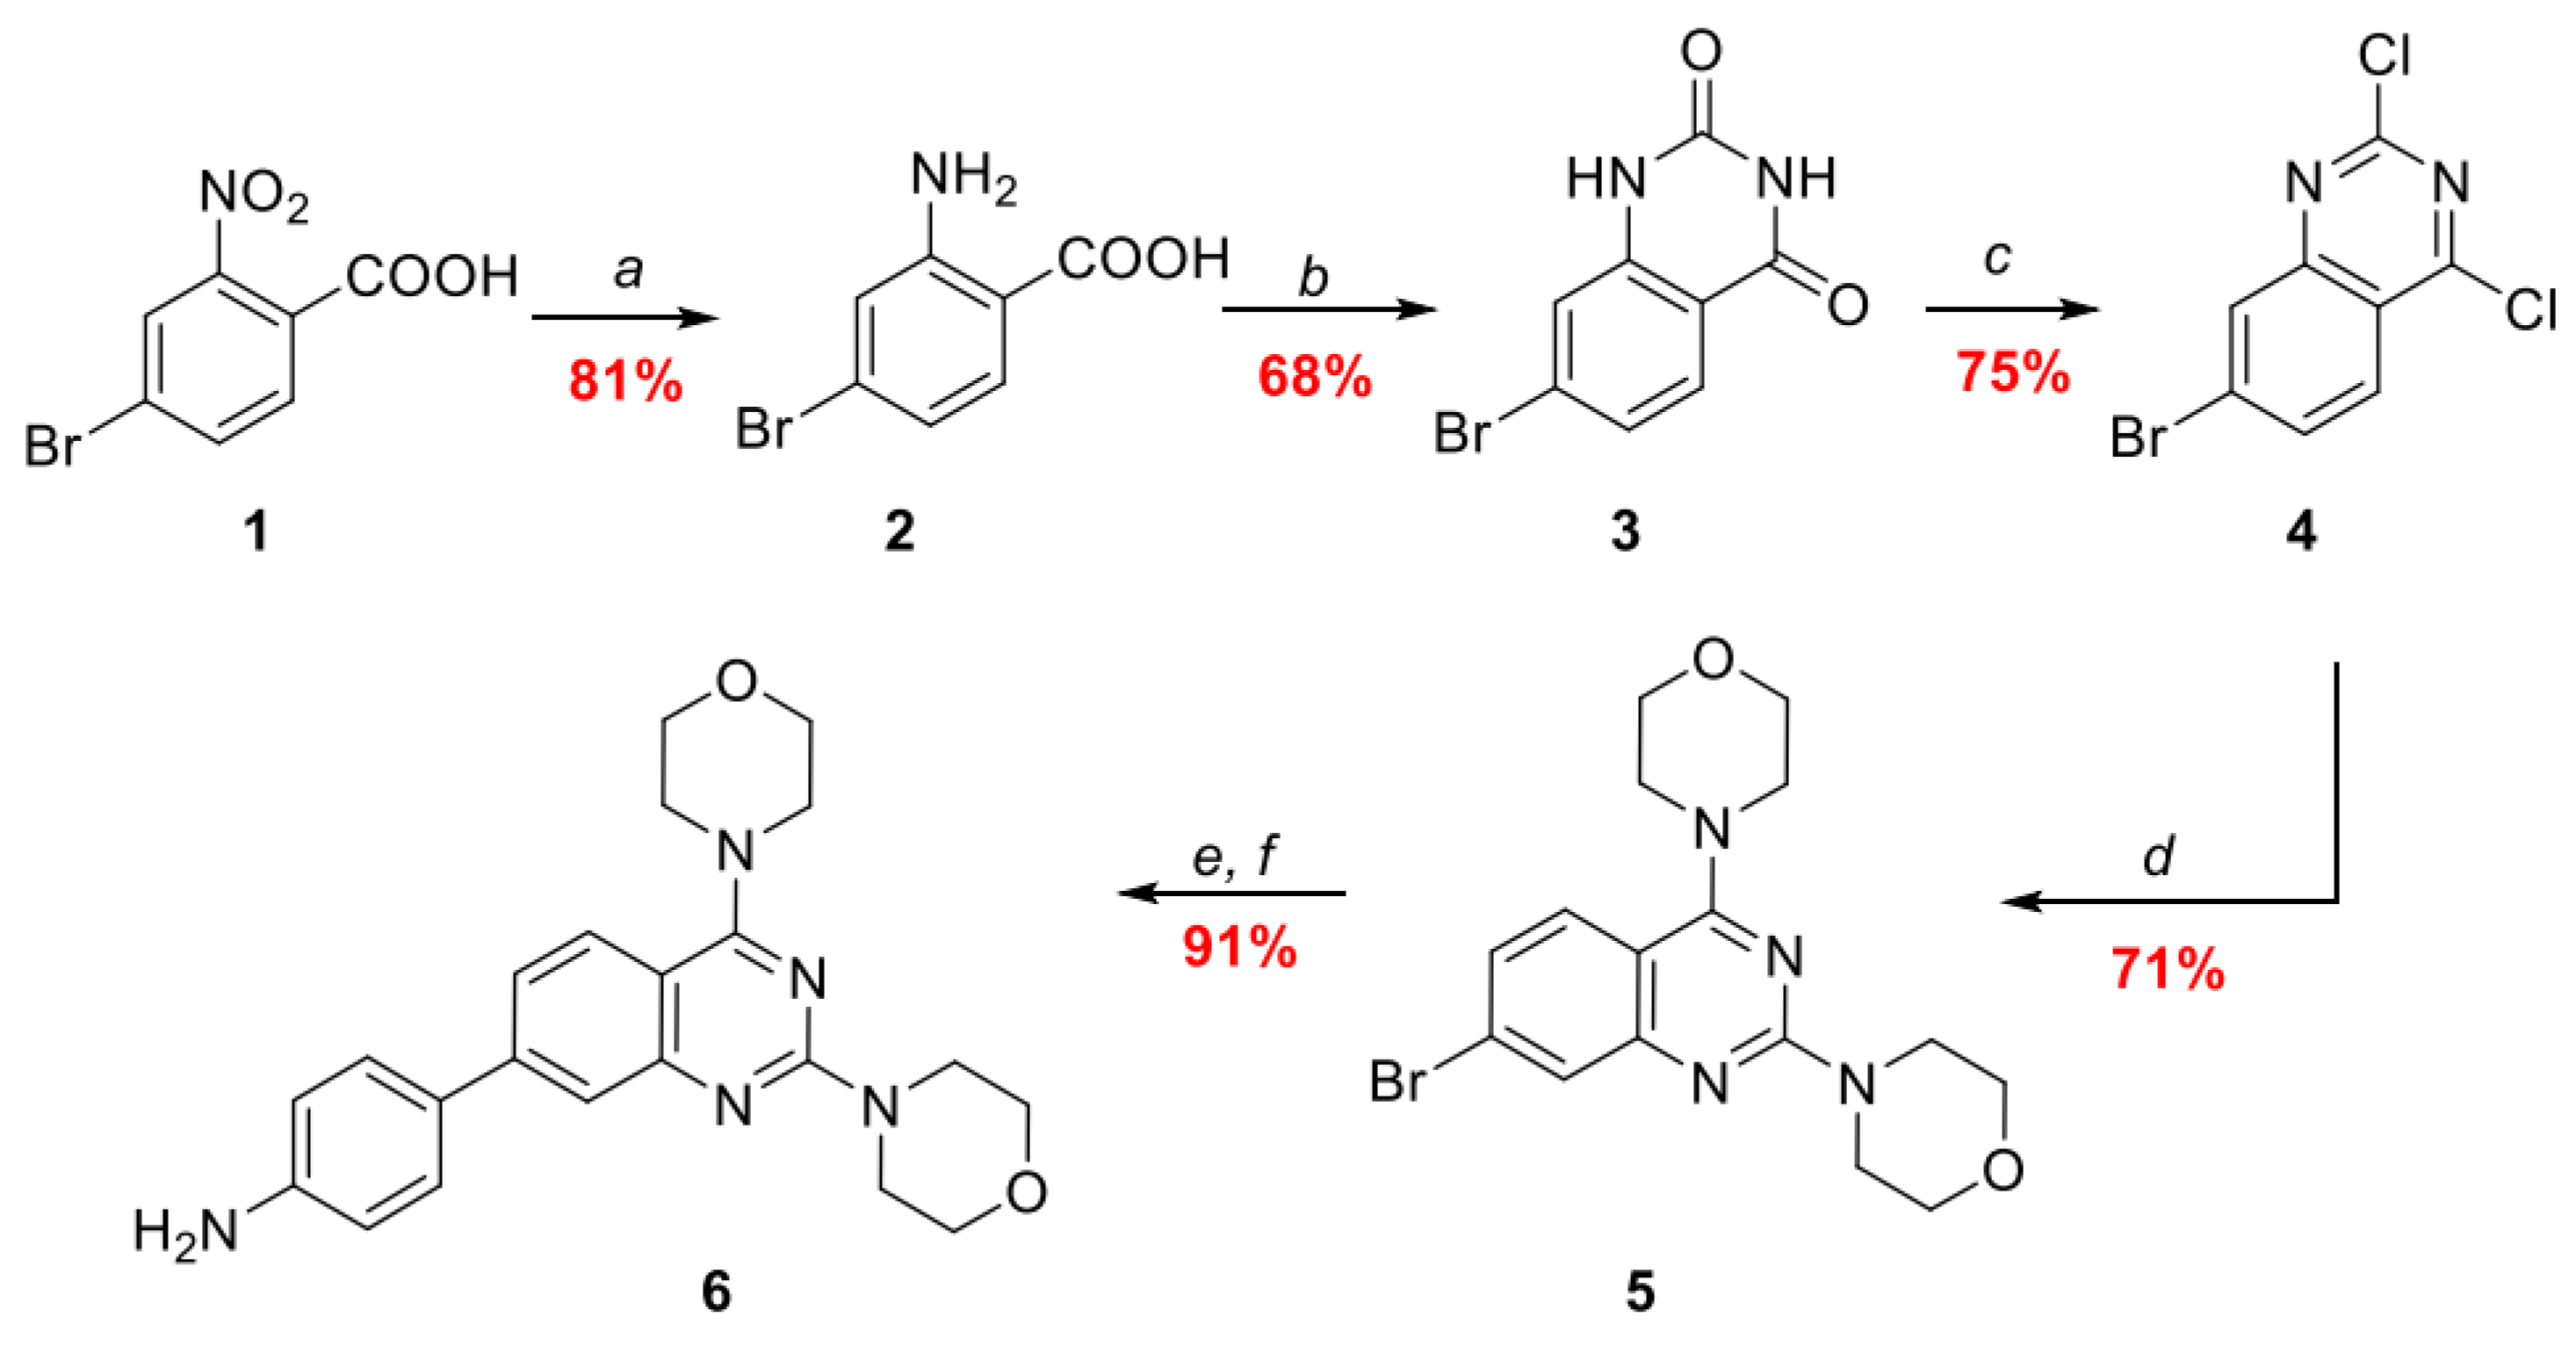
2.1. Chemistry
2.2. Biology
2.2.1. Cytotoxicity of the Compounds 7
2.2.2. Inhibition of PI3K/Akt/mTOR Signaling Pathway
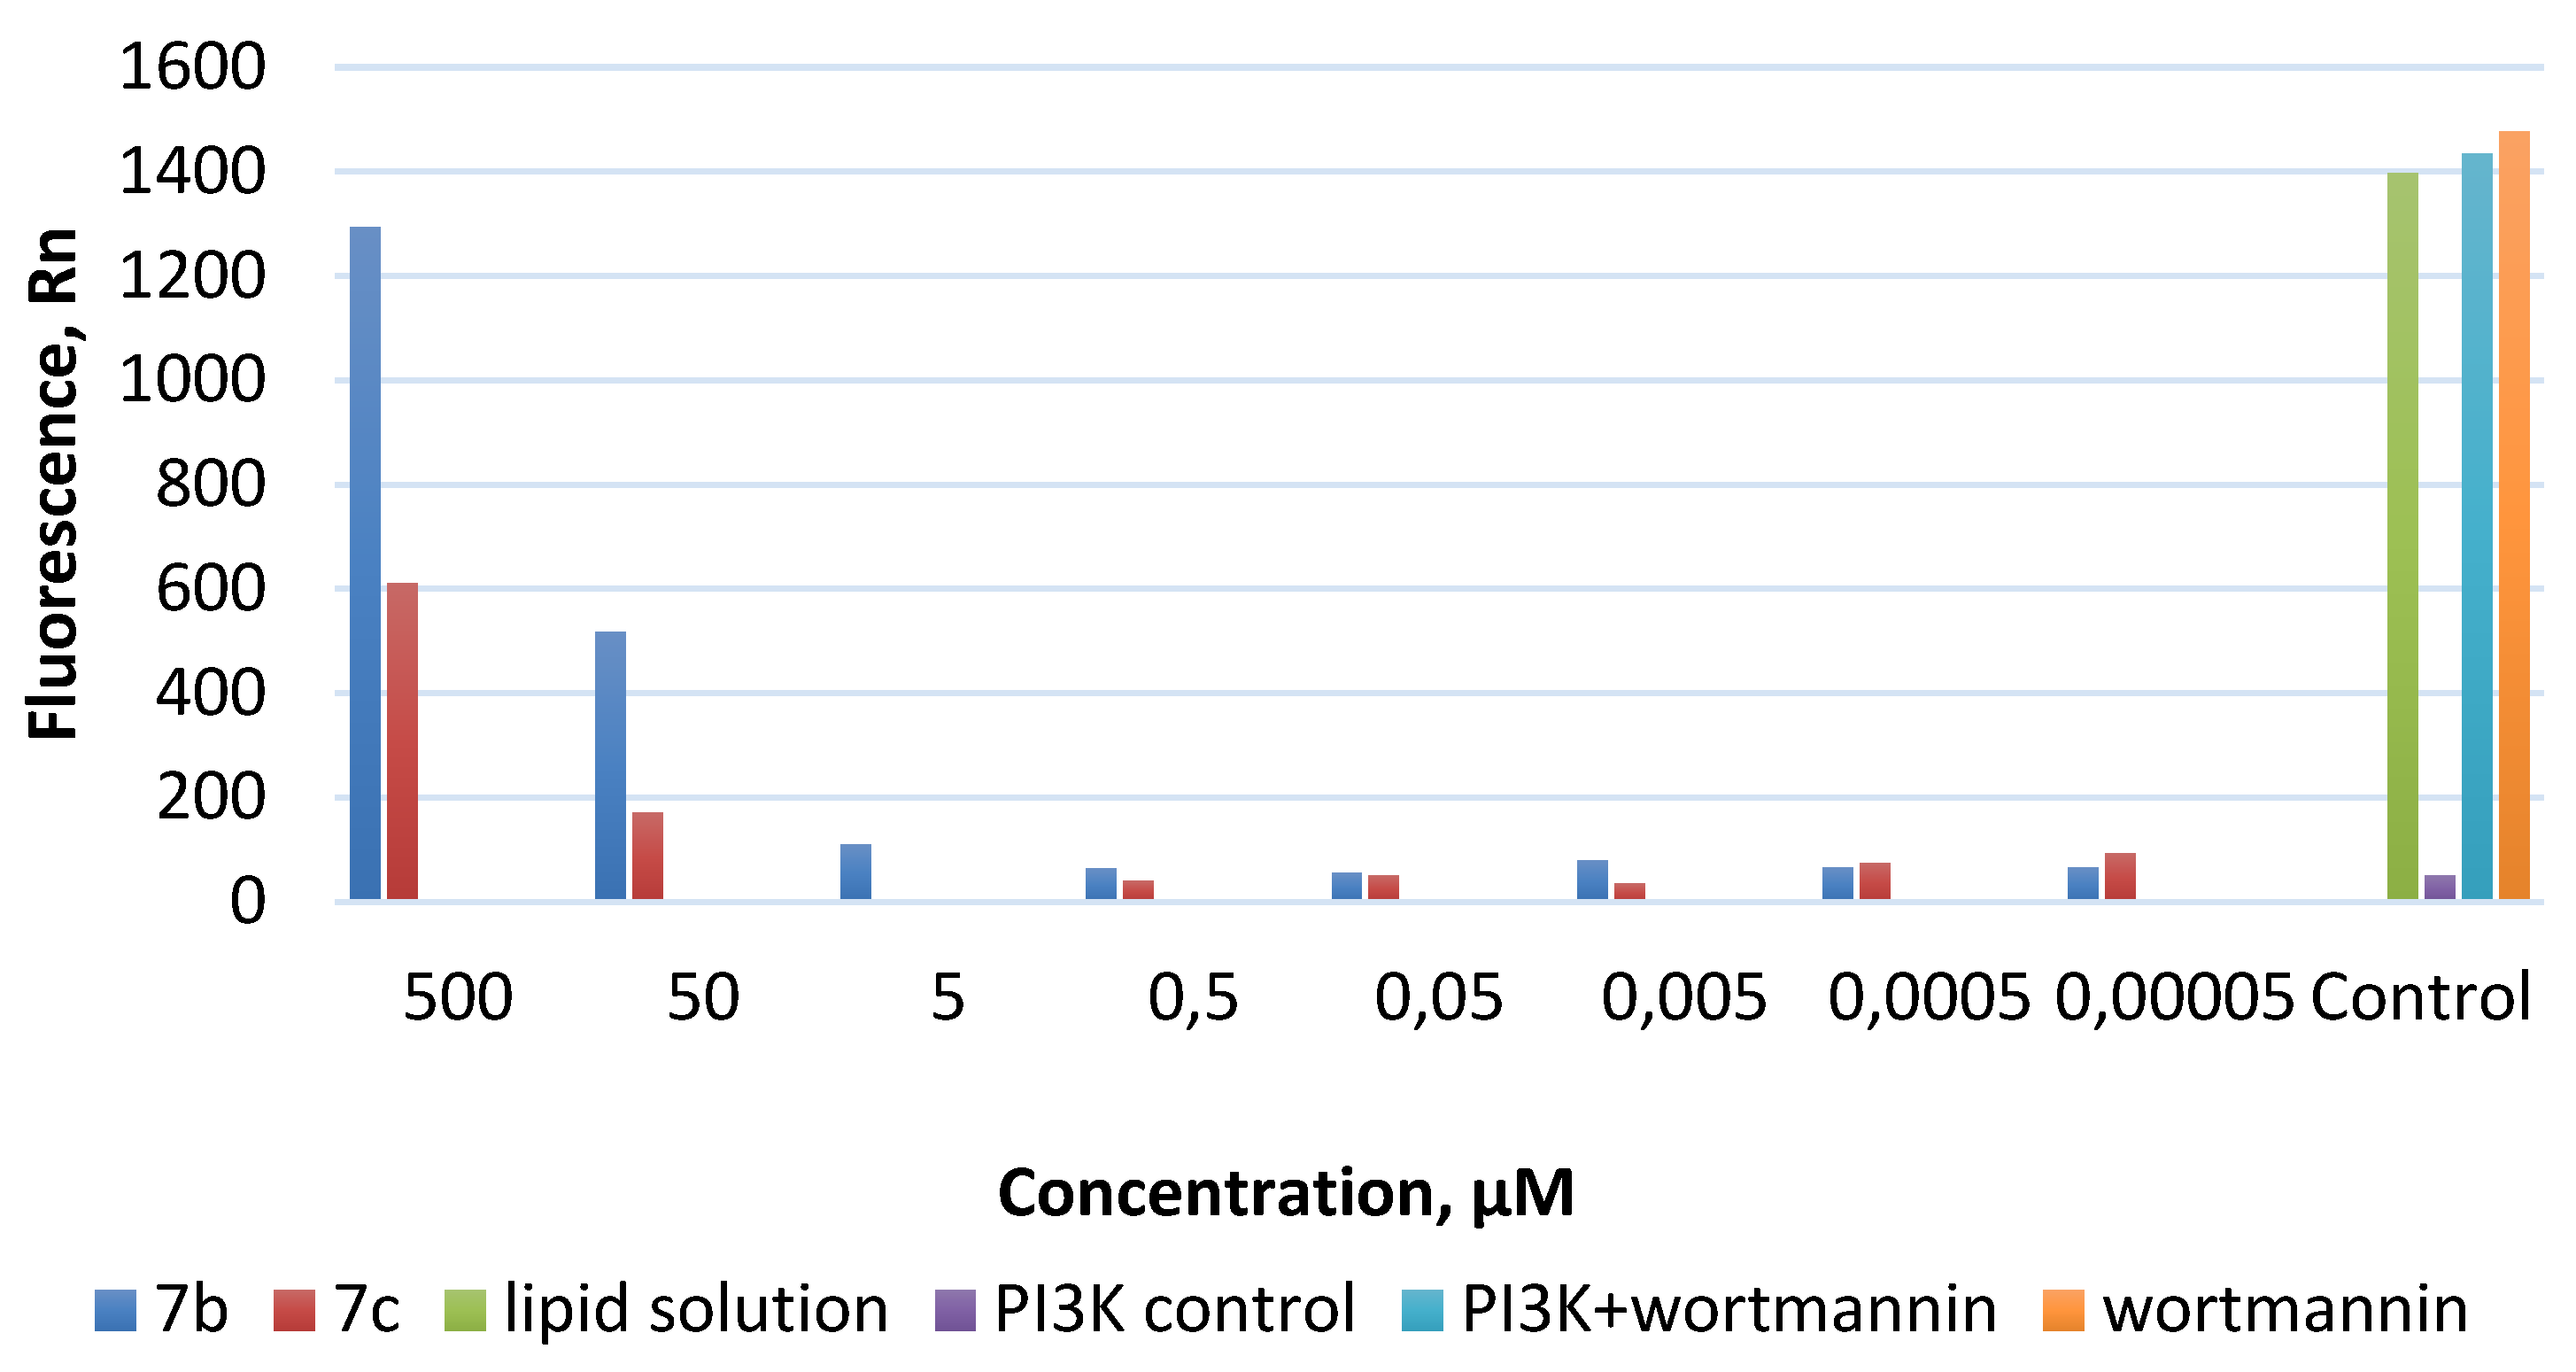
2.2.3. PI3Kα Inhibition Assay
2.2.4. Cell Cycle Analysis
2.2.5. Reactive Oxygen Species Production
2.2.6. Autophagy
2.2.7. In Vivo Tumor Growth
2.3. Docking Studies
3. Materials and Methods
3.1. General Information
3.2. Synthesis of Compounds 2–6
3.2.1. Synthesis of 2-Amino-4-bromobenzoic Acid 2
3.2.2. Synthesis of 7-Bromoquinazoline-2,4(1H,3H)-dione 3
3.2.3. Synthesis of 7-Bromo-2,4-dichloroquinazoline 4
3.2.4. Synthesis of 4,4’-(7-Bromoquinazoline-2,4-diyl)dimorpholine 5
3.2.5. Synthesis of Tert-butyl (4-(2,4-dimorpholinoquinazolin-7-yl)phenyl)carbamate
3.2.6. Synthesis of 4-(2,4-Dimorpholinoquinazolin-7-yl)aniline 6
3.3. General Procedure for Synthesis of Compounds 7a–l
3.3.1. 1-(4-(2,4-Dimorpholinoquinazolin-7-yl)phenyl)-3-(furan-2-ylmethyl)urea 7a
3.3.2. 1-(4-(2,4-Dimorpholinoquinazolin-7-yl)phenyl)-3-(4-methoxybenzyl)urea 7b
3.3.3. 1-(4-(2,4-Dimorpholinoquinazolin-7-yl)phenyl)-3-(2-(pyridin-3-yl)ethyl)urea 7c
3.3.4. 1-Cyclopropyl-3-(4-(2,4-dimorpholinoquinazolin-7-yl)phenyl)urea 7d
3.3.5. N6-((4-(2,4-Dimorpholinoquinazolin-7-yl)phenyl)carbamoyl)lysine 7e
3.3.6. 1-(4-(2,4-Dimorpholinoquinazolin-7-yl)phenyl)-3-(4-nitrophenyl)urea 7f
3.3.7. 1-(4-(2,4-Dimorpholinoquinazolin-7-yl)phenyl)-3-(4-fluorophenyl)urea 7g
3.3.8. 1-(4-(2,4-Dimorpholinoquinazolin-7-yl)phenyl)-3-(pyridin-2-yl)urea 7h
3.3.9. 1-(4-(2,4-Dimorpholinoquinazolin-7-yl)phenyl)-3-(naphthalen-1-yl)urea 7i
3.3.10. Methyl 4-(3-(4-(2,4-Dimorpholinoquinazolin-7-yl)phenyl)ureido)benzoate 7j
3.3.11. Ethyl 4-((4-(2,4-Dimorpholinoquinazolin-7-yl)phenyl)carbamoyl)piperazine-1-carboxylate 7k
3.3.12. 1-(4-(2,4-Dimorpholinoquinazolin-7-yl)phenyl)-3-(prop-2-yn-1-yl)urea 7l
3.4. Biological Assays
3.4.1. Cytotoxicity of the Target Compounds
3.4.2. Immunoblotting
3.4.3. PI3K Inhibition Assay
3.4.4. Cell Cycle Analysis
3.4.5. Reactive Oxygen Species (ROS) Production
3.4.6. Confocal Analysis
3.4.7. In Vivo Studies
3.4.8. Docking Studies
4. Conclusions
Supplementary Materials
Author Contributions
Funding
Institutional Review Board Statement
Informed Consent Statement
Data Availability Statement
Acknowledgments
Conflicts of Interest
References
- Fruman, D.A.; Chiu, H.; Hopkins, B.D.; Bagrodia, S.; Cantley, L.C.; Abraham, R.T. The PI3K Pathway in Human Disease. Cell 2017, 170, 605–635. [Google Scholar] [CrossRef] [PubMed]
- Yang, J.; Nie, J.; Ma, X.; Wei, Y.; Peng, Y.; Wei, X. Targeting PI3K in Cancer: Mechanisms and Advances in Clinical Trials. Mol. Cancer 2019, 18, 26. [Google Scholar] [CrossRef] [PubMed]
- Fruman, D.A.; Rommel, C. PI3K and Cancer: Lessons, Challenges and Opportunities. Nat. Rev. Drug Discov. 2014, 13, 140–156. [Google Scholar] [CrossRef] [PubMed]
- Jiang, N.; Dai, Q.; Su, X.; Fu, J.; Feng, X.; Peng, J. Role of PI3K/AKT Pathway in Cancer: The Framework of Malignant Behavior. Mol. Biol. Rep. 2020, 47, 4587–4629. [Google Scholar] [CrossRef]
- Sampaio, N.G.; Yu, W.; Cox, D.; Wyckoff, J.; Condeelis, J.; Stanley, E.R.; Pixley, F.J. Phosphorylation of CSF-1R Y721 Mediates Its Association with PI3K to Regulate Macrophage Motility and Enhancement of Tumor Cell Invasion. J. Cell Sci. 2011, 124, 2021–2031. [Google Scholar] [CrossRef]
- Schmid, M.C.; Avraamides, C.J.; Dippold, H.C.; Franco, I.; Foubert, P.; Ellies, L.G.; Acevedo, L.M.; Manglicmot, J.R.E.; Song, X.; Wrasidlo, W.; et al. Receptor Tyrosine Kinases and TLR/IL1Rs Unexpectedly Activate Myeloid Cell PI3Kγ, A Single Convergent Point Promoting Tumor Inflammation and Progression. Cancer Cell 2011, 19, 715–727. [Google Scholar] [CrossRef]
- Hirsch, E.; Ciraolo, E.; Franco, I.; Ghigo, A.; Martini, M. PI3K in Cancer–Stroma Interactions: Bad in Seed and Ugly in Soil. Oncogene 2014, 33, 3083–3090. [Google Scholar] [CrossRef]
- Dituri, F.; Mazzocca, A.; Giannelli, G.; Antonaci, S. PI3K Functions in Cancer Progression, Anticancer Immunity and Immune Evasion by Tumors. Clin. Dev. Immunol. 2011, 2011, 1–10. [Google Scholar] [CrossRef]
- She, Q.-B.; Halilovic, E.; Ye, Q.; Zhen, W.; Shirasawa, S.; Sasazuki, T.; Solit, D.B.; Rosen, N. 4E-BP1 Is a Key Effector of the Oncogenic Activation of the AKT and ERK Signaling Pathways That Integrates Their Function in Tumors. Cancer Cell 2010, 18, 39–51. [Google Scholar] [CrossRef]
- Lee, T.; Yao, G.; Nevins, J.; You, L. Sensing and Integration of Erk and PI3K Signals by Myc. PLoS Comput. Biol. 2008, 4, e1000013. [Google Scholar] [CrossRef] [PubMed] [Green Version]
- Dey, N.; Leyland-Jones, B.; De, P. MYC-Xing It up with PIK3CA Mutation and Resistance to PI3K Inhibitors: Summit of Two Giants in Breast Cancers. Am. J. Cancer Res. 2015, 5, 1–19. [Google Scholar]
- Thorpe, L.M.; Yuzugullu, H.; Zhao, J.J. PI3K in Cancer: Divergent Roles of Isoforms, Modes of Activation and Therapeutic Targeting. Nat. Rev. Cancer 2015, 15, 7–24. [Google Scholar] [CrossRef]
- Janku, F.; Yap, T.A.; Meric-Bernstam, F. Targeting the PI3K Pathway in Cancer: Are We Making Headway? Nat. Rev. Clin. Oncol. 2018, 15, 273–291. [Google Scholar] [CrossRef] [PubMed]
- Gulluni, F.; De Santis, M.C.; Margaria, J.P.; Martini, M.; Hirsch, E. Class II PI3K Functions in Cell Biology and Disease. Trends Cell Biol. 2019, 29, 339–359. [Google Scholar] [CrossRef] [PubMed]
- Jean, S.; Kiger, A.A. Classes of Phosphoinositide 3-Kinases at a Glance. J. Cell Sci. 2014, 127, 923–928. [Google Scholar] [CrossRef] [PubMed]
- Nobukuni, T.; Joaquin, M.; Roccio, M.; Dann, S.G.; Kim, S.Y.; Gulati, P.; Byfield, M.P.; Backer, J.M.; Natt, F.; Bos, J.L.; et al. Amino Acids Mediate MTOR/Raptor Signaling through Activation of Class 3 Phosphatidylinositol 3OH-Kinase. Proc. Natl. Acad. Sci. USA 2005, 102, 14238–14243. [Google Scholar] [CrossRef]
- Martini, M.; De Santis, M.C.; Braccini, L.; Gulluni, F.; Hirsch, E. PI3K/AKT Signaling Pathway and Cancer: An Updated Review. Ann. Med. 2014, 46, 372–383. [Google Scholar] [CrossRef]
- Franke, T.F. PI3K/Akt: Getting It Right Matters. Oncogene 2008, 27, 6473–6488. [Google Scholar] [CrossRef]
- Revathidevi, S.; Munirajan, A.K. Akt in Cancer: Mediator and More. Semin. Cancer Biol. 2019, 59, 80–91. [Google Scholar] [CrossRef]
- Cerami, E.; Gao, J.; Dogrusoz, U.; Gross, B.E.; Sumer, S.O.; Aksoy, B.A.; Jacobsen, A.; Byrne, C.J.; Heuer, M.L.; Larsson, E.; et al. The CBio Cancer Genomics Portal: An Open Platform for Exploring Multidimensional Cancer Genomics Data: Figure 1. Cancer Discov. 2012, 2, 401–404. [Google Scholar] [CrossRef]
- Stemke-Hale, K.; Gonzalez-Angulo, A.M.; Lluch, A.; Neve, R.M.; Kuo, W.-L.; Davies, M.; Carey, M.; Hu, Z.; Guan, Y.; Sahin, A.; et al. An Integrative Genomic and Proteomic Analysis of PIK3CA, PTEN, and AKT Mutations in Breast Cancer. Cancer Res. 2008, 68, 6084–6091. [Google Scholar] [CrossRef] [Green Version]
- Yang, H.; Rudge, D.G.; Koos, J.D.; Vaidialingam, B.; Yang, H.J.; Pavletich, N.P. MTOR Kinase Structure, Mechanism and Regulation. Nature 2013, 497, 217–223. [Google Scholar] [CrossRef]
- Zou, Z.; Tao, T.; Li, H.; Zhu, X. MTOR Signaling Pathway and MTOR Inhibitors in Cancer: Progress and Challenges. Cell Biosci. 2020, 10, 31. [Google Scholar] [CrossRef]
- Heavey, S.; O’Byrne, K.J.; Gately, K. Strategies for Co-Targeting the PI3K/AKT/MTOR Pathway in NSCLC. Cancer Treat. Rev. 2014, 40, 445–456. [Google Scholar] [CrossRef] [PubMed]
- Matasar, M.J.; Capra, M.; Özcan, M.; Lv, F.; Li, W.; Yañez, E.; Sapunarova, K.; Lin, T.; Jin, J.; Jurczak, W.; et al. Copanlisib plus Rituximab versus Placebo plus Rituximab in Patients with Relapsed Indolent Non-Hodgkin Lymphoma (CHRONOS-3): A Double-Blind, Randomised, Placebo-Controlled, Phase 3 Trial. Lancet Oncol. 2021, 22, 678–689. [Google Scholar] [CrossRef]
- Castel, P.; Toska, E.; Engelman, J.A.; Scaltriti, M. The Present and Future of PI3K Inhibitors for Cancer Therapy. Nat. Cancer 2021, 2, 587–597. [Google Scholar] [CrossRef] [PubMed]
- Baselga, J.; Im, S.-A.; Iwata, H.; Cortés, J.; De Laurentiis, M.; Jiang, Z.; Arteaga, C.L.; Jonat, W.; Clemons, M.; Ito, Y.; et al. Buparlisib plus Fulvestrant versus Placebo plus Fulvestrant in Postmenopausal, Hormone Receptor-Positive, HER2-Negative, Advanced Breast Cancer (BELLE-2): A Randomised, Double-Blind, Placebo-Controlled, Phase 3 Trial. Lancet Oncol. 2017, 18, 904–916. [Google Scholar] [CrossRef]
- Garces, A.E.; Stocks, M.J. Class 1 PI3K Clinical Candidates and Recent Inhibitor Design Strategies: A Medicinal Chemistry Perspective. J. Med. Chem. 2019, 62, 4815–4850. [Google Scholar] [CrossRef]
- Sabbah, D.A.; Hajjo, R.; Bardaweel, S.K.; Zhong, H.A. Phosphatidylinositol 3-Kinase (PI3K) Inhibitors: A Recent Update on Inhibitor Design and Clinical Trials (2016–2020). Expert Opin. Ther. Pat. 2021, 31, 877–892. [Google Scholar] [CrossRef] [PubMed]
- Hillmann, P.; Fabbro, D. PI3K/MTOR Pathway Inhibition: Opportunities in Oncology and Rare Genetic Diseases. Int. J. Mol. Sci. 2019, 20, 5792. [Google Scholar] [CrossRef]
- Peng, Y.; Wang, Y.; Zhou, C.; Mei, W.; Zeng, C. PI3K/Akt/MTOR Pathway and Its Role in Cancer Therapeutics: Are We Making Headway? Front. Oncol. 2022, 12, 819128. [Google Scholar] [CrossRef]
- Borsari, C.; Rageot, D.; Beaufils, F.; Bohnacker, T.; Keles, E.; Buslov, I.; Melone, A.; Sele, A.M.; Hebeisen, P.; Fabbro, D.; et al. Preclinical Development of PQR514, a Highly Potent PI3K Inhibitor Bearing a Difluoromethyl–Pyrimidine Moiety. ACS Med. Chem. Lett. 2019, 10, 1473–1479. [Google Scholar] [CrossRef]
- Hu, J.; Zhang, Y.; Tang, N.; Lu, Y.; Guo, P.; Huang, Z. Discovery of Novel 1,3,5-Triazine Derivatives as Potent Inhibitor of Cervical Cancer via Dual Inhibition of PI3K/MTOR. Bioorg. Med. Chem. 2021, 32, 115997. [Google Scholar] [CrossRef]
- Mahajan, D.; Sen, S.; Kuila, B.; Sharma, A.; Arora, R.; Sagar, M.; Mahapatra, A.R.; Gawade, L.B.; Dugar, S. Discovery and Development of SPR519 as a Potent, Selective, and Orally Bioavailable Inhibitor of PI3Kα and MTOR Kinases for the Treatment of Solid Tumors. J. Med. Chem. 2020, 63, 11121–11130. [Google Scholar] [CrossRef]
- Wu, T.-T.; Guo, Q.-Q.; Chen, Z.-L.; Wang, L.-L.; Du, Y.; Chen, R.; Mao, Y.-H.; Yang, S.-G.; Huang, J.; Wang, J.-T.; et al. Design, Synthesis and Bioevaluation of Novel Substituted Triazines as Potential Dual PI3K/MTOR Inhibitors. Eur. J. Med. Chem. 2020, 204, 112637. [Google Scholar] [CrossRef]
- Rageot, D.; Bohnacker, T.; Keles, E.; McPhail, J.A.; Hoffmann, R.M.; Melone, A.; Borsari, C.; Sriramaratnam, R.; Sele, A.M.; Beaufils, F.; et al. (S)-4-(Difluoromethyl)-5-(4-(3-Methylmorpholino)-6-Morpholino-1,3,5-Triazin-2-Yl)Pyridin-2-Amine (PQR530), a Potent, Orally Bioavailable, and Brain-Penetrable Dual Inhibitor of Class I PI3K and MTOR Kinase. J. Med. Chem. 2019, 62, 6241–6261. [Google Scholar] [CrossRef]
- Yaguchi, S.; Izumisawa, Y.; Sato, M.; Nakagane, T.; Koshumizu, I.; Sakita, K.; Kato, M.; Yoshioka, K.; Sakata, M.; Kawashima, S. In Vitro Cytotoxicity of Imidazolyl-1,3,5-Triazine Derivatives. Biol. Pharm. Bull. 1997, 20, 698–700. [Google Scholar] [CrossRef] [PubMed]
- Xiang, H.-Y.; Wang, X.; Chen, Y.-H.; Zhang, X.; Tan, C.; Wang, Y.; Su, Y.; Gao, Z.-W.; Chen, X.-Y.; Xiong, B.; et al. Identification of Methyl (5-(6-((4-(Methylsulfonyl)Piperazin-1-Yl)Methyl)-4-Morpholinopyrrolo[2,1-f][1,2,4]Triazin-2-Yl)-4-(Trifluoromethyl)Pyridin-2-Yl)Carbamate (CYH33) as an Orally Bioavailable, Highly Potent, PI3K Alpha Inhibitor for the Treatment of Advanced Solid Tumors. Eur. J. Med. Chem. 2021, 209, 112913. [Google Scholar] [CrossRef]
- Yang, C.; Lu, M.; Chen, Y.; Xiang, R.; Qiu, T.; Jia, Y.; Yang, Y.; Liu, X.; Deng, M.; Ling, Y.; et al. Development of Anti-Breast Cancer PI3K Inhibitors Based on 7-Azaindole Derivatives through Scaffold Hopping: Design, Synthesis and In Vitro Biological Evaluation. Bioorg. Chem. 2021, 117, 105405. [Google Scholar] [CrossRef] [PubMed]
- Gangadhara, G.; Dahl, G.; Bohnacker, T.; Rae, R.; Gunnarsson, J.; Blaho, S.; Öster, L.; Lindmark, H.; Karabelas, K.; Pemberton, N.; et al. A Class of Highly Selective Inhibitors Bind to an Active State of PI3Kγ. Nat. Chem. Biol. 2019, 15, 348–357. [Google Scholar] [CrossRef] [PubMed]
- Pemberton, N.; Mogemark, M.; Arlbrandt, S.; Bold, P.; Cox, R.J.; Gardelli, C.; Holden, N.S.; Karabelas, K.; Karlsson, J.; Lever, S.; et al. Discovery of Highly Isoform Selective Orally Bioavailable Phosphoinositide 3-Kinase (PI3K)-γ Inhibitors. J. Med. Chem. 2018, 61, 5435–5441. [Google Scholar] [CrossRef] [PubMed]
- Sun, Y.; Fu, R.; Lin, S.; Zhang, J.; Ji, M.; Zhang, Y.; Wu, D.; Zhang, K.; Tian, H.; Zhang, M.; et al. Discovery of New Thieno[2,3-d]Pyrimidine and Thiazolo[5,4-d]Pyrimidine Derivatives as Orally Active Phosphoinositide 3-Kinase Inhibitors. Bioorg. Med. Chem. 2021, 29, 115890. [Google Scholar] [CrossRef]
- Xia, L.; Zhang, Y.; Zhang, J.; Lin, S.; Zhang, K.; Tian, H.; Dong, Y.; Xu, H. Identification of Novel Thiazolo[5,4-b]Pyridine Derivatives as Potent Phosphoinositide 3-Kinase Inhibitors. Molecules 2020, 25, 4630. [Google Scholar] [CrossRef]
- Xiao, Y.; Yu, Y.; Jiang, P.; Li, Y.; Wang, C.; Zhang, R. The PI3K/MTOR Dual Inhibitor GSK458 Potently Impedes Ovarian Cancer Tumorigenesis and Metastasis. Cell. Oncol. 2020, 43, 669–680. [Google Scholar] [CrossRef] [PubMed]
- Thakur, A.; Tawa, G.J.; Henderson, M.J.; Danchik, C.; Liu, S.; Shah, P.; Wang, A.Q.; Dunn, G.; Kabir, M.; Padilha, E.C.; et al. Design, Synthesis, and Biological Evaluation of Quinazolin-4-One-Based Hydroxamic Acids as Dual PI3K/HDAC Inhibitors. J. Med. Chem. 2020, 63, 4256–4292. [Google Scholar] [CrossRef] [PubMed]
- Das, D.; Hong, J. Recent Advancements of 4-Aminoquinazoline Derivatives as Kinase Inhibitors and Their Applications in Medicinal Chemistry. Eur. J. Med. Chem. 2019, 170, 55–72. [Google Scholar] [CrossRef] [PubMed]
- Teng, Y.; Li, X.; Ren, S.; Cheng, Y.; Xi, K.; Shen, H.; Ma, W.; Luo, G.; Xiang, H. Discovery of Novel Quinazoline Derivatives as Potent PI3Kδ Inhibitors with High Selectivity. Eur. J. Med. Chem. 2020, 208, 112865. [Google Scholar] [CrossRef] [PubMed]
- Zhang, K.; Lai, F.; Lin, S.; Ji, M.; Zhang, J.; Zhang, Y.; Jin, J.; Fu, R.; Wu, D.; Tian, H.; et al. Design, Synthesis, and Biological Evaluation of 4-Methyl Quinazoline Derivatives as Anticancer Agents Simultaneously Targeting Phosphoinositide 3-Kinases and Histone Deacetylases. J. Med. Chem. 2019, 62, 6992–7014. [Google Scholar] [CrossRef]
- Zhang, K.; Ji, M.; Lin, S.; Peng, S.; Zhang, Z.; Zhang, M.; Zhang, J.; Zhang, Y.; Wu, D.; Tian, H.; et al. Design, Synthesis, and Biological Evaluation of a Novel Photocaged PI3K Inhibitor toward Precise Cancer Treatment. J. Med. Chem. 2021, 64, 7331–7340. [Google Scholar] [CrossRef]
- Miller, M.; Thompson, P.; Gabelli, S. Structural Determinants of Isoform Selectivity in PI3K Inhibitors. Biomolecules 2019, 9, 82. [Google Scholar] [CrossRef]
- Venkatesan, A.M.; Dehnhardt, C.M.; Delos Santos, E.; Chen, Z.; Dos Santos, O.; Ayral-Kaloustian, S.; Khafizova, G.; Brooijmans, N.; Mallon, R.; Hollander, I.; et al. Bis(Morpholino-1,3,5-Triazine) Derivatives: Potent Adenosine 5′-Triphosphate Competitive Phosphatidylinositol-3-Kinase/Mammalian Target of Rapamycin Inhibitors: Discovery of Compound 26 (PKI-587), a Highly Efficacious Dual Inhibitor. J. Med. Chem. 2010, 53, 2636–2645. [Google Scholar] [CrossRef]
- Nunnery, S.E.; Mayer, I.A. Management of Toxicity to Isoform α-Specific PI3K Inhibitors. Ann. Oncol. 2019, 30, x21–x26. [Google Scholar] [CrossRef] [PubMed]
- Hopkins, B.D.; Pauli, C.; Du, X.; Wang, D.G.; Li, X.; Wu, D.; Amadiume, S.C.; Goncalves, M.D.; Hodakoski, C.; Lundquist, M.R.; et al. Suppression of Insulin Feedback Enhances the Efficacy of PI3K Inhibitors. Nature 2018, 560, 499–503. [Google Scholar] [CrossRef] [PubMed]
- Sorokin, D.; Shchegolev, Y.; Scherbakov, A.; Ryabaya, O.; Gudkova, M.; Berstein, L.; Krasil’nikov, M. Metformin Restores the Drug Sensitivity of MCF-7 Cells Resistant Derivates via the Cooperative Modulation of Growth and Apoptotic-Related Pathways. Pharmaceuticals 2020, 13, 206. [Google Scholar] [CrossRef]
- Henning, R.J.; Bourgeois, M.; Harbison, R.D. Poly(ADP-Ribose) Polymerase (PARP) and PARP Inhibitors: Mechanisms of Action and Role in Cardiovascular Disorders. Cardiovasc. Toxicol. 2018, 18, 493–506. [Google Scholar] [CrossRef]
- Chen, G.; Ding, X.-F.; Bouamar, H.; Pressley, K.; Sun, L.-Z. Everolimus Induces G 1 Cell Cycle Arrest through Autophagy-Mediated Protein Degradation of Cyclin D1 in Breast Cancer Cells. Am. J. Physiol. Physiol. 2019, 317, C244–C252. [Google Scholar] [CrossRef]
- Yang, J.; Pi, C.; Wang, G. Inhibition of PI3K/Akt/MTOR Pathway by Apigenin Induces Apoptosis and Autophagy in Hepatocellular Carcinoma Cells. Biomed. Pharmacother. 2018, 103, 699–707. [Google Scholar] [CrossRef]
- Xue, J.-F.; Shi, Z.-M.; Zou, J.; Li, X.-L. Inhibition of PI3K/AKT/MTOR Signaling Pathway Promotes Autophagy of Articular Chondrocytes and Attenuates Inflammatory Response in Rats with Osteoarthritis. Biomed. Pharmacother. 2017, 89, 1252–1261. [Google Scholar] [CrossRef] [PubMed]
- Kim, Y.C.; Guan, K.-L. MTOR: A Pharmacologic Target for Autophagy Regulation. J. Clin. Investig. 2015, 125, 25–32. [Google Scholar] [CrossRef]
- Rong, L.; Li, Z.; Leng, X.; Li, H.; Ma, Y.; Chen, Y.; Song, F. Salidroside Induces Apoptosis and Protective Autophagy in Human Gastric Cancer AGS Cells through the PI3K/Akt/MTOR Pathway. Biomed. Pharmacother. 2020, 122, 109726. [Google Scholar] [CrossRef]
- Lin, X.; Han, L.; Weng, J.; Wang, K.; Chen, T. Rapamycin Inhibits Proliferation and Induces Autophagy in Human Neuroblastoma Cells. Biosci. Rep. 2018, 38, BSR20181822. [Google Scholar] [CrossRef] [Green Version]
- Stjepanovic, G.; Davies, C.W.; Stanley, R.E.; Ragusa, M.J.; Kim, D.J.; Hurley, J.H. Assembly and Dynamics of the Autophagy-Initiating Atg1 Complex. Proc. Natl. Acad. Sci. USA 2014, 111, 12793–12798. [Google Scholar] [CrossRef]
- Matamala, E.; Castillo, C.; Vivar, J.P.; Rojas, P.A.; Brauchi, S.E. Imaging the Electrical Activity of Organelles in Living Cells. Commun. Biol. 2021, 4, 389. [Google Scholar] [CrossRef]
- Cang, C.; Bekele, B.; Ren, D. The Voltage-Gated Sodium Channel TPC1 Confers Endolysosomal Excitability. Nat. Chem. Biol. 2014, 10, 463–469. [Google Scholar] [CrossRef]
- Cang, C.; Zhou, Y.; Navarro, B.; Seo, Y.; Aranda, K.; Shi, L.; Battaglia-Hsu, S.; Nissim, I.; Clapham, D.E.; Ren, D. MTOR Regulates Lysosomal ATP-Sensitive Two-Pore Na+ Channels to Adapt to Metabolic State. Cell 2013, 152, 778–790. [Google Scholar] [CrossRef] [PubMed]
- Hao, J.; Zhang, W.; Huang, Z. Bupivacaine Modulates the Apoptosis and Ferroptosis in Bladder Cancer via Phosphatidylinositol 3-Kinase (PI3K)/AKT Pathway. Bioengineered 2022, 13, 6794–6806. [Google Scholar] [CrossRef]
- Fan, F.; Liu, P.; Bao, R.; Chen, J.; Zhou, M.; Mo, Z.; Ma, Y.; Liu, H.; Zhou, Y.; Cai, X.; et al. A Dual PI3K/HDAC Inhibitor Induces Immunogenic Ferroptosis to Potentiate Cancer Immune Checkpoint Therapy. Cancer Res. 2021, 81, 6233–6245. [Google Scholar] [CrossRef] [PubMed]
- Melero, I.; Castanon, E.; Alvarez, M.; Champiat, S.; Marabelle, A. Intratumoural Administration and Tumour Tissue Targeting of Cancer Immunotherapies. Nat. Rev. Clin. Oncol. 2021, 18, 558–576. [Google Scholar] [CrossRef]
- Walker, E.H.; Perisic, O.; Ried, C.; Stephens, L.; Williams, R.L. Structural Insights into Phosphoinositide 3-Kinase Catalysis and Signalling. Nature 1999, 402, 313–320. [Google Scholar] [CrossRef]
- Zheng, Z.; Amran, S.I.; Thompson, P.E.; Jennings, I.G. Isoform-Selective Inhibition of Phosphoinositide 3-Kinase: Identification of a New Region of Nonconserved Amino Acids Critical for P110α Inhibition. Mol. Pharmacol. 2011, 80, 657–664. [Google Scholar] [CrossRef] [PubMed]
- Zheng, Z.; Amran, S.I.; Zhu, J.; Schmidt-Kittler, O.; Kinzler, K.W.; Vogelstein, B.; Shepherd, P.R.; Thompson, P.E.; Jennings, I.G. Definition of the Binding Mode of a New Class of Phosphoinositide 3-Kinase α-Selective Inhibitors Using In Vitro Mutagenesis of Non-Conserved Amino Acids and Kinetic Analysis. Biochem. J. 2012, 444, 529–535. [Google Scholar] [CrossRef] [PubMed] [Green Version]
- Frazzetto, M.; Suphioglu, C.; Zhu, J.; Schmidt-Kittler, O.; Jennings, I.G.; Cranmer, S.L.; Jackson, S.P.; Kinzler, K.W.; Vogelstein, B.; Thompson, P.E. Dissecting Isoform Selectivity of PI3K Inhibitors: The Role of Non-Conserved Residues in the Catalytic Pocket. Biochem. J. 2008, 414, 383–390. [Google Scholar] [CrossRef] [PubMed]
- Chen, P.; Deng, Y.-L.; Bergqvist, S.; Falk, M.D.; Liu, W.; Timofeevski, S.; Brooun, A. Engineering of an Isolated P110α Subunit of PI3Kα Permits Crystallization and Provides a Platform for Structure-Based Drug Design. Protein Sci. 2014, 23, 1332–1340. [Google Scholar] [CrossRef]
- Rathinaswamy, M.K.; Gaieb, Z.; Fleming, K.D.; Borsari, C.; Harris, N.J.; Moeller, B.E.; Wymann, M.P.; Amaro, R.E.; Burke, J.E. Disease-Related Mutations in PI3Kγ Disrupt Regulatory C-Terminal Dynamics and Reveal a Path to Selective Inhibitors. eLife 2021, 10, e64691. [Google Scholar] [CrossRef]
- Iselt, M.; Holtei, W.; Hilgard, P. The Tetrazolium Dye Assay for Rapid in Vitro Assessment of Cytotoxicity. Arzneimittelforschung 1989, 39, 747–749. [Google Scholar] [PubMed]
- Mruk, D.D.; Cheng, C.Y. Enhanced Chemiluminescence (ECL) for Routine Immunoblotting. Spermatogenesis 2011, 1, 121–122. [Google Scholar] [CrossRef]
- Morris, G.M.; Huey, R.; Lindstrom, W.; Sanner, M.F.; Belew, R.K.; Goodsell, D.S.; Olson, A.J. AutoDock4 and AutoDockTools4: Automated Docking with Selective Receptor Flexibility. J. Comput. Chem. 2009, 30, 2785–2791. [Google Scholar] [CrossRef] [PubMed]
- Forli, S.; Olson, A.J. A Force Field with Discrete Displaceable Waters and Desolvation Entropy for Hydrated Ligand Docking. J. Med. Chem. 2012, 55, 623–638. [Google Scholar] [CrossRef] [PubMed]
- Pettersen, E.F.; Goddard, T.D.; Huang, C.C.; Couch, G.S.; Greenblatt, D.M.; Meng, E.C.; Ferrin, T.E. UCSF Chimera. A Visualization System for Exploratory Research and Analysis. J. Comput. Chem. 2004, 25, 1605–1612. [Google Scholar] [CrossRef] [Green Version]


| Compounds | Cell Lines | ||||
|---|---|---|---|---|---|
| MCF7 | MDA-MB-231 | J774 | HaCaT | L929 | |
| 7a | 6.6 | 6.7 | Nd c | nd | nd |
| 7b | 1.1 b | 1.7 | 1.6 | 0.8 | 12 |
| 7c | 0.2 | 1 | 0.4 | 6 | 3 |
| 7d | 5.2 | 10.5 | nd | nd | nd |
| 7e | 9.5 | 24 | 12 | 12 | 12 |
| 7f | 6.5 | 8.8 | 6 | 3 | 12 |
| 7g | 4.9 | 14 | 6 | 25 | 25 |
| 7h | 13 | 14 | 6 | 3 | 12 |
| 7i | 6.1 | 11 | 6 | 6 | 6 |
| 7j | 3.8 | 4.1 | 0.8 | 3 | 3 |
| 7k | 11 | 17 | 3 | 6 | 25 |
| 7l | >50 | >50 | 6 | 3 | >50 |
| Protein | Ligand | RMSD, A | Binding Energy, kcal/mol | Kinh nM | Number of H-Bonds | Contacts with Amino Acids | |
|---|---|---|---|---|---|---|---|
| PI3Kα (4TV3) | Gedatolisib | 32.340 | −10.93 | 9.8 | 3 | Ala775, Thr856, Ile932, Ser774, Val851, Ser854, His917, Asp805, Asp915, Asp933 | |
| 6 | 35.272 | −9.38 | 133 | 3 | Thr856, Ile932, Val851, Asn853, Ser919 | ||
| 7a | 36.007 | −10.72 | 13.9 | 4 | Trp780, Lys802, Val851, Asn853, Ser854 | ||
| 7b | 33.765 | −11.65 | 2.88 | 6 | Lys802, Ile932, Trp780, Val850, Thr856, Val851, Asn853, Ser854, His855, Gln859 | ||
| 7c | 34.876 | −11.18 | 6.37 | 6 | Trp780, Ile800, Val850, Thr856, Lys802, Val851, Asn853, Ser854, Ile932, His855, Gln859 | ||
| PI3Kγ (7JWE) | Gedatolisib | 30.451 | −12.79 | 0.42 | 7 | Asp836, Lys875, Ile963, Asp964, Asp841, Val882, Phe965, Gly966, His967, Asp837 | |
| 6 | 32.494 | −9.98 | 48.1 | 6 | Lys833, Leu838, Tyr867, Ile879, Ile963, Asp964, Ser806, Asp836, Asp837, Asp841, His967 | ||
| 7a | 28.646 | −10.28 | 29.1 | 6 | Lys833, Leu838, Tyr867, Ile879, Ile963, Asp964, Ser806, Asp836, Asp837, Asp841, His967 | ||
| 7b | 30.748 | −10.26 | 30.3 | 6 | His948, His967, Leu1090, Val882, Asp964, Ser806, Lys807, Lys808 | ||
| 7c | 30.800 | −10.62 | 16.4 | 5 | His948, Ile963, His967, Leu1090, Val882, Arg947, Asp964, Trp1086 | ||
Publisher’s Note: MDPI stays neutral with regard to jurisdictional claims in published maps and institutional affiliations. |
© 2022 by the authors. Licensee MDPI, Basel, Switzerland. This article is an open access article distributed under the terms and conditions of the Creative Commons Attribution (CC BY) license (https://creativecommons.org/licenses/by/4.0/).
Share and Cite
Zapevalova, M.V.; Shchegravina, E.S.; Fonareva, I.P.; Salnikova, D.I.; Sorokin, D.V.; Scherbakov, A.M.; Maleev, A.A.; Ignatov, S.K.; Grishin, I.D.; Kuimov, A.N.; et al. Synthesis, Molecular Docking, In Vitro and In Vivo Studies of Novel Dimorpholinoquinazoline-Based Potential Inhibitors of PI3K/Akt/mTOR Pathway. Int. J. Mol. Sci. 2022, 23, 10854. https://doi.org/10.3390/ijms231810854
Zapevalova MV, Shchegravina ES, Fonareva IP, Salnikova DI, Sorokin DV, Scherbakov AM, Maleev AA, Ignatov SK, Grishin ID, Kuimov AN, et al. Synthesis, Molecular Docking, In Vitro and In Vivo Studies of Novel Dimorpholinoquinazoline-Based Potential Inhibitors of PI3K/Akt/mTOR Pathway. International Journal of Molecular Sciences. 2022; 23(18):10854. https://doi.org/10.3390/ijms231810854
Chicago/Turabian StyleZapevalova, Maria V., Ekaterina S. Shchegravina, Irina P. Fonareva, Diana I. Salnikova, Danila V. Sorokin, Alexander M. Scherbakov, Alexander A. Maleev, Stanislav K. Ignatov, Ivan D. Grishin, Alexander N. Kuimov, and et al. 2022. "Synthesis, Molecular Docking, In Vitro and In Vivo Studies of Novel Dimorpholinoquinazoline-Based Potential Inhibitors of PI3K/Akt/mTOR Pathway" International Journal of Molecular Sciences 23, no. 18: 10854. https://doi.org/10.3390/ijms231810854