
Selected Mediators of Inflammation in Patients with Acute Ischemic Stroke
 , , , , and
Abstract
:1. Introduction
2. Results
3. Discussion
4. Materials and Methods
4.1. Study Group
4.2. Biochemical Testing
4.3. Statistical Methods
5. Conclusions
Author Contributions
Funding
Institutional Review Board Statement
Informed Consent Statement
Data Availability Statement
Conflicts of Interest
References
- Wein, T.; Lindsay, M.P.; Côté, R.; Foley, N.; Berlingieri, J.; Bhogal, S.; Bourgoin, A.; Buck, B.H.; Cox, J.; Davidson, D.; et al. Canadian stroke best practice recommendations: Secondary prevention of stroke, sixth edition practice guidelines, update 2017. Int. J. Stroke. 2018, 13, 420–443. [Google Scholar] [CrossRef]
- Lackland, D.T.; Roccella, E.J.; Deutsch, A.F.; Fornage, M.; George, M.G.; Howard, G.; Kissela, B.M.; Kittner, S.J.; Lichtman, J.H.; Lisabeth, L.D.; et al. Factors influencing the decline in stroke mortality: A statement from the American heart association/American stroke association. Stroke 2014, 45, 315–353. [Google Scholar] [CrossRef]
- Benjamin, E.J.; Virani, S.S.; Callaway, C.W.; Szambelan, A.M.; Changa, A.R.; Cheng, S.; Chiuve, S.E.; Cushman, M.; Delling, F.N.; Deo, R.; et al. Heart disease and stroke statistics—2018 update: A report from the American Heart Association. Circ. Res. 2018, 137, 67–492. [Google Scholar] [CrossRef]
- Arboix, A.; Jiménez, C.; Massons, J.; Parra, O.; Besses, C. Hematological disorders: A commonly unrecognized cause of acute stroke. Expert. Rev. Hematol. 2016, 9, 891–901. [Google Scholar] [CrossRef]
- Vidale, S.; Consoli, A.; Arnaboldi, M.; Consoli, D. Postischemic inflammation in acute stroke. J. Clin. Neurol. 2017, 13, 1–9. [Google Scholar] [CrossRef]
- Ramiro, L.; Simats, A.; García-Berrocoso, T.; Montaner, J. Inflammatory molecules might become both biomarkers and therapeutic targets for stroke management. Ther. Adv. Neurol. Disord. 2018, 11, 1756286418789340. [Google Scholar] [CrossRef]
- Pawluk, H.; Woźniak, A.; Grześk, G.; Kołodziejska, R.; Kozakiewicz, M.; Kopkowska, E.; Grzechowiak, E.; Kozera, G. The role of selected pro-inflammatory cytokines in pathogenesis of ischemic stroke. Clin. Interv. Aging 2020, 15, 469–484. [Google Scholar] [CrossRef]
- Pawluk, H.; Grześk, G.; Kołodziejska, R.; Kozakiewicz, M.; Woźniak, A.; Grzechowiak, E.; Szumny, M.; Sobolewski, P.; Bieniaszewski, L.; Kozera, G. Effect of IL-6 and hsCRP serum levels on functional prognosis in stroke patients undergoing iv-thrombolysis. Clin. Interv. Aging 2020, 15, 1295–1303. [Google Scholar] [CrossRef]
- Rayasam, A.; Hsu, M.; Kijak, J.A.; Kissel, L.; Hernandez, G.; Sandor, M.; Fabry, Z. Immune responses in stroke: How the immune system contributes to damage and healing after stroke and how this knowledge could be translated to better cures? Immunology 2018, 154, 363–376. [Google Scholar] [CrossRef]
- Simats, A.; García-Berrocoso, T.; Montaner, J. Neuroinflammatory biomarkers: From stroke diagnosis and prognosis to therapy. BBA Mol. Basis Dis. 2016, 1862, 411–424. [Google Scholar] [CrossRef]
- Pand, W.; Kastin, A.J. Tumor necrosis factor and stroke: Role of the blood-brain barrier. Prog. Neurobiol. 2007, 83, 363–374. [Google Scholar]
- Licata, G.; Tuttolomondo, A.; Di Raimondo, D.; Corrao, S.; Di Sciacca, R.; Pinto, A. Immuno-inflammatory activation in acute cardio-embolic strokes in comparison with other subtypes of ischaemic stroke. Thromb. Haemost. 2009, 101, 929–937. [Google Scholar] [CrossRef]
- Hotter, B.; Hoffmann, S.; Ulm, L.; Meisel, C.; Fiebach, J.B.; Fiebach, J.B.; Meisel, A. IL-6 Plasma levels correlate with cerebral perfusion deficits and infarct sizes in stroke patients without associated infections. Front. Neurol. 2019, 10, 83. [Google Scholar] [CrossRef]
- Tuttolomondo, A.; Di Sciacca, R.; Di Raimondo, D.; Serio, A.; D’Aguanno, G.; La Placa, S.; Pecoraro, R.; Arnao, V.; Marino, L.; Monaco, S.; et al. Plasma levels of inflammatory and thrombotic/fibrinolytic markers in acute ischemic strokes. Relationship with TOAST subtype, outcome and infarct site. J. Neuroimmunol. 2009, 215, 84–89. [Google Scholar] [CrossRef]
- Bokhari, F.A.; Shakoori Butt, T.A.; Ghafoor, A.F. TNF-alpha: A risk factor for ischemic stroke. J. Ayub. Med. Coll. Abbottabad. 2014, 26, 111–114. [Google Scholar]
- Shaafi, S.; Sharifipour, E.; Rahmanifar, R.; Hejazi, S.S.; Andalib, S.; Nikanfar, M.; Baradarn, B.; Mehdizadeh, R. Interleukin-6, a reliable prognostic factor for ischemic stroke. Iran. J. Neurol. 2014, 13, 70–76. [Google Scholar]
- Cojocaru, I.M.; Cojocaru, M.; Tănăsescu, R.; Iliescu, I.; Dumitrescu, L.; Silosi, I. Expression of IL-6 activity in patients with acute ischemic stroke. Rom. J. Intern. Med. 2009, 47, 393–396. [Google Scholar]
- Worthmann, H.; Tryc, A.B.; Goldbecker, A. The temporal profile of inflammatory markers and mediators in blood after acute ischemic stroke differs depending on stroke outcome. Cerebrovasc. Dis. 2010, 30, 85–92. [Google Scholar] [CrossRef]
- Shenhar-Tsarfaty, S.; Ben, E.; Assayag, I.; Bova, L.; Shopin, M.; Fried, S.; Berliner, I.; Shapira, N.M. Bornstein Interleukin-6 as an early predictor for one-year survival following an ischaemic stroke/transient ischaemic attack. Int. J. Stroke. 2010, 5, 16–20. [Google Scholar] [CrossRef]
- Nayak, A.R.; Kashyap, S.R.; Kabra, D.; Hemant, J.; Taori, G.M.; Daginawala, H.F. Time course of inflammatory cytokines in acute ischemic stroke patients and their relation to inter-alfa trypsin inhibitor heavy chain 4 and outcome. Ann. Indian. Acad. Neurol. 2012, 15, 181–185. [Google Scholar] [CrossRef]
- Tuttolomondo, D.; Di Raimondo, D.; Di Sciacca, R.; Pinto, A.; Licata, G. Inflammatory cytokines in acute ischemic stroke. Curr. Pharm. Des. 2008, 14, 3574–3589. [Google Scholar] [CrossRef]
- Bustamante, A.; Sobrino, T.; Giralt, D.; García-Berrocoso, T.; Llombart, V.; Ugarriza, I.; Espadaler, M.; Rodríguez, N.; Sudlow, C.; Castellanos, M.; et al. Prognostic value of blood interleukin-6 in the prediction of functional outcome after stroke: A systematic review and meta-analysis. J. Neuroimmunol. 2014, 15, 215–224. [Google Scholar] [CrossRef] [PubMed]
- Martínez-Sánchez, P.; Gutiérrez-Fernández, M.; Fuentes, B.; Masjuán, J.; Cases, A.L.; Novillo-López, M.E.; Díez-Tejedor, E. Biochemical and inflammatory biomarkers in ischemic stroke: Translational study between humans and two experimental rat models. J. Transl. Med. 2014, 3, 220–229. [Google Scholar] [CrossRef]
- Choudhary, S.; Chowdhur, D.; Mishra, T.K.; Agarwal, S. Temporal profile of serum levels of IL-6 in acute ischemic stroke and its relationship with stroke severity and outcome in indian population. Int. J. Integr. Med. Sci. 2018, 5, 555–560. [Google Scholar] [CrossRef] [Green Version]
- Fassbender, K.; Schmidt, R.; Mossner, R.; Daffertshofer, M.; Hennerici, M. Pattern of activation of the hypothalamic-pituitary-adrenal axis in acute stroke. Relation to acute confusional state, extent of brain damage, and clinical outcome. Stroke 1994, 25, 1105–1108. [Google Scholar] [CrossRef] [PubMed]
- Montaner, J.; Rovira, A.; Molina, C.A.; Arenillas, J.F.; Ribó, M.; Chacón, P.; Monasterio, J.; Alvarez-Sabín, J. Plasmatic level of neuroinflammatory markers predict the extent of diffusion-weighted image lesions in hyperacute stroke. J. Cereb. Blood. Flow. Metab. 2003, 23, 1403–1407. [Google Scholar] [CrossRef] [PubMed]
- Waje-Andreassen, U.; Kråkenes, J.; Ulvestad, E.L.; Thomassen, L.; Myhr, K.-M.; Aarseth, J.; Vedeler, C.A. IL-6: An early marker for outcome in acute ischemic stroke. Acta Neurol. Scand. 2005, 111, 360–365. [Google Scholar] [CrossRef]
- Sotgiu, S.; Zanda, B.; Marchetti, B.; Fois, M.L.; Arru, G.; Pes, G.M.; Salaris, F.S.; Arru, A.; Pirisi, A.; Rosati, G. Inflammatory biomarkers in blood of patients with acute brain ischemia. Eur. J. Neurol. 2006, 13, 505–513. [Google Scholar] [CrossRef]
- Castellanos, M.; Castillo, J.; García, M.M.; Leira, R.; Serena, J.; Chamorro, A.; Dávalos, A. Inflammation-mediated damage in progressing lacunar infarctions: A potential therapeutic target. Stroke 2002, 33, 982–987. [Google Scholar] [CrossRef]
- Intiso, D.; Stampatore, P.; Zarrelli, M.M.; Guerra, G.L.; Arpaia, G.; Simone, P.; Tonali, P.; Beghi, E. Incidence of first-ever ischemic and hemorrhagic stroke in a well-defined community of southern Italy, 1993 to 1995. Eur. J. Neurol. 2003, 10, 559–565. [Google Scholar] [CrossRef]
- Rodríguez-Yáñez, M.; Castillo, J. Role of inflammatory markers in brain ischemia. Curr. Opin. Neurol. 2008, 21, 353–357. [Google Scholar] [CrossRef] [PubMed]
- Huţanu, A.; Iancu, M.; Bălaşa, R.; Maier, S.; Dobreanu, M. Predicting functional outcome of ischemic stroke patients in Romania based on plasma CRP, sTNFR-1, D-Dimers, NGAL and NSE measured using a biochip array. Acta Pharmacol. Sin. 2018, 39, 1228–1236. [Google Scholar] [CrossRef] [PubMed]
- Clausen, B.H.; Wirenfeldt, M.; Høgedal, S.S.; Frich, L.H.; Nielsen, H.H.; Schrøder, H.D.; Østergaard, K.; Finsen, B.; Kristensen, B.W.; Lambertsen, K.L. Characterization of the TNF and IL-1 systems in human brain and blood after ischemic stroke. Acta Neuropathol. Commun. 2020, 8, 1–17. [Google Scholar] [CrossRef]
- Li, X.; Lin, S.; Chen, X.; Huang, W.; Li, Q.; Zhang, H.; Chen, X.; Yang, S.; Jin, K.; Shao, B. The prognostic value of serum cytokines in patients with acute ischemic stroke. Aging Dis. 2019, 10, 544–556. [Google Scholar] [CrossRef] [Green Version]
- Fahmi, R.M.; Elsaid, A.F. Infarction size, interleukin-6, and their interaction are predictors of short-term stroke outcome in young egyptian adults. J. Stroke Cerebrovasc. Dis. 2016, 25, 2475–2481. [Google Scholar] [CrossRef]
- Puz, P.; Lasek-Bal, A.; Kazibutowska, Z. Evaluation of the serum concentration of selected inflammatory cytokines in patients with carotid artery stenosis. Chir. Pol. 2014, 16, 57–65. [Google Scholar]
- Ormstad, H.; Aass, H.C.D.; Lund- Sørensen, N.; Amthor, K.F.; Sandvik, L. Serum levels of cytokines and C-reactive protein in acute ischemic stroke patients, and their relationship to stroke lateralization, type, and infarct volume. J. Neurol. 2012, 258, 677–685. [Google Scholar] [CrossRef]
- Welsh, P.; Lowe, G.D.; Chalmers, J.; Campbell, D.; Rumley, A.; Neal, B.C.; Mac Mahon, S.W.; Woodward, M. Associations of proinflammatory cytokines with the risk of recurrent stroke. Stroke 2008, 39, 2226–2230. [Google Scholar] [CrossRef]
- Emsley, H.C.; Smith, C.J.; Gavin, C.M.; Georgiou, R.; Vail, A.; Barberan, E.; Hallenbeck, J.; Zoppo, G.; Rothwell, N.; Tyrrell, P.; et al. An early and sustained peripheral inflammatory response in acute ischaemic stroke: Relationships with infection and atherosclerosis. J. Neuroimmunol. 2003, 139, 93–101. [Google Scholar] [CrossRef]
- Matsumoto, J.; Dohgu, S.; Takata, F.; Machida, T.; Bölükbaşi Hatip, F.F.; Hatip-Al-Khati, I.; Yamauchi, A.; Kataoka, Y. TNF-α-sensitive brain pericytes activate microglia by releasing IL-6 through cooperation between IjB-NFjB and JAK-STAT3 pathways. Brain Res. 2018, 1692, 34–44. [Google Scholar] [CrossRef]
- Licata, A.; Tuttolomondo, S.; Corrao, D.; Di Raimondo, D.; Fernandez, P.; Caruso, C.; Avellone, G.; Pinto, A. Immunoinflammatory activation during the acute phase of lacunar and non-lacunar ischemic stroke: Association with time of on-set and diabetic state. Int. J. Immunopathol. Pharmacol. 2006, 19, 639–646. [Google Scholar] [CrossRef]
- Tuttolomondo, A.; Di Raimondo, D.; Pecoraro, R.; Arnao, V.; Pinto, A.; Licata, G. Inflammation in ischemic stroke subtypes. Curr. Pharm. Des. 2012, 18, 4289–4310. [Google Scholar] [CrossRef]
- Chen, G.; Wang, X.; Robinson, T.G.; Pikkemaat, M.; Lindley, R.I.; Zhou, S.; Ping, L.; Liu, W.; Liu, L.; Chalmers, J.; et al. Comparative effects of low-dose versus standard-dose alteplase in ischemic patients with prior stroke and/or diabetes mellitus: The ENCHANTED trial. J. Neurol. Sci. 2018, 387, 1–5. [Google Scholar] [CrossRef]
- Rudilosso, S.; Rodríguez-Vázquez, A.; Urra, X.; Arboix, A. The potential impact of neuroimaging and translational research on the clinical management of lacunar stroke. J. Mol. Sci. 2022, 23, 1497. [Google Scholar] [CrossRef] [PubMed]
- Lasek-Bal, A.; Jedrzejowska-Szypulka, H.; Student, S.; Warsz-Wianecka, A.; Zareba, K.; Puz, P.; Bal, W.; Pawletko, K.; Lewin-Kowalik, J. The importance of selected markers of inflammation and blood-brain barrier damage for short-term ischemic stroke prognosis. J. Physiol. Pharmacol. 2019, 70, 209–217. [Google Scholar] [CrossRef]
- Xue, Y.; Zeng, X.; Tu, W.-J.; Zhao, J. Tumor necrosis factor-α: The next marker of stroke. Dis. Markers 2022, 2022, 2395269. [Google Scholar] [CrossRef] [PubMed]
- Gough, P.; Myles, I.A. Tumor necrosis factor receptors: Pleiotropic signaling complexes and their differential effects. Front. Immunol. 2020, 11, 585880. [Google Scholar] [CrossRef]
- Lin, S.-Y.; Wang, Y.Y.; Chang, C.Y.; Wu, C.-C.; Chen, W.-Y.; Liao, S.-L.; Chen, C.-J. TNF-α receptor inhibitor allevies metabolic and inflammatory changes in a rat model of ischemic stroke. Antioxidants 2021, 10, 851. [Google Scholar] [CrossRef]
- Narazaki, M.; Kishimoto, T. The two-faced cytokine IL-6 in host defense and diseases. Int. J. Mol. Sci. 2018, 19, 3528. [Google Scholar] [CrossRef] [Green Version]


| Clinical Parameters | Favourable (N = 98) | Unfavourable (N = 26) | p-Value | |
|---|---|---|---|---|
| (mRS 0–2 pts) | (mRS 3–6 pts) | |||
| Age | (mean; min–max) [years] | 59 (51; 69) | 68 (60; 77) | 0.003 |
| Gender (male) | n (%) | 55 (56.1%) | 18 (69.2%) | 0.268 |
| Current smoking | n (%) | 29 (29.6%) | 10 (38.5%) | 0.477 |
| BMI | (median; IQRg) [kg/m2] | 27.6 (23.5; 30.9) | 26.3 (23.7; 30.5) | 0.623 |
| SBP on admission | (median; IQR) [mmHg] | 160 (145; 170) | 148 (131; 155) | 0.004 |
| DBP on admission | (median; IQR) [mmHg] | 89.0 (79.3; 97.8) | 80.0 (75.0; 90.0) | 0.075 |
| Heart rate on admission | (median; IQR) [beats/min] | 78.0 (70.0; 84.0) | 74.5 (69.0; 80.0) | 0.625 |
| Hyperlipidemia | n (%) | 11 (11.2%) | 2 (7.7%) | 1 |
| Hyperuricemia | n (%) | 5 (5.1%) | 1 (3.8%) | 1 |
| Impaired renal function | n (%) | 3 (3.1%) | 0 (0%) | 1 |
| Diabetes Mellitus | n (%) | 43 (43.9%) | 9 (34.6%) | 0.504 |
| Arterial hypertension | n (%) | 85 (86.7%) | 18 (69.2%) | 0.0434 |
| Coronary heart disease | n (%) | 26 (26.5%) | 1 (3.8%) | 0.014 |
| Carotid stenosis > 50% | n (%) | 6 (9.7) | 4 (21.0) | 0.19 |
| Atrial fibrillation | n (%) | 15 (15.3%) | 0 (0%) | 0.039 |
| Statin therapy before stroke | n (%) | 30 (30.6%) | 6 (23.1%) | 0.626 |
| Statin therapy after stroke | n (%) | 90 (91.8%) | 26 (100%) | 0.584 |
| Antiplatelet therapy before stroke | n (%) | 40 (40.8%) | 2 (7.7%) | 0.002 |
| Anticoagulant therapy before stroke | n (%) | 3 (3.1%) | 0 (0%) | 1 |
| MRI | n (%) | 63 (64.3%) | 16 (61.5%) | 1 |
| Hormones | n (%) | 2 (2.0%) | 0 (0%) | 1 |
| HLD | n (%) | 39 (39.8%) | 9 (34.6%) | 0.659 |
| rt-PA dose | (median; IQR) [mg/kg] | 70.0 (60.0; 80.0) | 72.0 (60.1; 79.3) | 0.609 |
| Infection | n (%) | 21 (21.4%) | 0 (0%) | 0.007 |
| Onset_to_needletime | (median; IQR) [min] | 193 (150; 229) | 195 (128; 225) | 0.694 |
| NIHSS on admission | (median; IQR) [points] | 5.00 (4.00; 10.0) | 3.00 (2.00; 3.75) | <0.001 |
| NIHSS on discharge | (median; IQR) [points] | 2.00 (1,00; 5.00) | 0 (0; 1.00) | <0.001 |
| mRS on admission | (median; IQR) [pts] | 1.00 (1.00; 3.00) | 0 (0; 0) | <0.001 |
| mRS after three months | (median; IQR) [pts] | 1.00 (0; 3.00) | 0 (0; 0) | <0.001 |
| mRS after a year | (median; IQR) [pts] | 1.00 (0; 2.25) | 0 (0; 0.250) | 0.002 |
| Biomarkers | Favourable | Unfavourable | p-Value | |
|---|---|---|---|---|
| (mRS 0–2 pts) | (mRS 3–6 pts) | |||
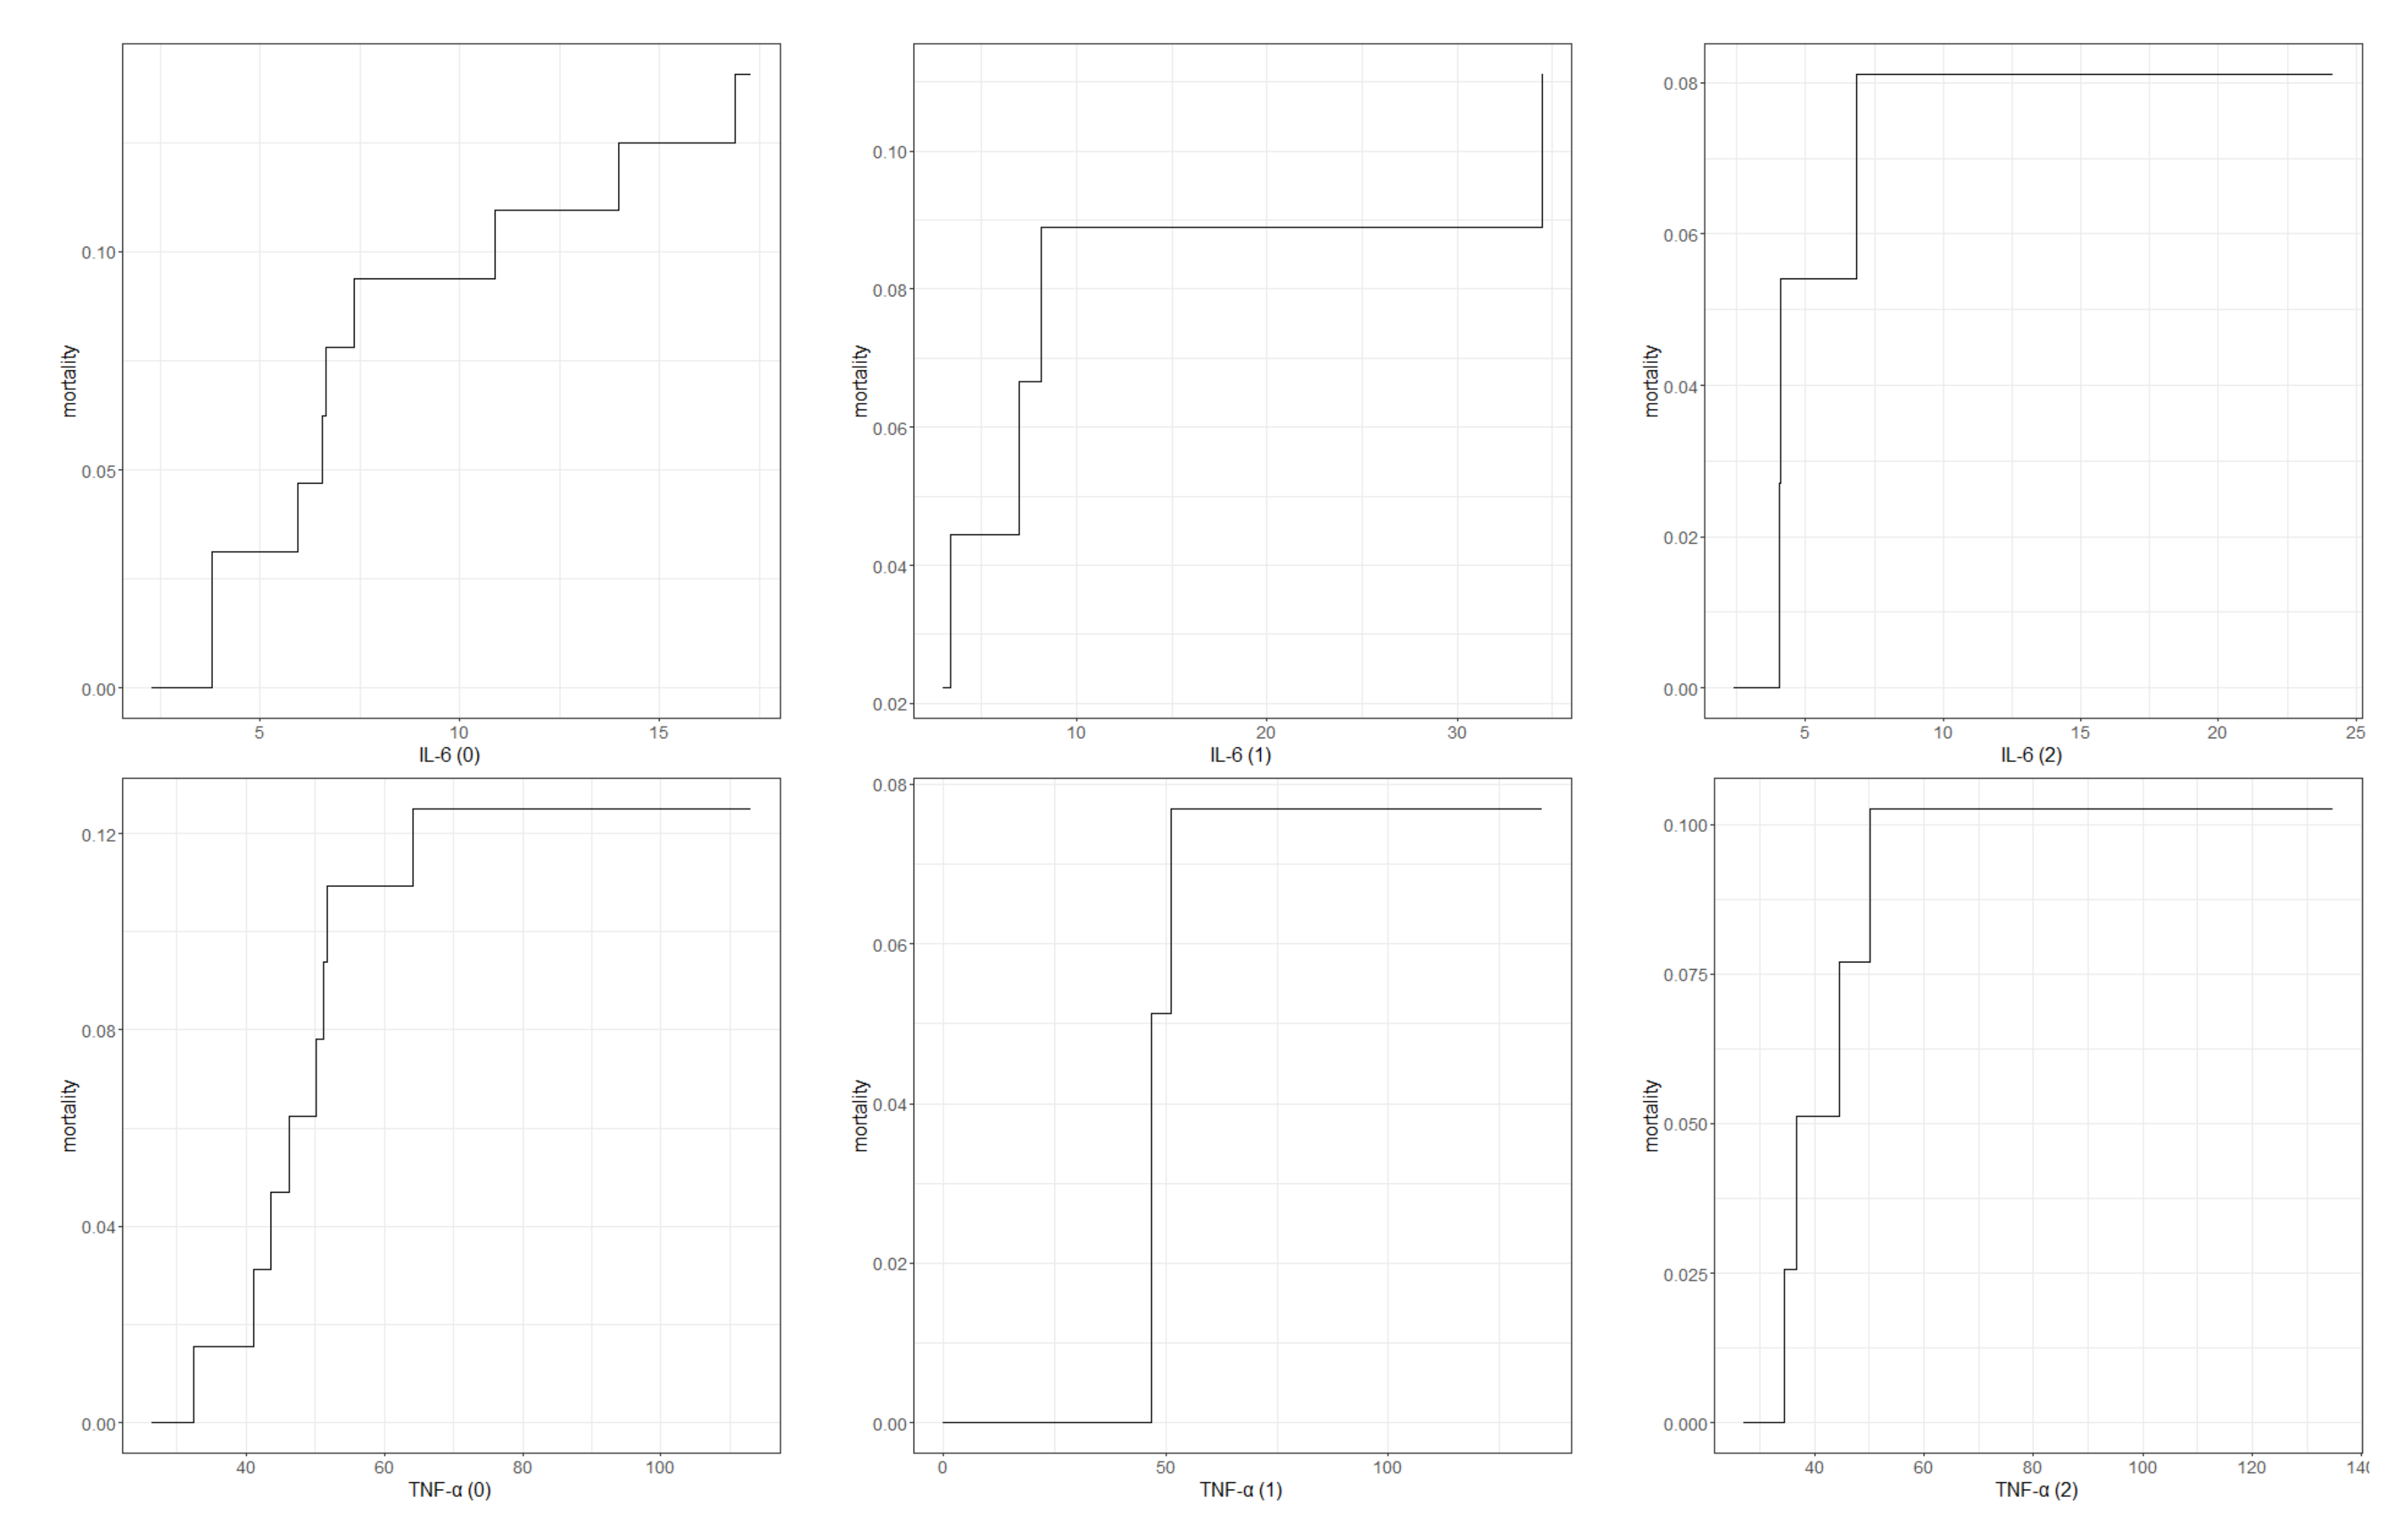
| IL-6 (0) (median; IQR) [pg/mL] | on admission | 4.69 (3.67; 6.64) | 6.48 (5.81, 8.70) | 0.012 |
| IL-6 (1) (median; IQR) [pg/mL] | 6.55 (6.48; 6.79) | 7.68 (6.51; 11.6) | 0.024 | |
| IL-6 (2) (median; IQR) [pg/mL] | 4.71 (3.72; 5.49) | 6.87 (4.74; 7.69) | 0.022 | |
| TNF-α (0) (median; IQR) [pg/mL] | 32.9 (30.8; 39.0) | 46.3 (33.3; 51.1) | 0.059 | |
| TNF-α (1) (median; IQR) [pg/mL] | 35.6 (32.7; 46.2) | 46.6 (36.6; 54.0) | 0.302 | |
| TNF-α (2) (median; IQR) [pg/mL] | 31.4 (30.7; 34.6) | 34.0 (31.9; 50.2) | 0.199 | |
| IL-6 (0) (median; IQR) [pg/mL] | on discharge | 5.92 (3.84; 6.52) | 10.0 (7.38; 11.6) | <0.001 |
| IL-6 (1) (median; IQR) [pg/mL] | 6.79 (6.36; 7.64) | 12.1 (9.71; 14.1) | <0.001 | |
| IL-6 (2) (median; IQR) [pg/mL] | 6.49 (4.59; 7.39) | 7.63 (4.74; 8.96) | 0.188 | |
| TNF-α (0) (median; IQR) [pg/mL] | 36.4 (31.0; 49.0) | 50.2 (45.0; 52.5) | 0.010 | |
| TNF-α (1) (median; IQR) [pg/mL] | 44.6 (33.7; 50.6) | 55.7 (42.4; 60.8) | 0.266 | |
| TNF-α (2) (median; IQR) [pg/mL] | 33.9 (31.5; 50.2) | 33.9 (31.4; 43.2) | 0.680 | |
| IL-6 (0) (median; IQR) [pg/mL] | after three months | 5.82 (3.79; 6.51) | 10.8 (7.23; 13.5) | <0.001 |
| IL-6 (1) (median; IQR) [pg/mL] | 6.79 (6.37; 7.79) | 12.6 (9.30; 15.0) | 0.037 | |
| IL-6 (2) (median; IQR) [pg/mL] | 6.49 (4.44; 7.46) | 7.16 (4.42; 8.55) | 0.532 | |
| TNF-α (0) (median; IQR) [pg/mL] | 33.9 (31.0; 46.5) | 51.8 (48.6; 59.6) | <0.001 | |
| TNF-α (1) (median; IQR) [pg/mL] | 46.1 (34.3; 50.3) | 53.8 (45.7; 64.6) | 0.146 | |
| TNF-α (2) (median; IQR) [pg/mL] | 33.9 (31.9; 50.2) | 34.1 (32.2; 36.7) | 0.645 | |
| IL-6 (0) (median; IQR) [pg/mL] | 5.92 (3.87; 6.57) | 12.4 (11.1; 14.6) | <0.001 | |
| IL-6 (1) (median; IQR) [pg/mL] | after a year | 6.88 (6.37; 8.36) | 12.1 (8.61; 15.0) | 0.078 |
| IL-6 (2) (median; IQR) [pg/mL] | 6.52 (4.51; 7.55) | 6.44 (4.58; 8.56) | 0.702 | |
| TNF-α (0) (median; IQR) [pg/mL] | 33.9 (30.9; 46.5) | 52.5 (49.1; 56.0) | 0.006 | |
| TNF-α (1) (median; IQR) [pg/mL] | 43.3 (34.1; 50.0) | 68.4 (64.6; 72.3) | 0.017 | |
| TNF-α (2) (median; IQR) [pg/mL] | 33.5 (31.6; 49.9) | 40.9 (31.3; 50.1) | 0.975 | |
| Biomarker | Patients Group (N = 125) | Control Group (N = 28) | p-Value | |
|---|---|---|---|---|
| IL-6 (0) | (median; IQR) [pg/mL] | 6.37 (4.35; 7.43) | 3.59 (3.42; 4.04) | <0.001 |
| IL-6 (1) | (median; IQR) [pg/mL] | 7.09 (6.48; 9.30) | 3.59 (3.42; 4.04) | <0.001 |
| IL-6 (2) | (median; IQR) [pg/mL] | 6.54 (4.44; 7.58) | 3.59 (3.42; 4.04) | <0.001 |
| TNF-α (0) | (median; IQR) [pg/mL] | 42.4 (32.2; 50.9) | 29.8 (27.8; 31.8) | <0.001 |
| TNF-α (1) | (median; IQR) [pg/mL] | 46.2 (34.0; 52.3) | 29.8 (27.8; 31.8) | <0.001 |
| TNF-α (2) | (median; IQR) [pg/mL] | 33.9 (31.5; 50.0) | 29.8 (27.8; 31.8) | <0.001 |
| Scale | IL-6 (0) [pg/mL] | IL-6 (1) [pg/mL] | IL-6 (2) [pg/mL] | TNF-α (0) [ng/mL] | TNF-α (1) [ng/mL] | TNF-α (2) [ng/mL] |
|---|---|---|---|---|---|---|
| Onset to needletime | R = −0.11; p = 0.81 | R = −0.16; p = 0.96 | R = −0.16; p = 0.06 | R = 0.06; p = 0.45 | R = 0.04; p = 0.40 | R = 0.16; p = 0.31 |
| NIHSS score on admission [pts] | R = 0.43; p < 0.01 | R = 0.40; p < 0.01 | R = 0.07; p = 0.8 | R = 0.40; p = 0.02 | R = 0.16; p = 0.48 | R = −0.05; p = 0.57 |
| NIHSS score on discharge [pts] | R = 0.61; p < 0.01 | R = 0.52; p < 0.01 | R = 0.29; p = 0.52 | R = 0.32; p = 0.09 | R = 0.15; p = 0.33 | R = 0.03; p = 0.56 |
| mRS on admission [pts] | R = 0.52; p < 0.01 | R = 0.44; p < 0.01 | R = 0.31; p = 0.06 | R = 0.33; p = 0.01 | R = 0.16; p = 0.34 | R = 0.13; p = 0.41 |
| mRS on discharge [pts] | R = 0.61; p < 0.01 | R = 0.47; p < 0.01 | R = 0.28; p = 0.04 | R = 0.32; p = 0.05 | R = 0.10; p = 0.67 | R = 0.03; p = 0.46 |
| mRS after 3 months from stroke onset [pts] | R = 0.68; p < 0.01 | R = 0.30; p = 0.01 | R = 0.15; p = 0.65 | R = 0.47; p = 0.01 | R = 0.28; p = 0.35 | R = 0.09; p = 0.44 |
| mRS after a year from stroke onset [pts] | R = 0.73; p < 0.01 | R = 0.50; p < 0.01 | R = 0.16; p = 0.79 | R = 0.39; p = 0.05 | R = 0.26; p = 0.27 | R = 0.03; p = 0.63 |
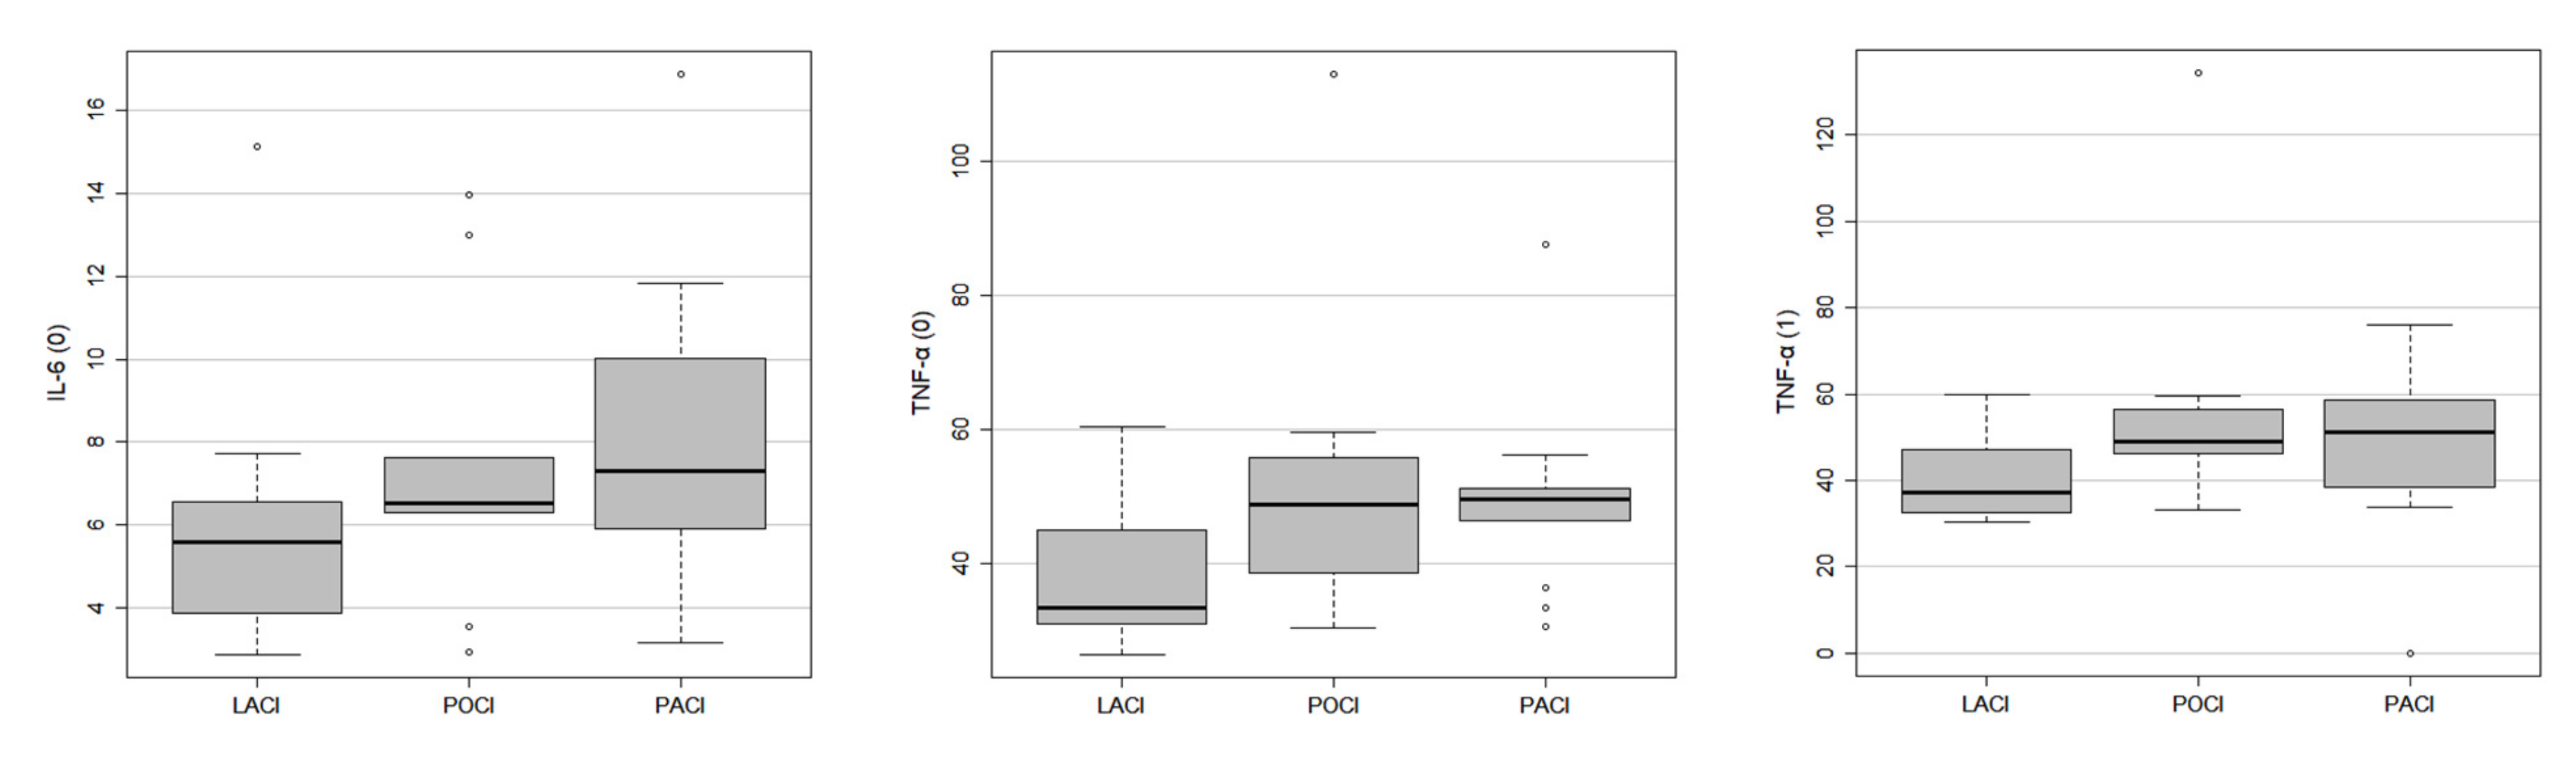
| Biomarker | LACI | POCI | PACI | |
|---|---|---|---|---|
| IL-6 (0) | (median; IQR) [pg/mL] | 5.59 (3.86; 6.53) | 7.29 (5.91; 10.02) | |
| TNF-α (0) | (median; IQR) [pg/mL] | 33.43 (30.94; 44.25) | 48.82 (41.72; 54.18) | 49.60 (46.28; 51.21) |
| TNF-α (1) | (median; IQR) [pg/mL] | 37.24 (32.61; 47.26) | 48.86 (46.15; 54.89) | |
Publisher’s Note: MDPI stays neutral with regard to jurisdictional claims in published maps and institutional affiliations. |
© 2022 by the authors. Licensee MDPI, Basel, Switzerland. This article is an open access article distributed under the terms and conditions of the Creative Commons Attribution (CC BY) license (https://creativecommons.org/licenses/by/4.0/).
Share and Cite
Pawluk, H.; Kołodziejska, R.; Grześk, G.; Kozakiewicz, M.; Woźniak, A.; Pawluk, M.; Kosinska, A.; Grześk, M.; Wojtasik, J.; Kozera, G. Selected Mediators of Inflammation in Patients with Acute Ischemic Stroke. Int. J. Mol. Sci. 2022, 23, 10614. https://doi.org/10.3390/ijms231810614
Pawluk H, Kołodziejska R, Grześk G, Kozakiewicz M, Woźniak A, Pawluk M, Kosinska A, Grześk M, Wojtasik J, Kozera G. Selected Mediators of Inflammation in Patients with Acute Ischemic Stroke. International Journal of Molecular Sciences. 2022; 23(18):10614. https://doi.org/10.3390/ijms231810614
Chicago/Turabian StylePawluk, Hanna, Renata Kołodziejska, Grzegorz Grześk, Mariusz Kozakiewicz, Alina Woźniak, Mateusz Pawluk, Agnieszka Kosinska, Magdalena Grześk, Jakub Wojtasik, and Grzegorz Kozera. 2022. "Selected Mediators of Inflammation in Patients with Acute Ischemic Stroke" International Journal of Molecular Sciences 23, no. 18: 10614. https://doi.org/10.3390/ijms231810614