Figure 1.
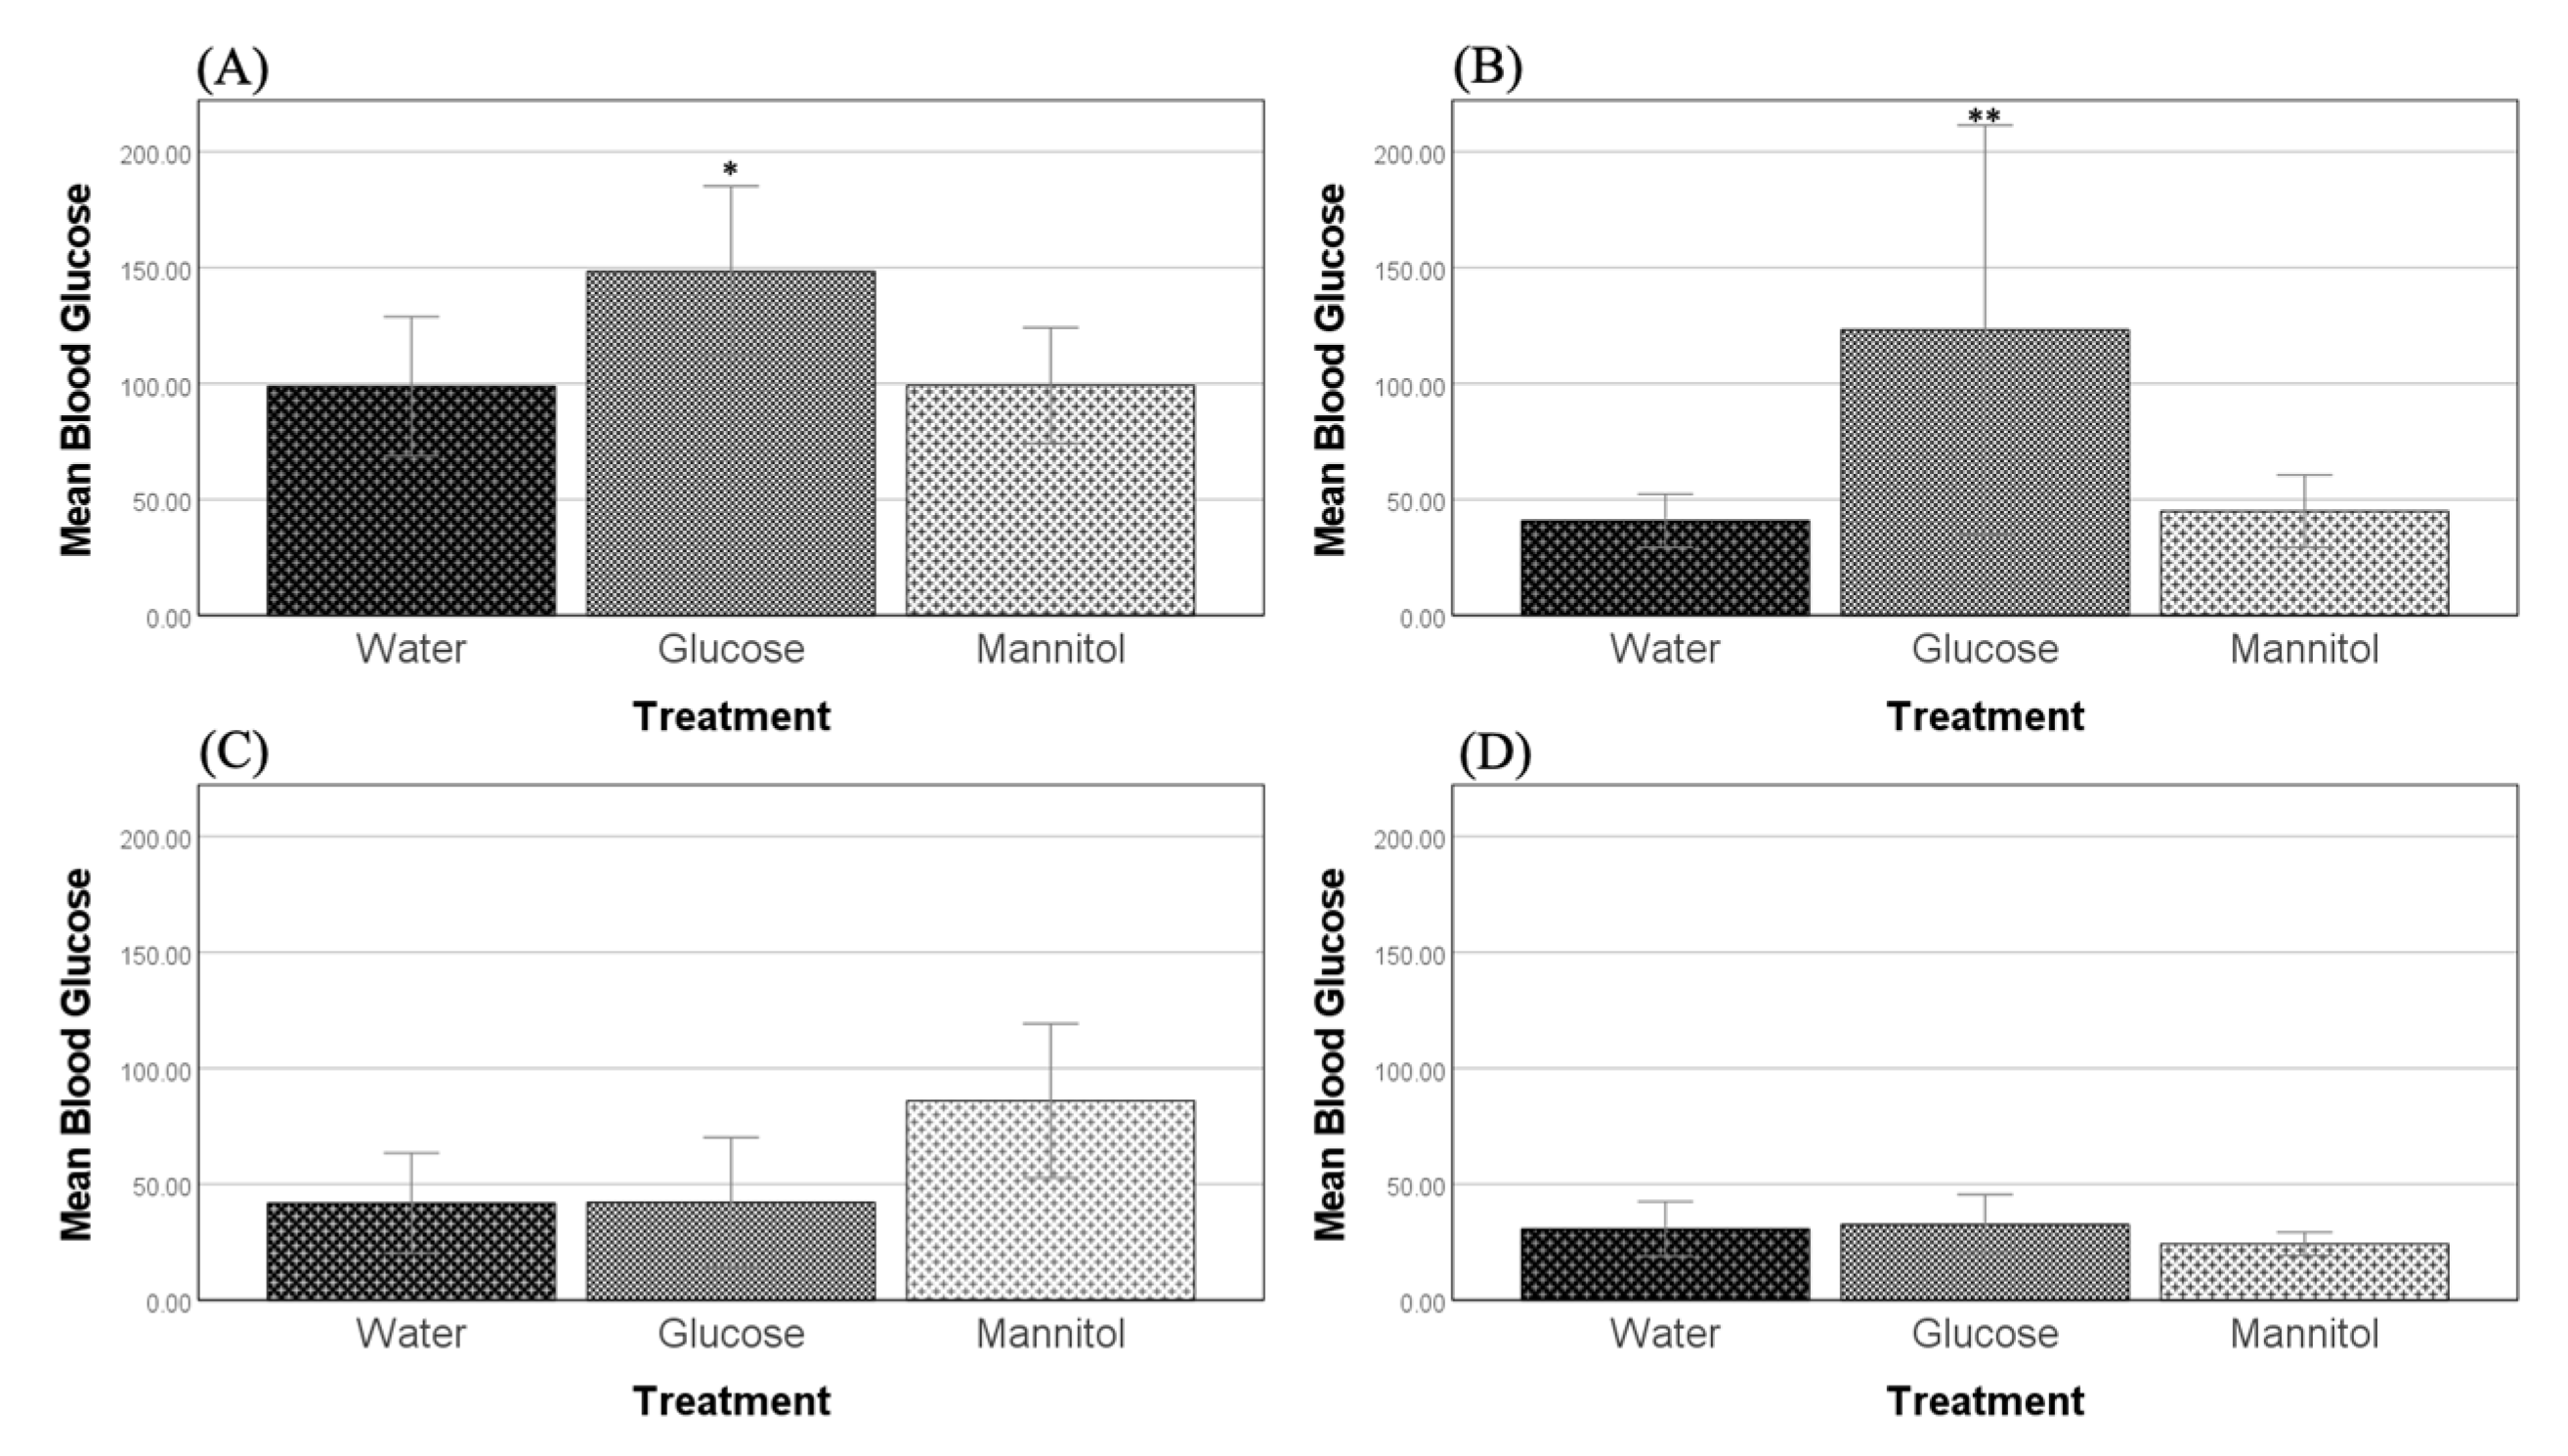
Blood glucose levels. Blood glucose levels were measured after (A) 8 weeks and (B) 12 weeks of hyperglycemia. At both timepoints, glucose-treated fish had significantly higher blood sugar levels than either water- or mannitol-treated controls (one-way ANOVA, 8 weeks, p = 0.037, p = 0.048, * respectively; 12 weeks, p = 0.010, p = 0.011, ** respectively). Values are means +/−95% CI. n = 23 (8 weeks); n = 32 (12 weeks). Four weeks of recovery after either four weeks of hyperglycemia (C) or eight weeks of hyperglycemia (D) showed that glucose-treated fish were no longer significantly different from either of the controls. Values are means +/−95% CI. n = 18 (8-week washout); n = 30 (12-week washout).
Figure 1.
Blood glucose levels. Blood glucose levels were measured after (A) 8 weeks and (B) 12 weeks of hyperglycemia. At both timepoints, glucose-treated fish had significantly higher blood sugar levels than either water- or mannitol-treated controls (one-way ANOVA, 8 weeks, p = 0.037, p = 0.048, * respectively; 12 weeks, p = 0.010, p = 0.011, ** respectively). Values are means +/−95% CI. n = 23 (8 weeks); n = 32 (12 weeks). Four weeks of recovery after either four weeks of hyperglycemia (C) or eight weeks of hyperglycemia (D) showed that glucose-treated fish were no longer significantly different from either of the controls. Values are means +/−95% CI. n = 18 (8-week washout); n = 30 (12-week washout).
Figure 2.
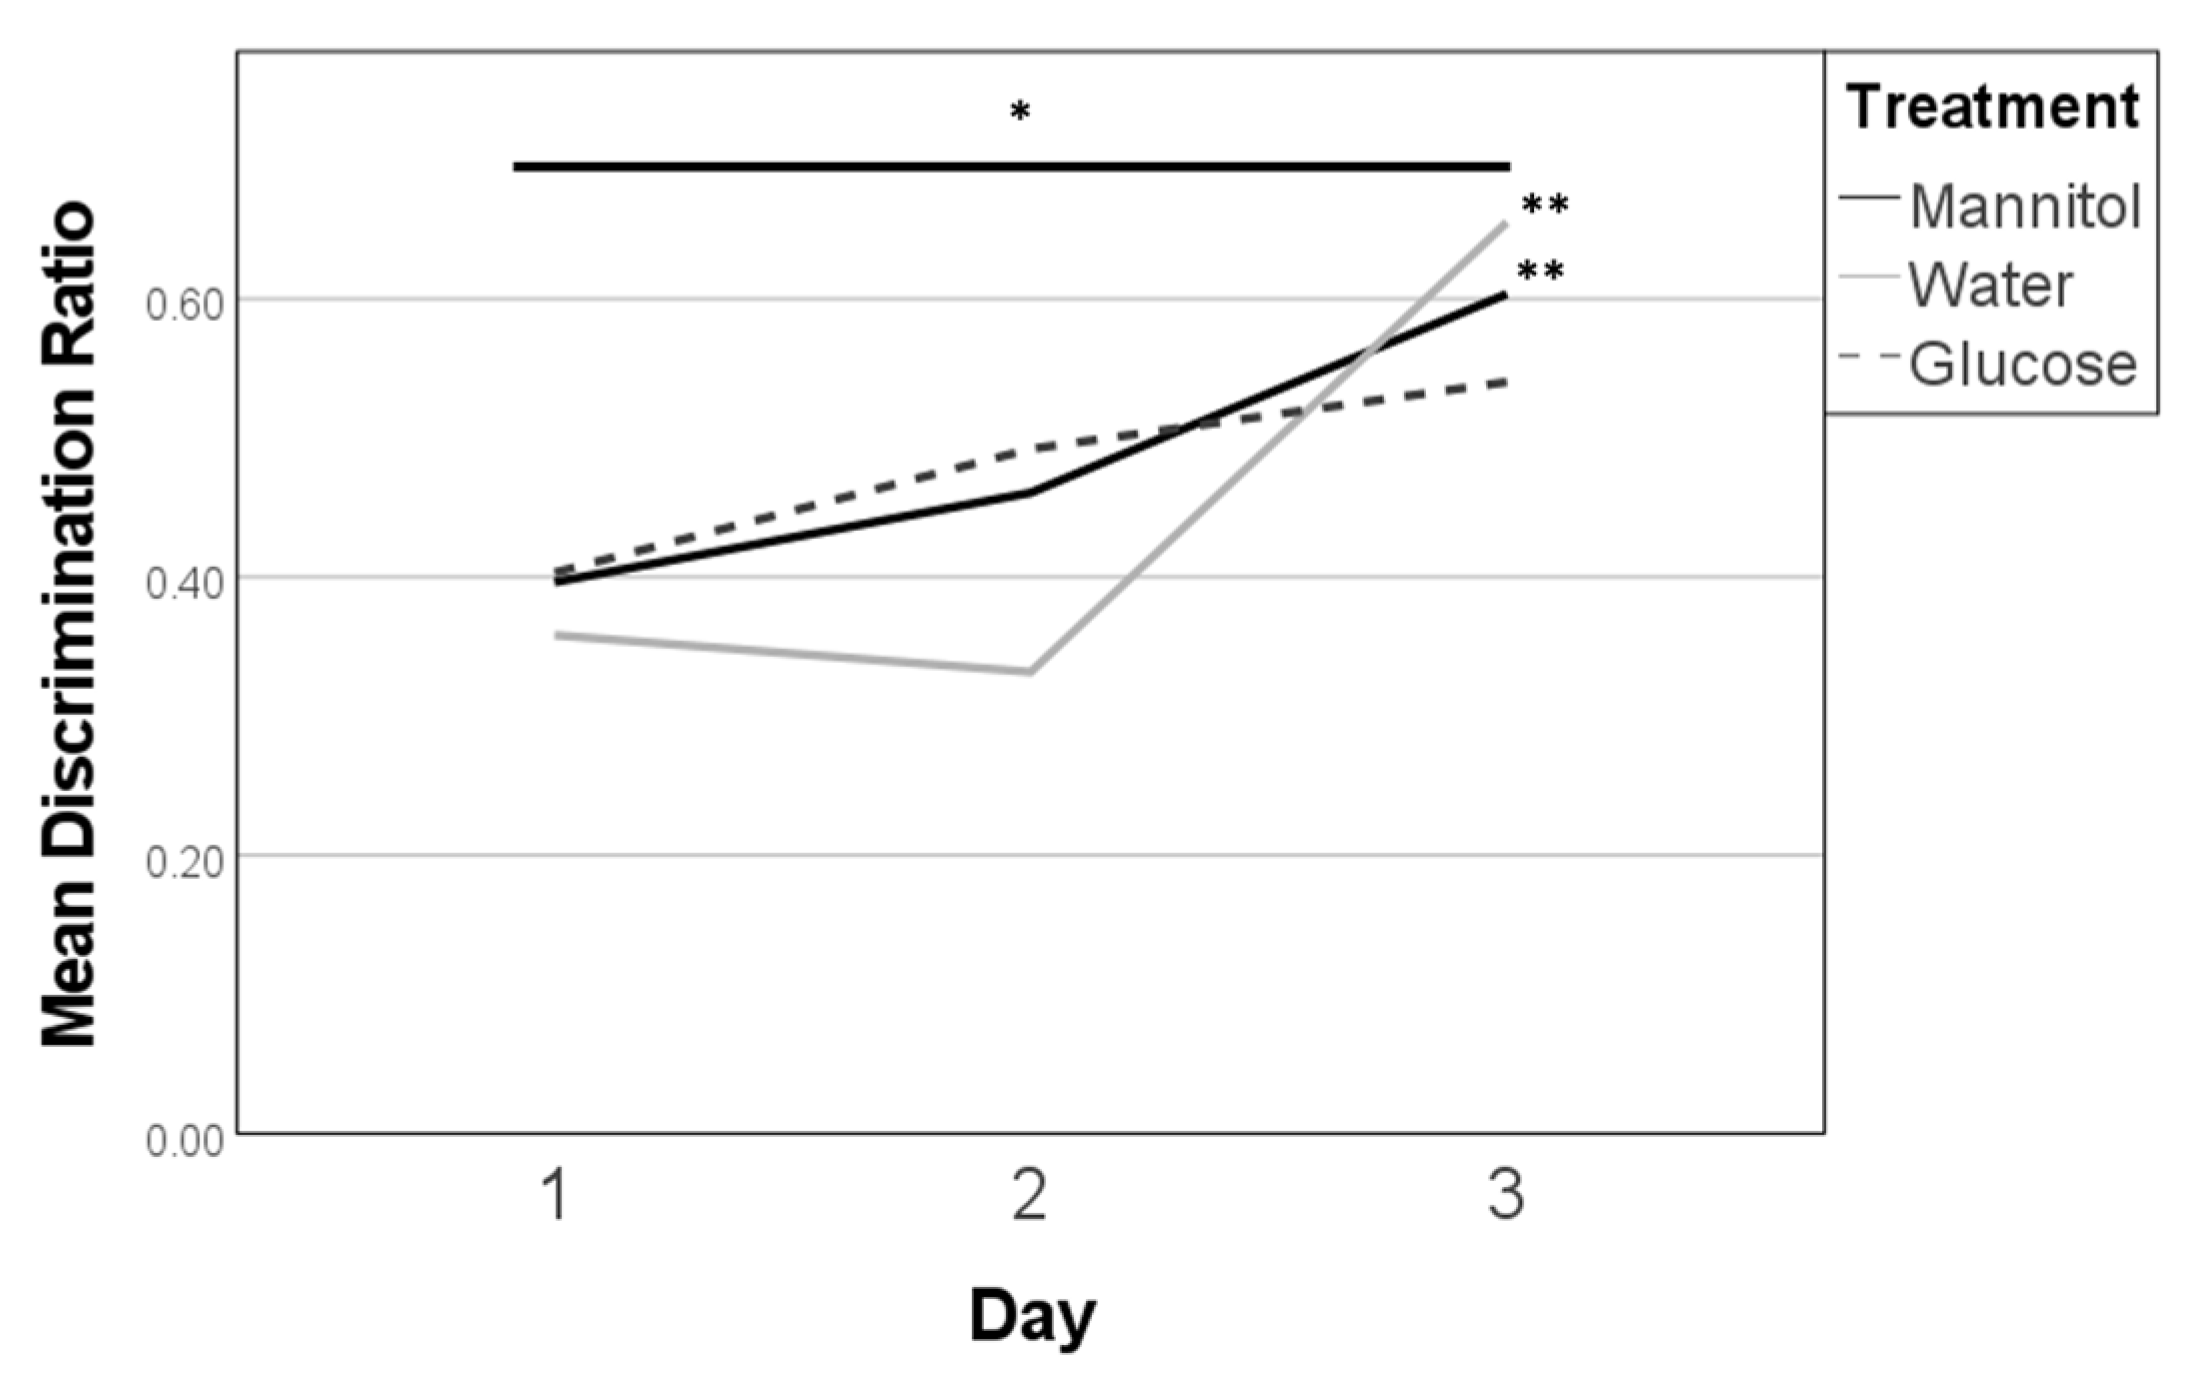
Discrimination ratios after 8 weeks of prolonged hyperglycemia. Discrimination ratios were calculated on all three 8-week reversal days (day 1, day 2, day 3) for responses of fish in each treatment group and analyzed on each day using one-way ANOVA. A significant difference due to reversal day (single asterisk) was noted (F (2,278) = 13.462, p < 0.001). Subsequent trendline analysis identified significant trends in responses for mannitol and water-treated fish (double asterisk) characterized by increased scores from day 1 to day 3 (p = 0.007, and p < 0.001, respectively). Significant trend lines suggest that the fish learned the new location of the shoal reward. A significant trend line was not found for glucose-treated fish (dashed line).
Figure 2.
Discrimination ratios after 8 weeks of prolonged hyperglycemia. Discrimination ratios were calculated on all three 8-week reversal days (day 1, day 2, day 3) for responses of fish in each treatment group and analyzed on each day using one-way ANOVA. A significant difference due to reversal day (single asterisk) was noted (F (2,278) = 13.462, p < 0.001). Subsequent trendline analysis identified significant trends in responses for mannitol and water-treated fish (double asterisk) characterized by increased scores from day 1 to day 3 (p = 0.007, and p < 0.001, respectively). Significant trend lines suggest that the fish learned the new location of the shoal reward. A significant trend line was not found for glucose-treated fish (dashed line).
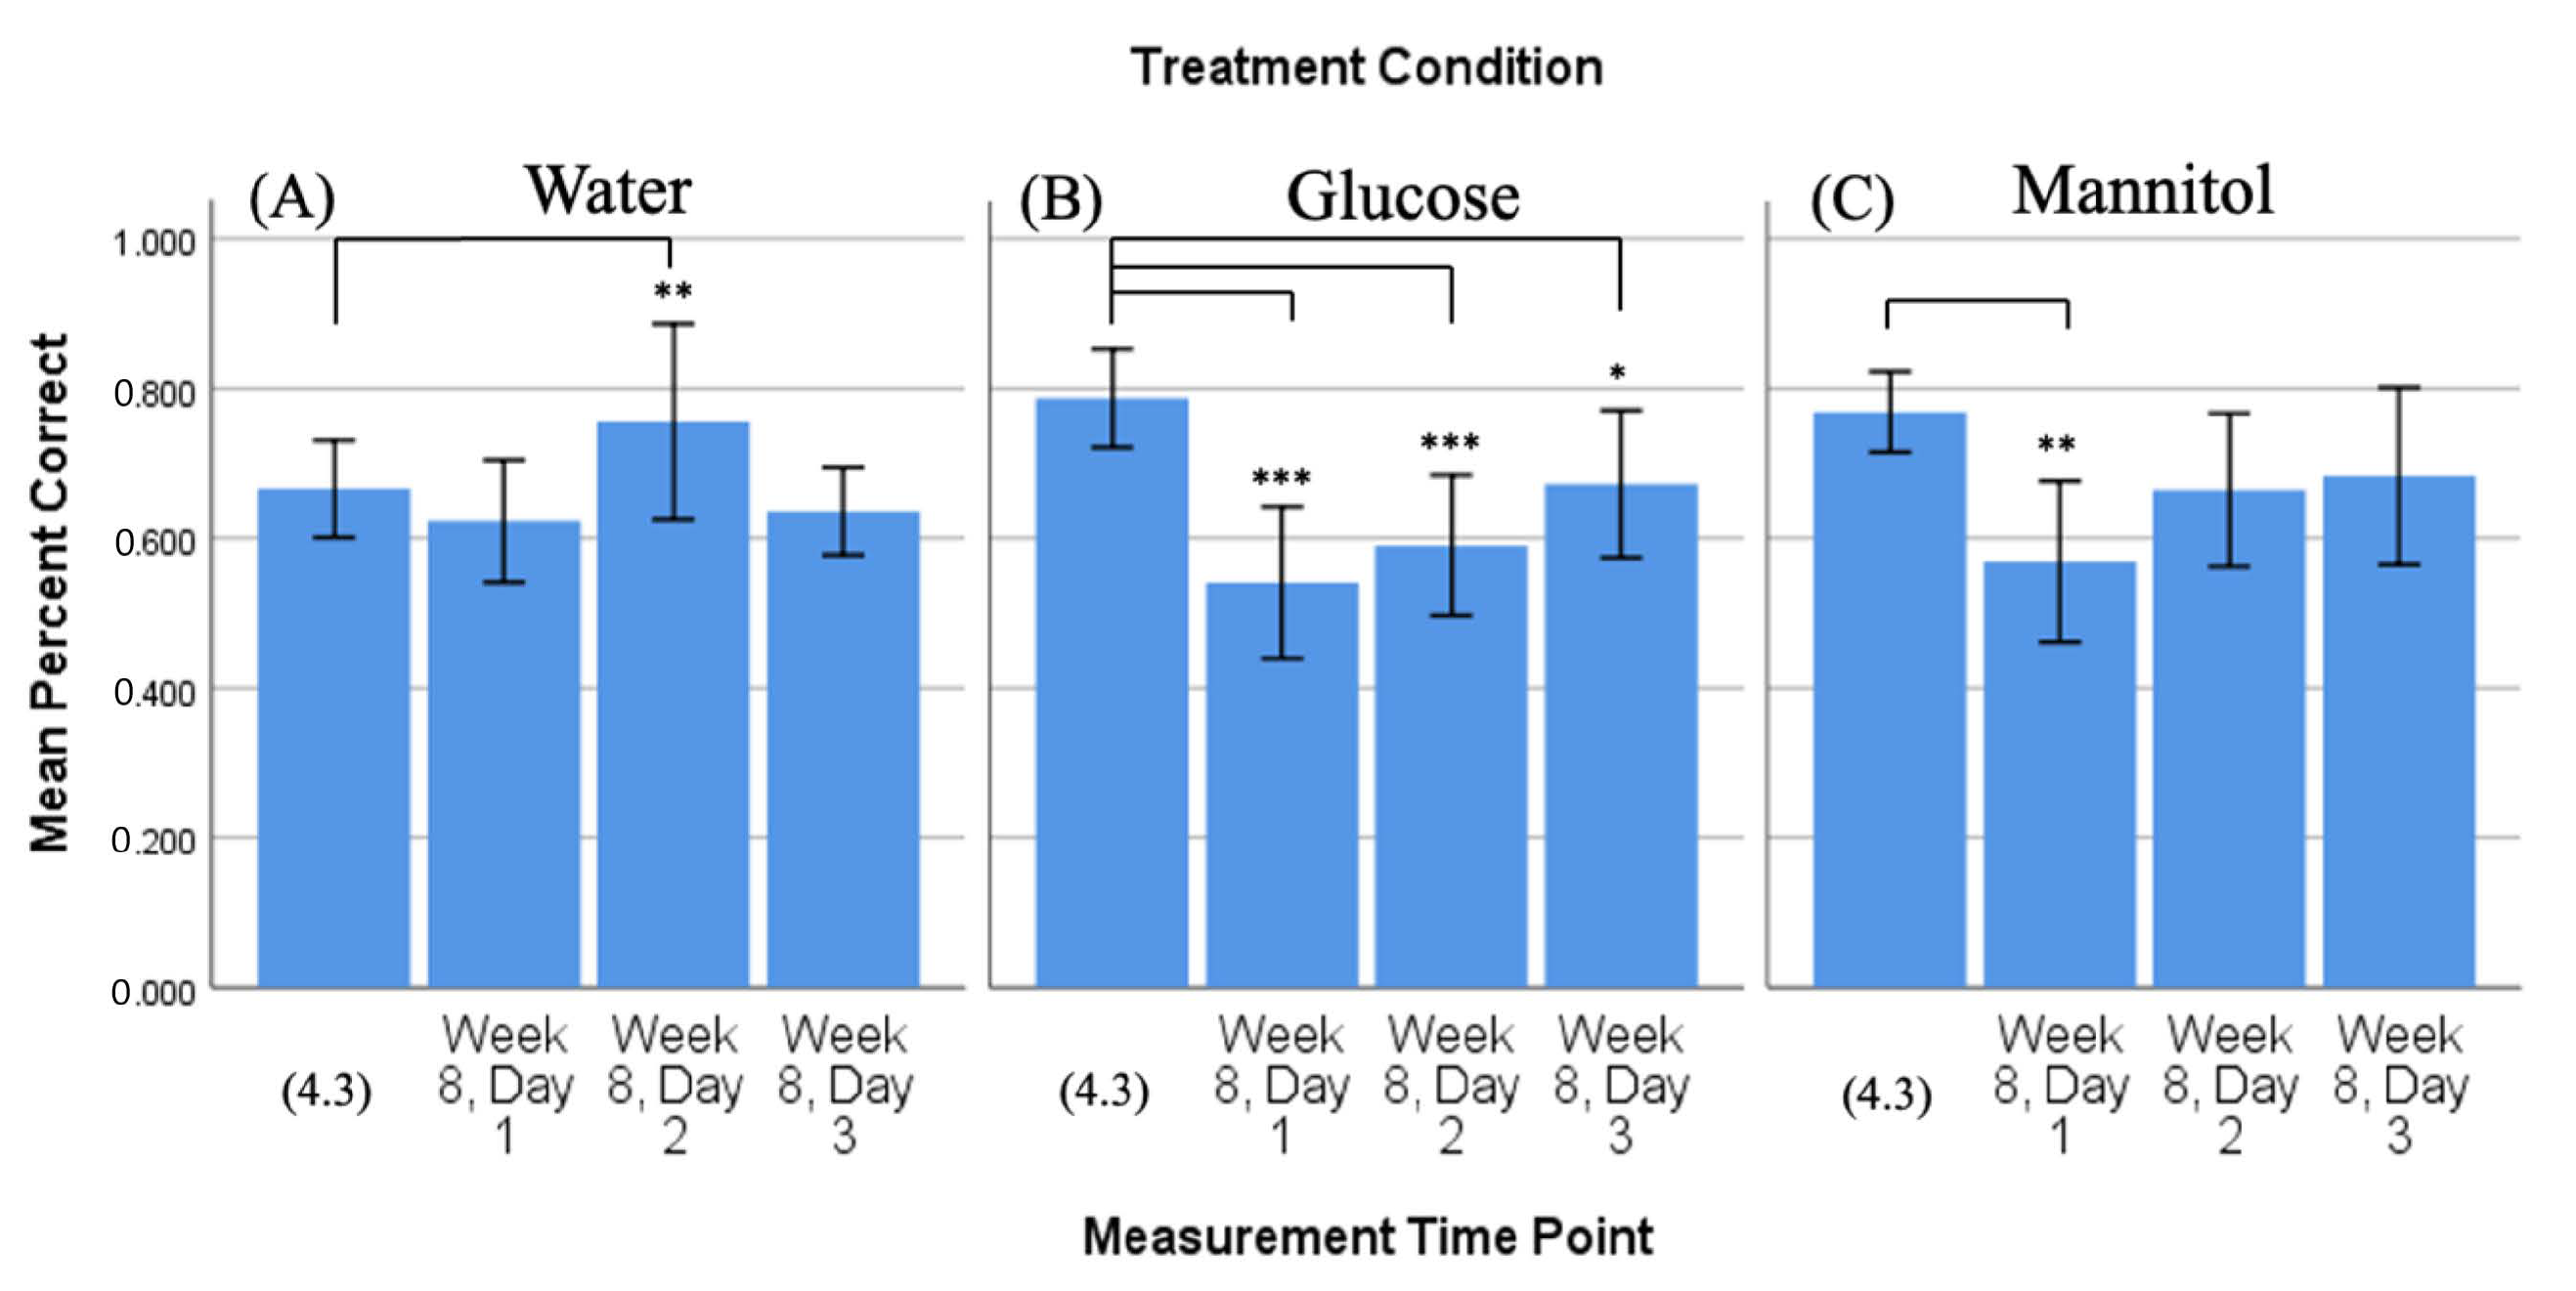
Figure 3.
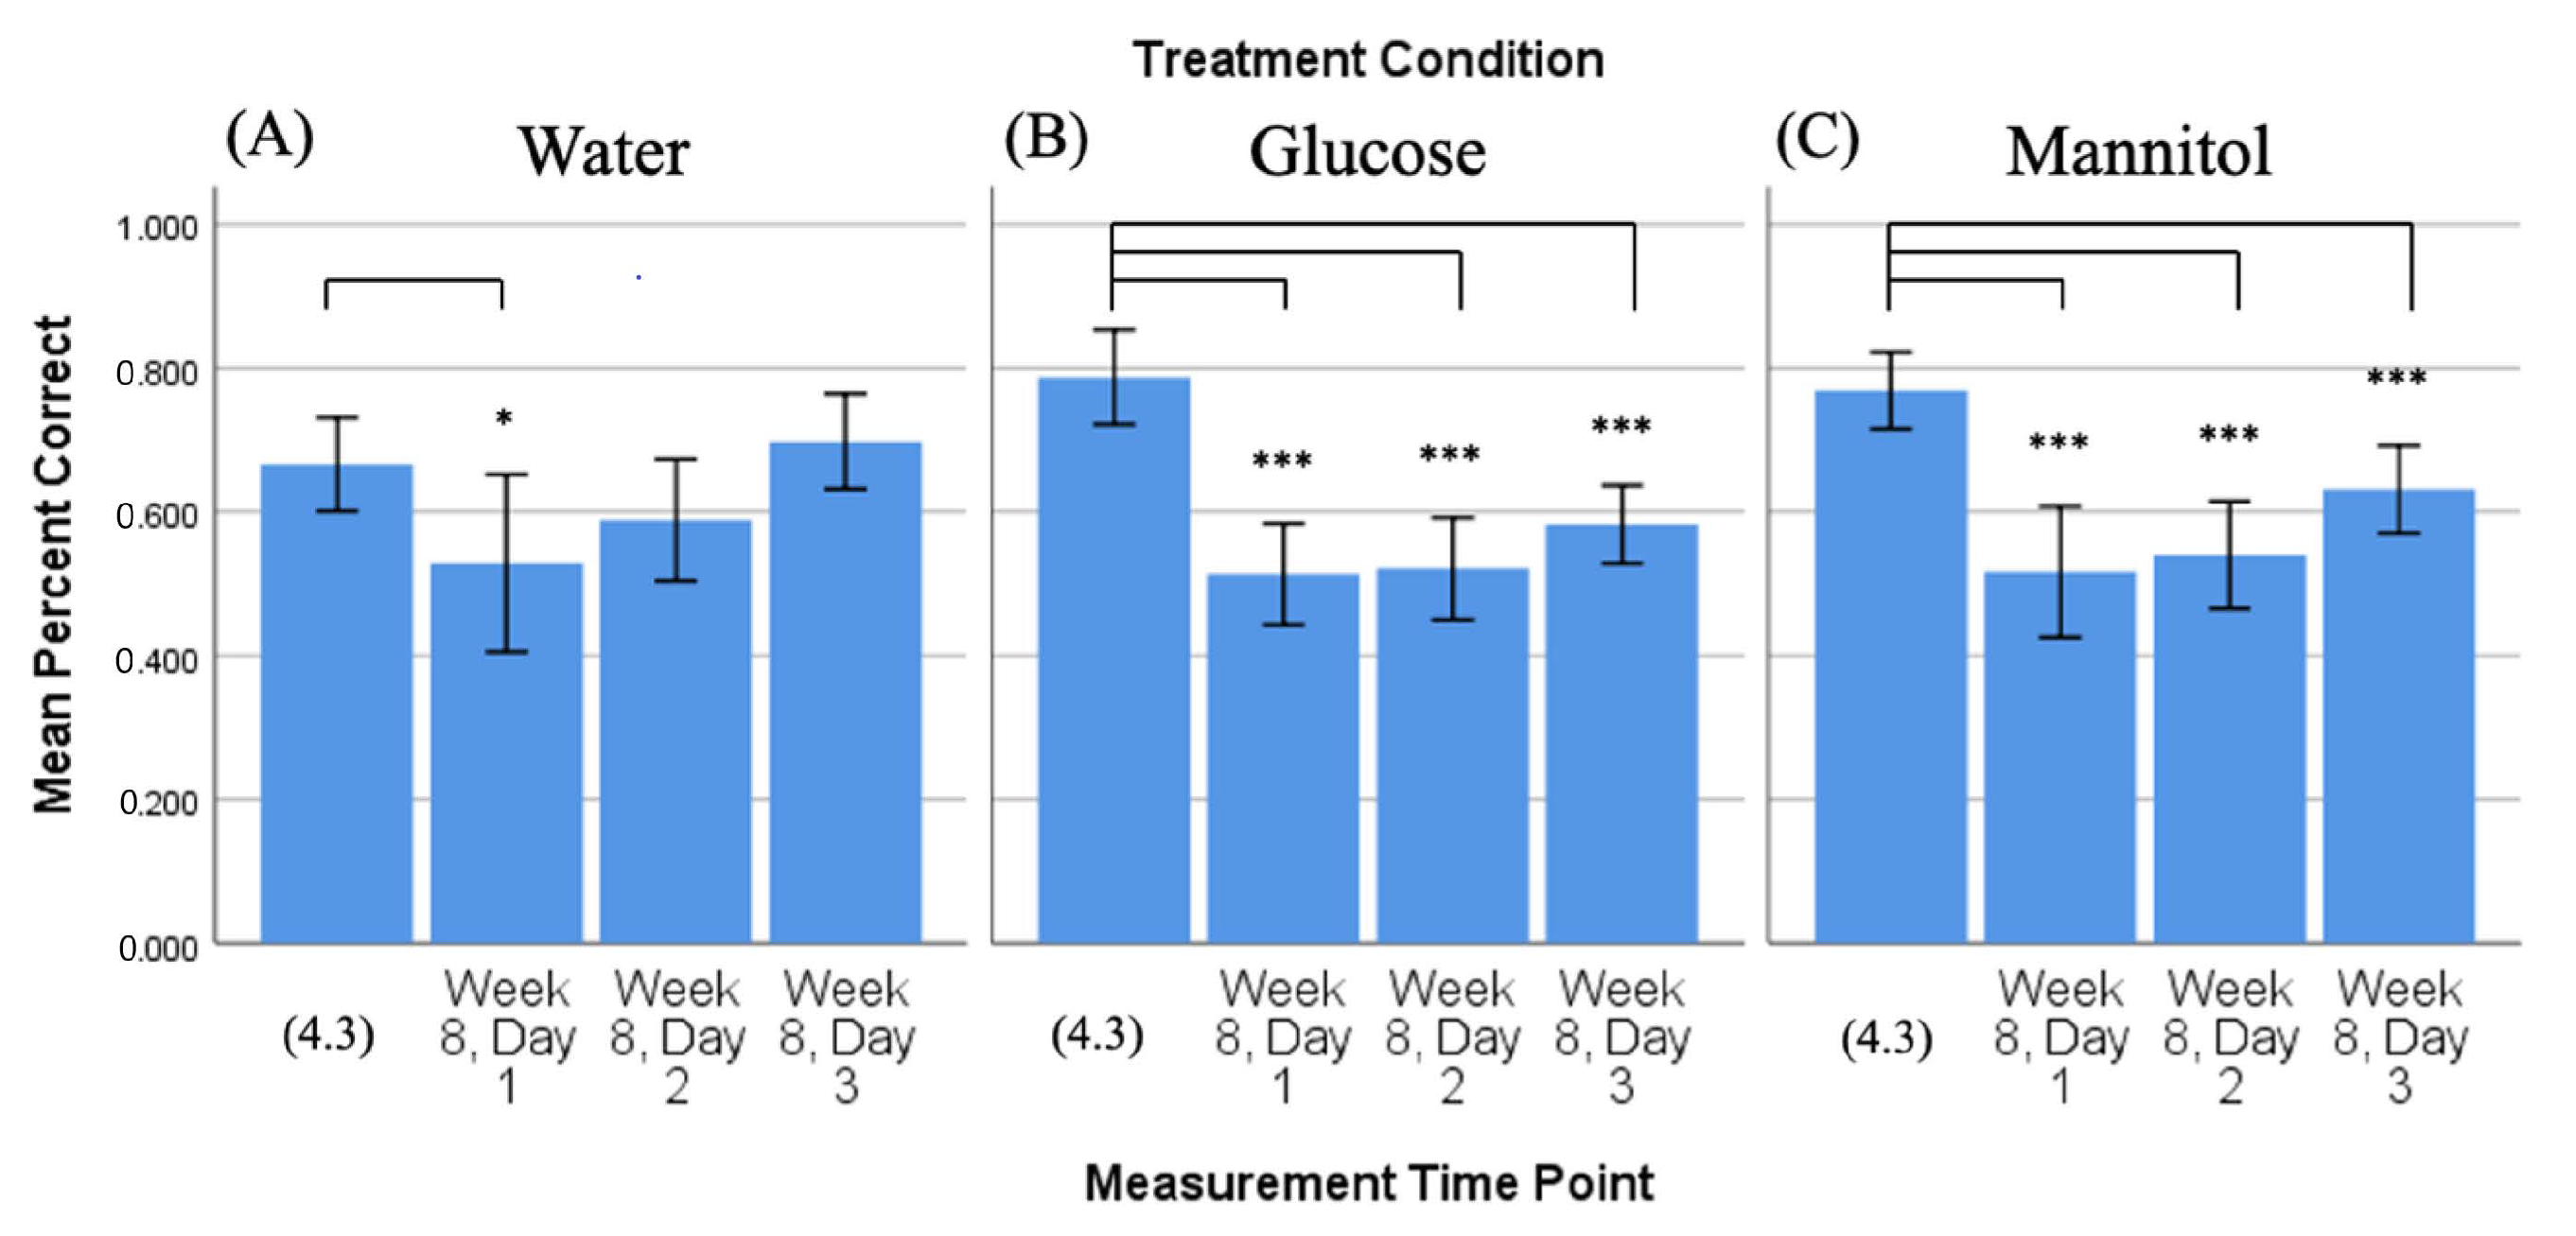
Comparison of 4-week vs. 8-week reversal. Mean percent correct scores (+/−95% CI) calculated on 4-week reversal day 3 (4.3) were compared to scores calculated on all three 8-week reversal days for (A) water-treated, (B) glucose-treated, and (C) mannitol-treated fish using individual t-tests. Water-treated fish showed an improvement in scores over the three 8-week reversal days, indicating they were able to learn the new location of the shoal reward. In contrast, glucose- and mannitol-treated fish had significantly lower numbers of correct scores on all three 8-week reversal days (day 1 p < 0.001, day 2 p < 0.001, day 3 p ≤ 0.001), suggesting these fish were unable to learn the new location of the shoal reward. * and ***: Asterisks denote significant differences.
Figure 3.
Comparison of 4-week vs. 8-week reversal. Mean percent correct scores (+/−95% CI) calculated on 4-week reversal day 3 (4.3) were compared to scores calculated on all three 8-week reversal days for (A) water-treated, (B) glucose-treated, and (C) mannitol-treated fish using individual t-tests. Water-treated fish showed an improvement in scores over the three 8-week reversal days, indicating they were able to learn the new location of the shoal reward. In contrast, glucose- and mannitol-treated fish had significantly lower numbers of correct scores on all three 8-week reversal days (day 1 p < 0.001, day 2 p < 0.001, day 3 p ≤ 0.001), suggesting these fish were unable to learn the new location of the shoal reward. * and ***: Asterisks denote significant differences.
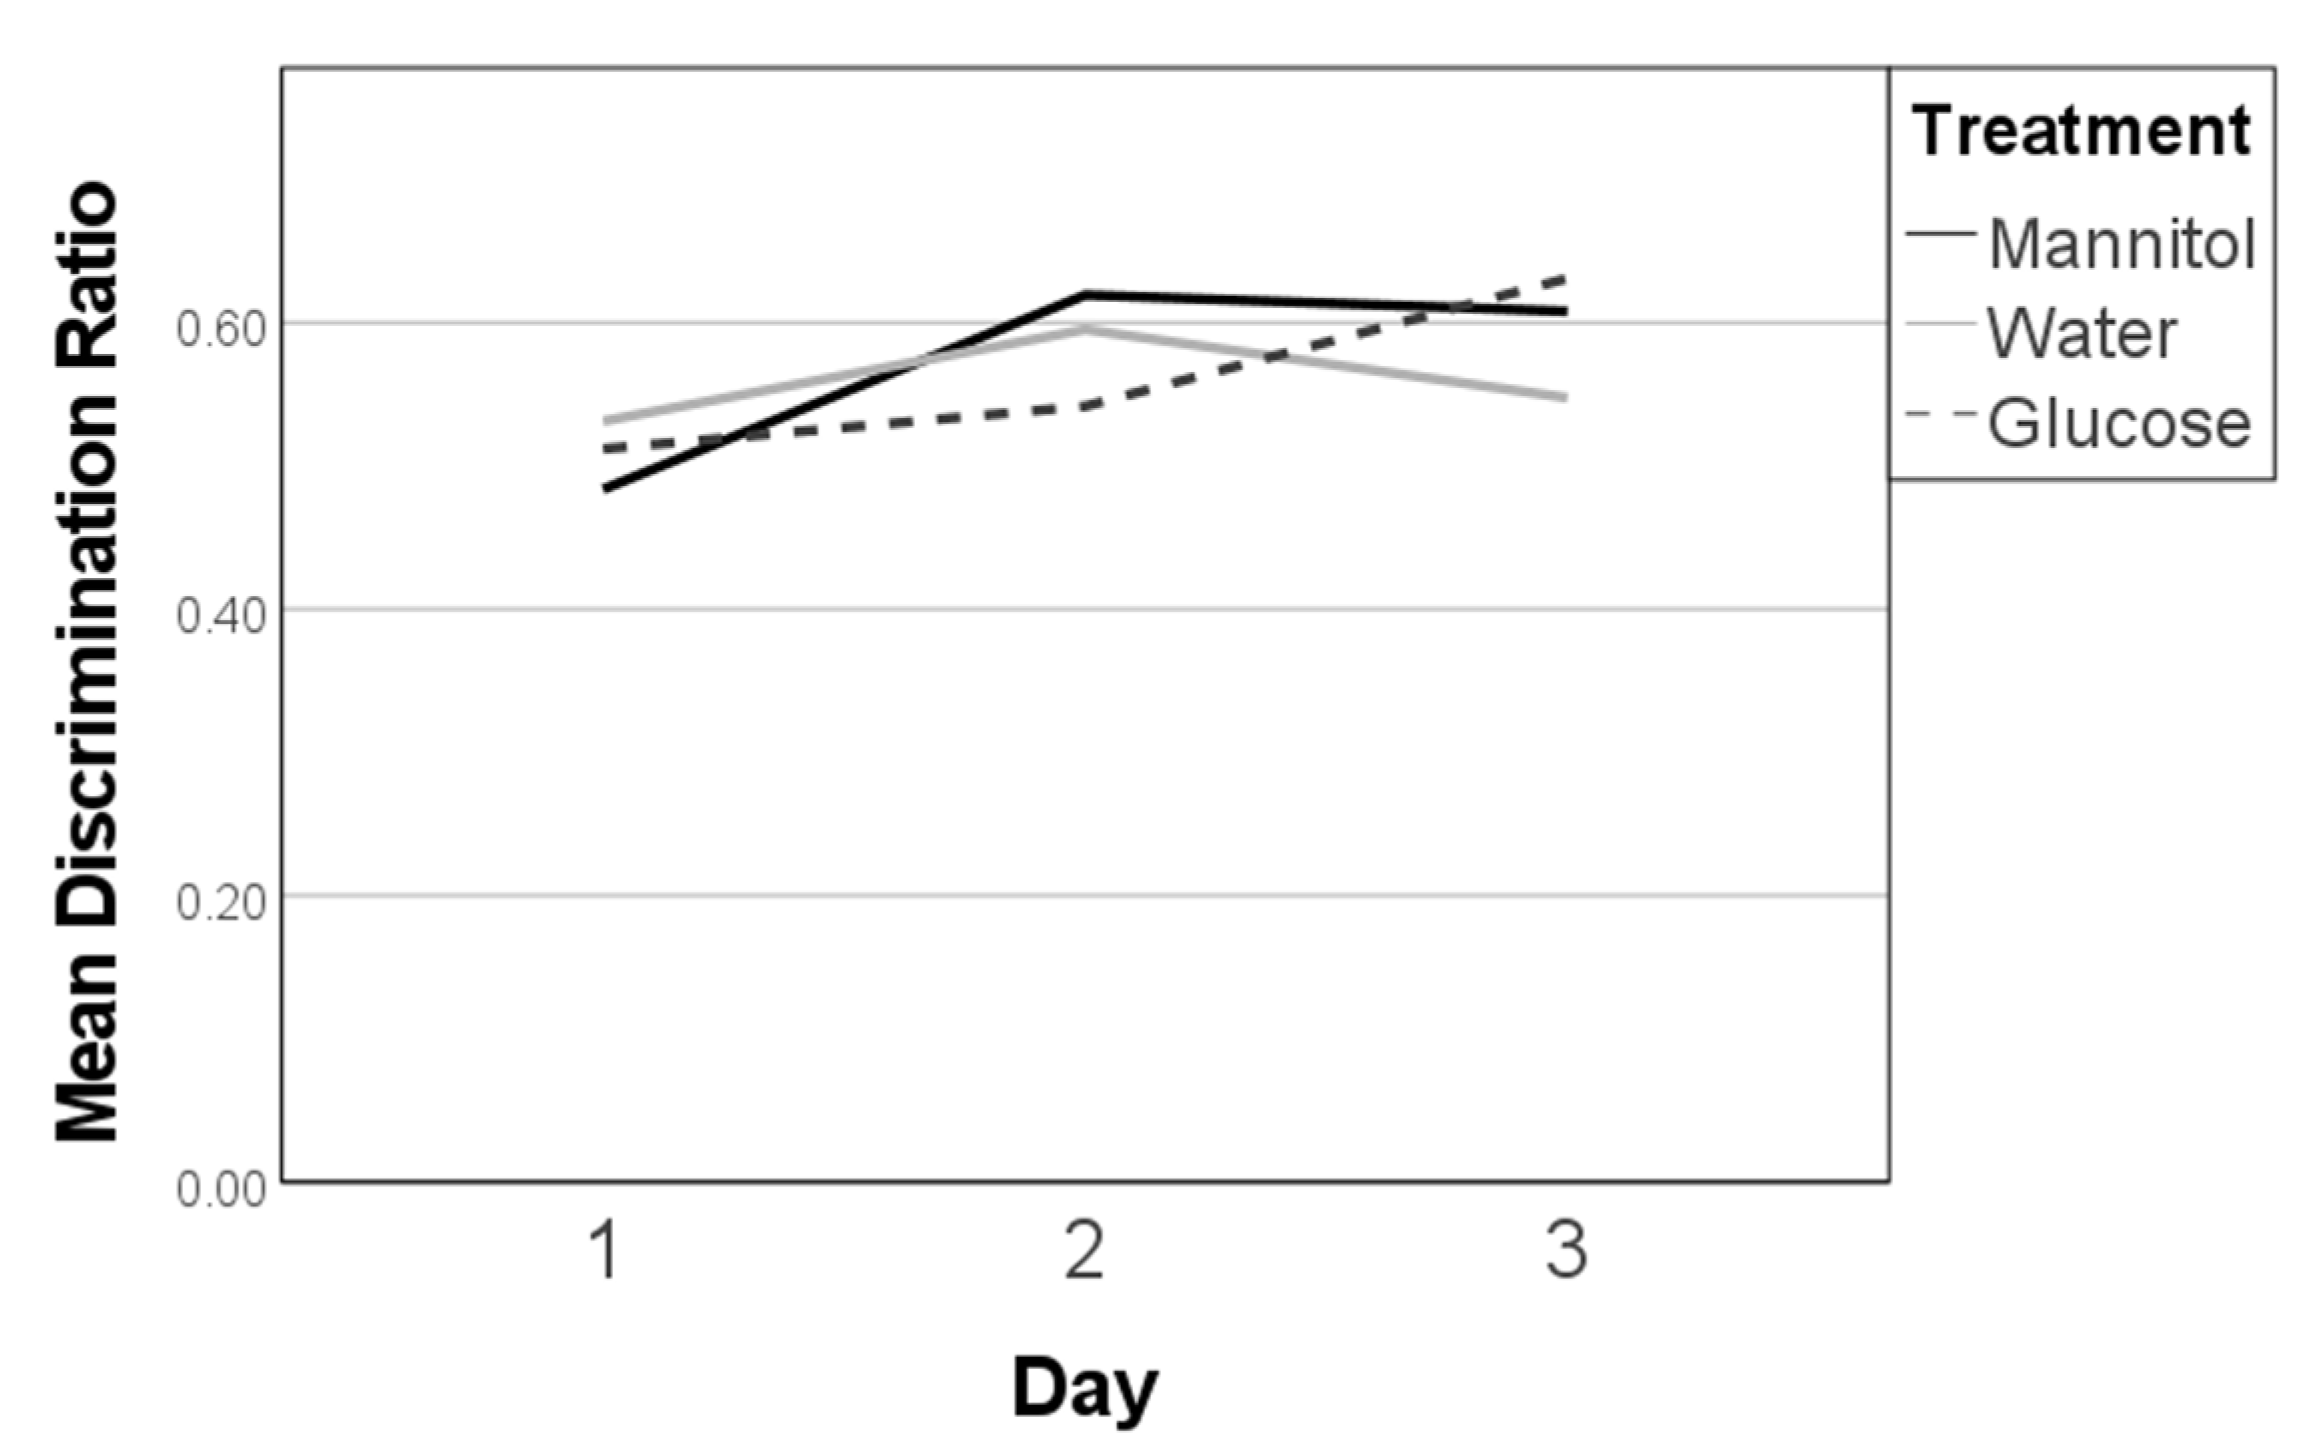
Figure 4.
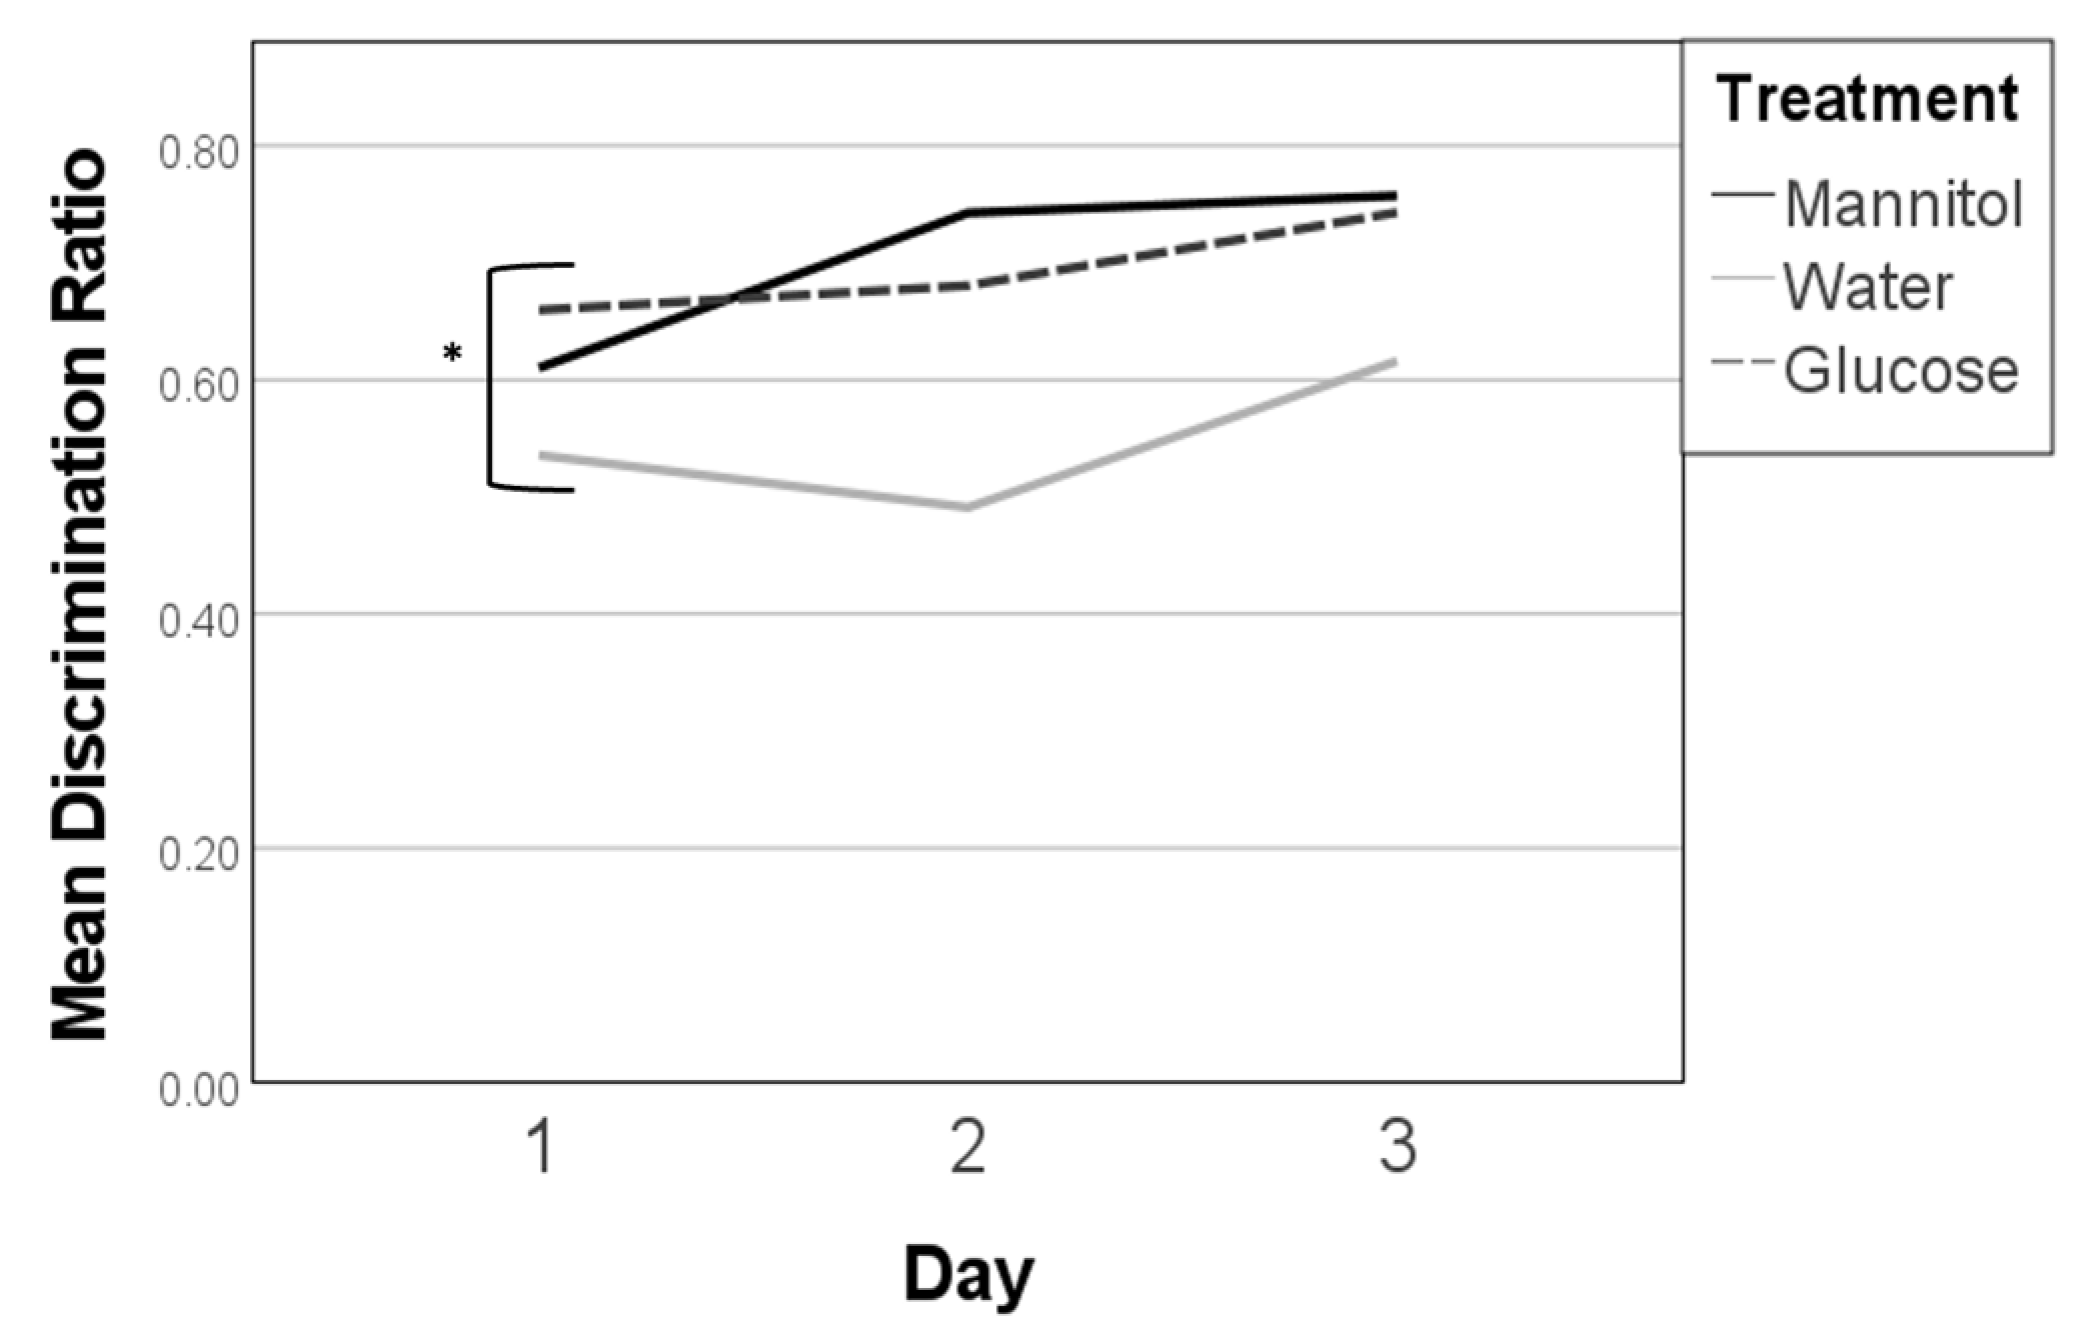
Discrimination ratios after 12 weeks of prolonged hyperglycemia. Discrimination ratios were calculated on all three 12-week reversal days (day 1, day 2, day 3) for responses of fish in each treatment group. A significant difference due to treatment was noted on day 1 only (one-way ANOVA, F (2,138) = 4.904, p = 0.009 *), wherein responses from glucose- and mannitol-treated fish were larger than water-treated controls. Subsequent trendline analysis did not identify any significant trends in responses across all three days of the shoal reward. A significant trend line was not found for glucose-treated fish (dashed line).
Figure 4.
Discrimination ratios after 12 weeks of prolonged hyperglycemia. Discrimination ratios were calculated on all three 12-week reversal days (day 1, day 2, day 3) for responses of fish in each treatment group. A significant difference due to treatment was noted on day 1 only (one-way ANOVA, F (2,138) = 4.904, p = 0.009 *), wherein responses from glucose- and mannitol-treated fish were larger than water-treated controls. Subsequent trendline analysis did not identify any significant trends in responses across all three days of the shoal reward. A significant trend line was not found for glucose-treated fish (dashed line).
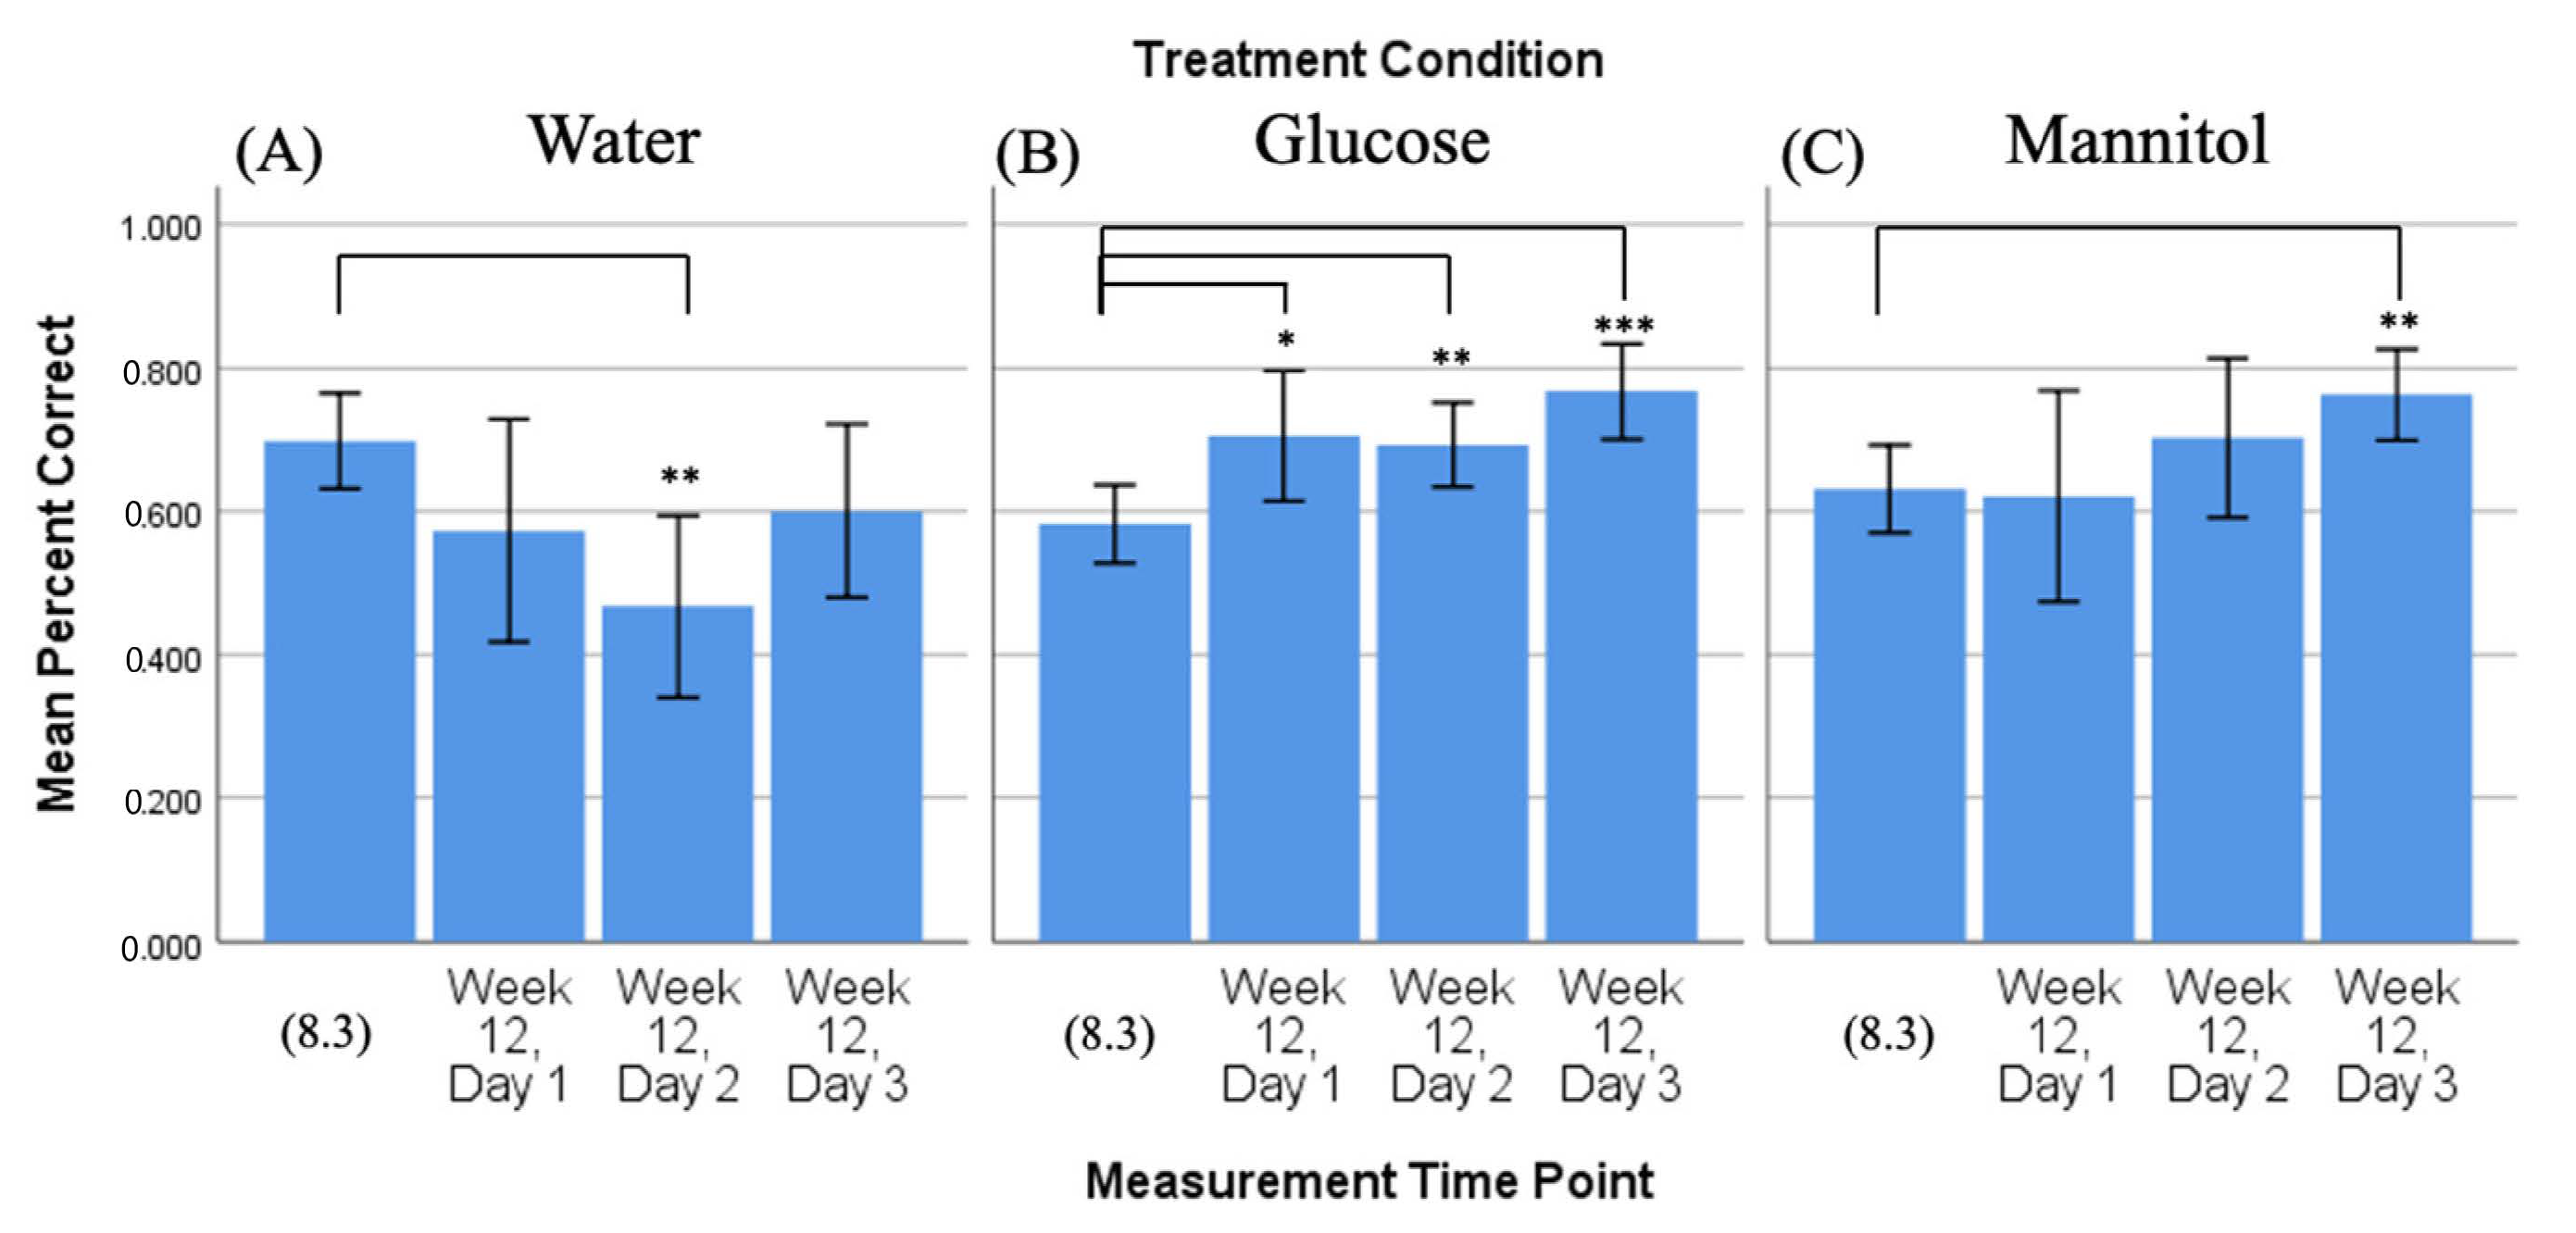
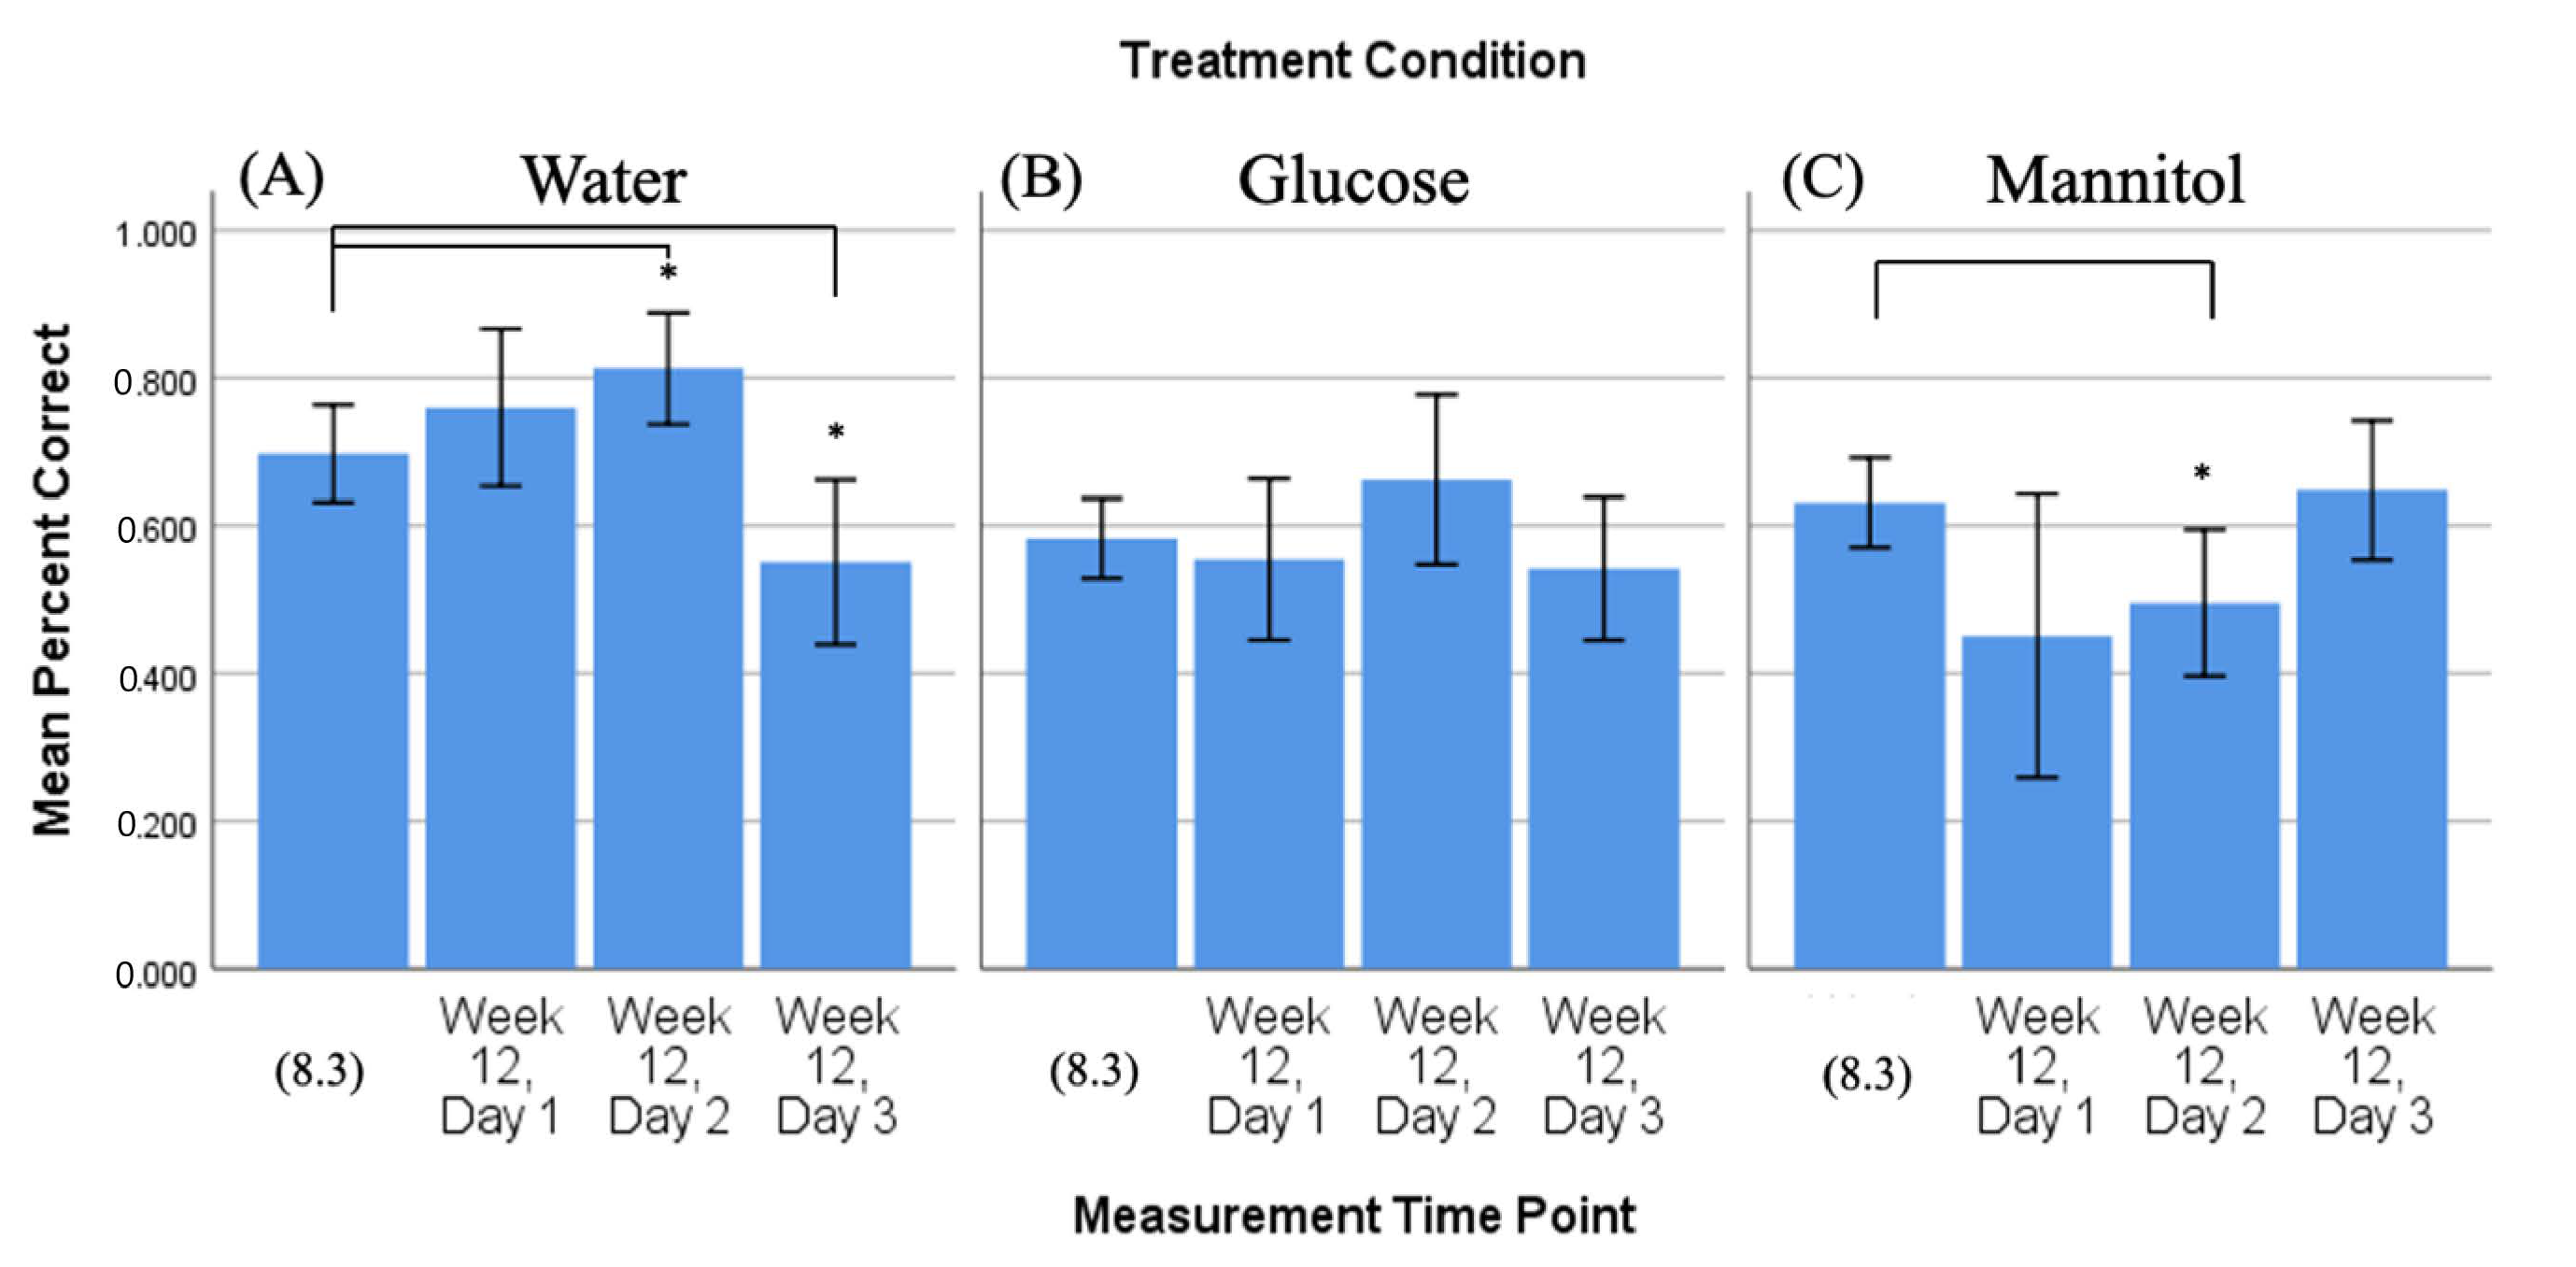
Figure 5.
Comparison of 8-week vs. 12-week reversal. Mean percent correct scores (+/−95% CI) calculated on 8-week reversal day 3 (8.3) were compared to scores calculated on all three 12-week reversal days for (A) water-treated, (B) glucose-treated, and (C) mannitol-treated fish using individual t-tests. Water-treated fish showed a reduction in correct scores on day 2 (panel (A), **). Glucose-treated fish showed significantly more correct scores on all three 12-week reversal days (day 1 p = 0.02; day 2 p = 0.006; day 3 p < 0.001), indicating that these fish were able to find the location of the shoal reward. *,**,*** Asterisks in (B) denote significant differences, where the number of asterisks denotes level of significance. Mannitol-treated fish showed significantly increased scores by day 3 (p = 0.003, (panel (C), **)).
Figure 6.
Discrimination ratios in the 8-week washout experiments. Discrimination ratios were calculated on all three 8-week reversal days (day 1, day 2, day 3). In this experiment, fish were exposed to hyperglycemic conditions for 4 weeks, followed by 4 weeks in normglycemic (system water) conditions. No significant differences in discrimination ratios were observed on any reversal day (p > 0.05; one-way ANOVA). Subsequent trendline analysis also failed to identify any significant differences.
Figure 7.
Comparison of 4-week vs. 8-week washout reversal. Mean percent correct scores (+/−95% CI) calculated on 4-week reversal day 3 (4.3) were compared to scores calculated on all three 8-week reversal days for (A) water-treated, (B) glucose-treated, and (C) mannitol-treated fish. In these experiments, 8-week fish were maintained in hyperglycemic conditions for 4 weeks, followed by a 4-week removal from treatment. Water-treated fish displayed a significant increase in percent correct scores on day 2 only (p = 0.004, panel (A), **); scores on other days were not different from 4.3. Glucose-treated fish had a significantly lower number of correct scores on all three 8-week reversal days (day 1 p < 0.001; day 2 p = 0.001; day 3 p = 0.05; individual t-tests performed on each day. *,*** Asterisks in (B) denote significant differences with the number of asterisks reflecting level of significance). Mannitol-treated fish had significantly lower correct scores on day 1 only (p = 0.002, **).
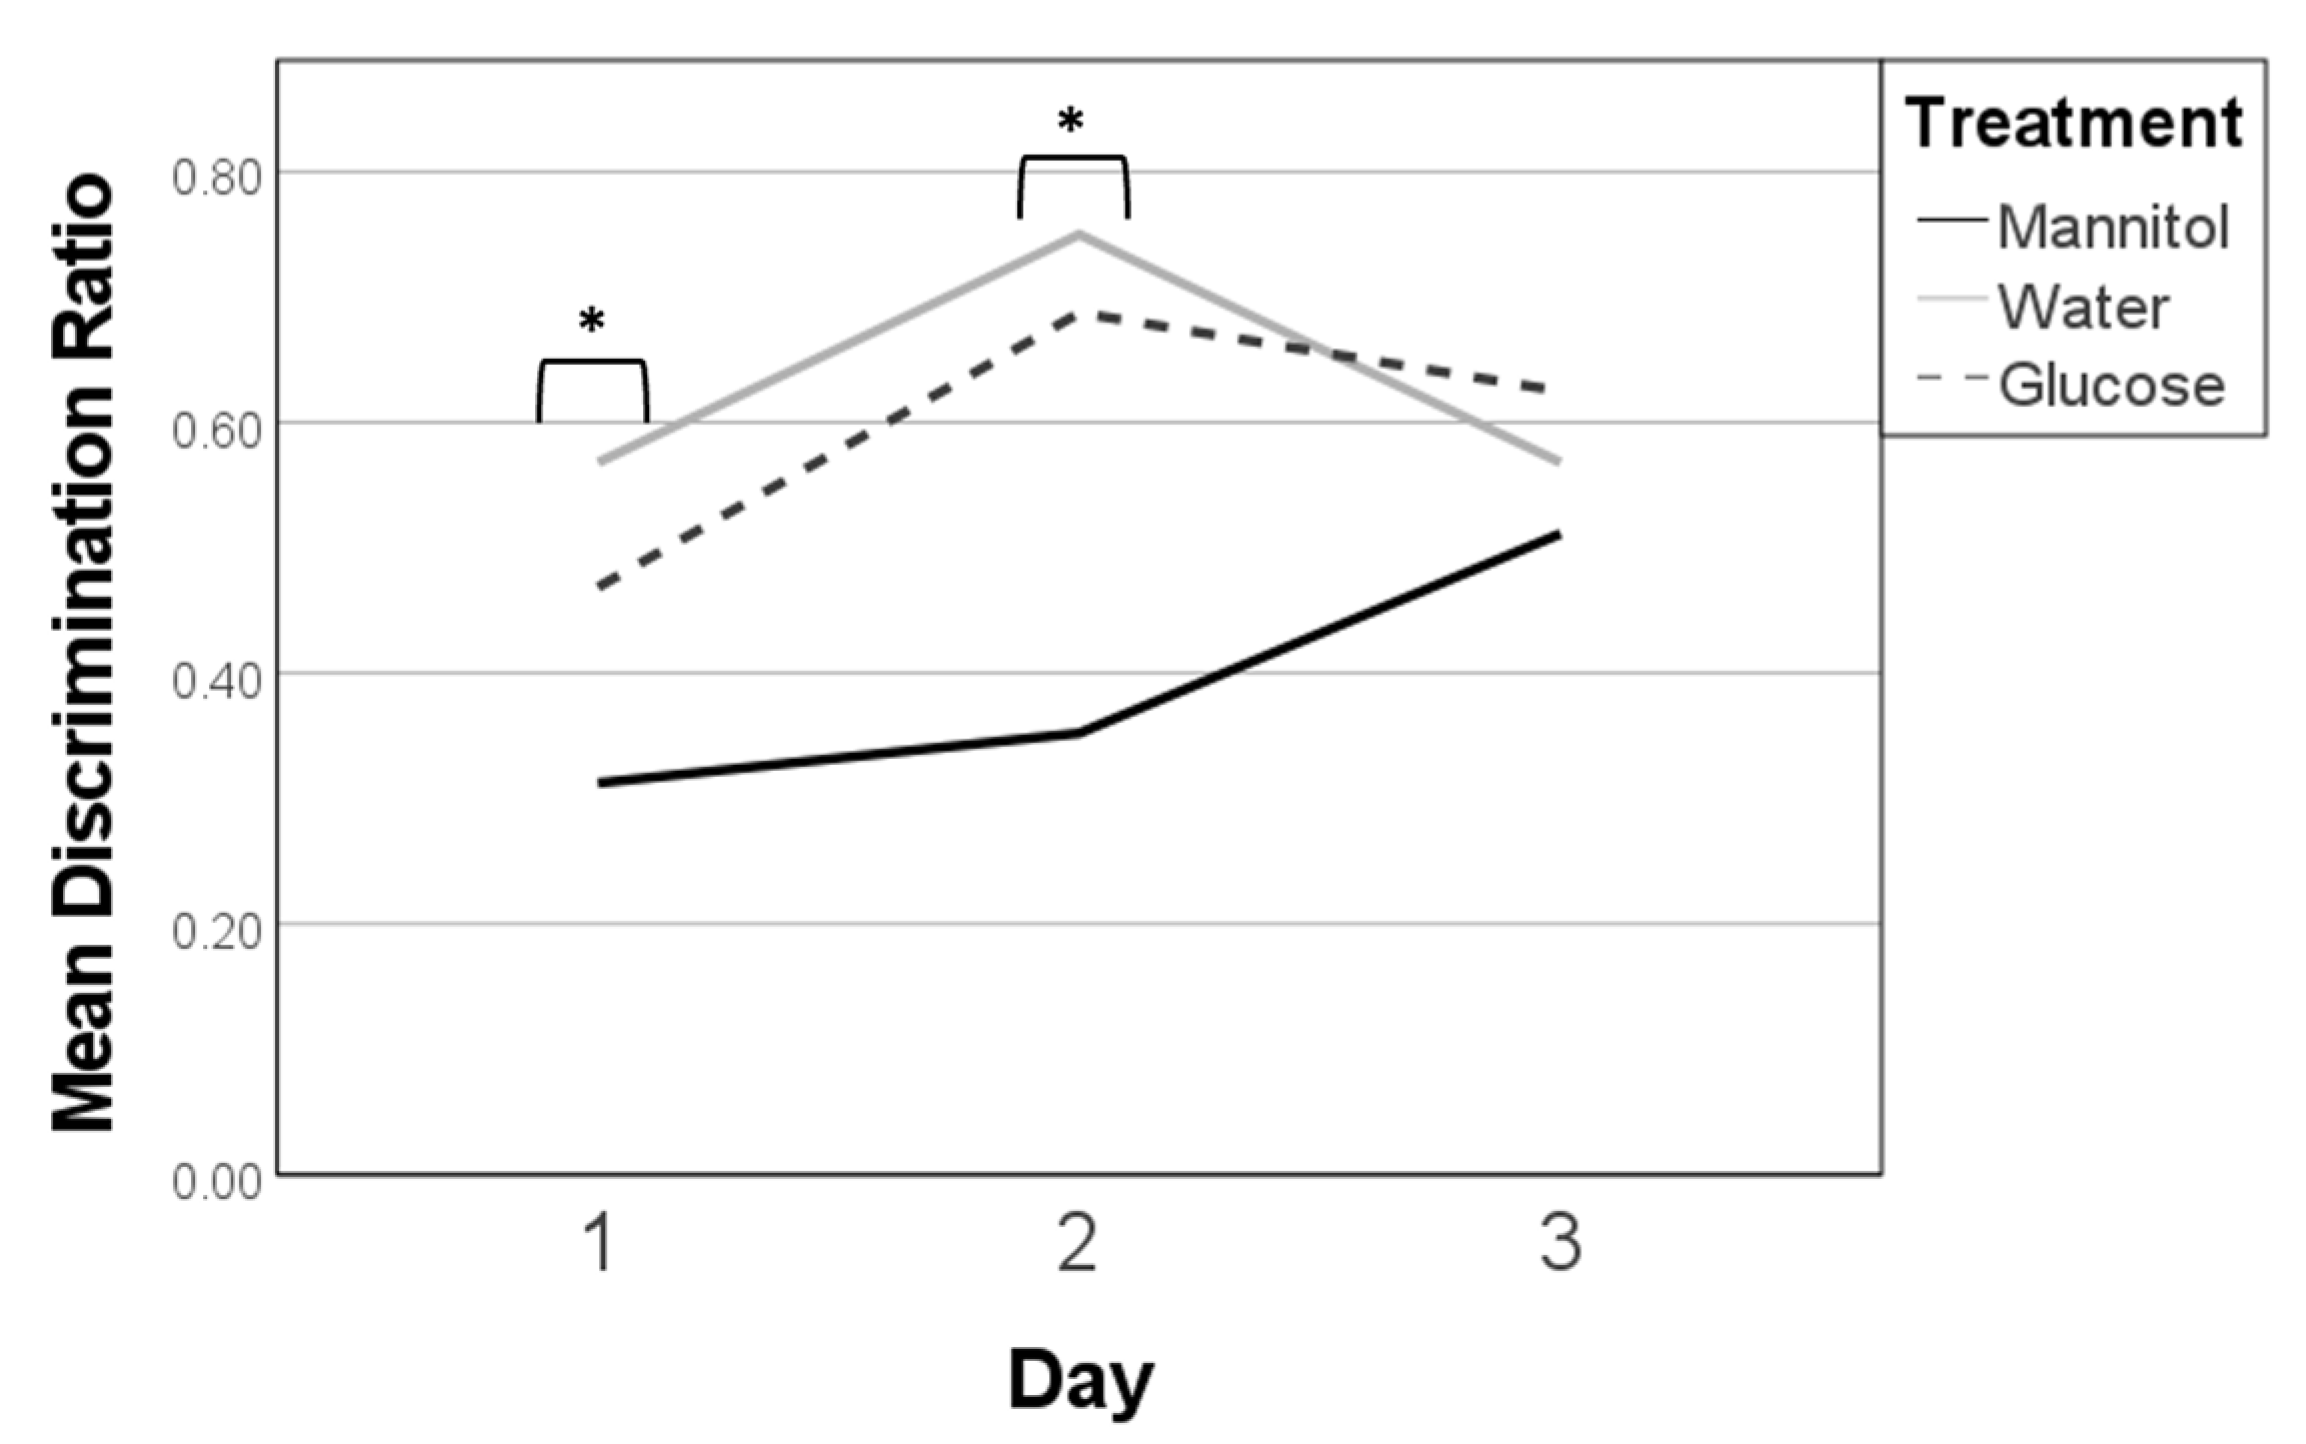
Figure 8.
Discrimination ratios in the 12-week washout experiments. Discrimination ratios were calculated on all three 12-week reversal days (day 1, day 2, day 3). In this experiment, fish were exposed to hyperglycemic conditions for 8 weeks, followed by 4 weeks in normglycemic (system water) conditions. Significant differences in discrimination ratios were observed on days 1 and 2, when the responses of mannitol treated fish were lower than responses of fish in the glucose- or water-treatment groups (one-way ANOVA, F (2,82) = 7.051, p = 0.001, *). However, subsequent trendline analysis did not identify any significant differences across reversal days.
Figure 9.
Comparison of 8-week vs. 12-week washout reversal. Mean percent correct scores (+/−95% CI) calculated on 8-week reversal day 3 (8.3) were compared (individual t-tests) to scores calculated on all three 12-week reversal days for (A) water-treated, (B) glucose-treated, and (C) mannitol-treated fish. At the 12-week timepoint, the fish had been exposed to hyperglycemic conditions for 8-weeks, followed by 4 weeks of recovery. Water-treated fish showed an increase in correct scores at day 2 (p = 0.021), but a decrease on reversal day 3. The percent correct scores in glucose-treated fish were not different across all three reversal days or compared to 8.3. Mannitol-treated fish also had responses similar to 8.3, though the percentage of correct scores was reduced on reversal day 2 (p = 0.021). Asterisks denote significant differences.
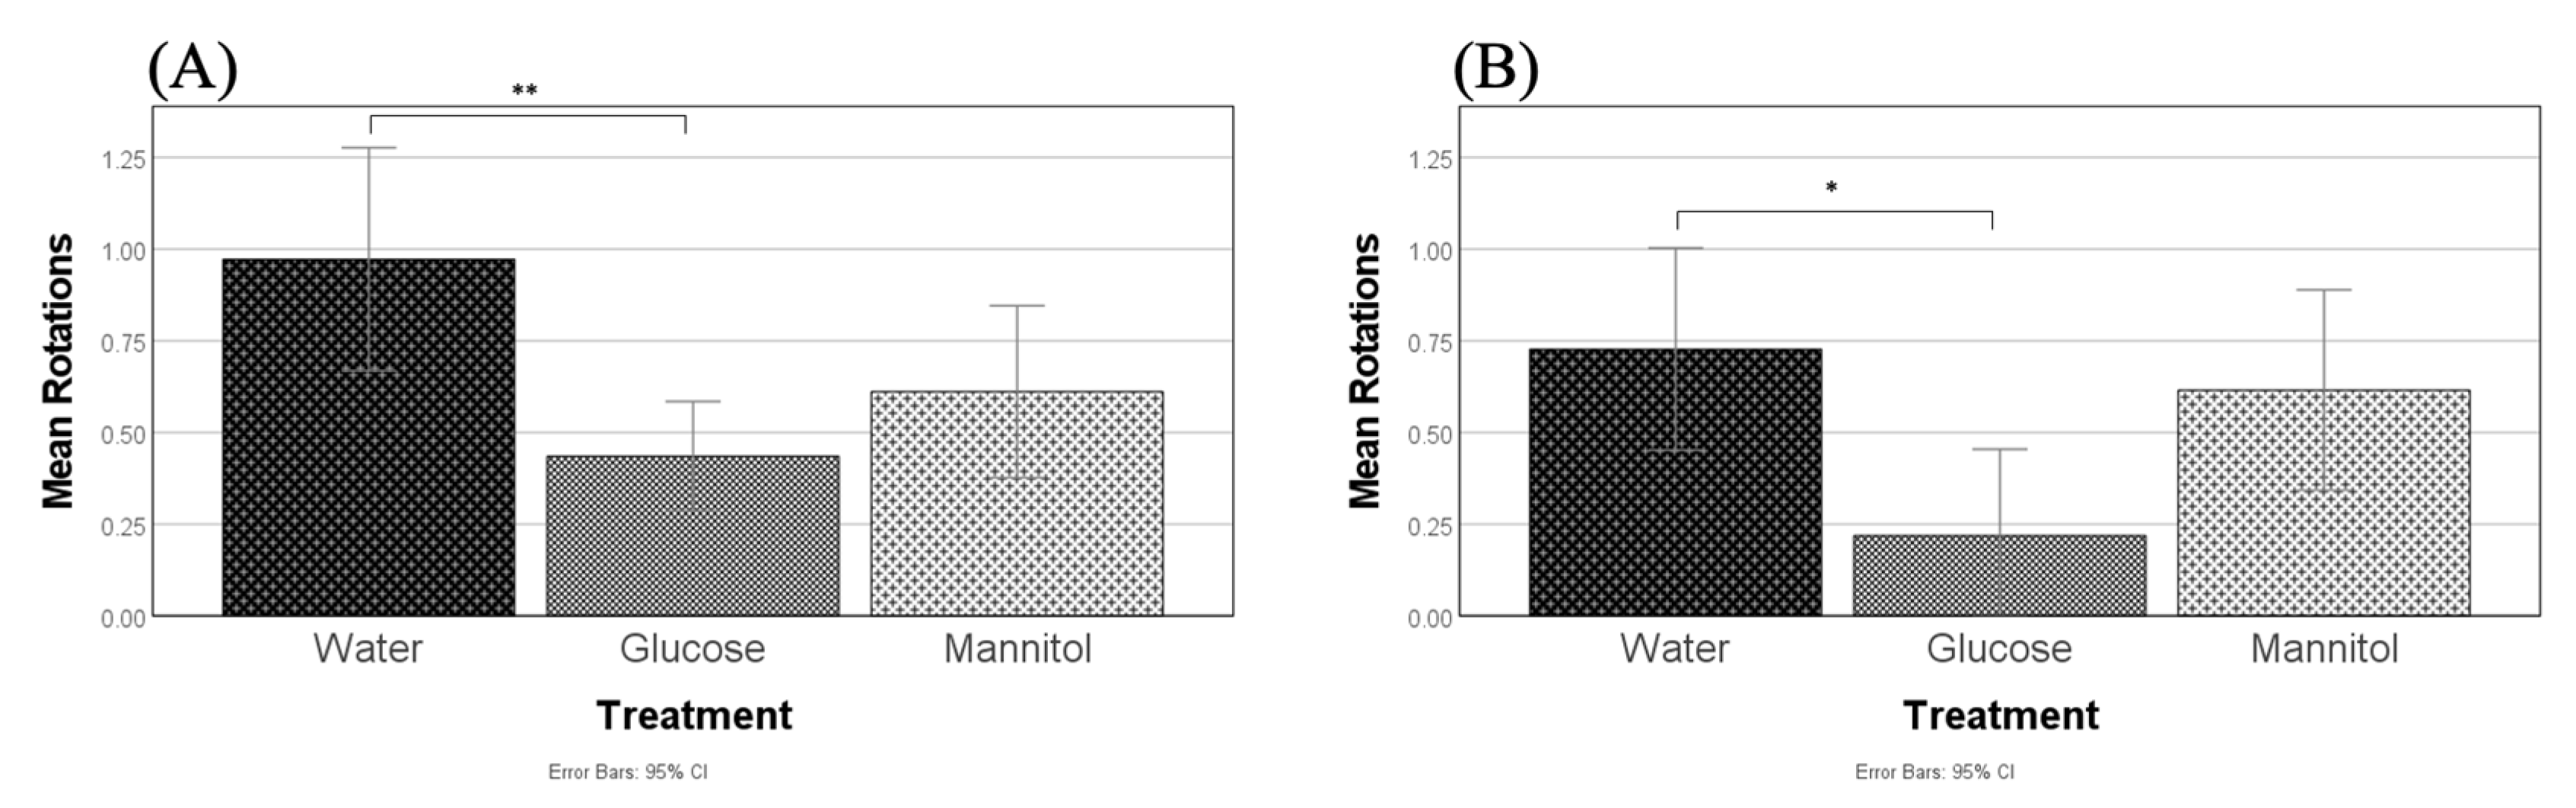
Figure 10.
Optomotor responses. Optomotor responses (OMRs) were measured after (A) 8 weeks and (B) 12 weeks of hyperglycemia. At both timepoints, one-way ANOVA identified reduced positive OMRs in glucose-treated fish compared to water-treated controls (8-weeks, p = 0.002, **; 12-weeks, p = 0.033, *). Values presented are means +/−95% CI.
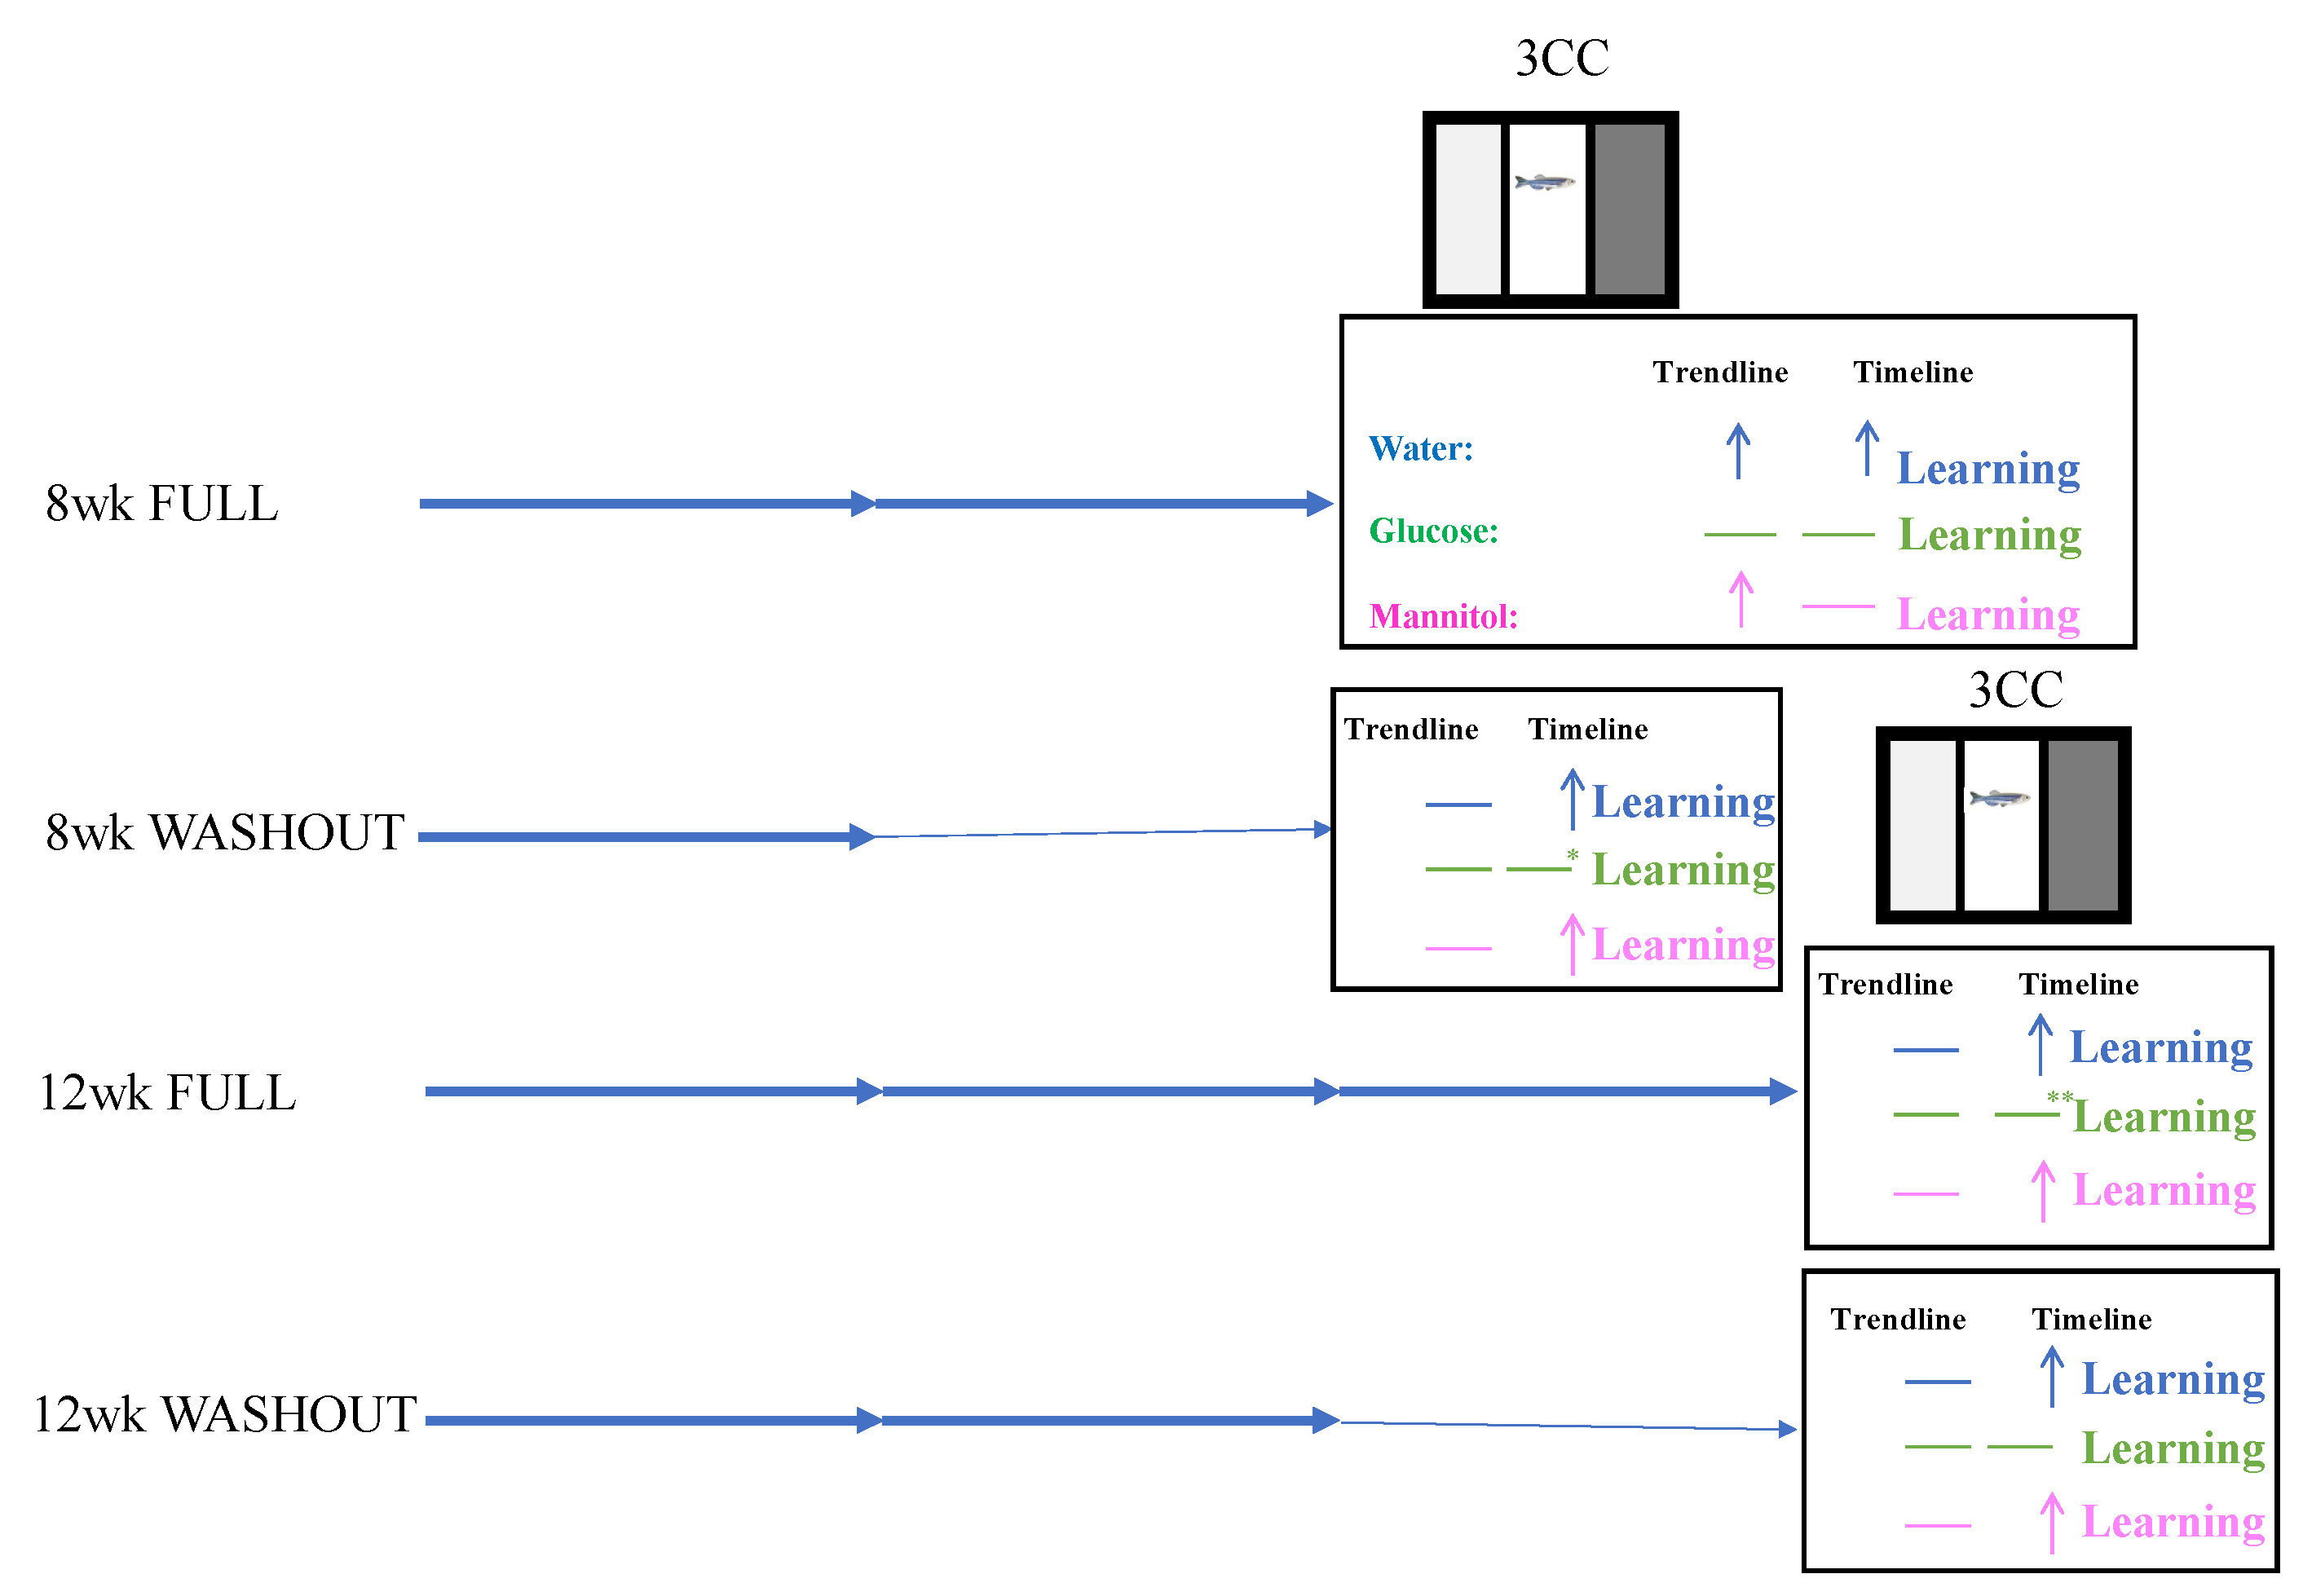
Figure 11.
Overview of cognitive and visual performance. For each experiment: 8 wk Full = 8 weeks of hyperglycemia; 8 wk WO = 8-week washout experiment with fish exposed to glucose for 4-weeks followed by a 4-week recovery period; 12 wk Full = 12 weeks of hyperglycemia; 12 wk WO = 12-week washout experiment with fish exposed to glucose for 8-weeks followed by a 4-week recover period. Here we can see that water-treated fish displayed learning in over 50% of the analyses (denoted by the arrow), whereas mannitol displayed learning in exactly 50% of the analyses. Glucose-treated fish displayed learning in 0% of the analyses with two exceptions. At 8 wk washout denoted by the single asterisk, glucose-treated fish showed evidence of slight learning although they did not pass the threshold, and at 12-weeks full denoted by the double asterisk glucose-treated fish showed evidence of memory, but no new learning.
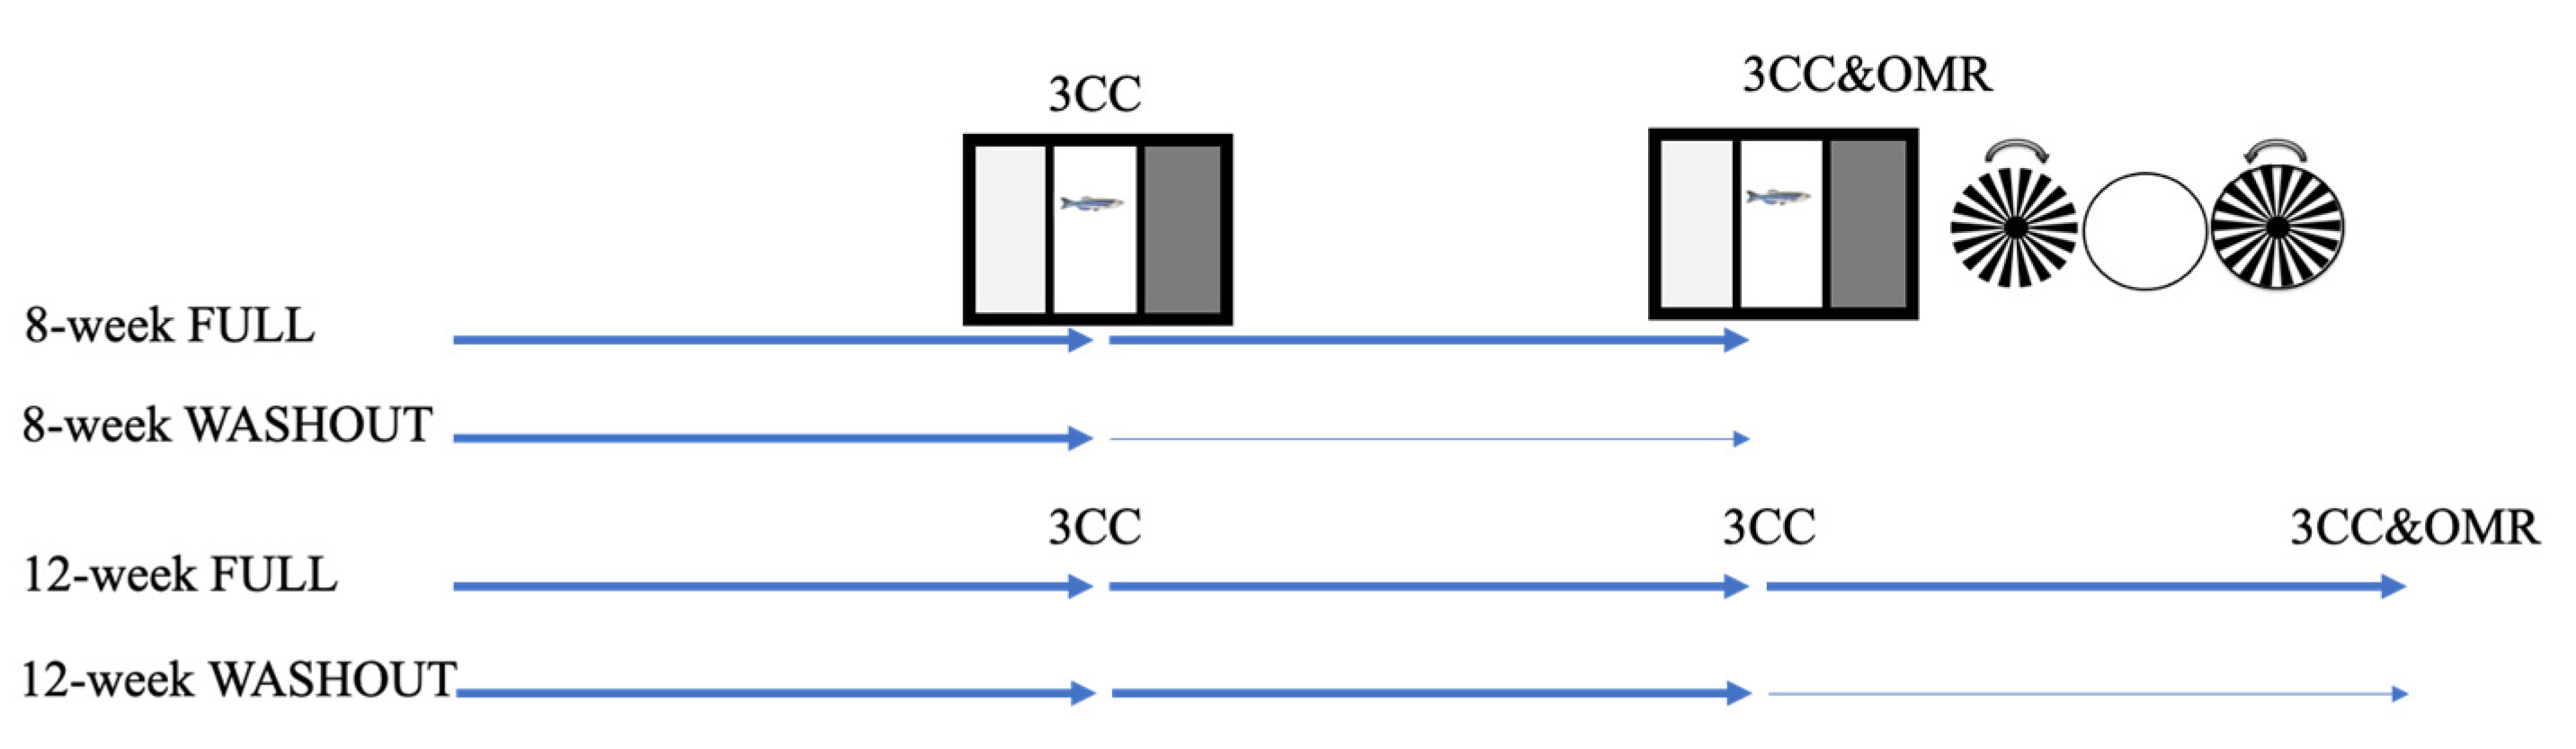
Figure 12.
Experimental design. Using the alternating, increasing immersion protocol, hyperglycemia was induced in adult zebrafish for either 8 weeks (8-week FULL) or 12 weeks (12-week FULL). To assess the effect of recovery, additional experiments were performed in which the fish were hyperglycemic for 4 weeks, followed by 4 weeks removed from treatment (8-week WASHOUT) or hyperglycemic for 8 weeks, followed by 4 weeks removed from treatment (12-week WASHOUT). Each arrow in the above figure represents 4 weeks; darker arrows reflect treatment exposure, and thin arrows represent recovery. At each 4-week timepoint, cognitive behavior was assessed using the three-chamber choice task (3CC). At 8 weeks and 12 weeks, optomotor responses (OMRs) were also recorded.
Table 1.
Glucose-specific vs. osmotic pathways. This table summarizes whether a given behavior appears to be due to a general osmotic effect or a glucose-specific effect. 8 wk Full = 8 weeks of hyperglycemia; 12 wk Full = 12 weeks of hyperglycemia; 8 wk WO = 8-week washout experiment with fish exposed to glucose for 4 weeks followed by a 4-week recovery period; 12 wk WO = 12-week washout experiment with fish exposed to glucose for 8 weeks followed by a 4-week recover period.
| | Trendline Analysis | Timepoint Comparison | OMR |
|---|
| 8 wk | Glucose specific | Osmotic | Osmotic |
| 12 wk | Osmotic | Glucose specific | Osmotic |
| 8 wk WO | Osmotic | Glucose specific | NA |
| 12 wk WO | Glucose specific | Glucose specific | NA |


