
Antitumor Effects of a New Retinoate of the Fungal Cytotoxin Illudin M in Brain Tumor Models

 ,
,  , , , , and
Abstract
:1. Introduction
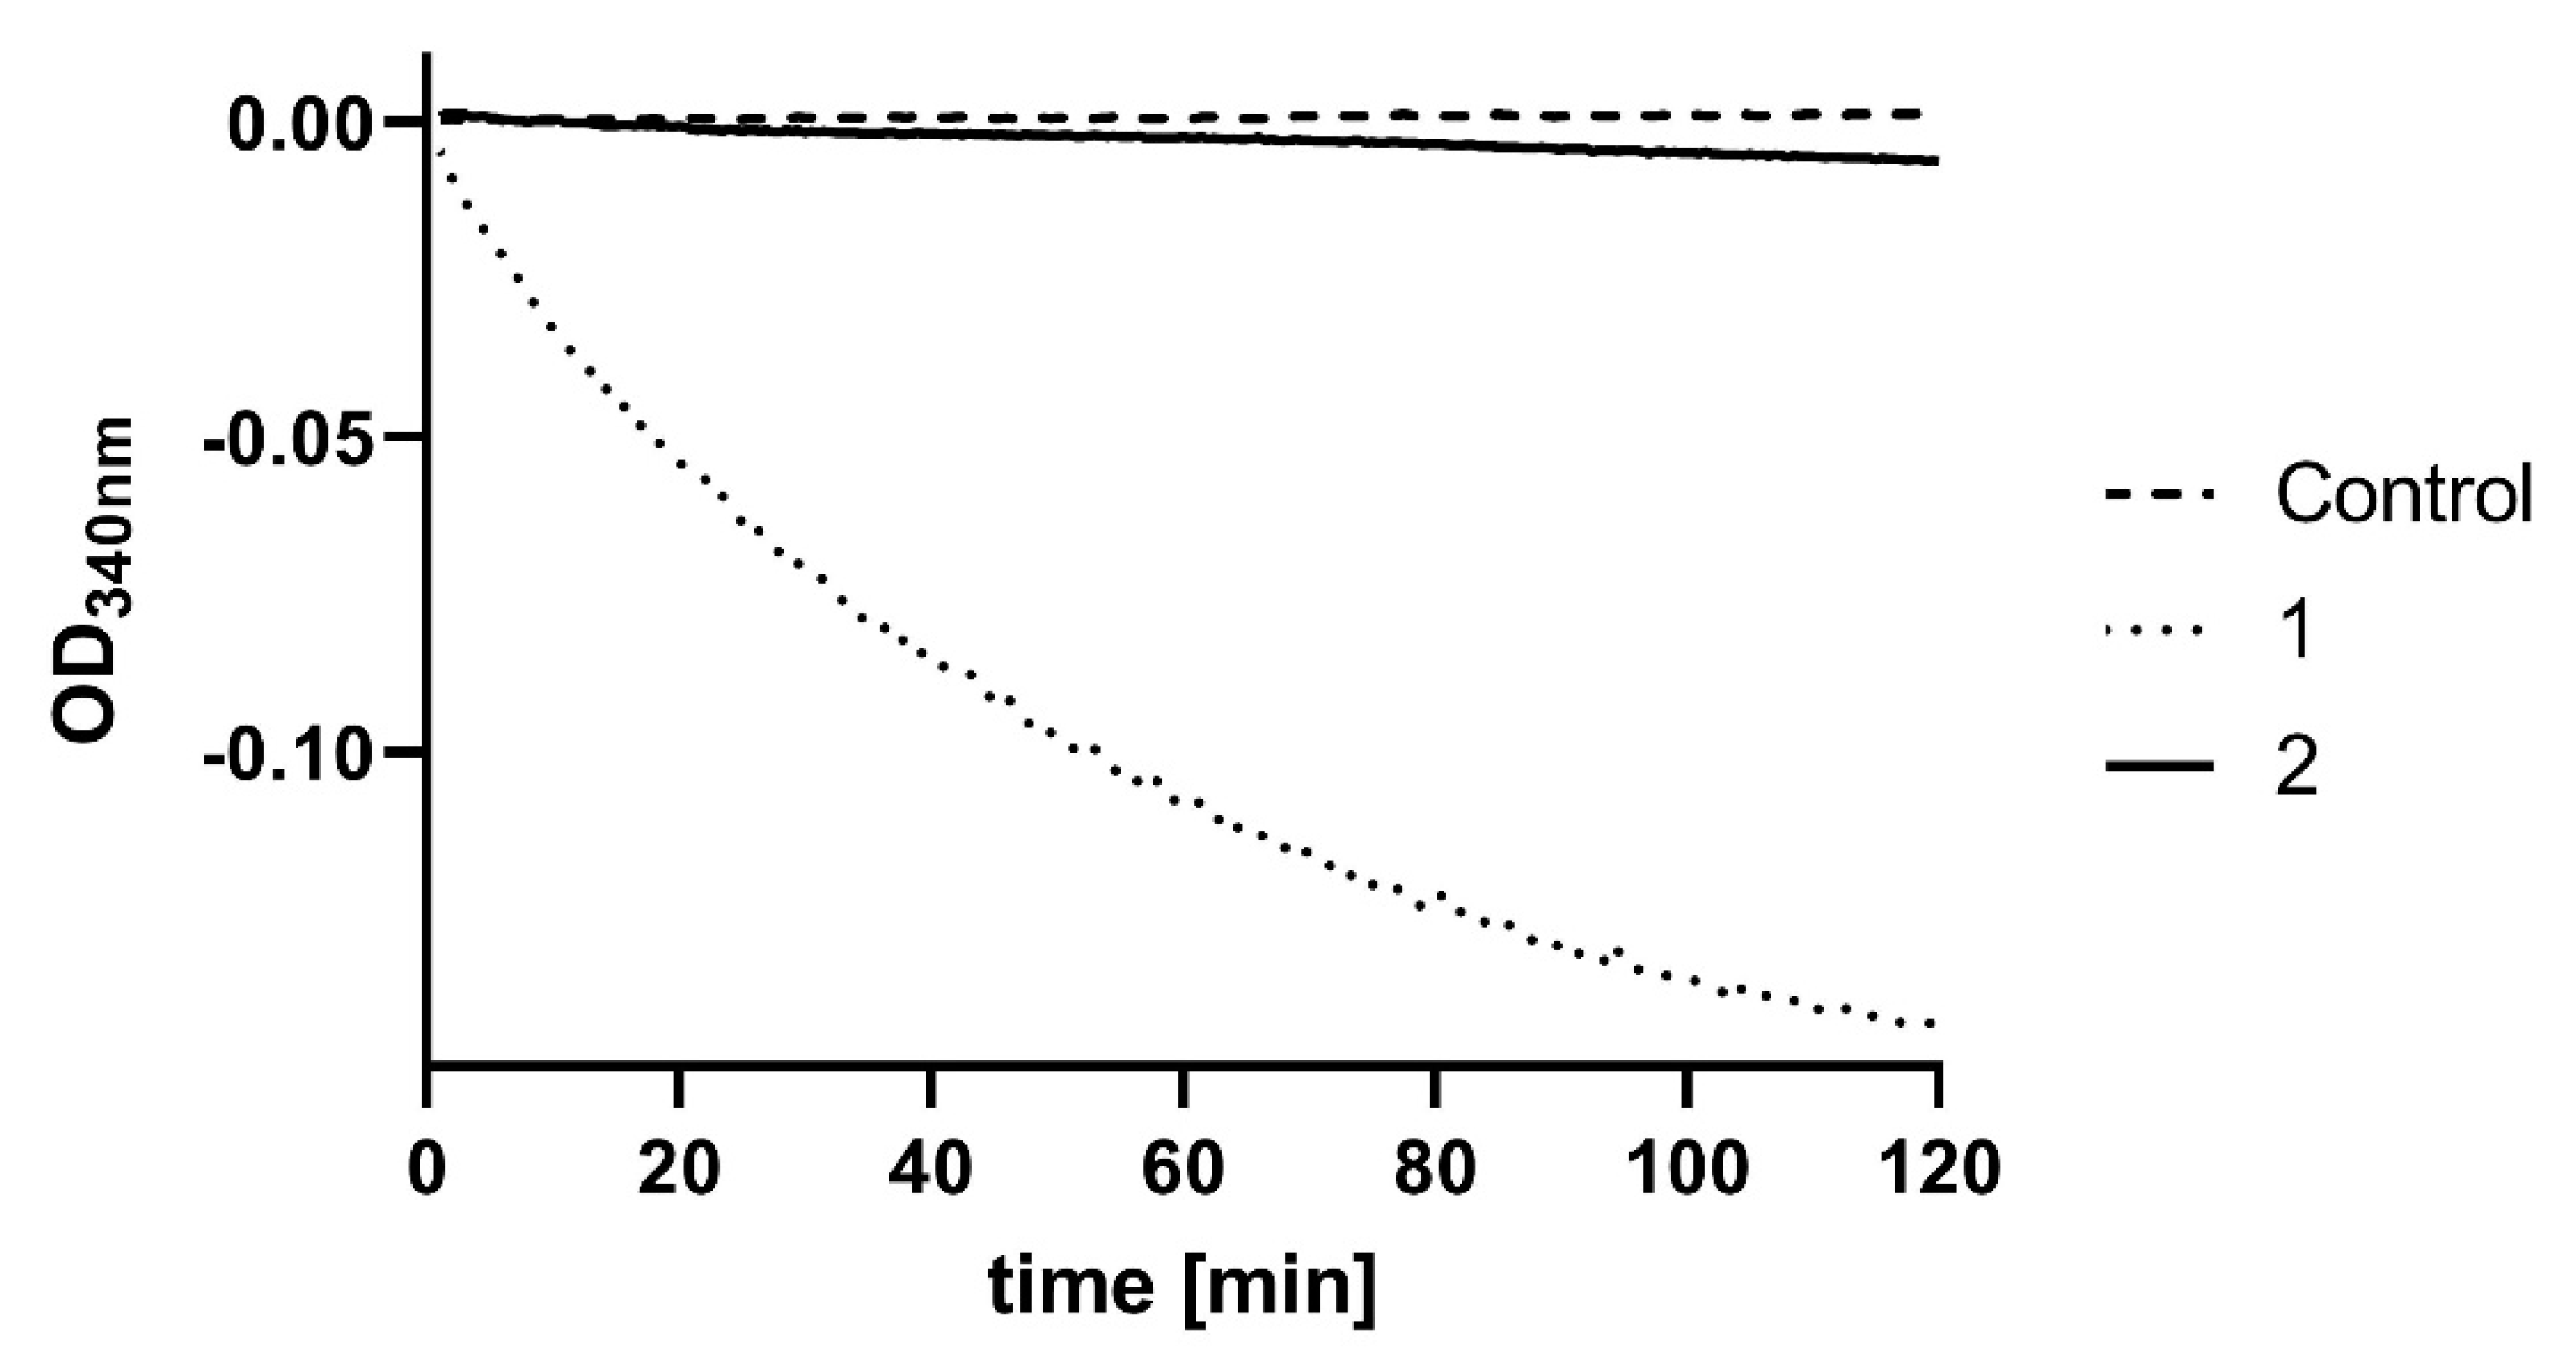
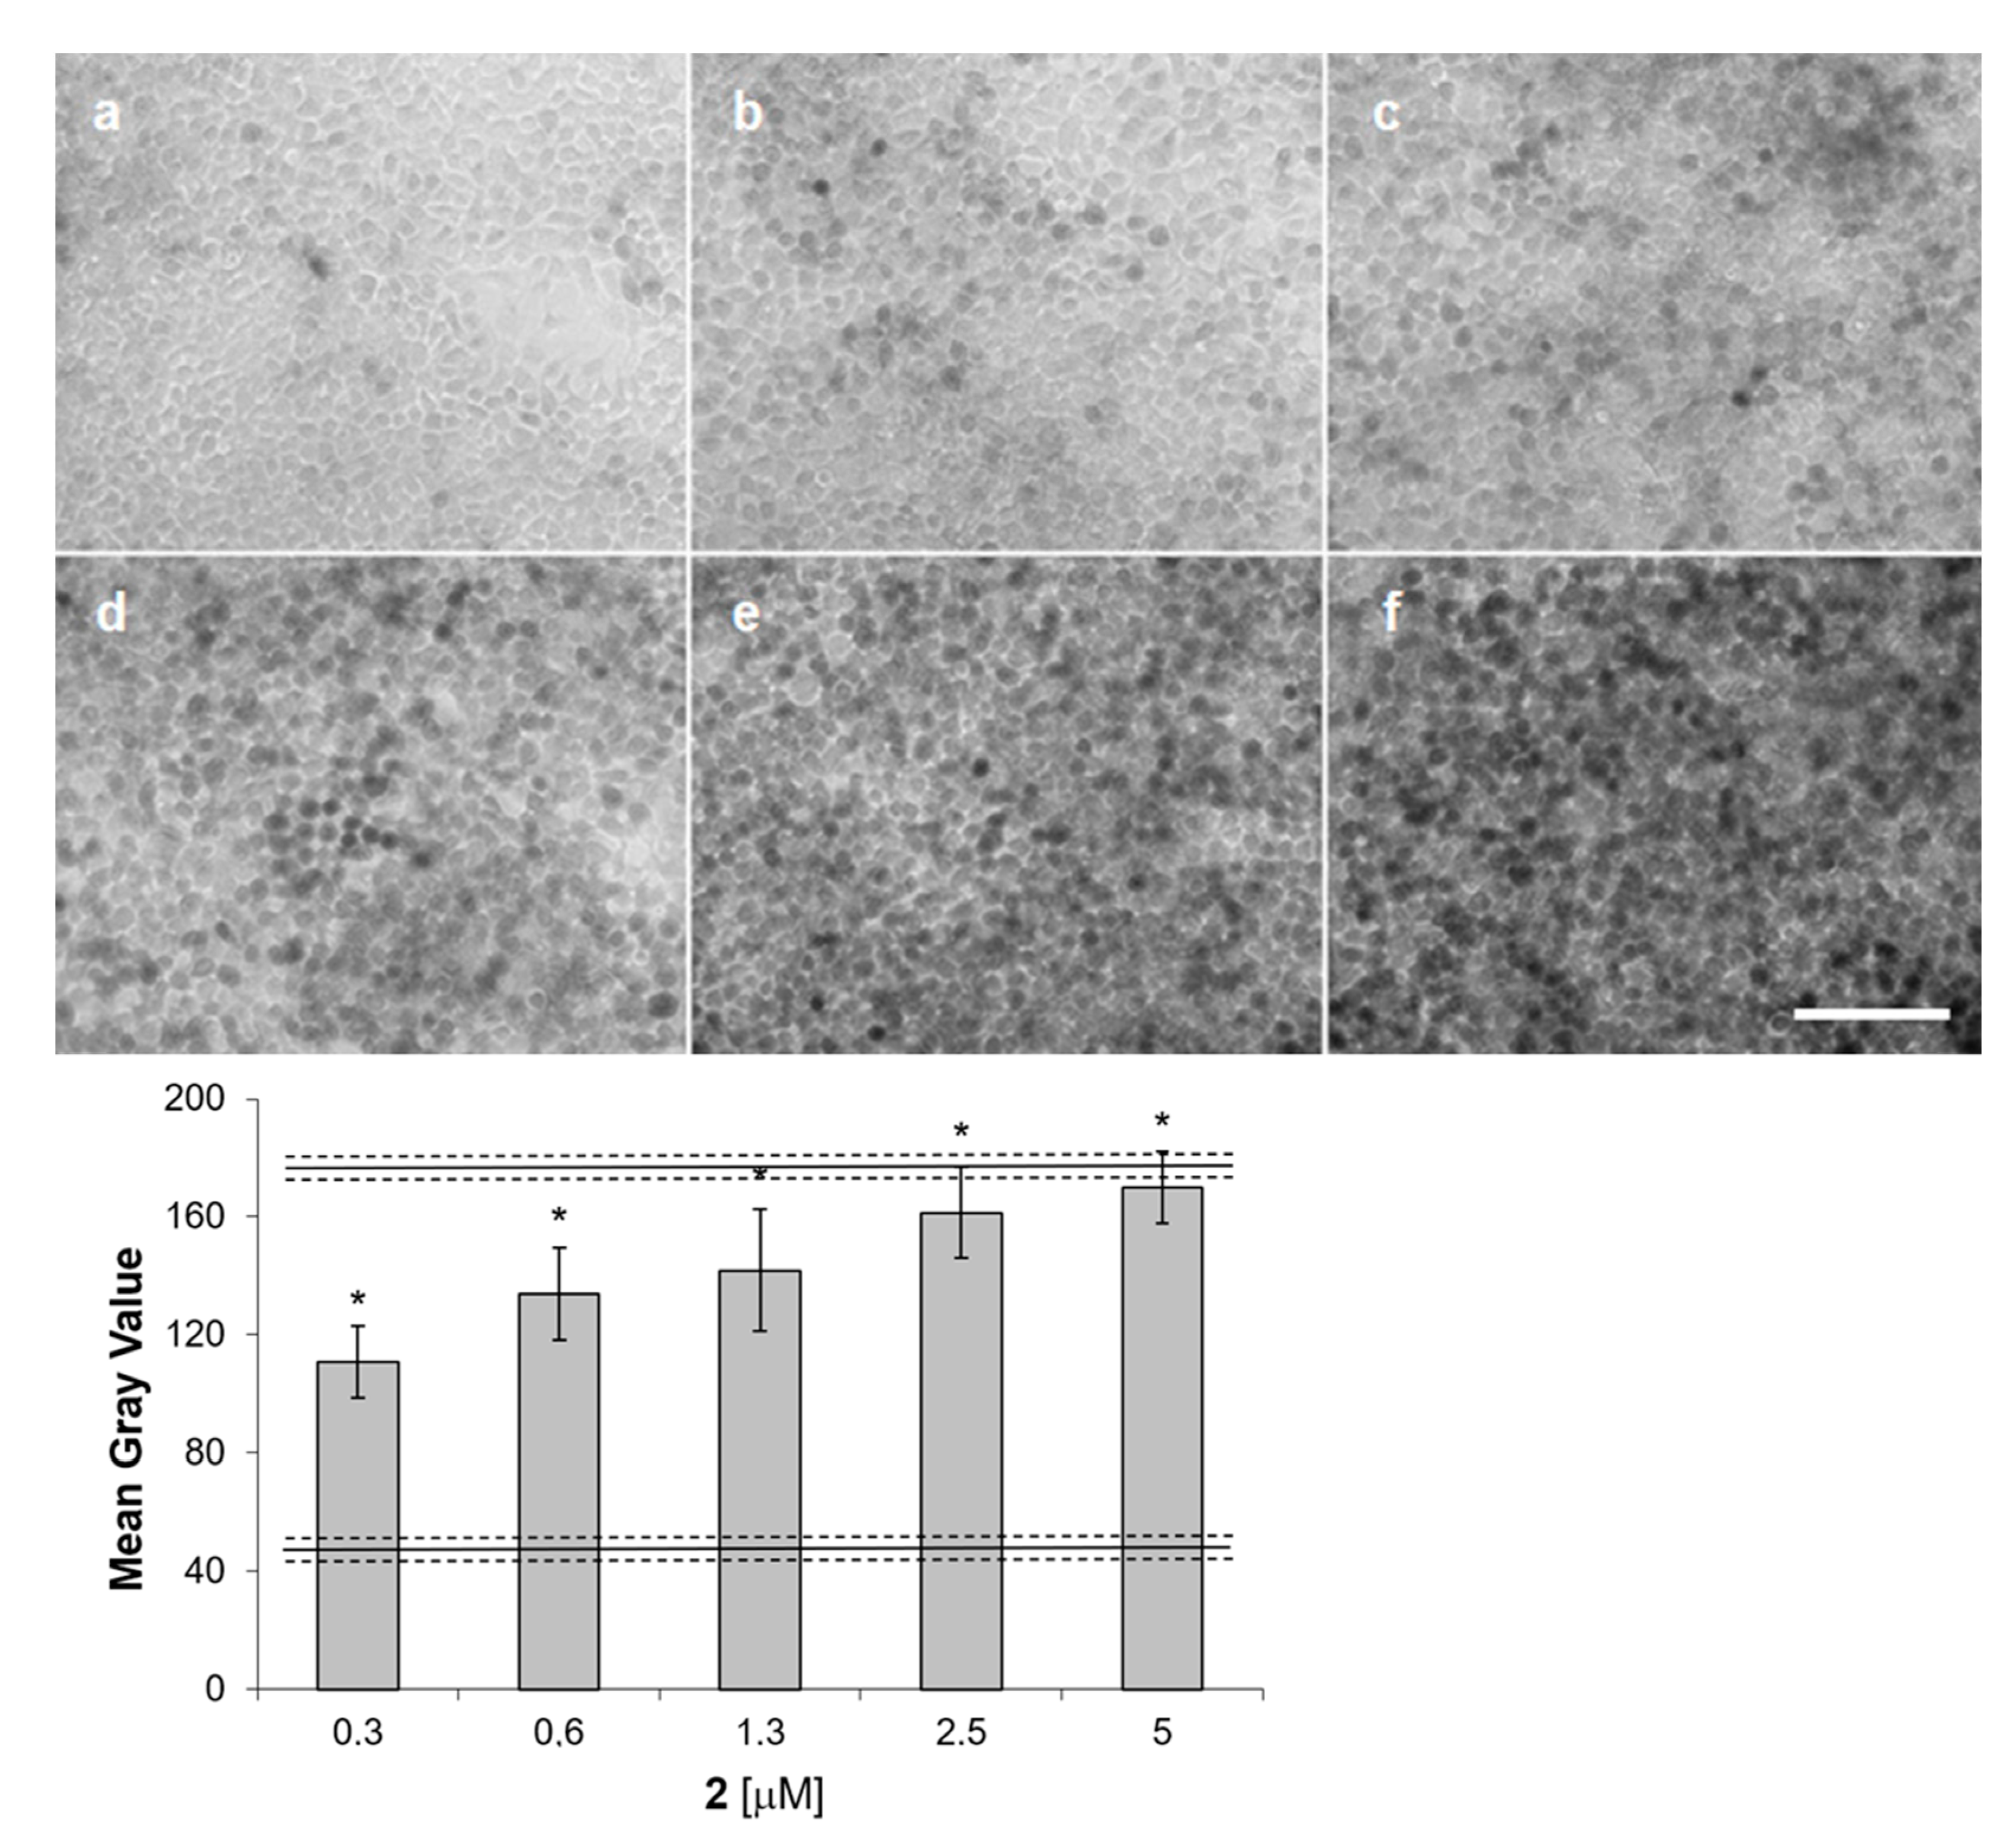
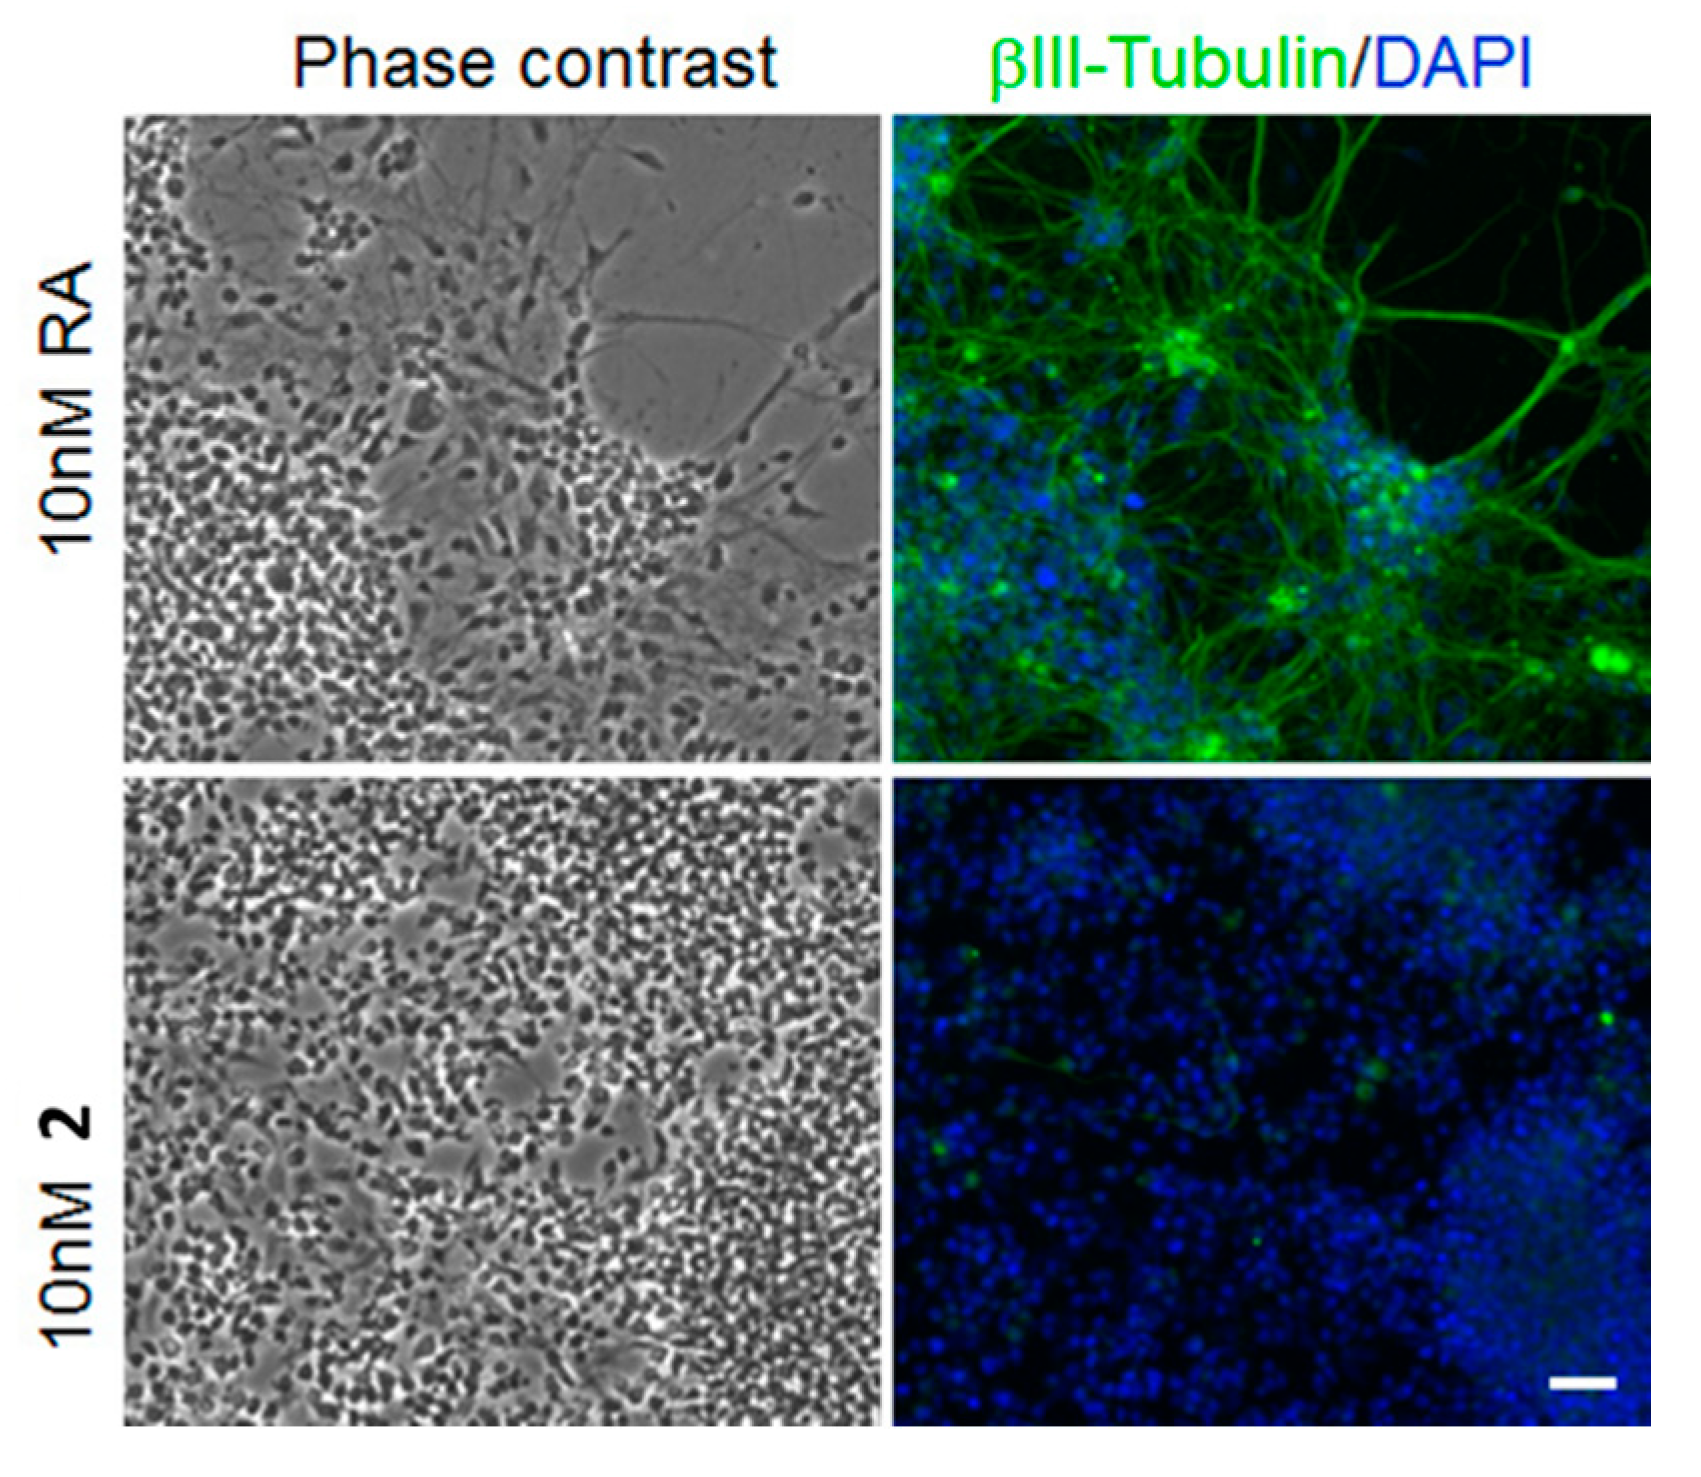
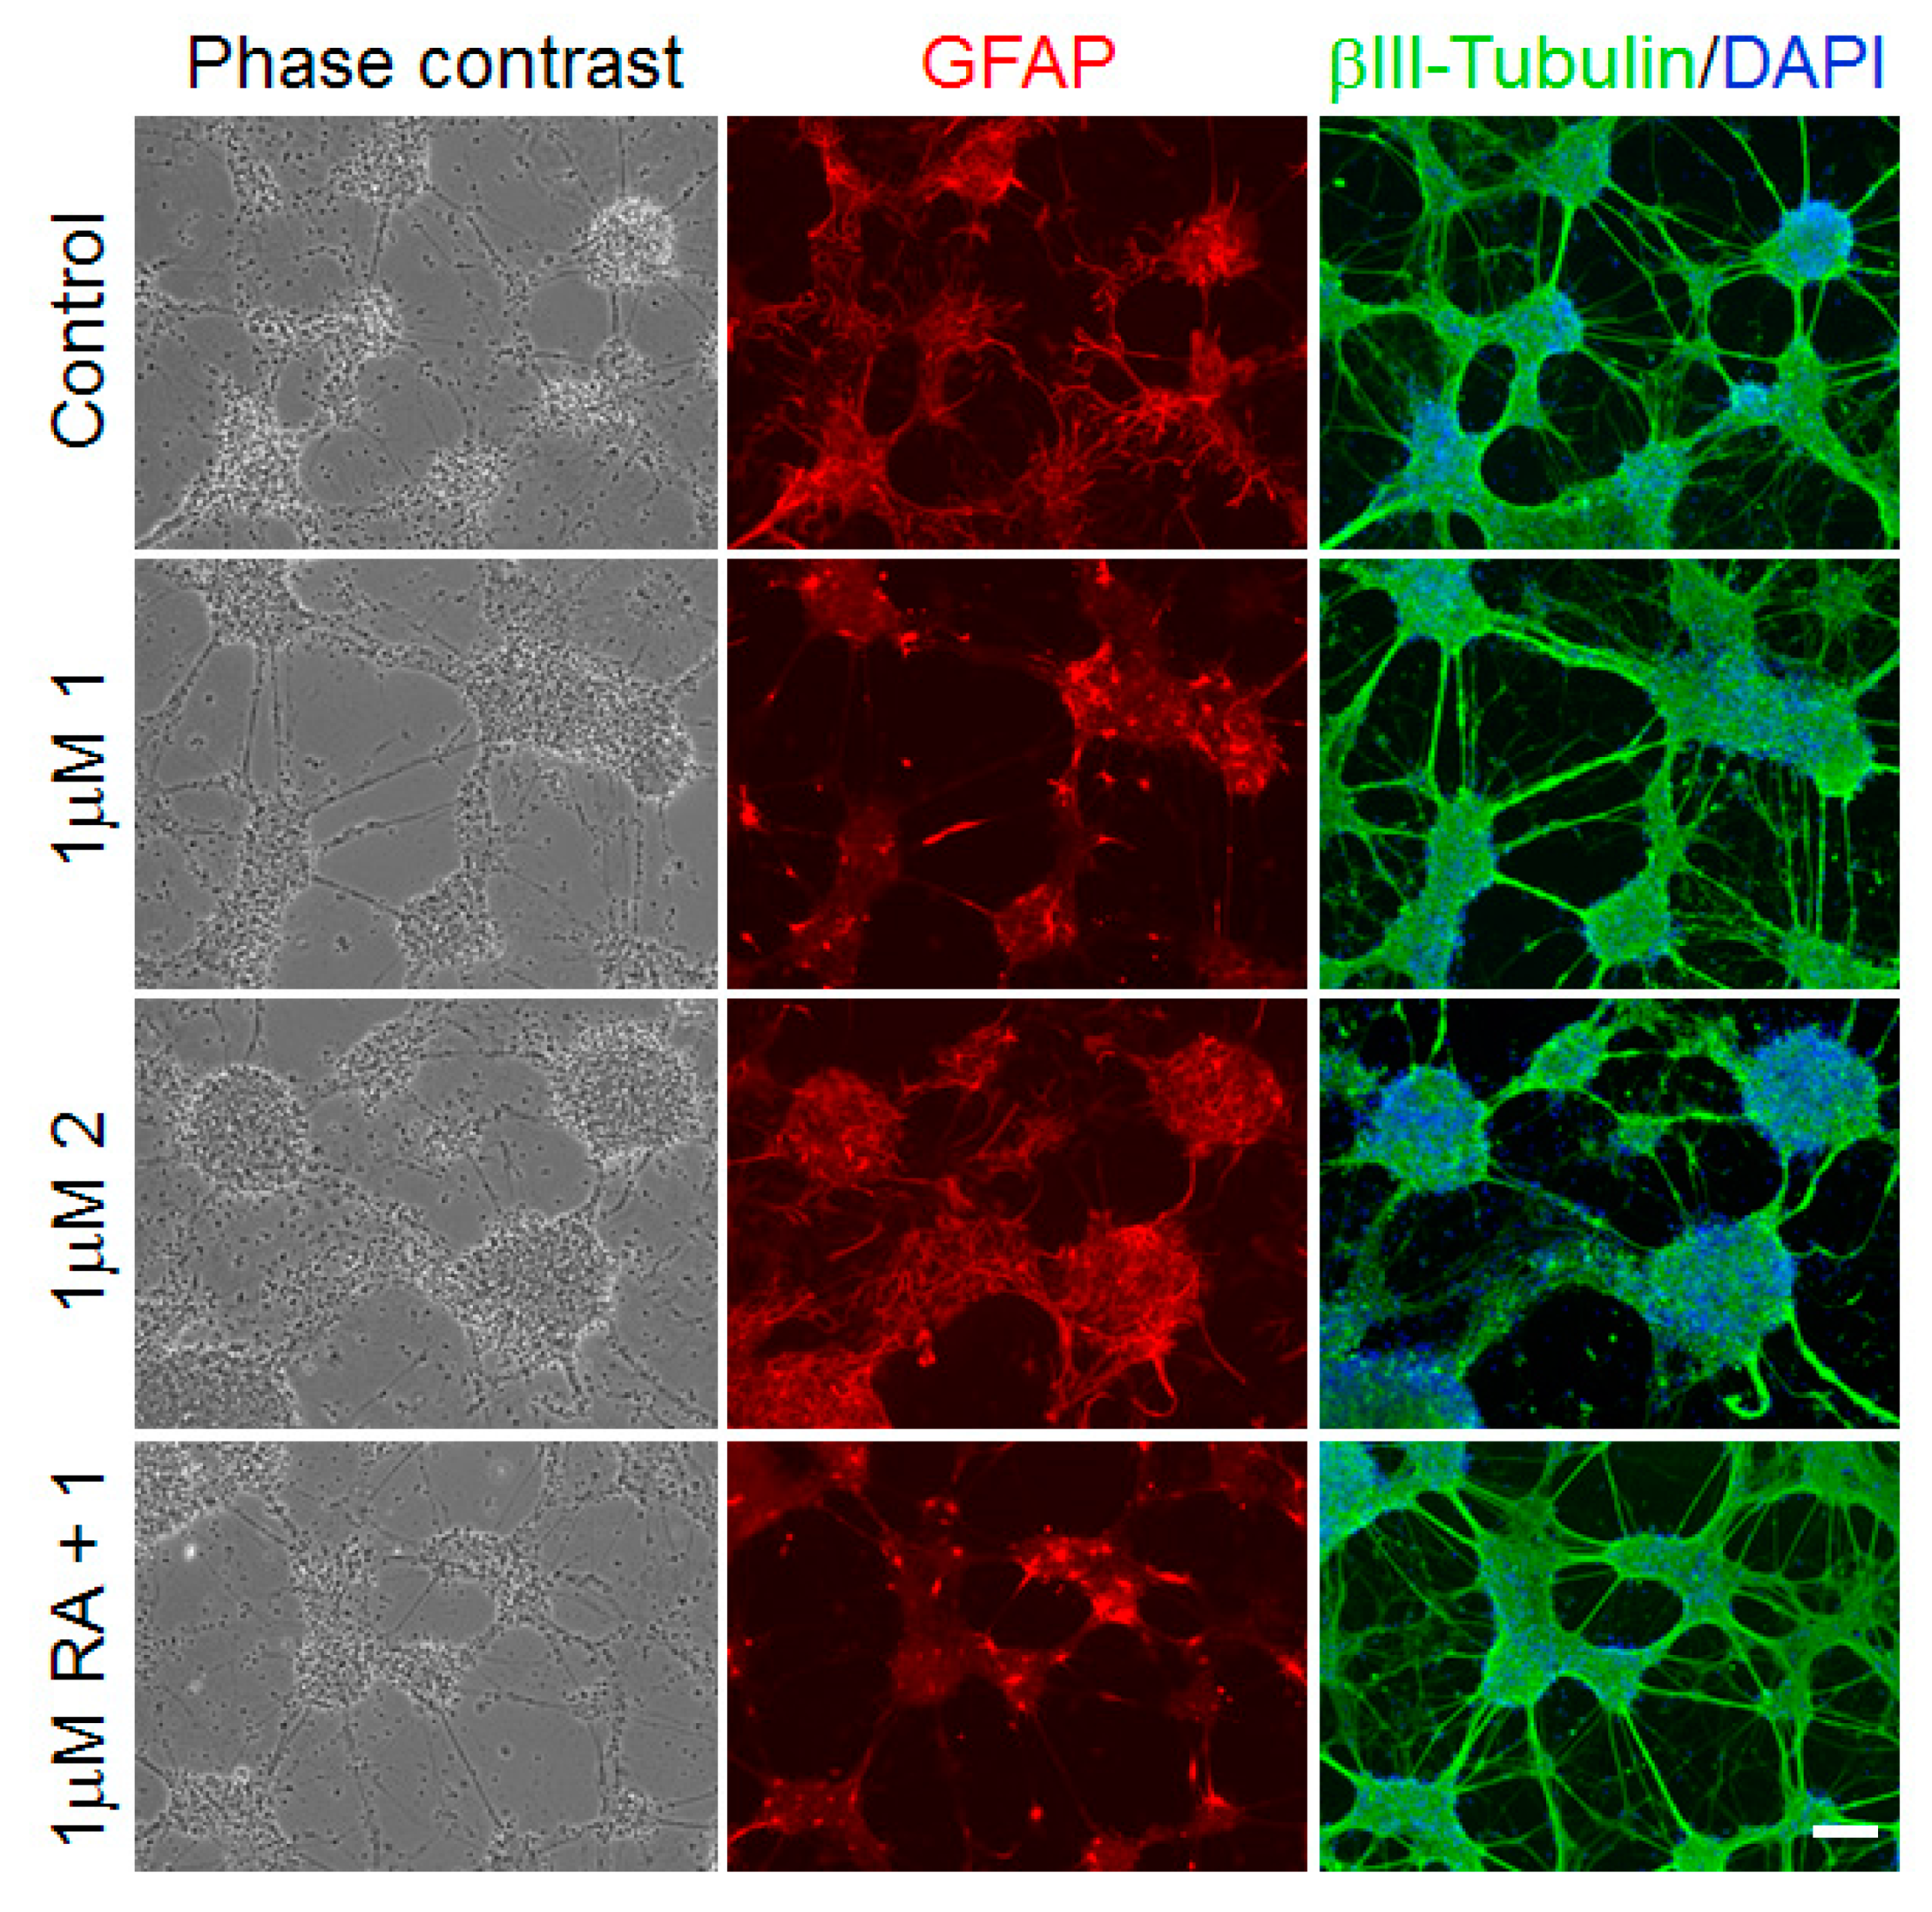
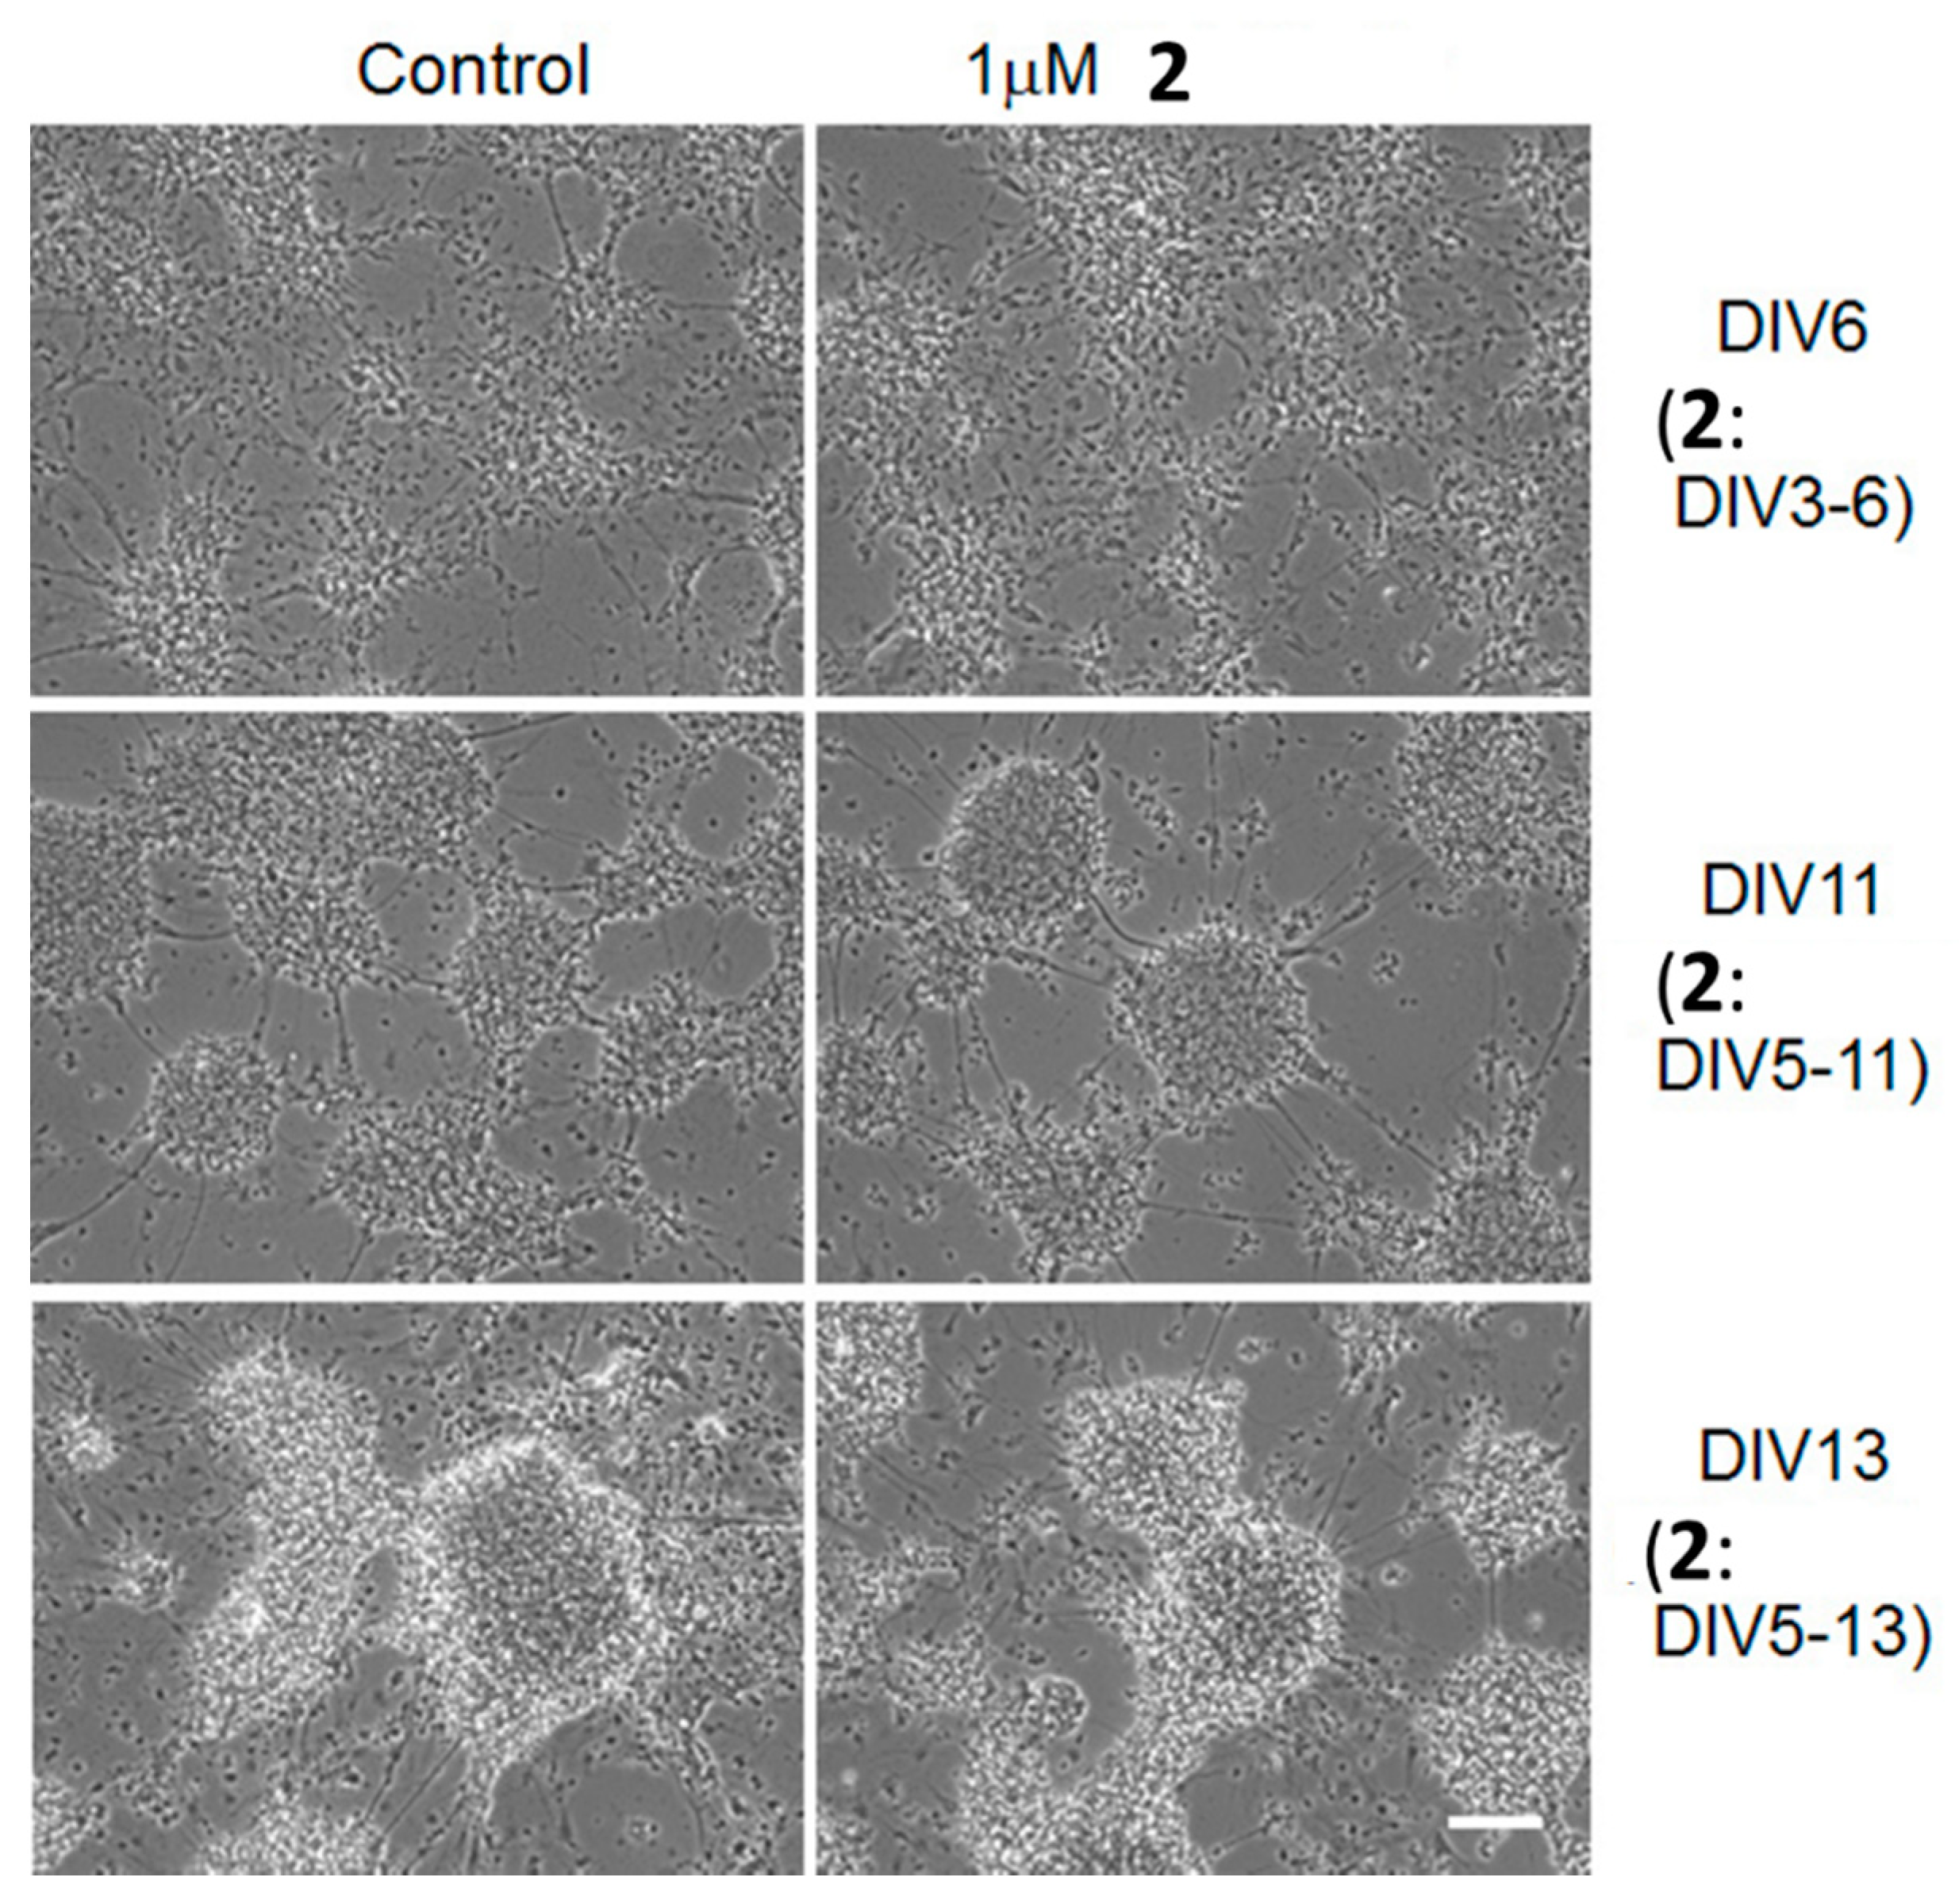
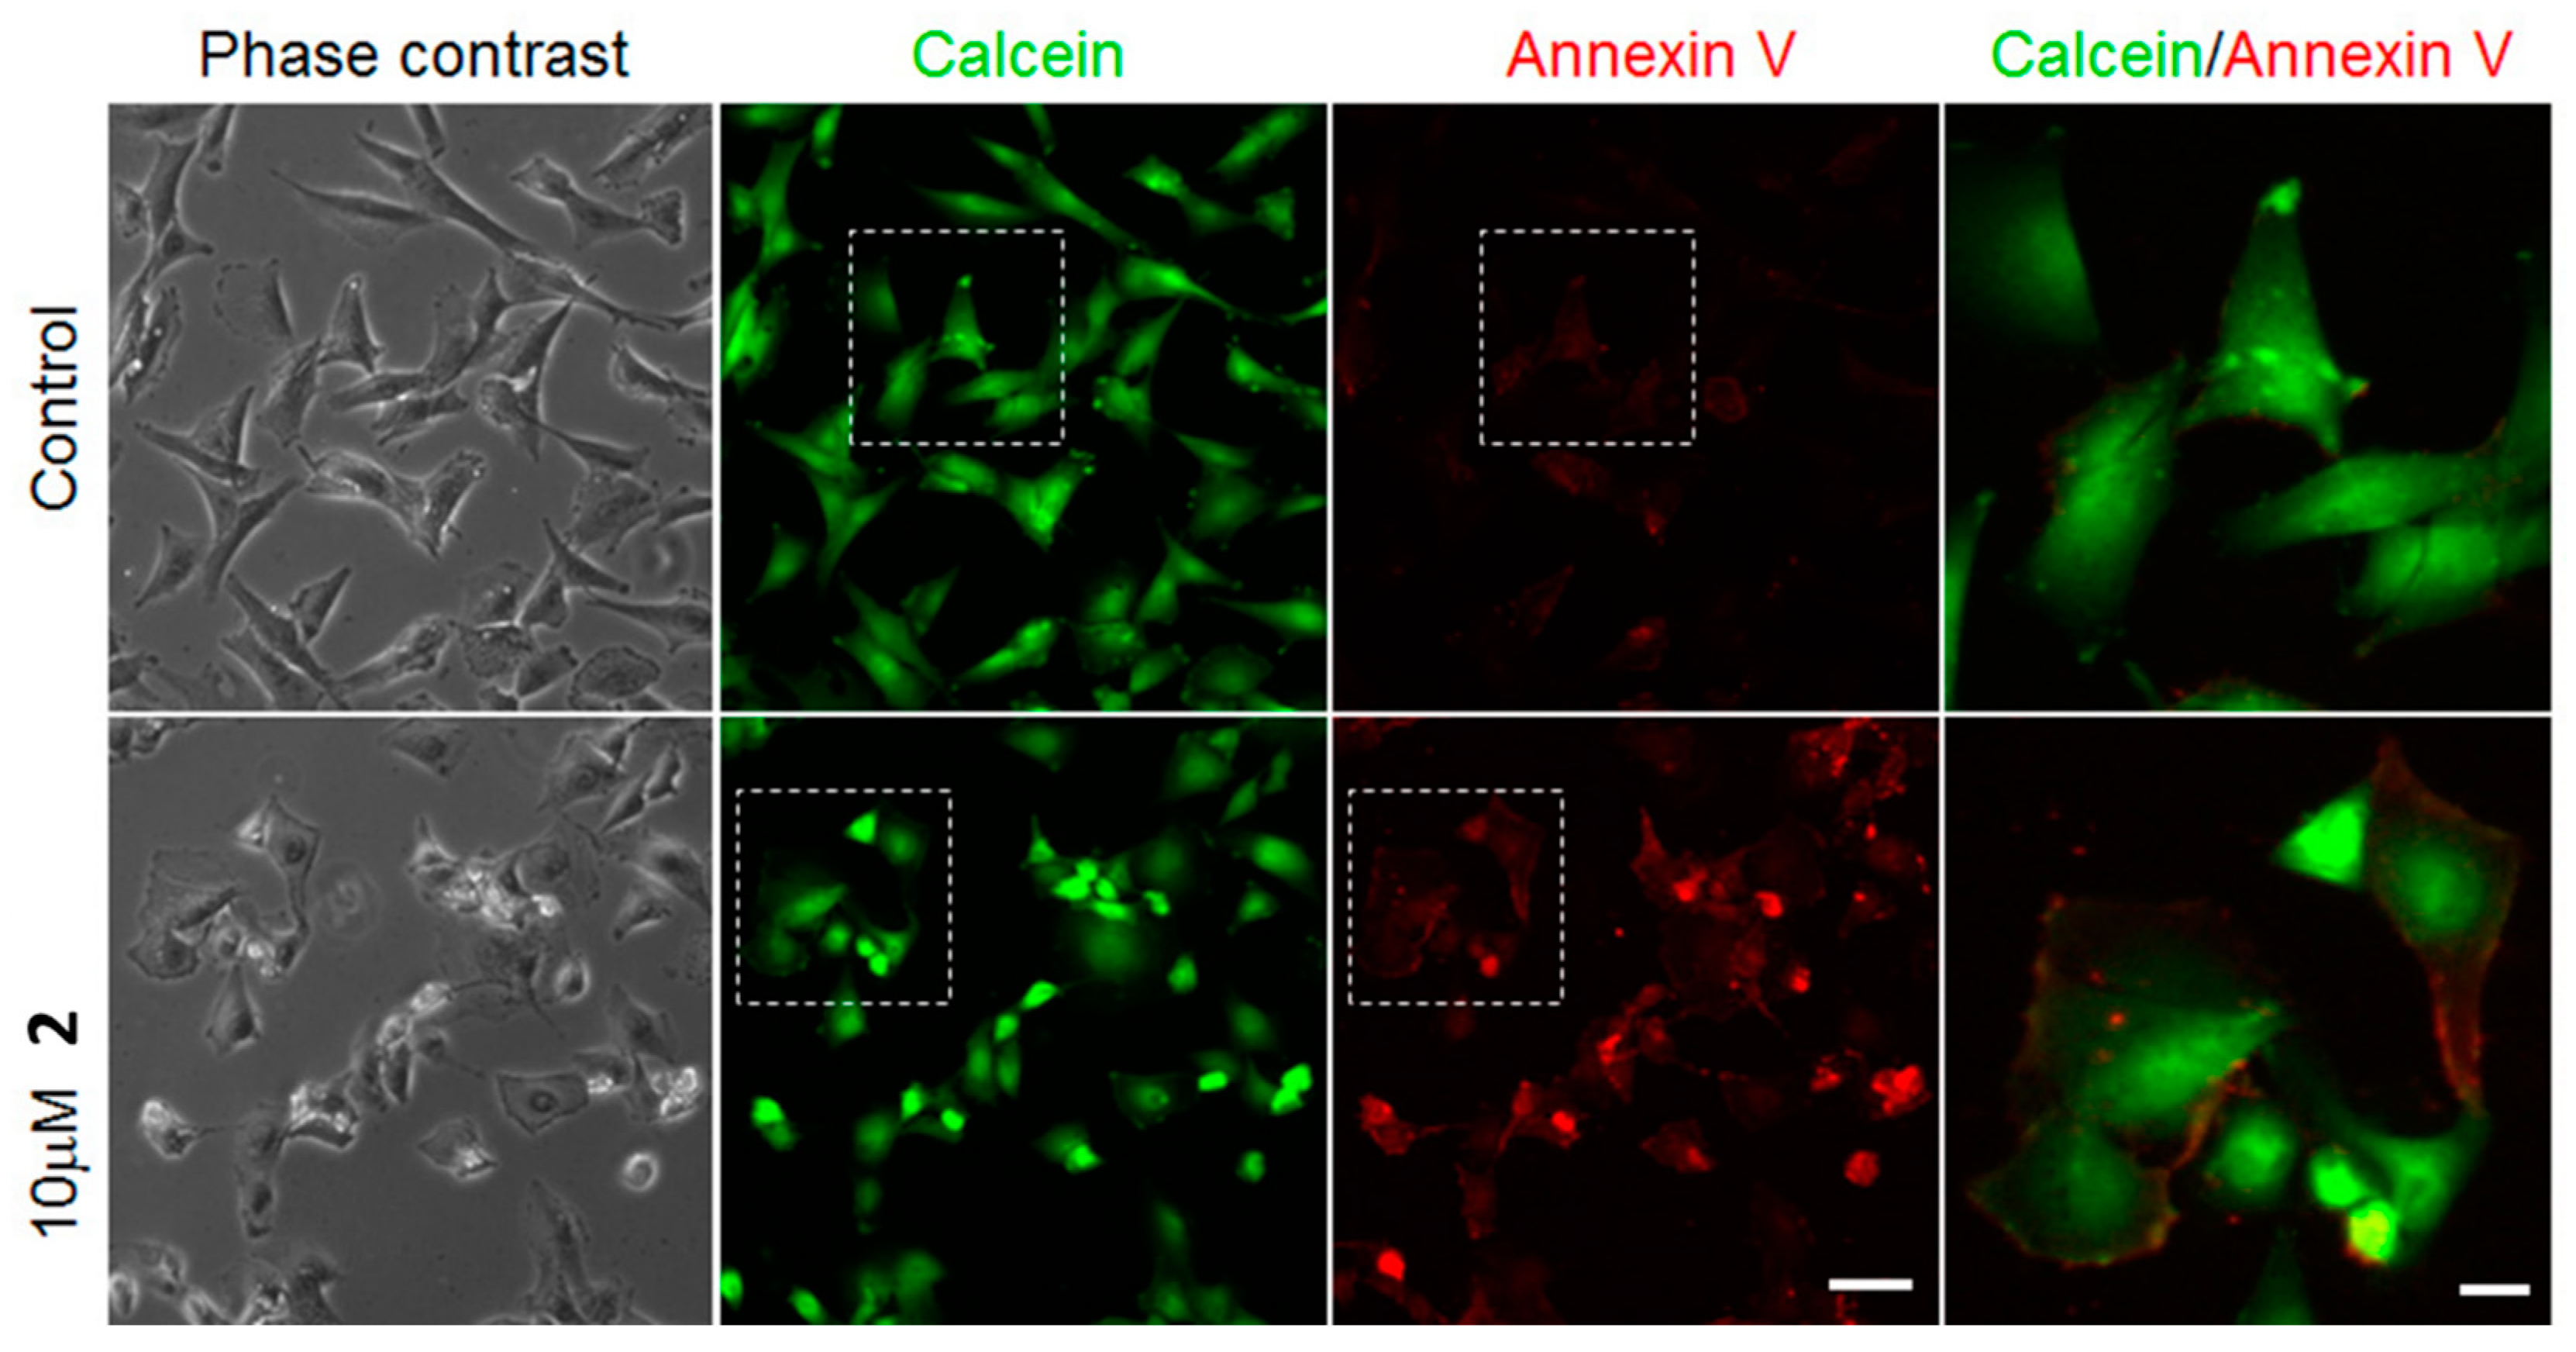
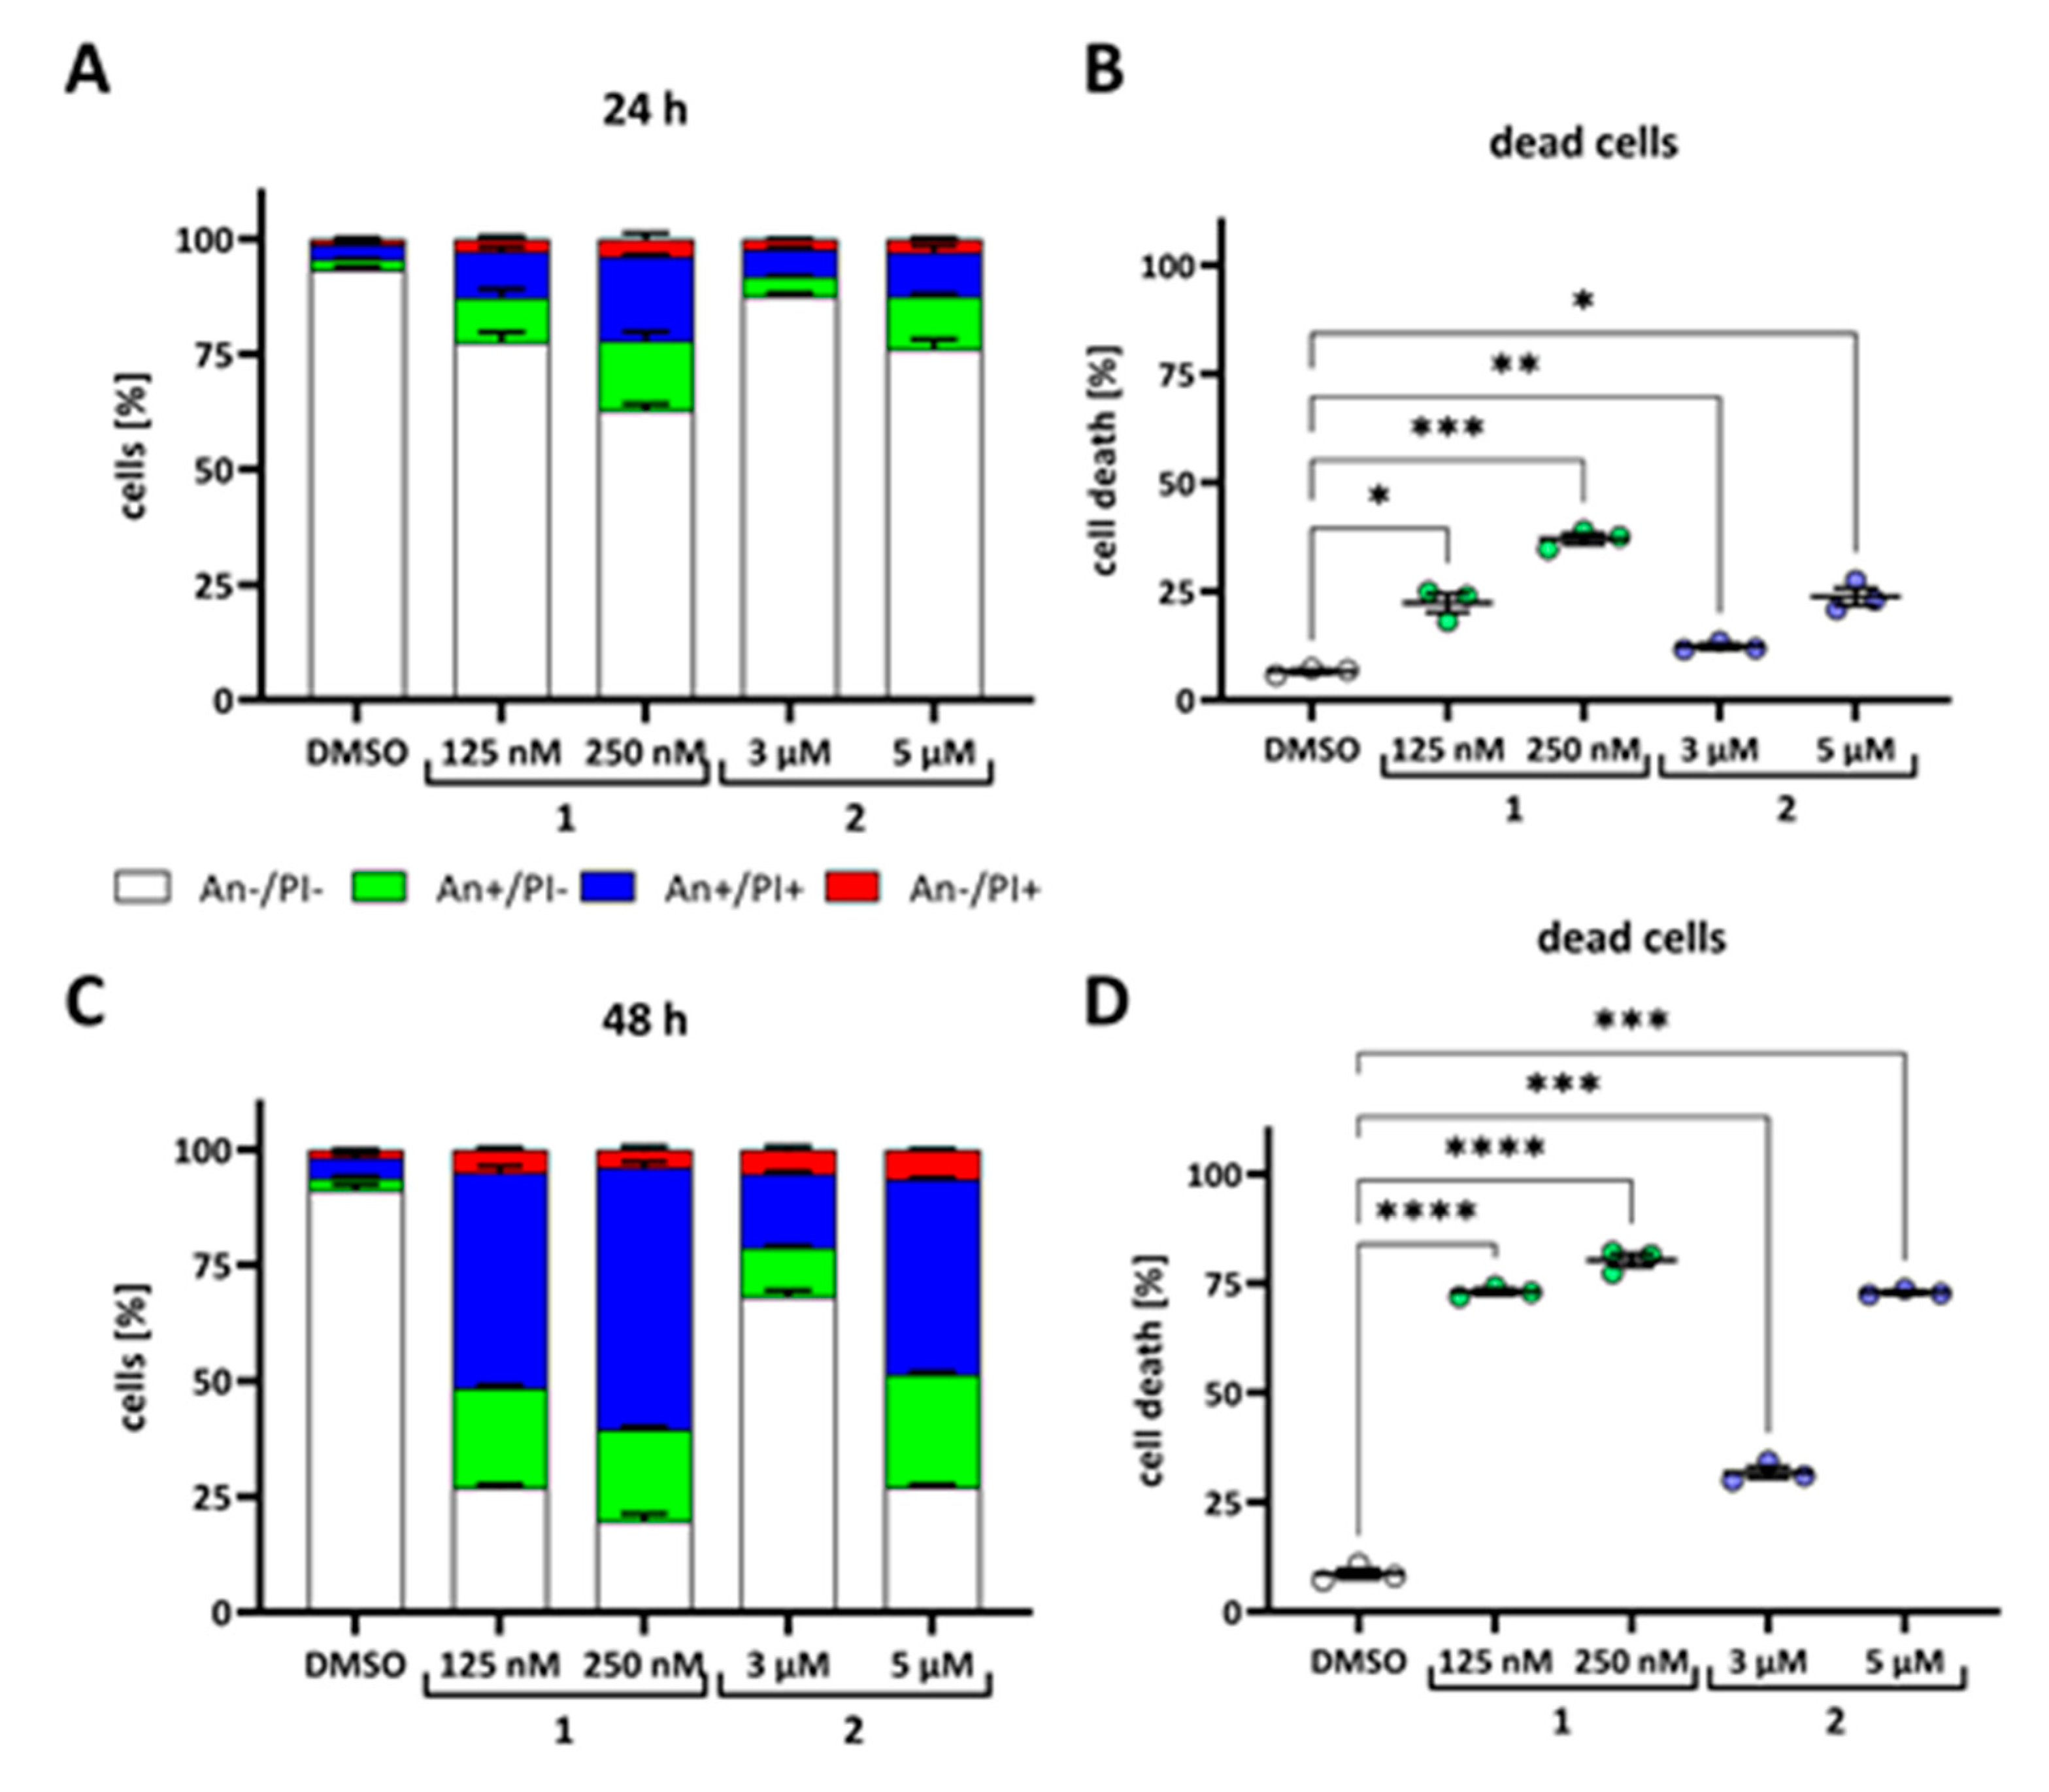
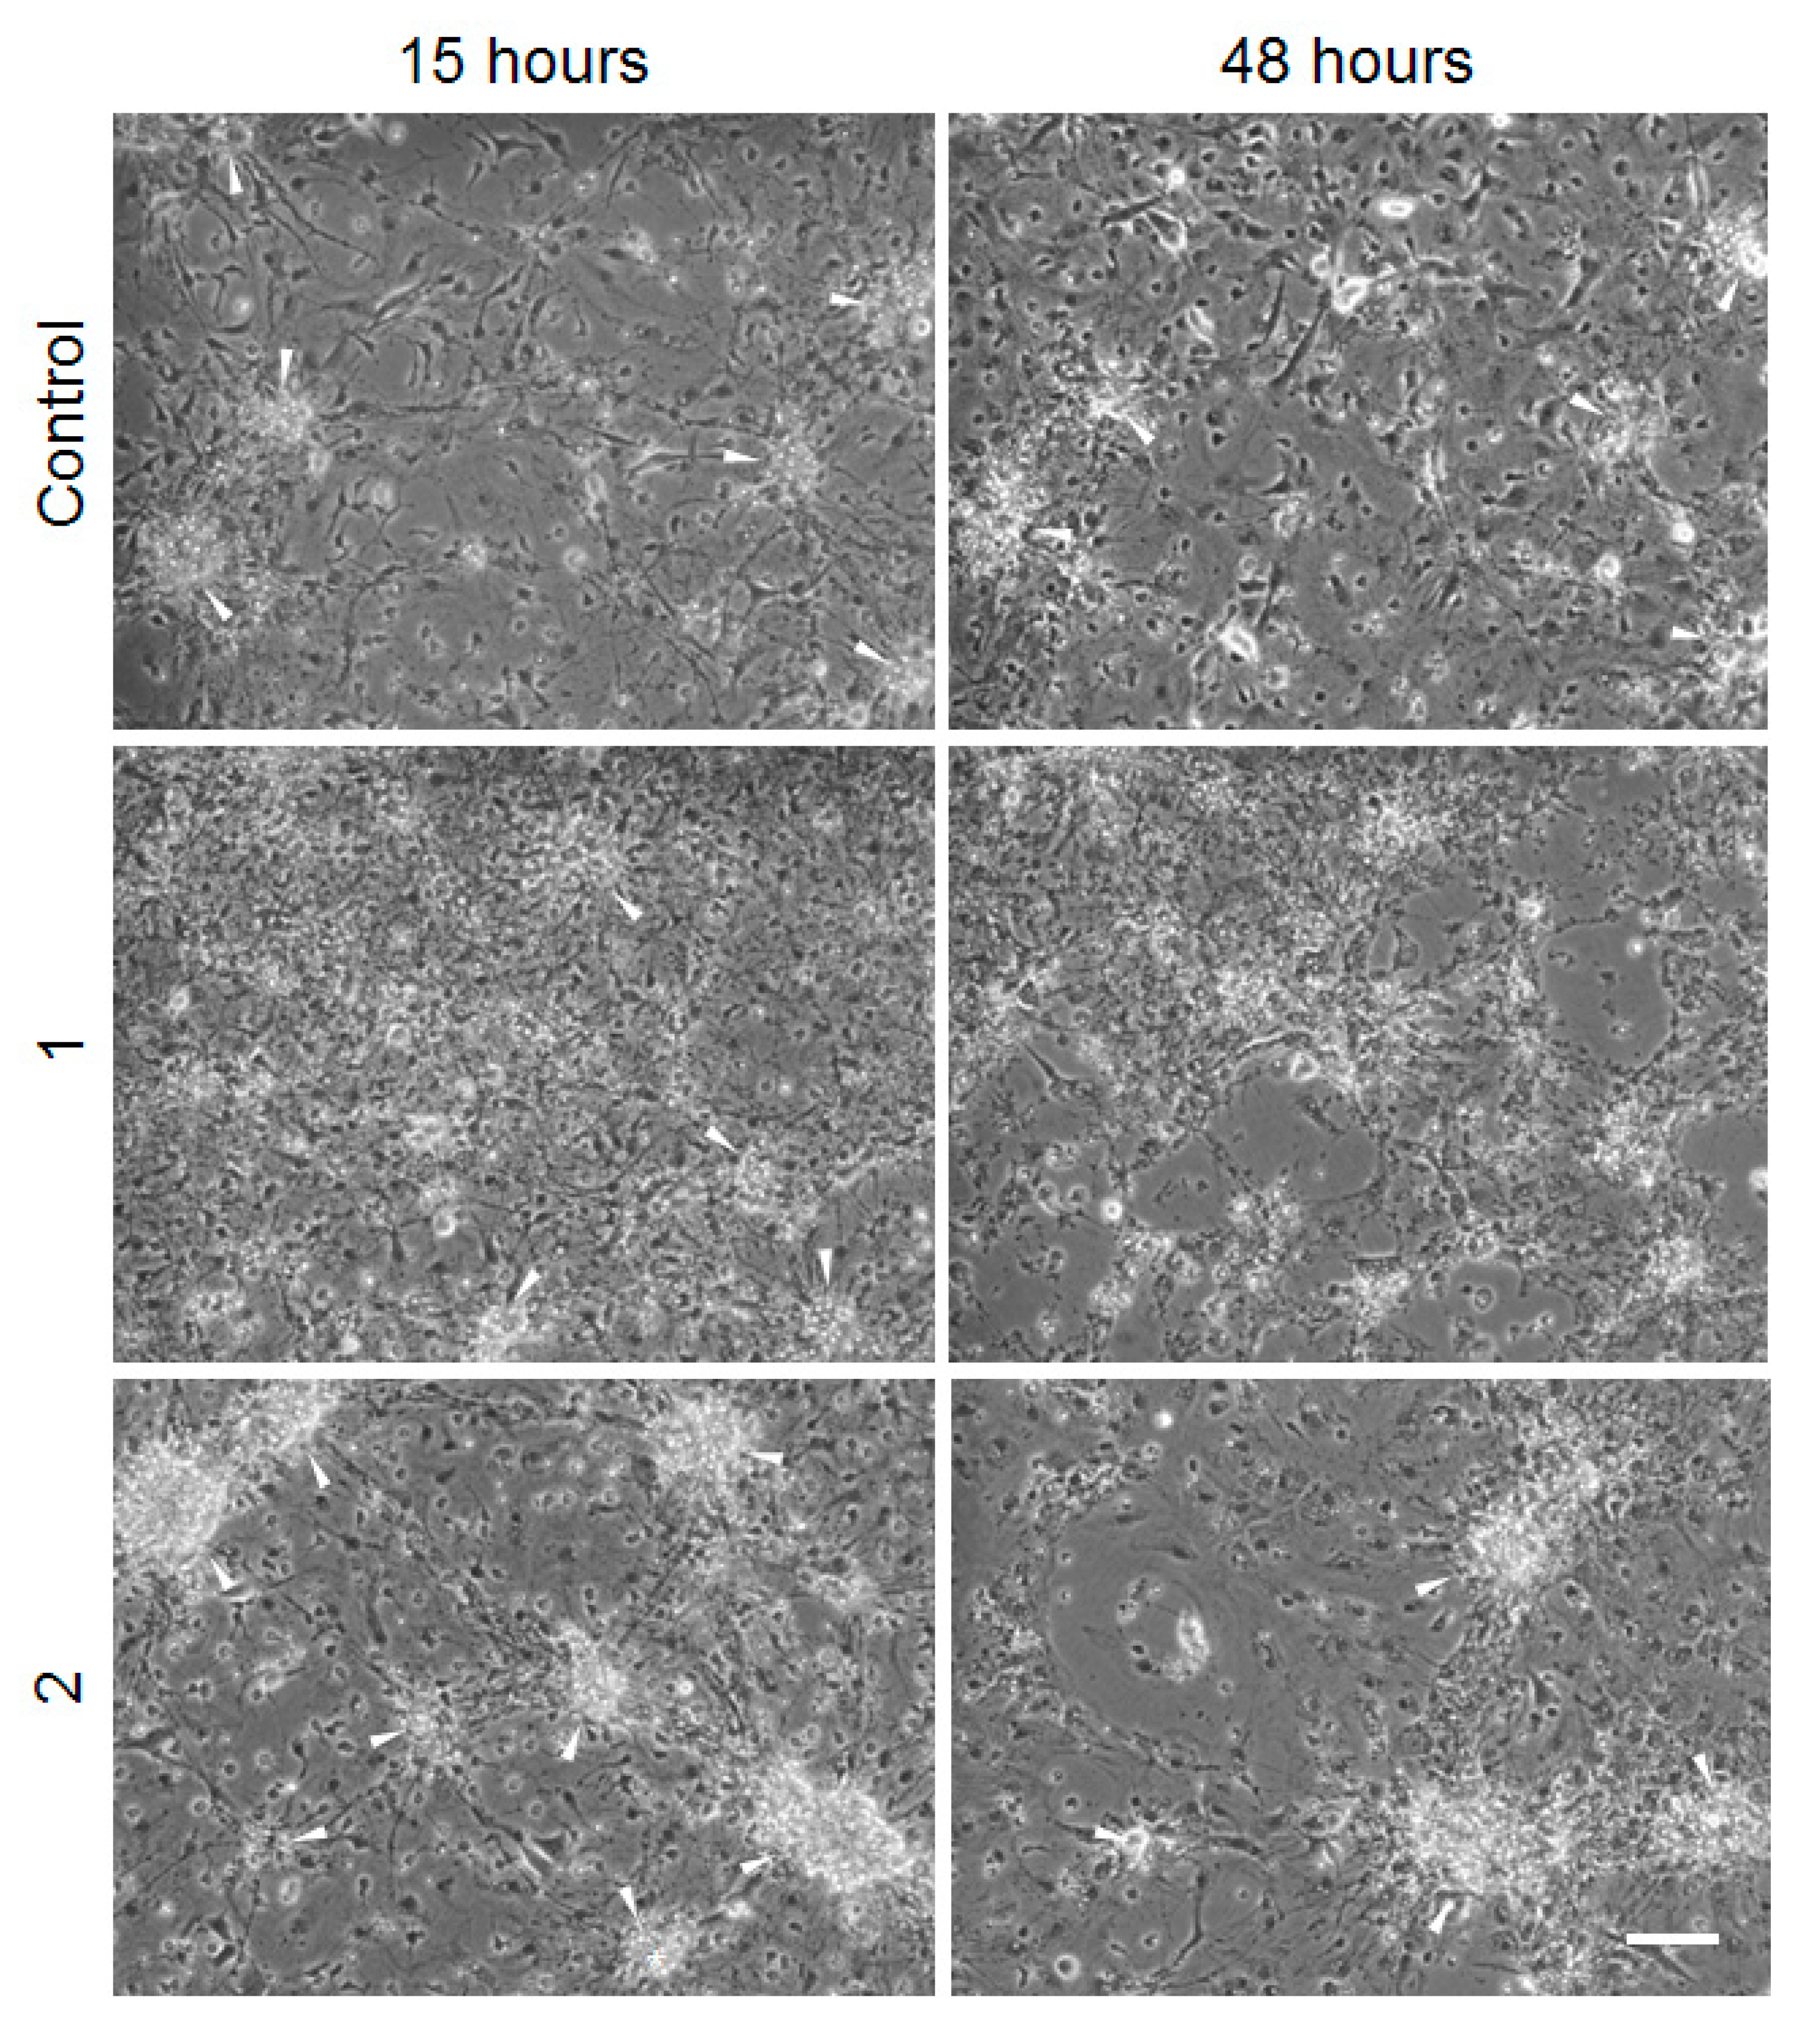
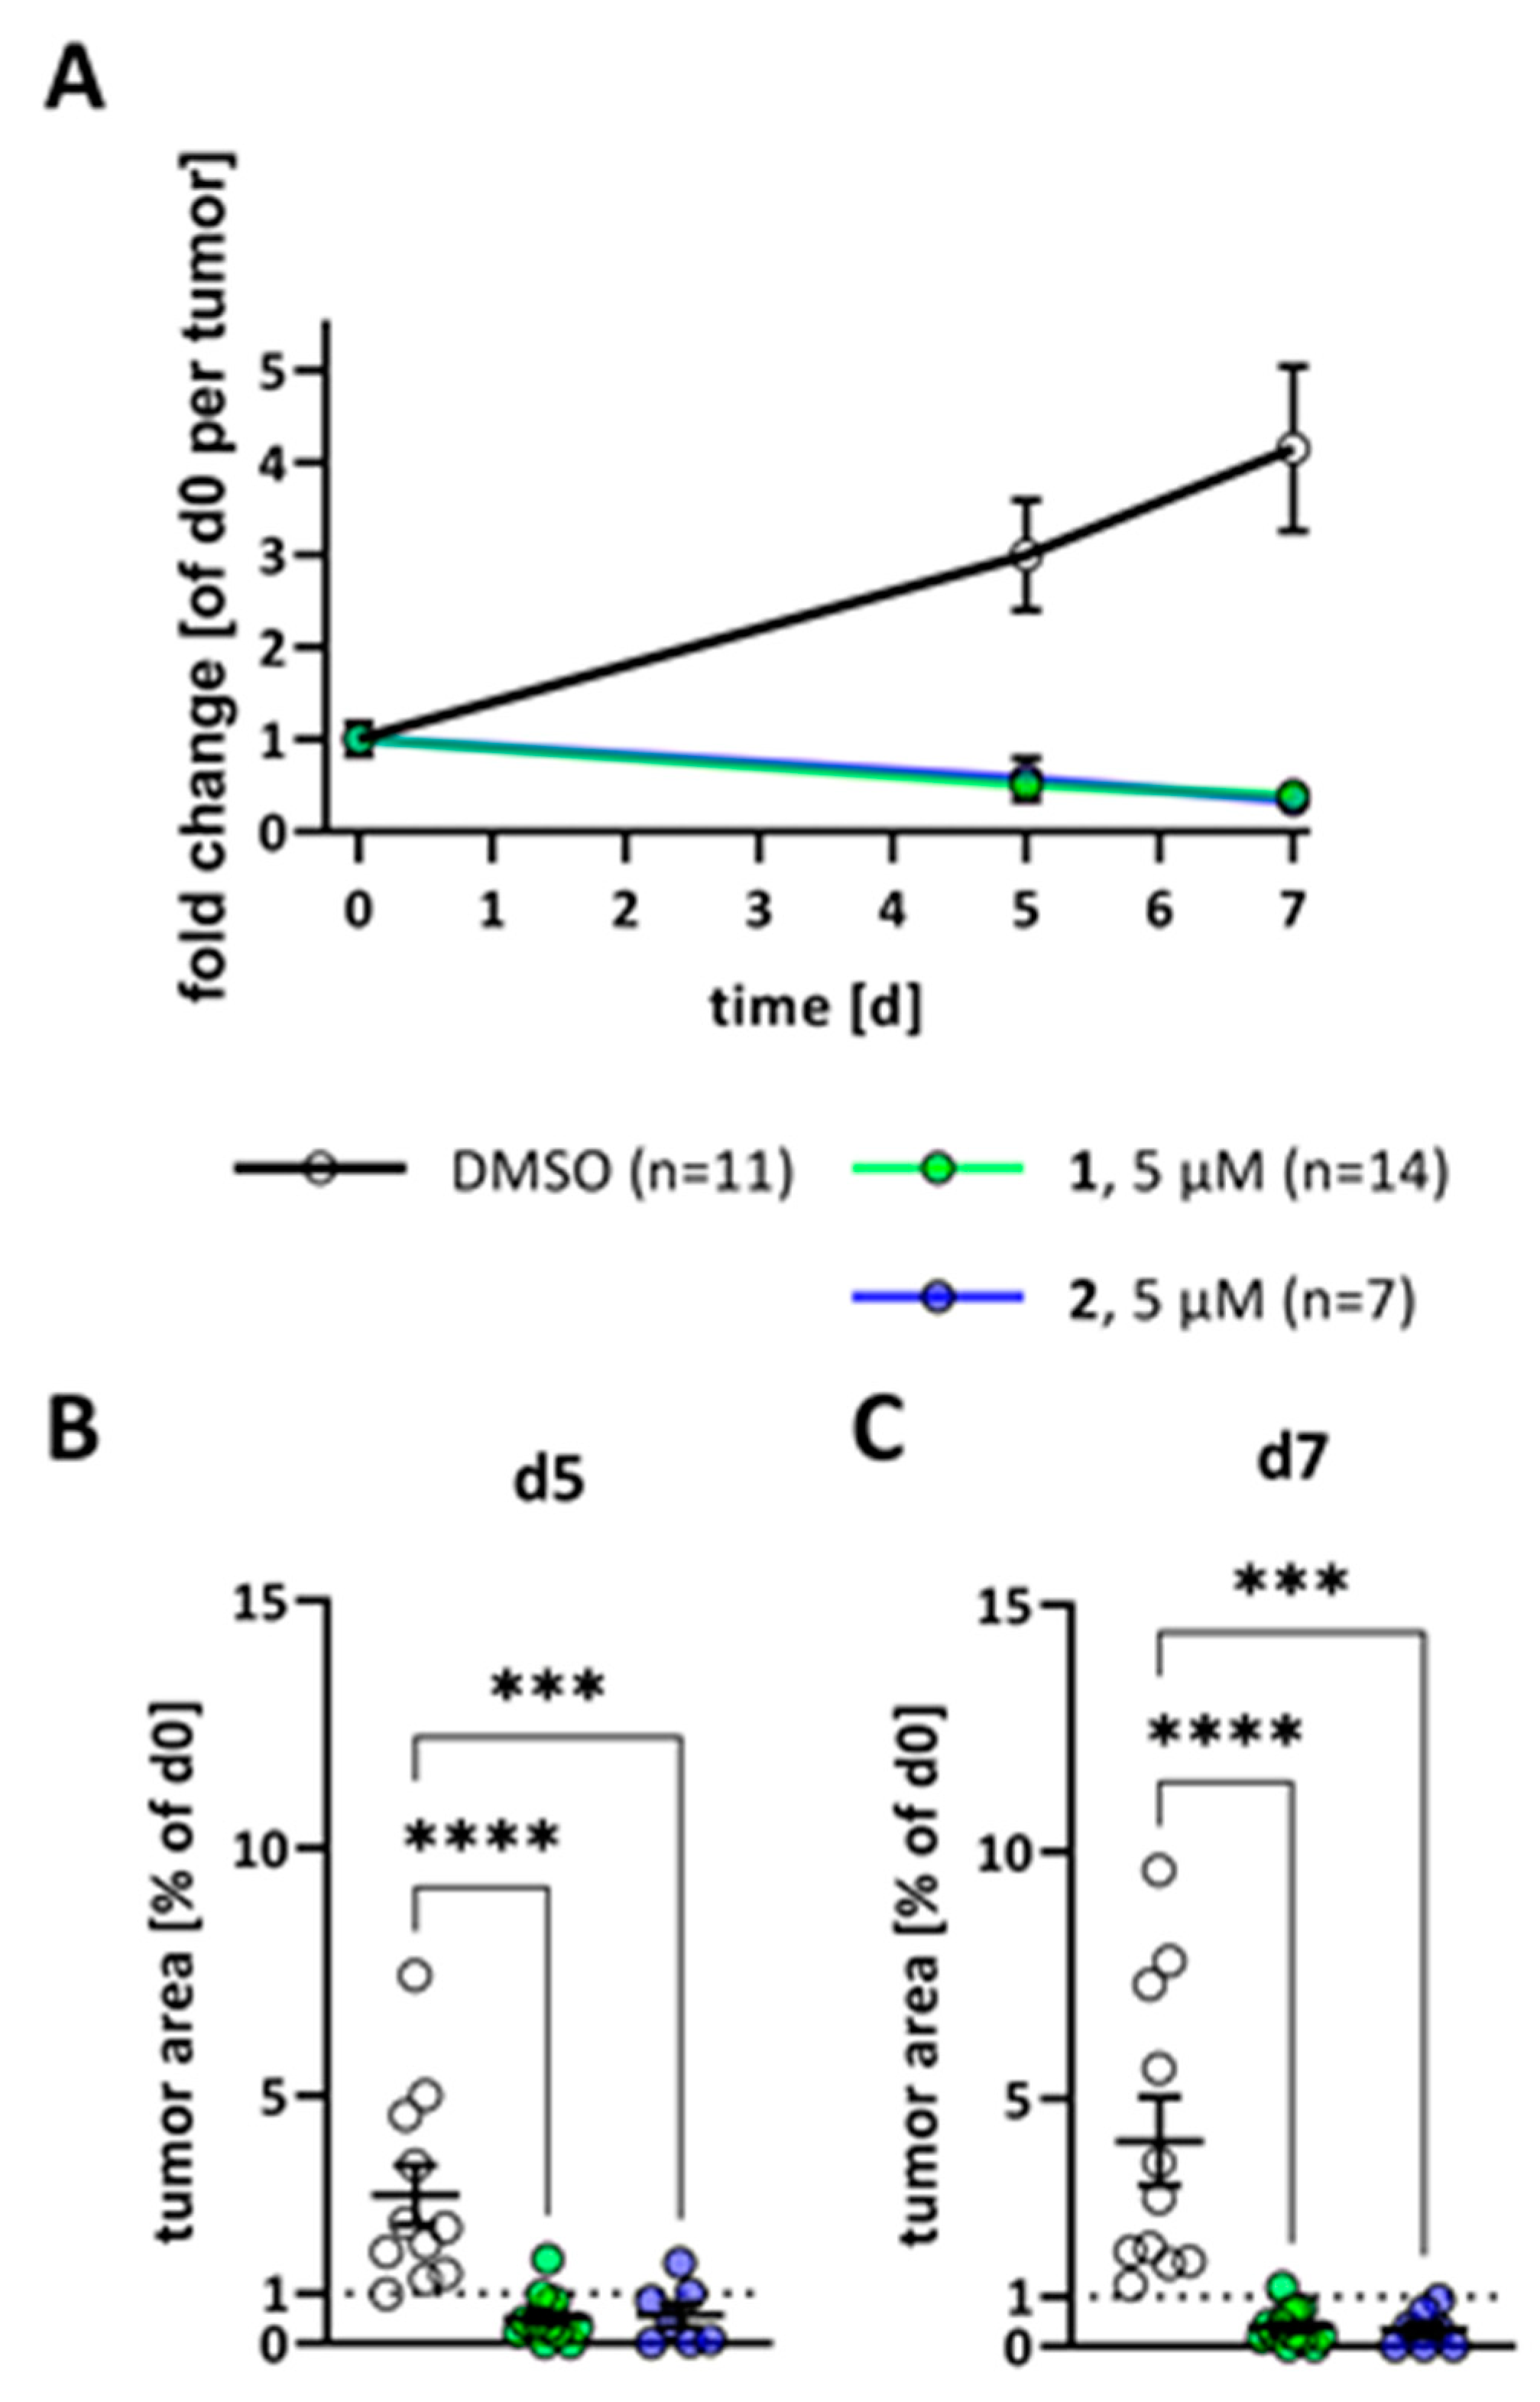
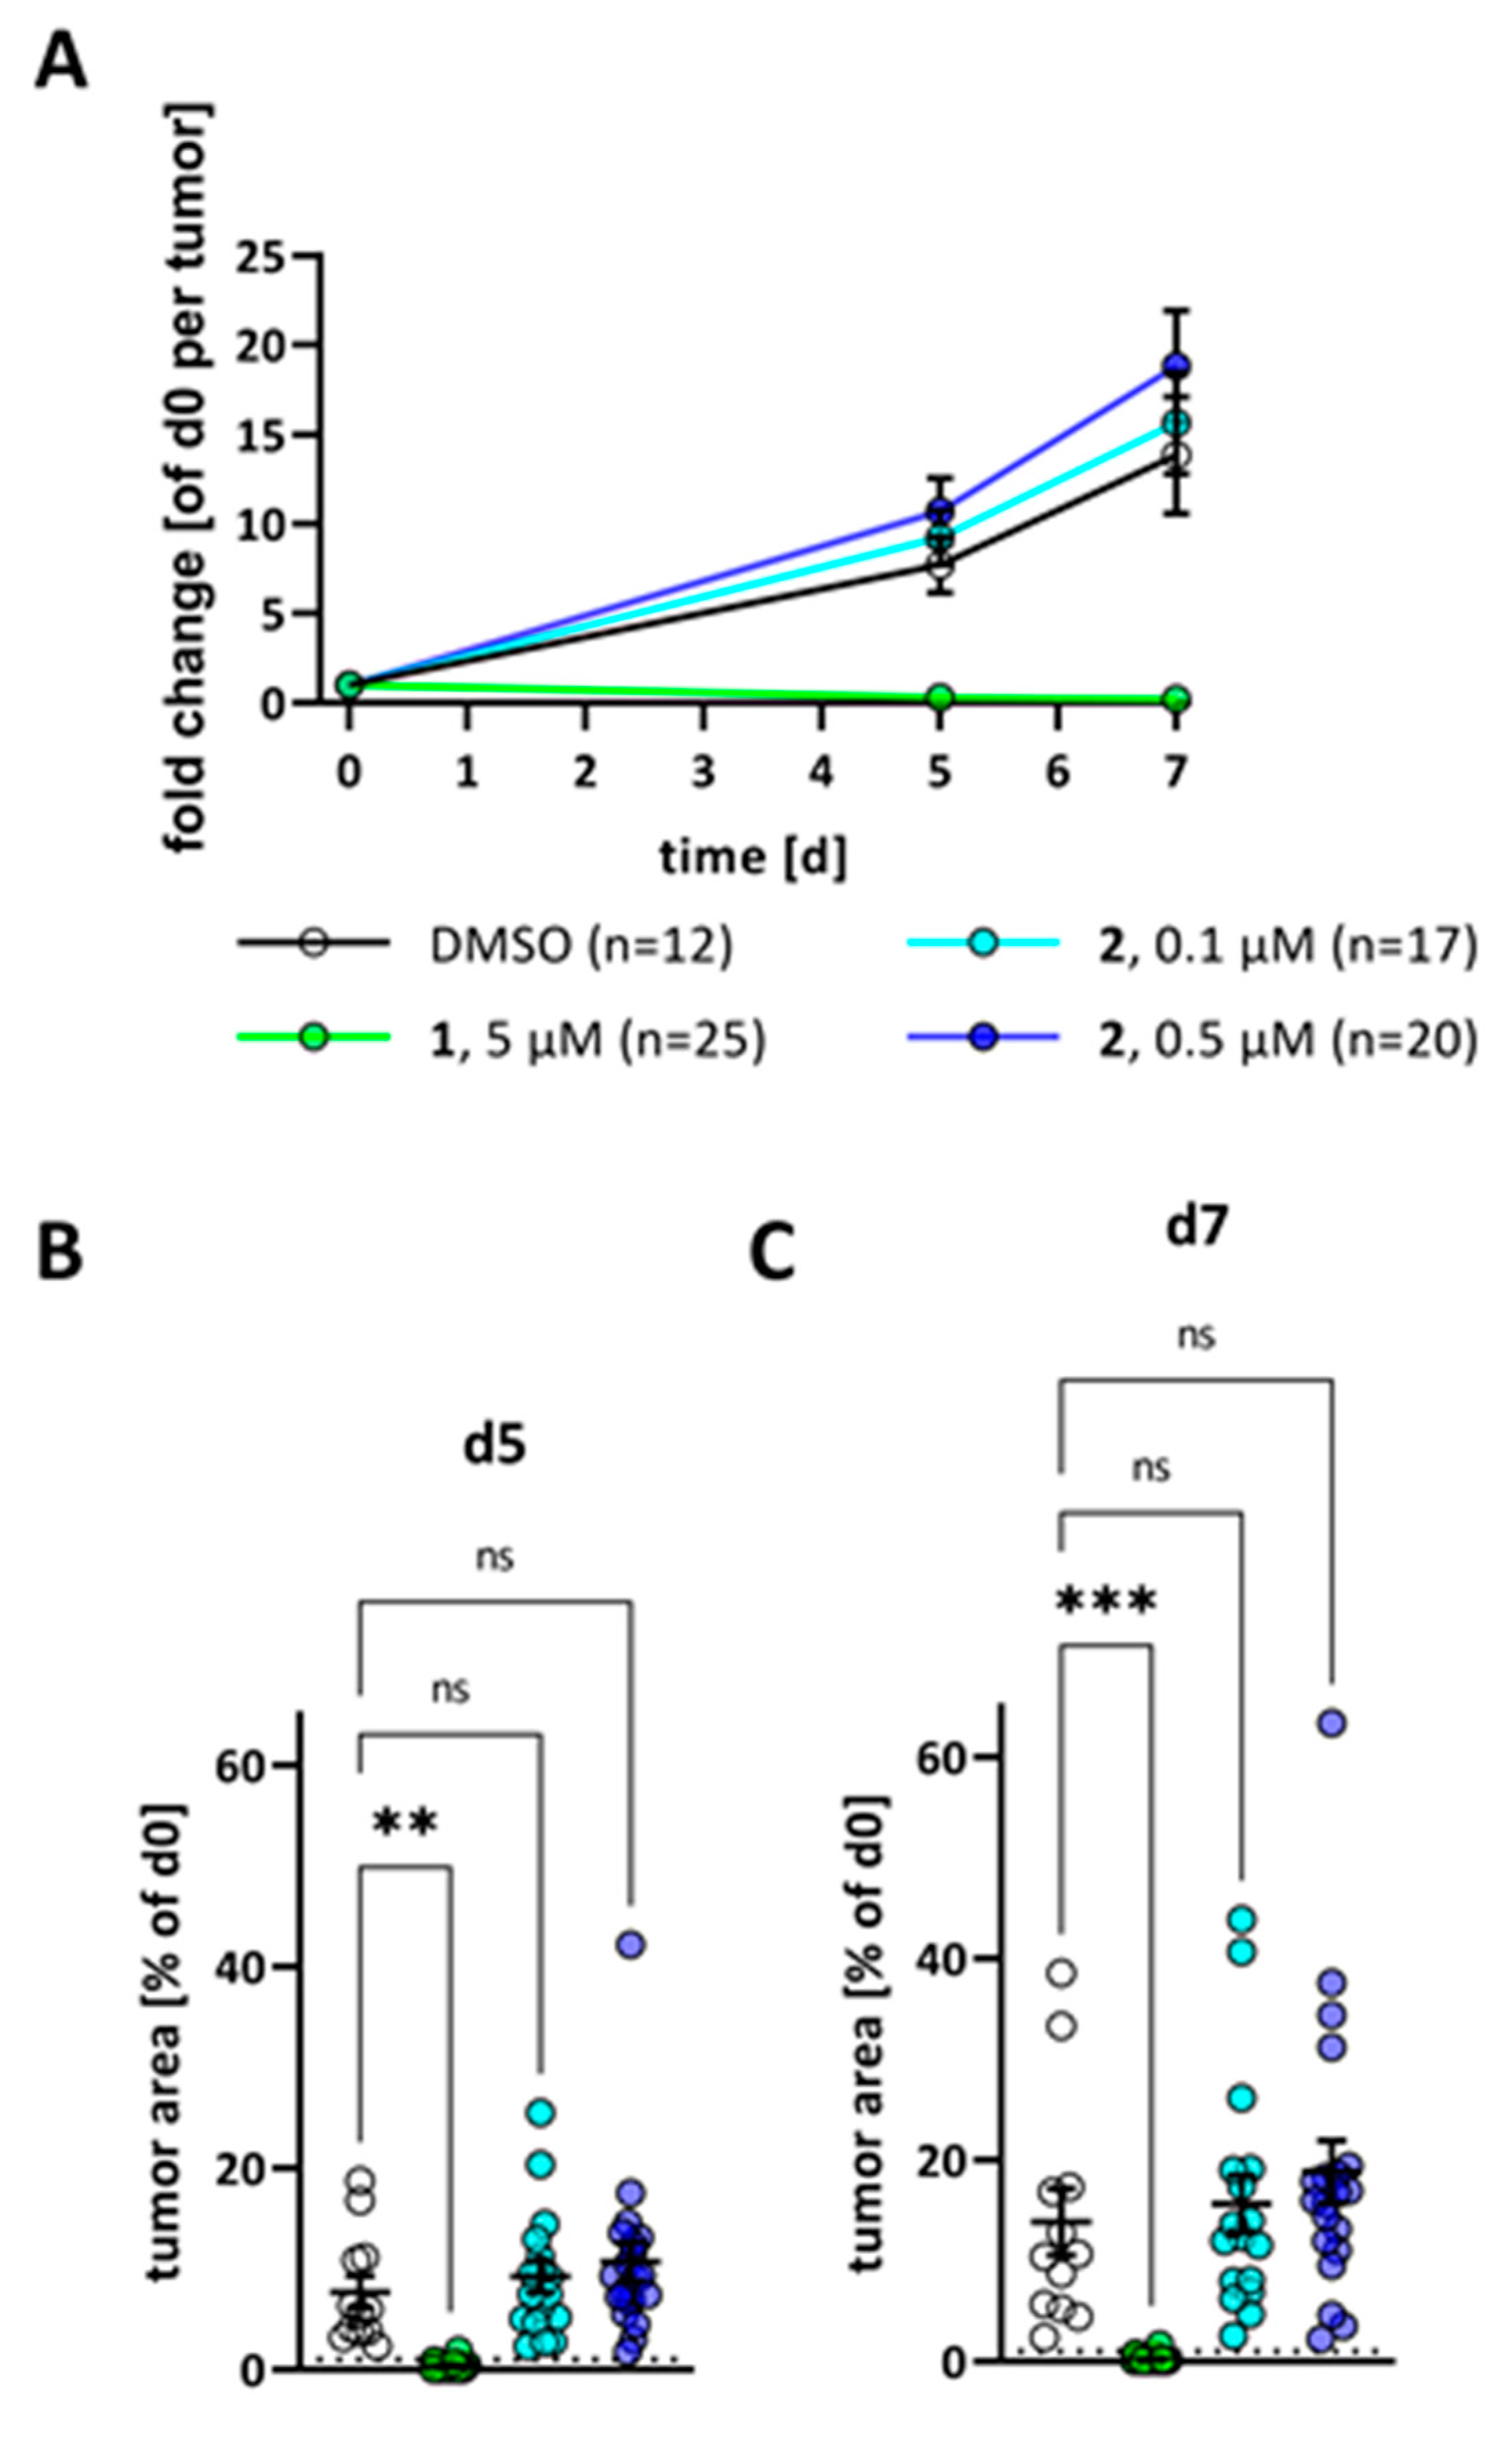
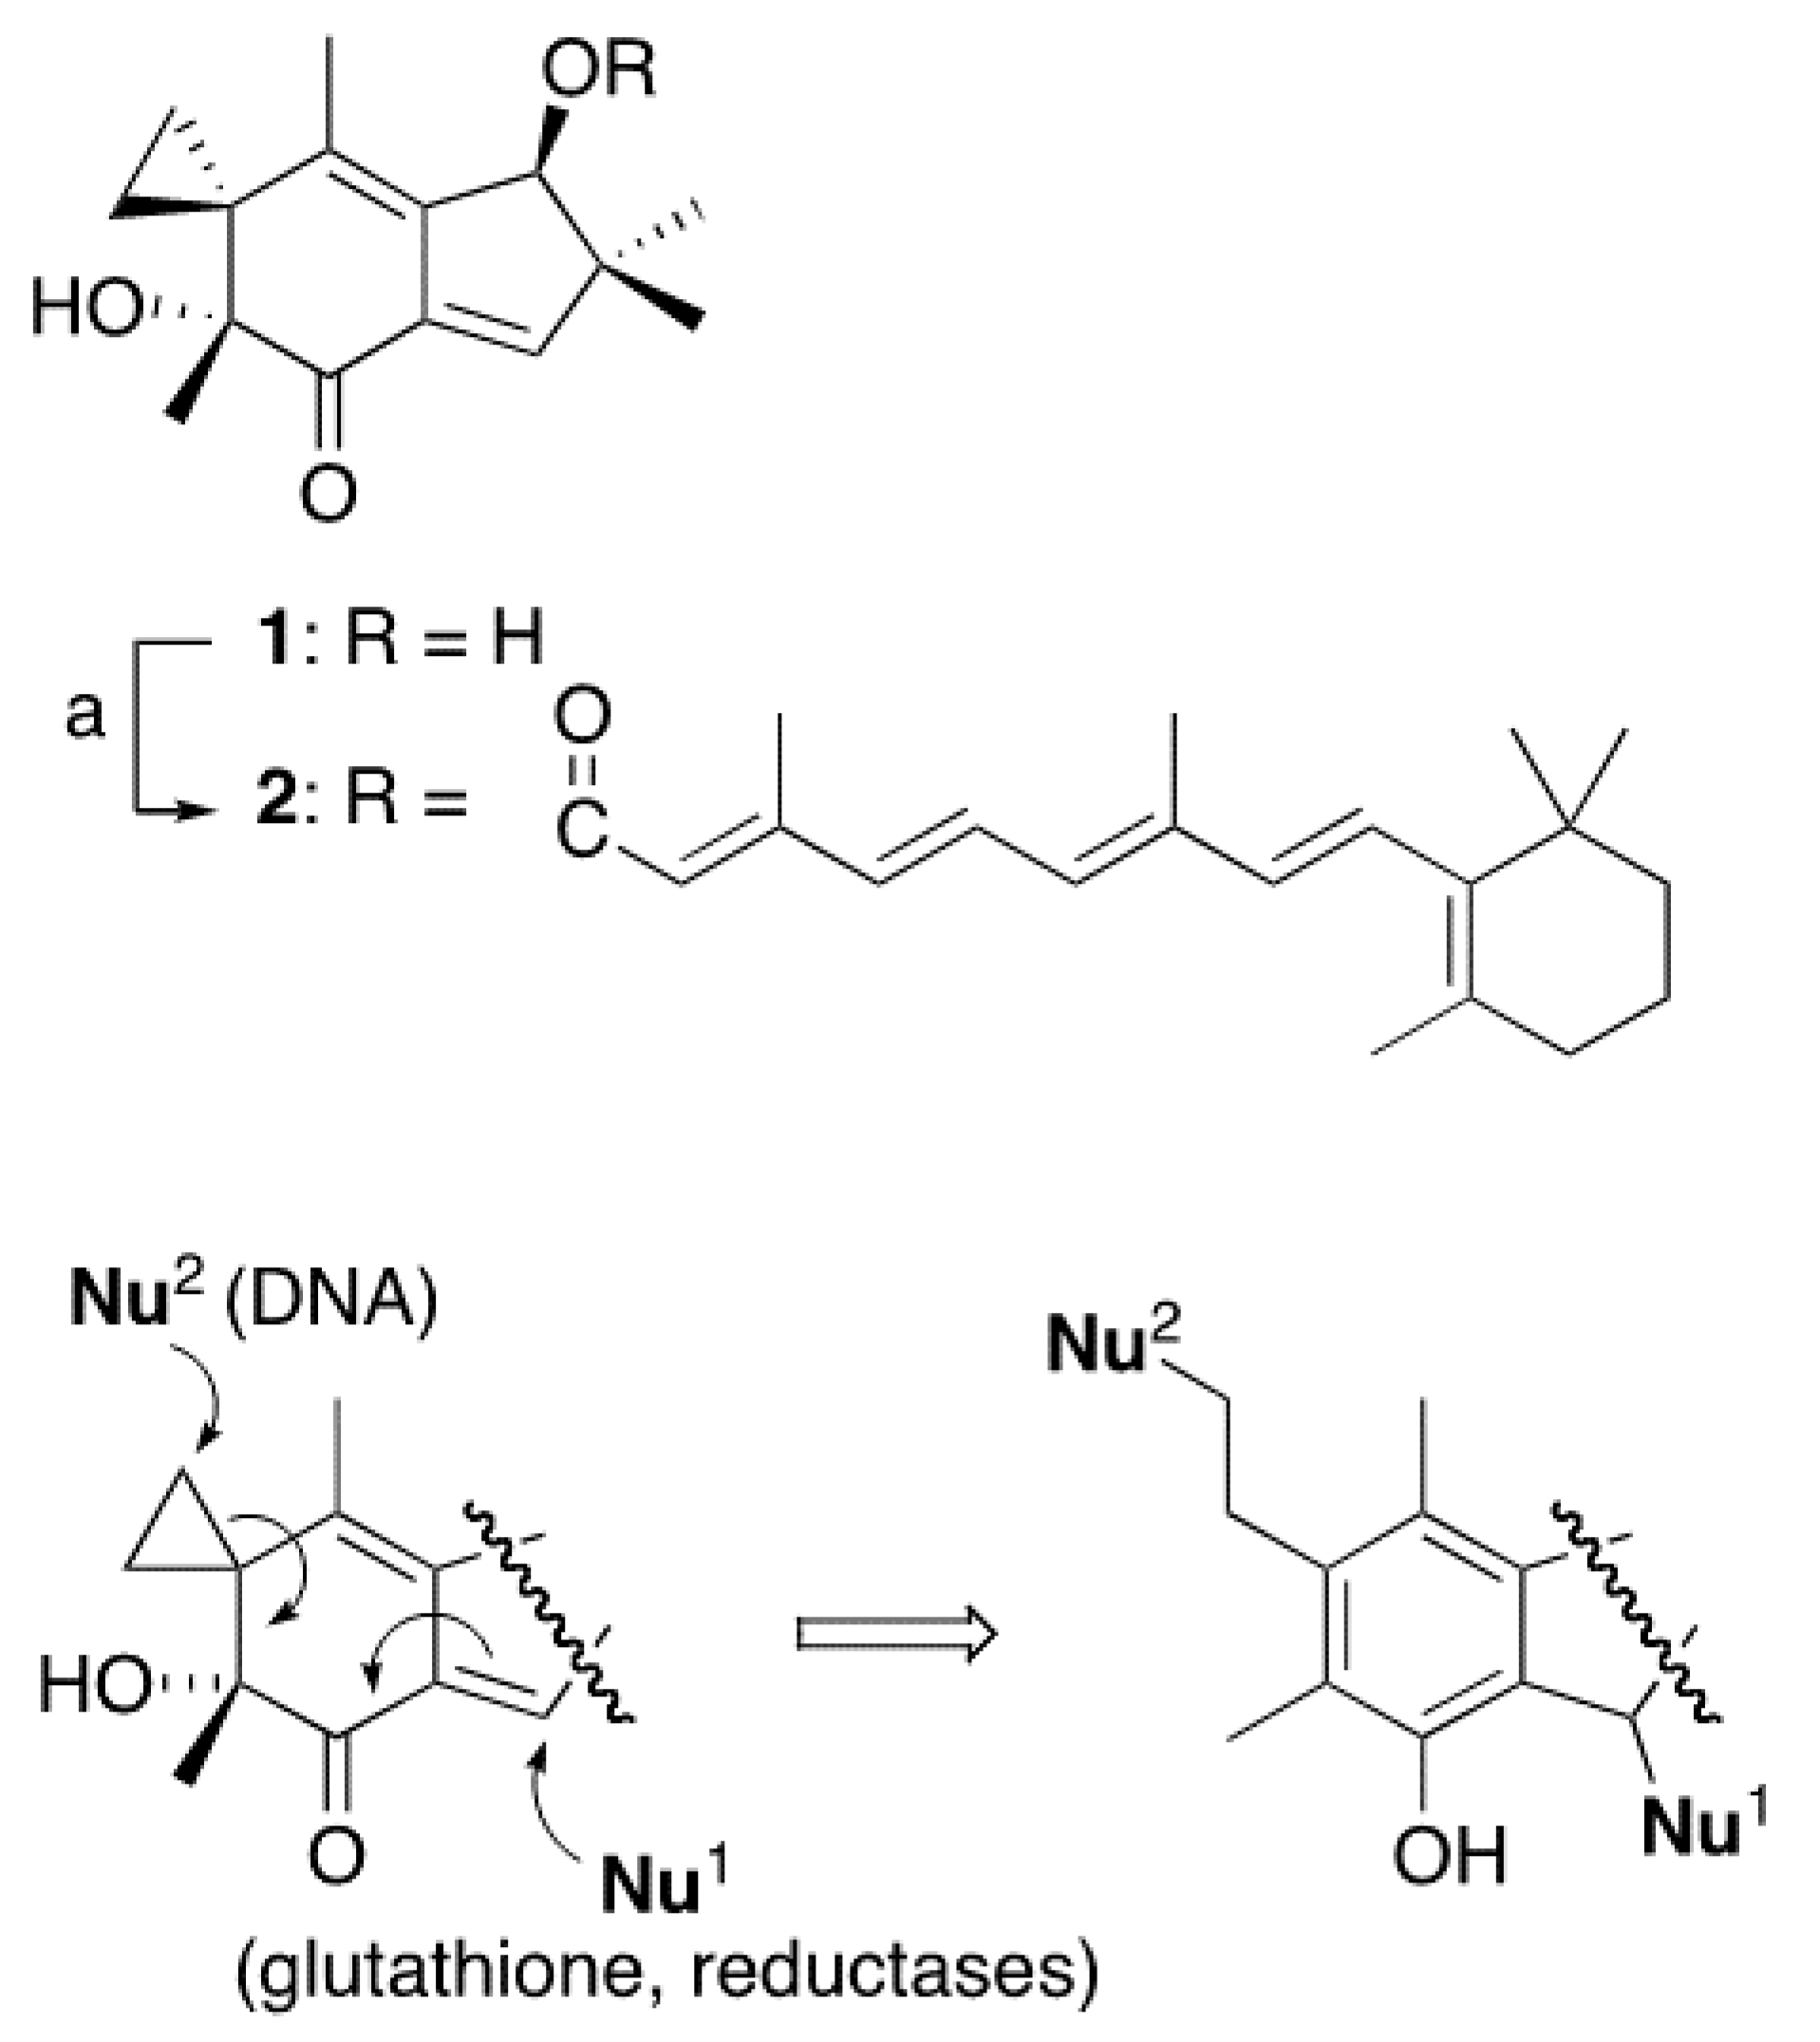
2. Results
3. Discussion
4. Materials and Methods
4.1. General
4.2. Synthesis of Compound 2
4.3. Cells and Cell Culture
4.4. Cell-Based Assay
4.5. RA Reporter Assay
4.6. Reactivity Test with Glutathione
4.7. Cell Death and Apoptosis Induction
4.8. Immunohistochemistry
4.9. Adult Organotypic Brain Slice Cultures and Ex Vivo Tumor Growth Assay
Supplementary Materials
Author Contributions
Funding
Institutional Review Board Statement
Informed Consent Statement
Data Availability Statement
Acknowledgments
Conflicts of Interest
References
- Anchel, M.; Hervey, A.; Robbins, W.J. Antibiotic substances from Basidiomycetes. VII. Clitocybe illudens. Proc. Natl. Acad. Sci. USA 1950, 36, 300–305. [Google Scholar] [CrossRef] [PubMed]
- Dick, R.A.; Yu, X.; Kensler, T.W. NADPH alkenal/one oxidoreductase activity determines sensitivity of cancer cells to the chemotherapeutic alkylating agent irofulven. Clin. Cancer Res. 2004, 10, 1492–1499. [Google Scholar] [CrossRef]
- McMorris, T.C.; Yu, J.; Lira, R.; Dawe, R.; MacDonald, J.R.; Waters, S.J.; Estes, L.A.; Kelner, M.J. Structure-activity studies of antitumor agent irofulven (hydroxy-methylacylfulvene) and analogues. J. Org. Chem. 2001, 66, 6158–6163. [Google Scholar] [CrossRef] [PubMed]
- Kelner, M.J.; McMorris, T.C.; Taetle, R. Preclinical evaluation of illudins as anticancer agents: Basis for selective cytotoxicity. J. Natl. Cancer Instit. 1990, 82, 1562–1656. [Google Scholar] [CrossRef] [PubMed]
- Schobert, R.; Knauer, S.; Seibt, S.; Biersack, B. Anticancer active illudins: Recent developments of a potent alkylating compound class. Curr. Med. Chem. 2011, 18, 790–807. [Google Scholar] [CrossRef]
- Senzer, N.; Arsenau, J.; Richards, D.; Berman, B.; MacDonald, J.R.; Smith, S. Irofulven demonstrates clinical activity against metastatic hormone-refractory prostate cancer in a phase 2 single-agent trial. Am. J. Clin. Oncol. 2005, 28, 36–42. [Google Scholar] [CrossRef]
- Schlett, K.; Madarász, E. Retinoic acid induced neural differentiation in a neuroectodermal cell line immortalized by p53 deficiency. J. Neurosci. Res. 1997, 47, 405–415. [Google Scholar] [CrossRef]
- Tang, X.-H.; Gudas, L.J. Retinoids, retinoic acid, and cancer. Annu. Rev. Pathol. Mech. Dis. 2011, 6, 345–364. [Google Scholar] [CrossRef]
- Chambon, P. A decade of molecular biology of retinoic acid receptors. FASEB J. 1996, 10, 940–954. [Google Scholar] [CrossRef]
- Hua, S.; Kittler, R.; White, K.P. Genomic antagonism between retinoic acid and estrogen signaling in breast cancer. Cell 2009, 137, 1259–1271. [Google Scholar] [CrossRef]
- Aebi, S.; Kroning, R.; Cenni, B.; Sharma, A.; Fink, D.; Los, G.; Weisman, R.; Howell, S.B.; Christen, R.D. All-trans retinoic acid enhances cisplatin induced apoptosis in human ovarian adenocarcinoma and in squamous head and neck cancer cells. Clin. Cancer Res. 1997, 3, 2033–2038. [Google Scholar] [PubMed]
- Tavares, T.S.; Nanus, D.; Yang, X.J.; Gudas, L.J. Gene microarray analysis of human renal cell carcinoma: The effects of HDAC inhibition and retinoid treatment. Cancer Biol. Ther. 2008, 7, 1607–1618. [Google Scholar] [CrossRef] [PubMed]
- Schobert, R.; Biersack, B.; Knauer, S.; Ocker, M. Conjugates of the fungal cytotoxin illudin M with improved tumour specificity. Bioorg. Med. Chem. 2008, 16, 8592–8597. [Google Scholar] [CrossRef] [PubMed]
- Benda, P.; Lightbody, J.; Sato, G.; Sweet, W. Differentiated rat glial cell strain in tissue culture. Science 1968, 61, 370–371. [Google Scholar] [CrossRef] [PubMed]
- Levenson, A.S.; Jordan, V.C. MCF-7: The first hormone-responsive breast cancer cell line. Cancer Res. 1997, 57, 3071–3078. [Google Scholar]
- Robey, R.W.; Polgar, O.; Deeken, J.; To, K.W.; Bates, S.E. ABCG2: Determining its relevance in clinical drug resistance. Cancer Metastasis Rev. 2007, 26, 39–57. [Google Scholar] [CrossRef]
- Umesono, K.; Murakami, K.K.; Thompson, C.C.; Evans, R.M. Direct repeats as selective response elements for the thyroid hormone, retinoic acid and vitamin D3 receptors. Cell 1991, 64, 1255–1266. [Google Scholar] [CrossRef]
- Leid, M.; Kastner, P.; Lyons, R.; Nakshatri, H.; Saunders, M.; Zacharewski, T.; Chen, J.-Y.; Staub, A.; Garnier, J.-M.; Mader, S.; et al. Purification, cloning, and RXR identity of the HeLa cell factor with which RAR or TR heterodimerizes to bind target sequences efficiently. Cell 1992, 68, 377–395. [Google Scholar] [CrossRef]
- De Luca, L. Retinoids and their receptors in differentiation, embryogenesis, and neoplasia. FASEB J. 1991, 5, 2924–2933. [Google Scholar] [CrossRef] [PubMed]
- Maden, M. Retinoic acid in the development, regeneration and maintenance of the nervous system. Nat. Rev. Neurosci. 2007, 8, 755–765. [Google Scholar] [CrossRef] [PubMed]
- Wagner, M.; Han, B.; Jessell, T.M. Regional differences in retinoid release from embryonic neural tissue detected by an in vitro reporter assay. Development 1992, 116, 55–66. [Google Scholar] [CrossRef] [PubMed]
- Reynolds, A.; Lundblad, V. Yeast vectors and assays for expression of cloned genes. In Current Protocols in Molecular Biology; Ausubel, F.A., Brent, R., Kingston, R.E., Moore, D.D., Seidman, J.G., Smith, J.A., Struhl, K., Eds.; Greene Publishing and Wiley-Interscience: New York, NY, USA, 1989; pp. 13.6.1–13.6.4. [Google Scholar]
- Yang, Z.; Wang, K.K. Glial fibrillary acidic protein: From intermediate filament assembly and gliosis to neurobiomarker. Trends Neurosci. 2015, 38, 364–374. [Google Scholar] [CrossRef]
- Környei, Z.; Slávik, V.; Szabó, B.; Gócza, E.; Czirók, A.; Madarász, E. Humoral and contact interactions in astroglia/stem cell co-cultures in the course of glia-induced neurogenesis. Glia 2005, 49, 430–444. [Google Scholar] [CrossRef]
- Campos, B.; Wan, F.; Farhadi, M.; Ernst, A.; Zeppernick, F.; Tagscherer, K.E.; Ahmadi, R.; Lohr, J.; Dictus, C.; Gdynia, G.; et al. Differentiation therapy exerts antitumor effects on stem-like glioma cells. Clin. Cancer Res. 2010, 16, 2715–2728. [Google Scholar] [CrossRef] [PubMed]
- Gerstmeier, J.; Possmayer, A.-L.; Bozkurt, S.; Hoffmann, M.E.; Dikic, I.; Herold-Mende, C.; Burger, M.C.; Münch, C.; Kögel, D.; Linder, B. Calcitriol promotes differentiation of glioma stem-like cells and increases their susceptibility to temozolomide. Cancers 2021, 13, 3577. [Google Scholar] [CrossRef] [PubMed]
- Minami, N.; Maeda, Y.; Shibao, S.; Arima, Y.; Ohka, F.; Kondo, Y.; Maruyama, K.; Kusuhara, M.; Sasayama, T.; Kohmura, E.; et al. Organotypic brain explant culture as a drug evaluation system for malignant brain tumors. Cancer Med. 2017, 6, 2635–2645. [Google Scholar] [CrossRef]
- De Boüard, S.; Herlin, P.; Christensen, J.G.; Lemoisson, E.; Gauduchon, P.; Raymond, E.; Guillamo, J.-S. Antiangiogenic and inti-invasive effects of sunitinib on experimental human glioblastoma. Neuro- Oncol. 2007, 9, 412–423. [Google Scholar] [CrossRef]
- Soubéran, A.; Tchoghandjian, A. Practical review on preclinical human 3D glioblastoma models: Advances and challenges for clinical translation. Cancers 2020, 12, 2347. [Google Scholar] [CrossRef]
- Abdalla, A.N.; Malki, W.H.; Qattan, A.; Shahid, I.; Hossain, M.A.; Ahmed, M. Chemosensitization of HT29 and HT29-5FU cell lines by a combination of a multi-tyrosine kinase inhibitor and 5FU downregulates ABCC1 and inhibits PIK3CA in light of their importance in Saudi colorectal cancer. Molecules 2021, 26, 334. [Google Scholar] [CrossRef]
- Reshkin, S.J.; Bellizzi, A.; Caldeira, S.; Albarani, V.; Poignee, M.; Alunni-Fabbroni, M.; Casavola, V.; Tommasino, I. Na+/H+ exchanger-dependent intracellular alkalinization is an early event in malignant transformation and plays an essential role in the development of subsequent transformation-associated phenotypes. FASEB J. 2000, 14, 2185–2197. [Google Scholar] [CrossRef]
- Boscoboinik, D.; Gupta, R.S.; Epand, R.M. Investigation of the relationship between altered intracellular pH and multidrug resistance in mammalian cells. Br. J. Cancer 1990, 61, 568–572. [Google Scholar] [CrossRef] [PubMed]
- Otreba, M.; Stojko, J.; Kabala-Dzik, A.; Rzepecka-Stojko, A. Perphenazine and prochlorperazine decrease glioblastoma U-87 MG cell migration and invasion: Analysis of the ABCB1 and ABCG2 transporters, E-cadherin, α-tubulin and integrins (α3, α5, and β1) levels. Oncol. Lett. 2022, 23, 182. [Google Scholar] [CrossRef] [PubMed]
- Zheng, X.; Shen, G.; Yang, X.; Liu, W. Most C6 cells are cancer stem cells: Evidence from clonal and population analyses. Cancer Res. 2007, 67, 3691–3697. [Google Scholar] [CrossRef] [PubMed]
- Lee, H.Y.; Sueoka, N.; Hong, W.-K.; Mangelsdorf, D.J.; Claret, F.X.; Kurie, J.M. All-trans-retinoic acid inhibits Jun N-terminal kinase by increasing dual-specificity phosphatase activity. Mol. Cell. Biol. 1999, 19, 1973–1980. [Google Scholar] [CrossRef]
- Wang, W.; Waters, S.J.; MacDonald, J.R.; Roth, C.; Shentu, S.; Freeman, J.; Von Hoff, D.D.; Miller, A.R. Irofulven (6-hydroxymethylacylfulvene, MGI 114)-induced apoptosis in human pancreatic cancer cells is mediated by ERK and JNK kinases. Anticancer Res. 2002, 22, 559–564. [Google Scholar]
- Sanchez, C.; Galve-Roperh, I.; Canova, C.; Brachet, P.; Guzman, M. D9-Tetrahydrocannabinol induces apoptosis in C6 glioma cells. FEBS Lett. 1998, 436, 6–10. [Google Scholar] [CrossRef]
- Rueda, D.; Galve-Roperh, I.; Haro, A.; Guzman, M. The CB1 cannabinoid receptor is coupled to the activation of c-Jun N-terminal kinase. Mol. Pharmacol. 2000, 58, 814–820. [Google Scholar] [CrossRef]
- Tang, K.; Cao, L.; Fan, S.Q.; Wu, M.H.; Huang, H.; Zhou, Y.H.; Zhou, M.; Tang, Y.L.; Wang, R.; Zeng, F.; et al. Effect of all-trans retinoic acid on C6 glioma cell proliferation and differentiation. Zhong Nan Da Xue Xue Bao Yi Xue Ban 2008, 33, 892–897. [Google Scholar]
- Friedman, H.S.; Keir, S.T.; Houghton, P.J.; Lawless, A.A.; Bigner, D.D.; Waters, S.J. Activity of irofulven (6-hydroxymethylacylfulvene) in the treatment of glioblastoma multiforme-derived xenografts in mice. Cancer Chemother. Pharmacol. 2001, 48, 413–416. [Google Scholar] [CrossRef]
- Zoldakova, M.; Kornyei, Z.; Brown, A.; Biersack, B.; Madarász, E.; Schobert, R. Effects of a combretastatin A4 analogous chalcone and its Pt-complex on cancer cells: A comparative study of uptake, cell cycle and damage to cellular compartments. Biochem. Pharmacol. 2010, 80, 1487–1496. [Google Scholar] [CrossRef]
- Jády, A.G.; Nagy, Á.M.; Köhidi, T.; Ferenczi, S.; Tretter, L.; Madarász, E. Differentiation-dependent energy production and metabolite utilization: A comparative study on neural stem cells, neurons, and astrocytes. Stem Cells Dev. 2016, 25, 995–1005. [Google Scholar] [CrossRef]
- Campos, B.; Gal, Z.; Baader, A.; Schneider, T.; Sliwinski, C.; Gassel, K.; Bageritz, J.; Grabe, N.; von Deimling, A.; Beckhove, P.; et al. Aberrant self-renewal and quiescence contribute to the aggressiveness of glioblastoma. J. Pathol. 2014, 234, 23–33. [Google Scholar] [CrossRef] [PubMed]
- Sonneveld, E.; van den Brink, C.E.; van der Leede, B.J.; Maden, M.; and Van Der Saag, P.T. Embryonal carcinoma cell lines stably transfected with mRARbeta2-lacZ: Sensitive system for measuring levels of active retinoids. Exp. Cell Res. 1999, 250, 284–297. [Google Scholar] [CrossRef]
- Linder, B.; Wehle, A.; Hehlgans, S.; Bonn, F.; Dikic, I.; Rödel, F.; Seifert, V.; Kögel, D. Arsenic trioxide and (-)-gossypol synergistically target glioma stem-like cells via inhibition of Hedgehog and Notch signaling. Cancers 2019, 11, 350. [Google Scholar] [CrossRef] [PubMed]
- Remy, J.; Linder, B.; Weirauch, U.; Konovalova, J.; Marschalek, R.; Aigner, A.; Kögel, D. Inhibition of PIM1 blocks the autophagic flux to sensitize glioblastoma cells to ABT-737-induced apoptosis. Biochim. Biophys. Acta Mol. Cell. Res. 2019, 1866, 175–189. [Google Scholar] [CrossRef] [PubMed]


| Compd./Cell Line | 1 | 2 | ||
|---|---|---|---|---|
| 24 h | 48 h | 24 h | 48 h | |
| 518A2 | 0.04 ± 0.01 | 0.02 ± 0.01 | 5.0 ± 0.3 | 4.0 ± 0.7 |
| HL60 | 0.007 ± 0.002 | 0.001 ± 0.000 | 6.8 ± 2.8 | 4.5 ± 1.1 |
| KBv1+Vbl | 0.003 ± 0.001 | 0.002 ± 0.000 | 1.6 ± 0.4 | 1.2 ± 0.1 |
| MCF-7+Topo | 0.35 ± 0.13 | 0.05 ± 0.01 | 2.5 ± 0.6 | 0.08 ± 0.01 |
| HT-29 | 1.5 ± 0.6 | 0.06 ± 0.01 | 38 ± 4 | 4.0 ± 1.3 |
| C6 | 1.0 ± 0.3 | 0.40 ± 0.06 | 40 ± 4 | 12 ± 1.3 |
| U87 | 0.63 ± 0.04 | 0.13 ± 0.03 | 37 ± 3 | 2.7 ± 0.7 |
| MZ-54 | 0.55 ± 0.16 | 0.06 ± 0.01 | n.d. | 5.48 ± 1.2 |
| U251 | 0.3 ± 0.05 | 0.12 ± 0.02 | n.d. | 4.51 ± 1.3 |
| Compd./Cell Line | 1 | 2 | ||
|---|---|---|---|---|
| 24 h | 48 h | 24 h | 48 h | |
| neurons | 0.60 ± 0.12 | 0.19 ± 0.04 | 26 ± 1 | 14 ± 2 |
| astrocytes | 1.5 ± 0.4 | 0.20 ± 0.03 | 45 ± 2 | 33 ± 4 |
| NE-4C | 0.40 ± 0.10 | 0.05 ± 0.02 | 7.0 ± 3.2 | 2.0 ± 1.2 |
Publisher’s Note: MDPI stays neutral with regard to jurisdictional claims in published maps and institutional affiliations. |
© 2022 by the authors. Licensee MDPI, Basel, Switzerland. This article is an open access article distributed under the terms and conditions of the Creative Commons Attribution (CC BY) license (https://creativecommons.org/licenses/by/4.0/).
Share and Cite
Linder, B.; Zoldakova, M.; Kornyei, Z.; Köhler, L.H.F.; Seibt, S.; Menger, D.; Wetzel, A.; Madarász, E.; Schobert, R.; Kögel, D.; et al. Antitumor Effects of a New Retinoate of the Fungal Cytotoxin Illudin M in Brain Tumor Models. Int. J. Mol. Sci. 2022, 23, 9056. https://doi.org/10.3390/ijms23169056
Linder B, Zoldakova M, Kornyei Z, Köhler LHF, Seibt S, Menger D, Wetzel A, Madarász E, Schobert R, Kögel D, et al. Antitumor Effects of a New Retinoate of the Fungal Cytotoxin Illudin M in Brain Tumor Models. International Journal of Molecular Sciences. 2022; 23(16):9056. https://doi.org/10.3390/ijms23169056
Chicago/Turabian StyleLinder, Benedikt, Miroslava Zoldakova, Zsuzsanna Kornyei, Leonhard H. F. Köhler, Sebastian Seibt, Dominic Menger, André Wetzel, Emília Madarász, Rainer Schobert, Donat Kögel, and et al. 2022. "Antitumor Effects of a New Retinoate of the Fungal Cytotoxin Illudin M in Brain Tumor Models" International Journal of Molecular Sciences 23, no. 16: 9056. https://doi.org/10.3390/ijms23169056