Article

Effects of Combining Biofactors on Bioenergetic Parameters, Aβ Levels and Survival in Alzheimer Model Organisms

Biomedical Research Center Seltersberg (BFS), Laboratory for Nutrition in Prevention and Therapy, Institute of Nutritional Sciences, Justus Liebig University Giessen, Schubertstr. 81, 35392 Giessen, Germany
*
Author to whom correspondence should be addressed.
Int. J. Mol. Sci. 2022, 23(15), 8670; https://doi.org/10.3390/ijms23158670
Submission received: 7 July 2022 / Revised: 28 July 2022 / Accepted: 2 August 2022 / Published: 4 August 2022
(This article belongs to the Special Issue Mitochondria as a Cellular Hub in Neurological Disorders)

Abstract

:
Increased amyloid beta (Aβ) levels and mitochondrial dysfunction (MD) in the human brain characterize Alzheimer disease (AD). Folic acid, magnesium and vitamin B6 are essential micro-nutrients that may provide neuroprotection. Bioenergetic parameters and amyloid precursor protein (APP) processing products were investigated in vitro in human neuroblastoma SH-SY5Y-APP695 cells, expressing neuronal APP, and in vivo, in the invertebrate Caenorhabditis elegans (CL2006 & GMC101) expressing muscular APP. Model organisms were incubated with either folic acid and magnesium-orotate (ID63) or folic acid, magnesium-orotate and vitamin B6 (ID64) in different concentrations. ID63 and ID64 reduced Aβ, soluble alpha APP (sAPPα), and lactate levels in SH-SY5Y-APP695 cells. The latter might be explained by enhanced expression of lactate dehydrogenase (LDHA). Micronutrient combinations had no effects on mitochondrial parameters in SH-SY5Y-APP695 cells. ID64 showed a significant life-prolonging effect in C. elegans CL2006. Incubation of GMC101 with ID63 significantly lowered Aβ aggregation. Both combinations significantly reduced paralysis and thus improved the phenotype in GMC101. Thus, the combinations of the tested biofactors are effective in pre-clinical models of AD by interfering with Aβ related pathways and glycolysis.

1. Introduction

At present, 50 million people are suffering from Alzheimer’s disease (AD) and this number will rise to approximately 152 million in 2050 [1]. Unfortunately, there is no cure for AD yet. Approved drugs only treat symptoms [2]. There are several hypotheses regarding the etiology of Alzheimer’s disease, but the causes of the disease are unknown. Previous research has focused on amyloid and tau, which has not yet led to major breakthroughs. Therefore, there is a trend towards multifactorial treatments and, among other things, energy metabolism with regard to mitochondrial functions. Two of the hallmarks of AD are mitochondrial dysfunction (MD) [3] and overproduction of beta-amyloid (Aβ) [4]. The first signs of beginning MD are a reduction of glucose consumption [5] and a reduced activity of key enzymes of the oxidative metabolism [6,7]. Almost all mitochondrial functions are impaired in AD [8,9]. The limited function of the electron transport chain (ETC) is the reason for the decrease in complexes IV and I. This results in a decreased mitochondrial membrane potential (MMP) and ATP production [10]. Another important characteristic of AD is that Aβ is cleaved of from a much larger amyloid precursor protein (APP) [11]. APP is cleaved via two pathways, a non-amyloid and an amyloidogenic pathway. The APP is spliced by the different types of protease, namely α-, β- and γ-secretase [11,12]. Depending on which protease cleaves the APP, Aβ peptides are produced. The α-protease cleaves the APP closer to the membrane, resulting in a shorter fragment in the membrane, which is then further cleaved by the γ-protease to a non-amyloidogenic product. However, when β-protease cleaves the protein, larger fragments are produced, which are then cleaved by γ-protease to form different large Aβ proteins [12] including Aβ1–40 and Aβ1–42 which may be the main triggers for AD [2,11,12]. It appears that Aβ1–42 has the greater neurotoxic potential compared to the Aβ1–40 form. Furthermore, Aβ1–42 tends to aggregate more, which can lead to plaque formation. In addition, the relationship between Aβ1–40 and Aβ1–42 is important, as the two influence each other [13,14,15]. There is evidence that sAPPα and sAPPβ share some properties [16], where sAPPα can be neuroprotective, whereas sAPPβ lacks most of the neuroprotective properties and has a rather negative effect [17]. Another early sign of AD is impaired glucose metabolisation which leads to MD and an increase in oxidant production [18,19]. The glycolysis pathway represents a way to ensure sufficient energy production and bypass Aβ induced impairment of mitochondria [20,21]. The enzymes pyruvate dehydrogenase kinase 1 (PDK1) and LDHA are of interest here. PDK1 phosphoylates pyruvate dehydrogenase and inactivates it. LDHA converts pyruvate into lactate. Both are markers of aerobic glycolysis. If a change occurs here, conclusions can be drawn about energy production [22,23].
There is evidence that specific biofactors [24], which are defined as substances required by the body for its normal physiological functioning and/ or with health-beneficial and/ or disease-preventive biological activities, may interfere with pathophysiological processes leading to AD [25,26,27]. A cocktail containing some of our tested compounds had a positive effect on AD symptoms in a TgF344-AD rat model. This could raise the mitochondrial function of the transgenic rats to the level of the wild-type rats [28]. Here, folic acid, magnesium-orotate and vitamin B6 in different combinations were tested in cellular and an invertebrate model of AD. The synthetically produced water-soluble folic acid, which consists of pterin, p-aminobenzoic acid and L-glutamic acid, belongs to the vitamin B complexes. Folate (also known as vitamin B9) is used as an umbrella term for the various derivatives of tetrahydrofolate (THF), with the synthetically produced form being referred to as folic acid [29,30]. Folate deficiency impairs DNA as well as mtDNA synthesis and stability and causes oxidative stress in the form of ROS, which, as already listed, is also associated with AD pathogenesis. In this context, neuronal impairment and increased cell death occur in AD. In addition, a deficiency of folate leads to a decrease in the methylation of enzymes and promoter regions of genes that are presumably also involved in AD pathogenesis [31,32]. Magnesium-orotate (MgOr), which is very poorly soluble in water, is the magnesium salt of orotic acid. As a source of magnesium (Mg), MgOr is used for the oral treatment of Mg deficiency. Orotic acid is a key intermediate in the biosynthetic pathway of pyrimidines and improves energy status by stimulating, among other things, the synthesis of glycogen and ATP [33]. Mg2+ is the fourth most abundant mineral as well as the second most abundant intracellular divalent cation in the human body and acts as a cofactor [34,35,36]. Mg is involved in protein synthesis, cellular energy production and storage, reproduction, DNA and RNA synthesis, and mitochondrial membrane potential [35]. Mg is also involved in the maintenance of physiological nerve and muscle function, cardiac excitability, and neuromuscular conduction [35,36]. Several pathological mechanisms in AD are discussed on which Mg might have a positive influence. Mg appears to inhibit the activity of γ-secretase and the proinflammatory TNF-α (tumor necrosis factor α) produced by microglia. Mg also inhibited IL-1β (interleukin-1β) and Aβ-induced, which all together induced inflammation. In addition, Mg has been reported to decrease the influx of Aβ across the blood-brain barrier [34]. High Mg concentrations have been shown to promote APP processing towards α-secretase due to the upregulation of transcription factors such as CREB [37]. Mg deficiency may be a risk factor for ADs and that possible supplementation may be a potentially valuable adjunct treatment for AD [38]. The water soluble vitamin B6 (Vit B6) is used as an umbrella term for various derivates from which pyridoxine is the most common form. It is an enzymatic cofactor required for more than 140 biochemical reactions, including transaminations, α-decarboxylations and replacement reactions [39]. Through the application of Vit B6, the oxidative stress induced by Aβ could be inhibited [40]. Furthermore, Vit B6 reduces the plasma levels of Aβ [41] and prevents the grey matter atrophy related to AD [42].
The present work investigated the effects of different B vitamins and MgOr on MD and the processing of APP in SH-SY5Y-APP695 cells a cellular model of early AD. Furthermore, the effects of the substances were tested in CL2006 and GMC101, both invertebrate models of AD.

2. Results

2.1. General Overview of Tests and Results

In Table 1 below, all tests and results are listed to provide a general overview of the subsequent tests and results. Here, the substance under investigation is shown against the control. For more detailed insights, the results are described in the respective chapters.

2.2. Aβ1–40 Production

First, we tested different concentrations of biofactors on Aβ1–40 production in SH-SY5Y-APP695 cells. Cells were incubated for 24 h with zinc orotate (ZnO), magnesium-orotate (MgO), benfotiamine (vitamin B1), folic acid (Fol), cholecalciferol (Vit D3), cobalamin (Vit B12), and pyridoxine (Vit B6) to select possible hit substances for further experiments (data not shown). Potential hit substances were identified, from which finally Fol 10 µM, MgOr 200 µM and Vit B6 100 nM turned out to be the most promising ones, which we applied in two different combinations.
To investigate the effect on the Aβ1–40 production, SH-SY5Y-APP695 cells were incubated with both combinations (MgOr 200 µM & Fol 10 µM = ID63//MgOr 200 µM & Fol 10 µM & Vit B6 100 nM = ID64) and the single compounds for 24 h (Figure 1). ID63 had a significant lowering effect on the Aβ1–40 level (p > 0.0001). The ID63 combination even had an over additive effect compared to the single substances MgOr (p = 0.0028) and Fol (p > 0.0001). The ID64 combination had a significantly decreasing effect on the Aβ levels compared to the control (p > 0.0001). Furthermore, ID64 had a significantly reducing effect in comparison to the single substances MgOr (p = 0.0497), Fol (p > 0.0001) and Vit B6 (p > 0.0001).

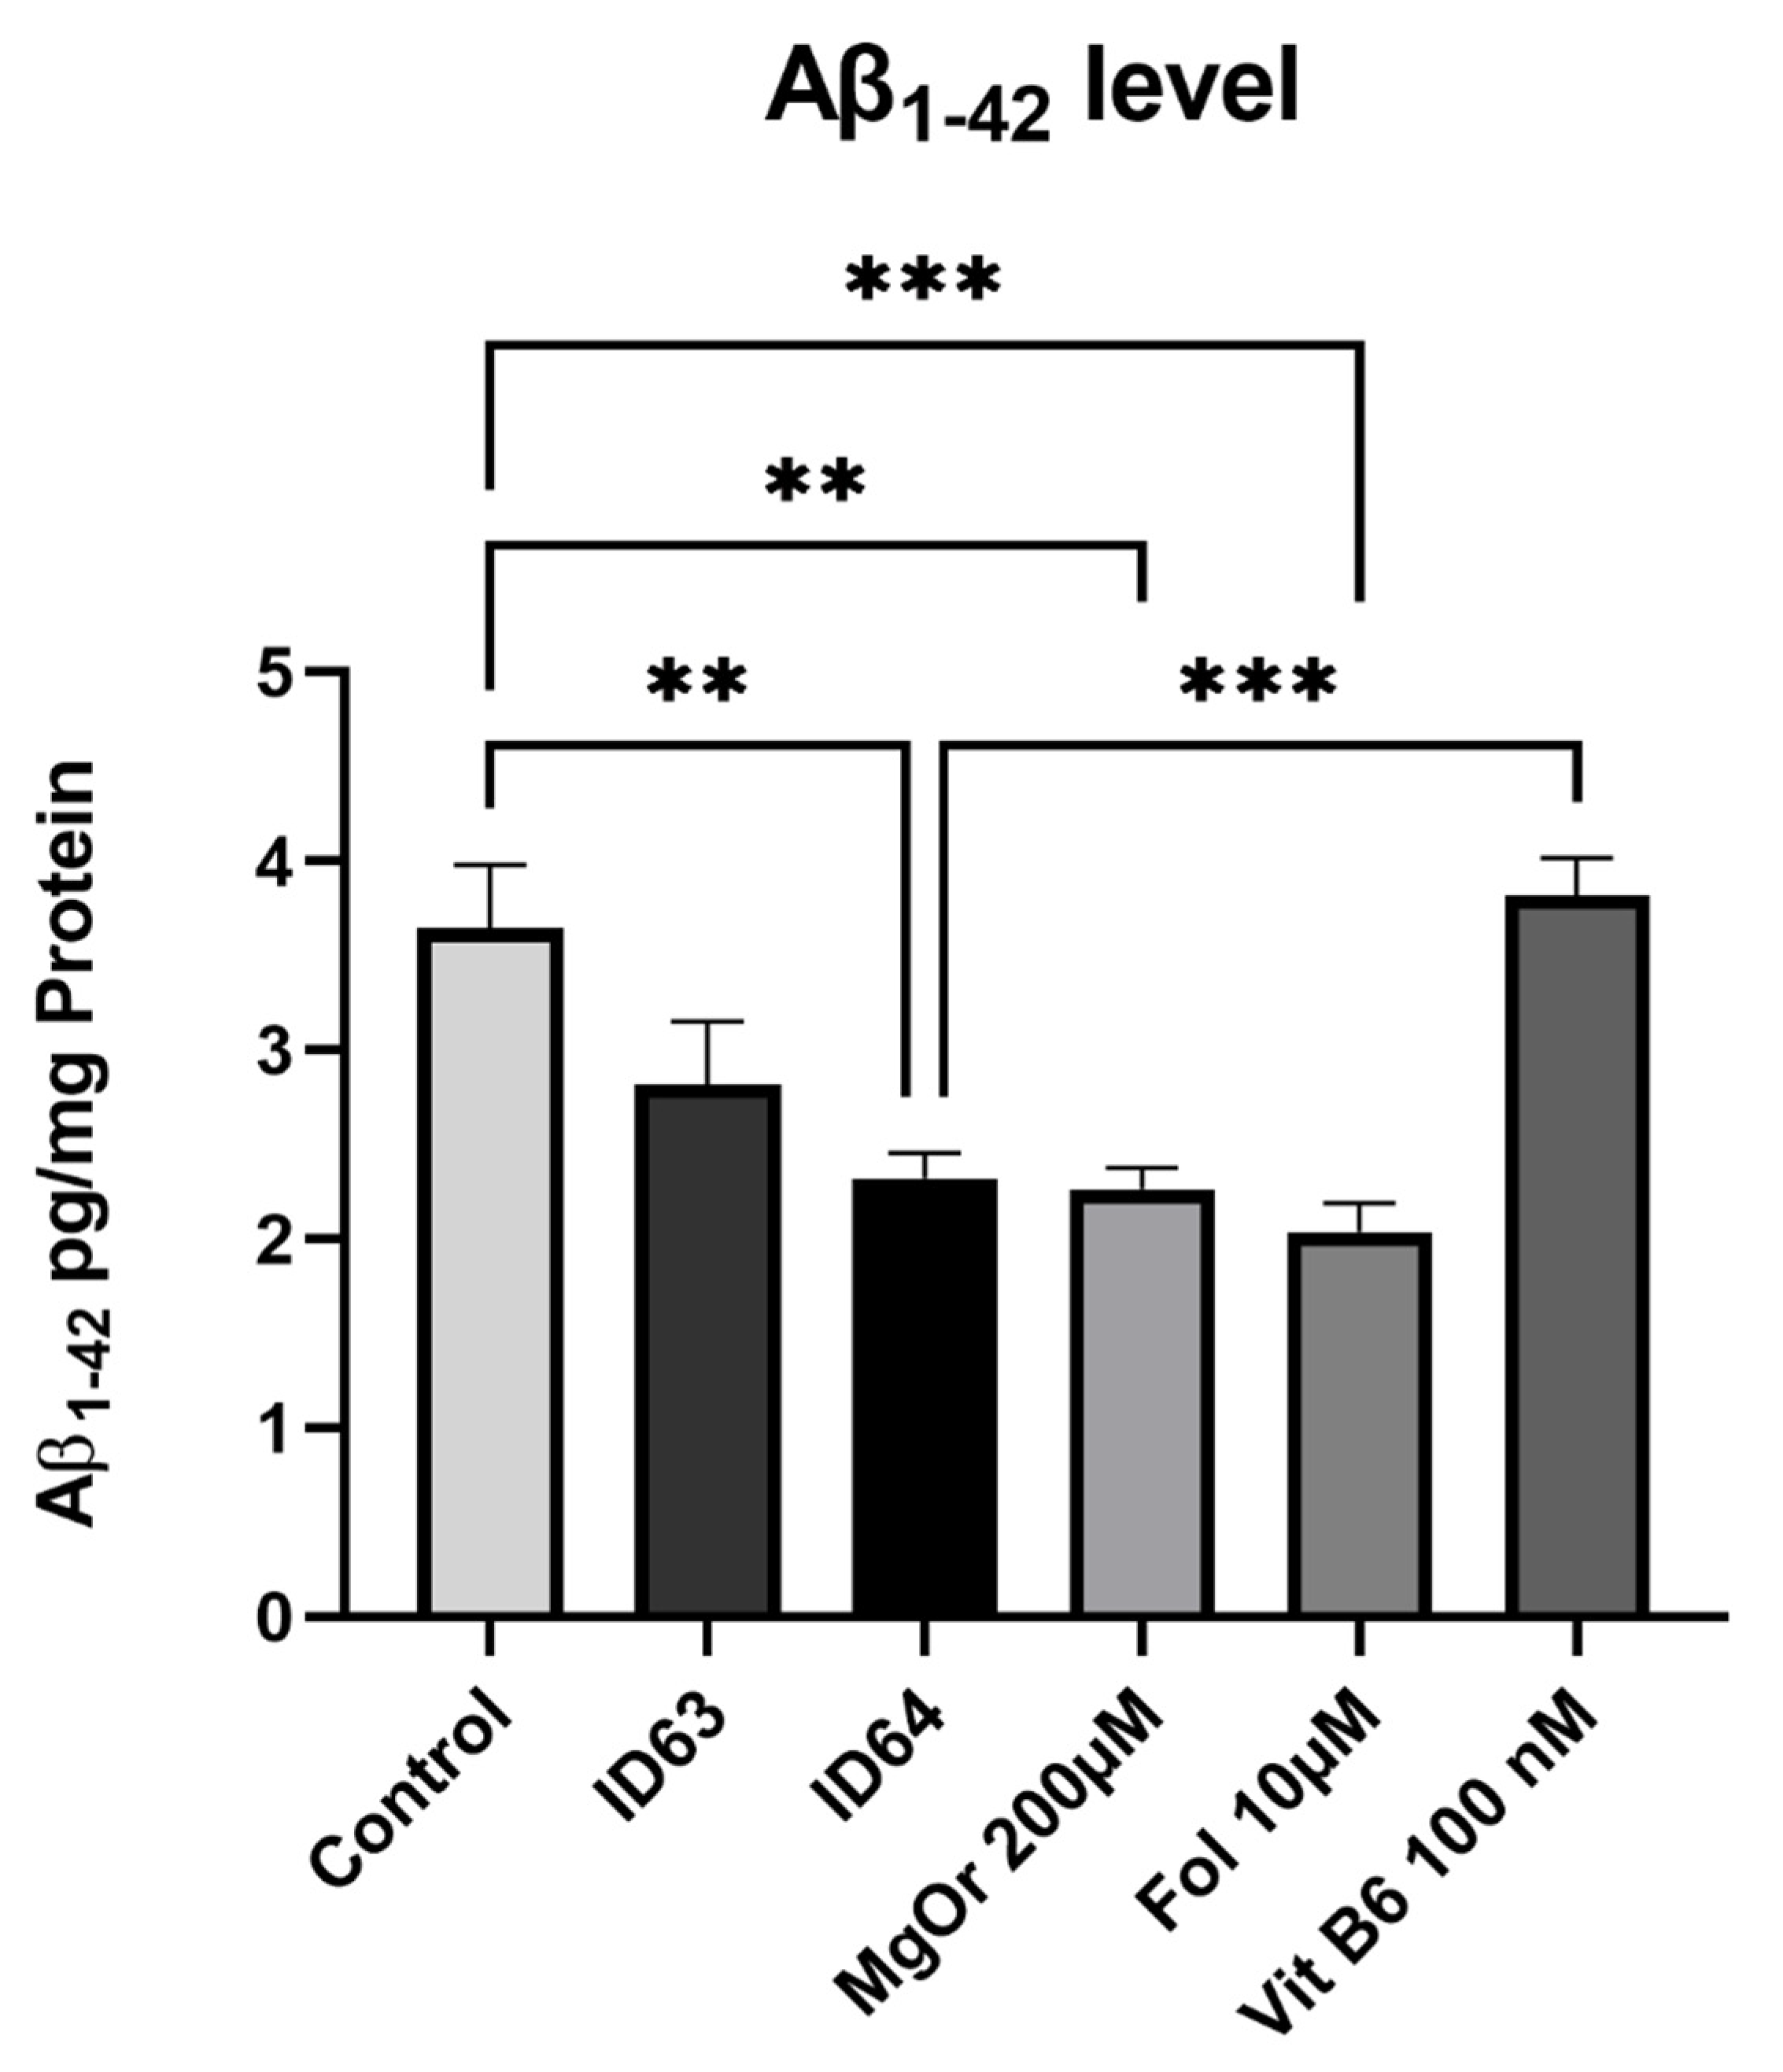
2.3. Aβ1–42 Production

To study the production of Aβ1–42, SH-SY5Y-APP695 cells were incubated for 24 h with ID63, ID64 or the single compounds (Figure 2). In comparison to the control, the single compounds MgOr (p = 0.0024) and folic acid (p = 0.0004), as well as the combination ID 64 (p = 0.0039) had a significant lowering effect on Aβ1–42 levels, while the combination ID63 had a slight reducing effect on the Aβ1–42 levels, although not a significant one. ID64 also showed significantly lower Aβ1–42 levels in comparison to B6 (p = 0.0009). However, folic acid alone, reduced the levels to a higher extent than any combinations.

2.4. sAPPα and sAPPβ Level

The α- and β-secretase cleaving products of APP, sAPPα (Figure 3A) and sAPPβ (Figure 3B), respectively, were determined after incubation with either ID63 or ID64 for 24 h. Figure 4A shows that ID63 had a significantly lowering effect on the sAPPα (p = 0.0214) compared to the control. ID64 had an even greater effect on the reduction of sAPPα fragments (p > 0.0001). In contrast to the sAPPα fragment production, the sAPPβ fragments (Figure 3B) were lowered compared to the control though not significantly. ID64 had a greater effect than ID63. It should be noted that basal levels of sAPPβ were approximately one hundredfold lower compared with sAPPα (Figure 3).

2.5. Effect on the Mitochondrial Function

To investigate the effect of ID63 and ID64 on mitochondrial function, we incubated SH-SY5Y-APP695 cells for 24 h with ID63 or ID64. Respiration under O2 consumption through the respiratory chain builds up the mitochondrial membrane potential, which allows ATP to be generated with the help of ATP synthase. First, we measured the ATP level after incubation with ID63 or ID64. Afterwards, the MMP was examined as well as the O2 consumption and citrate synthase activity (Figure 4).
Neither ID63 nor ID64 had an increased effect on the ATP level (Figure 5A,B) or an effect on the MMP level (Figure 4C,D). ID63 had a slightly increasing effect on the complex activity of complex I, II and IV compared to the control (Figure 4E). In contrast, ID64 had a slightly decreasing effect on the complex activity of complex II and IV (Figure 4F). Whereas ID63 had no effect on the citrate synthase activity compared with the control (Figure 4G), and ID64 even had a slightly decreasing effect compared with the control (Figure 4H). However, none of these effects is statistically significant.

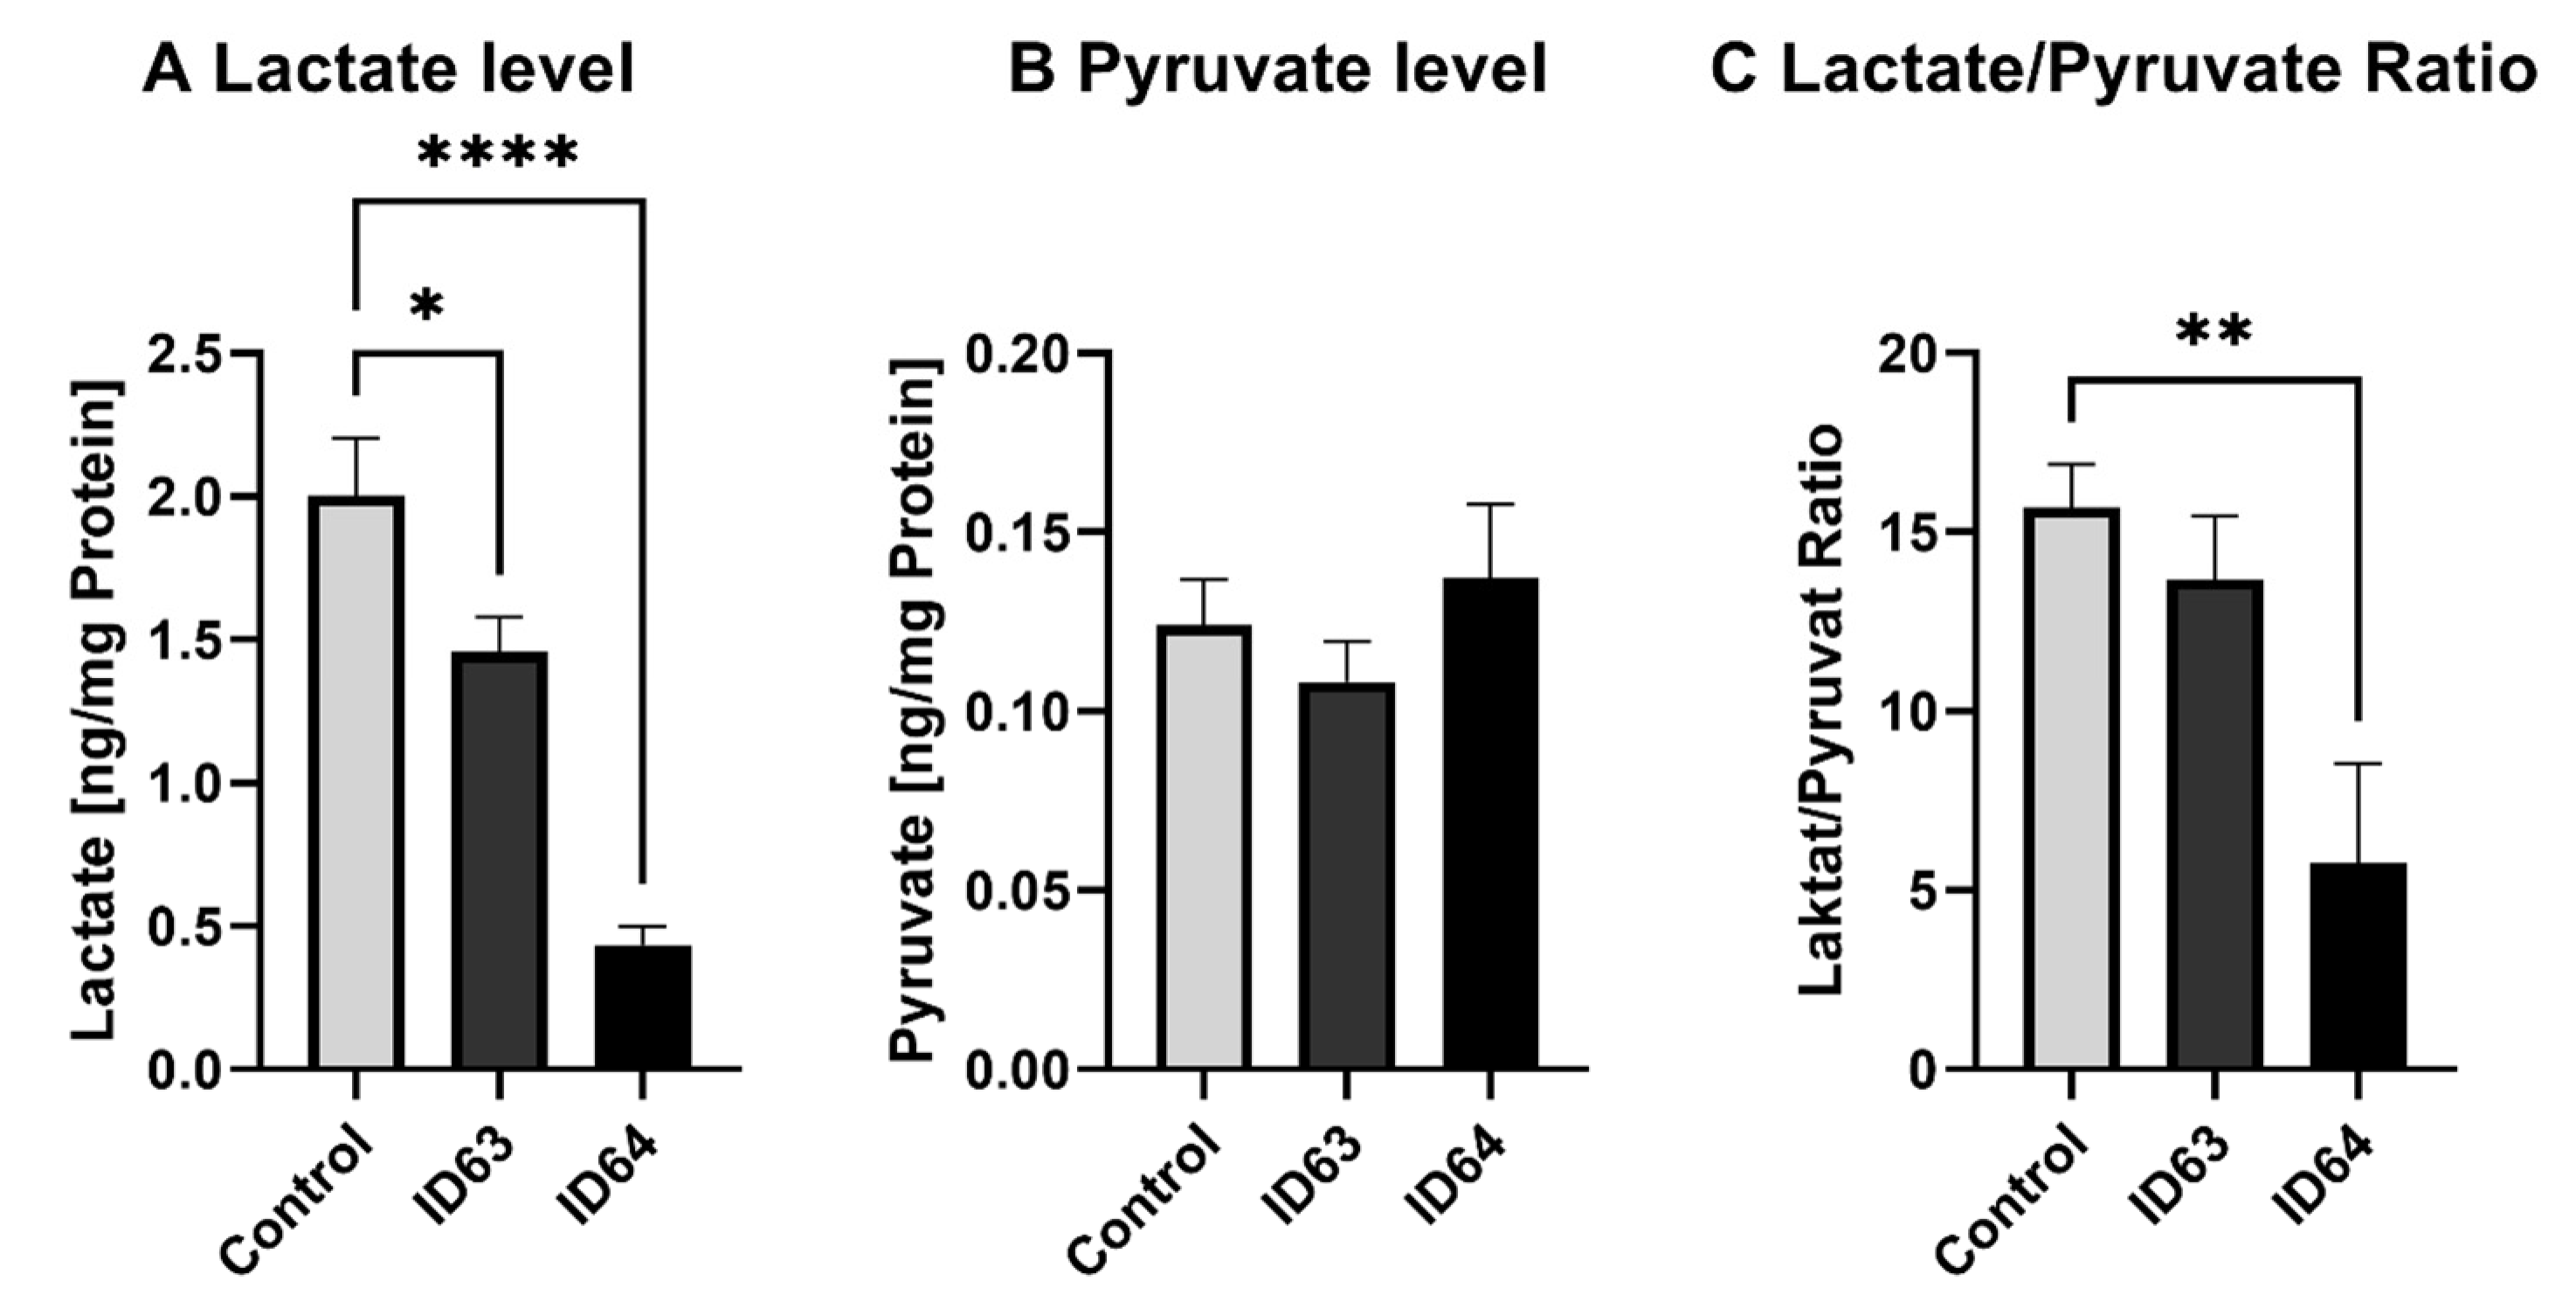
2.6. Lactate and Pyruvate Level
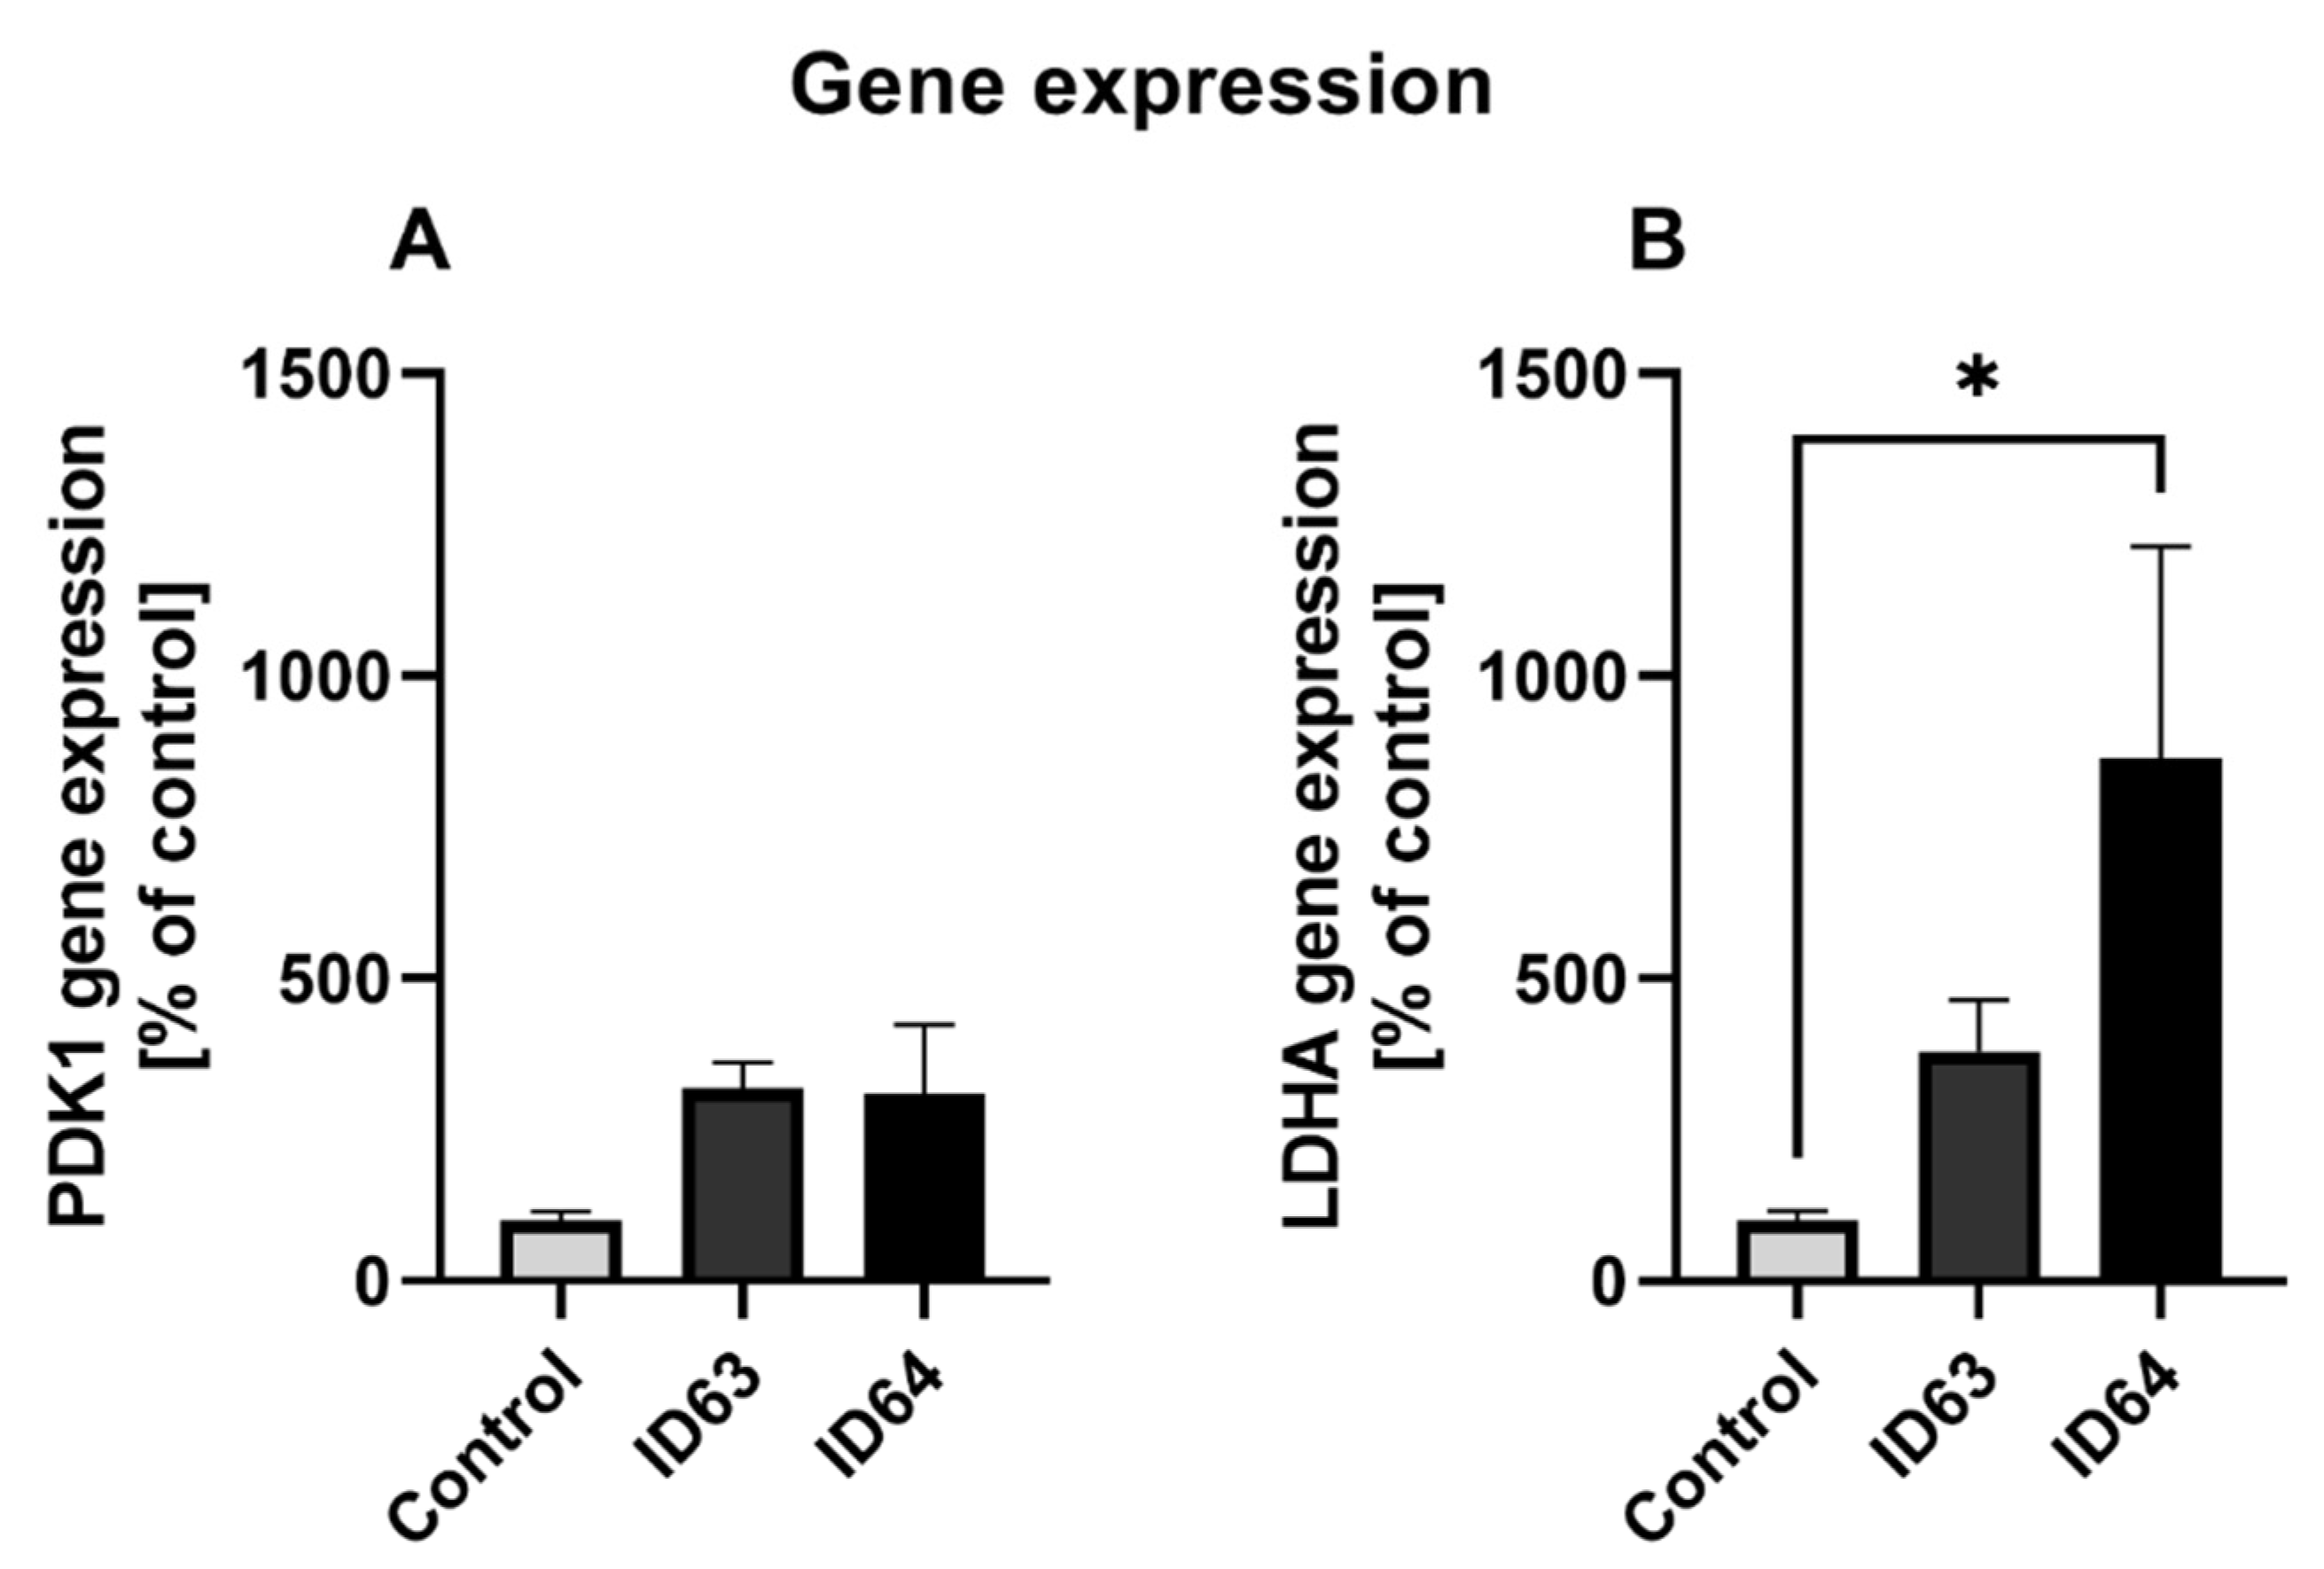
To investigate if the glycolysis is affected by ID63 or ID64, the lactate and pyruvate levels were measured. As seen in Figure 6, only lactate is significantly reduced by ID63 (p = 0.0328) and ID64 (p > 0.0001) compared to the control while pyruvate levels were not influenced. The ratio of lactate/pyruvate was significantly affected by ID64 (p = 0.0057) (Figure 5C).

2.7. qPCR

To investigate the molecular basis of altered lactate and pyruvate levels, the gene expression of pyruvate dehydrogenase kinase 1 (PDK1) and lactate dehydrogenase A (LDHA) were examined after 24 h incubation using qRT-PCR. ID63 and ID64 had no significant effect on PDK1 gene expression compared to the control (Figure 6). Both combinations increased LDHA mRNA levels (Figure 6B), with ID64 (p = 0.0148) showing a significant increase in gene expression.

2.8. Effect on the Lifespan of C. elegans in Heat Stress Survival Assay

To test the effect of the combinations in vivo two invertebrate AD-models were used. C. elegans CL2006 were incubated with the same compounds but in different concentrations. The single compounds Fol 50 µM (p > 0.0001), Vit B6 100 µM (p = 0.0397) and MgOr 100 µM (p = 0.001) had a significant life-extending effect compared to the control (see Figure 7A,B). As shown in Figure 7A, the ID63worm extended lifespan of CL2006 compared to the control by trend (p = 0.0502), whhereas in Figure 7B, it can be seen that ID64worm had a significant life-prolonging effect (p = 0.0002) compared to the control. Subsequently, the mean survival of the nematodes after the incubations of the combinations and single substances was assessed. Thereby Figure 7C shows that ID63worm (p = 0.0196), Fol 50 µM (p < 0.0001), MgOr 100 µM (p = 0.0004), ID64worm (p < 0.0001) and Vit B6 (p = 0.0107) had a significant increasing effect on the mean survival of the nematodes compared to the control. Folic acid alone was numerically more effective than the combinations or the other single compounds.

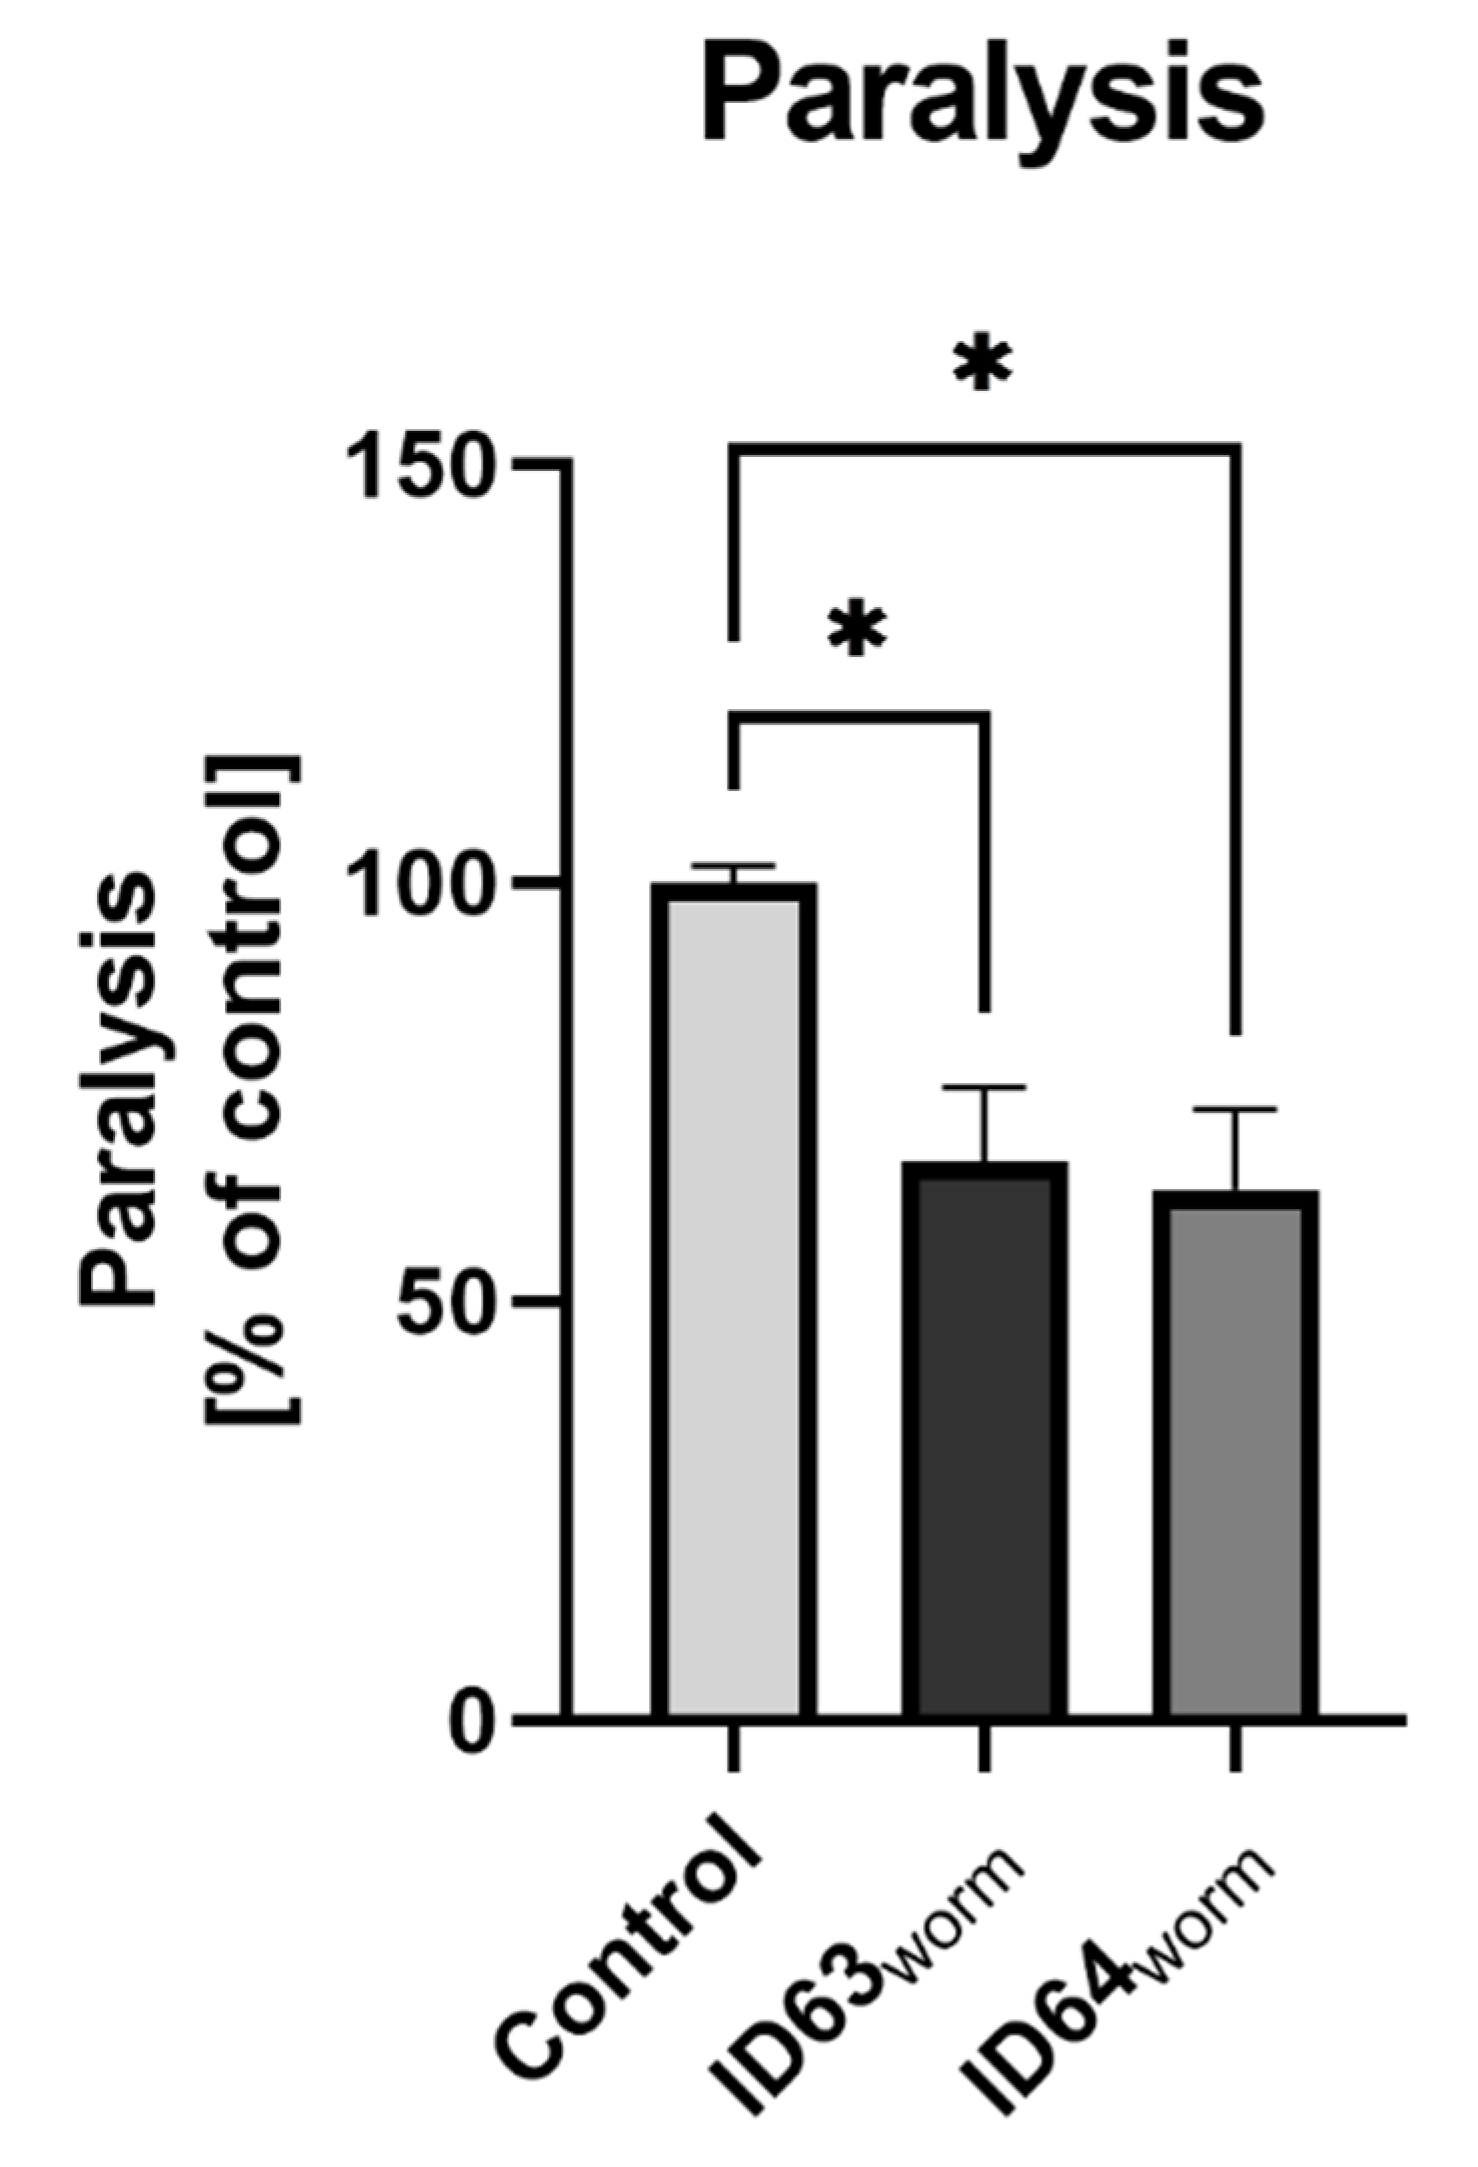
2.9. Effect on the Paralysis

To investigate the effect of combining biofactors on paralysis induced by Aβ, C. elegans GMC101 were incubated for 24 h at 25 °C with either ID63worm or ID64worm. Both combinations (p = 0.0243 for ID63worm and p = 0.0149 for ID64worm) were able to significantly decrease the paralysis induced by Aβ (Figure 8). Thus, the phenotype of this AD-worm was significantly enhanced by both biofactor combinations to a comparable extent.

2.10. Aβ1–42 Production in GMC101

To study the production of Aβ1–42 in nematodes, GMC101 was incubated for 24 h at 25 °C with both combinations and then the Aβ level was examined. There was no effect on the Aβ1–42 levels compared to the control (Figure 9). Since Aβ1–40 is not produced in GMC101 this amyloid peptide was not investigated.

2.11. Aβ1–42 Aggregation

To investigate the aggregation of Aβ in nematodes, GMC101 was incubated at 25 °C for 24 h and stained with thioflavine (ThT), which labels β-sheet structures of aggregated peptides. There was a significant reduction of Aβ-aggr by the combination ID63worm (p = 0.0324) compared to the control, whereas ID64worm was without an effect (Figure 10).

3. Discussion

In the present work, we examined the effect of MgOr, Fol and Vit B6 in different combinations on bioenergetic parameters including mitochondrial function and glycolysis, as well as Aβ production in cellular and invertebrate models of AD. We wanted to create a combination product that achieves an optimal result by combining several biofactors. The hit compounds used in the current study were selected after a screening of seven substances of interest whose concentrations used in the experiments were based on known literature values [37,43,44,45,46,47]. We selected the concentrations because they were mostly tested in our cell model, related to AD or cell survival and they were used in relative physiological concentrations. This resulted in the combinations ID63 and ID64. The combinations ID63 and ID64 significantly reduced Aβ1–40 levels in SH-SY5Y-APP695 cells compared to the control (Figure 1). Even when compared to the individual components of the combinations, ID63 was able to show an over additively reducing effect on Aβ levels. Similar results were obtained by Li et al. who found a dose-dependent decrease of Aβ1–40 levels by incubation with Fol, modulating DNA methyltransferase activity [48]. In a study with AD patients, an intervention with Fol significantly reduced Aβ levels and increased the concentration of s-adenosyl methionine (SAM) [49]. Low SAM levels are a risk factor for AD, whereby incubation with SAM led to a decrease in Aβ levels in SK-N-SH cells [50]. Fol and Vit B6 are essential for the SAM cycle [51]. It seems that in our SH-SY5Y model the additional administration of Vit B6 shows no additional effect on Aβ1–40 levels. Furthermore, lower Mg2+ are associated with the occurrence of AD which negatively affects brain energy metabolism [52]. In addition, low Mg levels are also negatively correlated with the occurrence of Aβ1–40 and Aβ1–42 [53]. As a result, an administration of Mg2+ leads to a decrease in Aβ levels of N2a-APP cells [37]. After the incubation with ID63, SH-SY5Y-APP695 cells showed reduced levels of Aβ1–42 compared to the control, although not significantly. In contrast, the incubation with ID64 showed a significant reduction of Aβ1–42 (Figure 2) compared to the control. Administration of a Fol-rich diet significantly reduced Aβ1–42 levels in APP/PS1 mice compared to the standard diet [54]. Similarly, the incubation with Mg significantly decreased Aβ1–42 production in Na2 neuroblastoma cells and transgenic mice [37,55,56]. In our work, we could not reproduce these described effects shown despite the administration of both substances in SH-SY5Y-APP695 cells. However, it seems that Vit B6 has a crucial role in the reduction of Aβ1–42 levels (ID64) even if Vit B6 alone showed no effects. In contrast, it did not provide any benefit at the Aβ1–40 level (Figure 1). Next, we examined sAPPα and -β levels after incubation with ID63 and ID64. The reducing effects on Aβ1–42 levels by ID64 in SH-SY5Y-APP695 cells could not be confirmed in transgene nematodes GMC101. On the one hand, incubation decreased the sAPPα levels significantly compared to the control (Figure 3A). On the other hand, both ID63 and ID64 had a reducing but not significant effect on the sAPPβ levels compared to the control (Figure 3B). Whereas it should be noted that the concentration of sAPPβ is 100 times lower than sAPPα. Studies showed that the concentration of sAPPα is generally higher than that of sAPPβ [57,58]. An application of Mg2+ increased the amount of sAPPα in APP/PS1 transgenic mice and simultaneously decreased the concentration of sAPPβ [37]. The results shown in this study [37], where both sAPPα and -β were decreased, could not be reproduced in our work. We assume that this was due to a general decrease in APP production, since the application of Fol can reduce APP processing [59,60], which in turn can affect sAPPα and -β, resulting in generally lowered levels.
Next, we tested ID63 and ID64 on MD in SH-SY5Y-APP695 cells. SH-SY5Y-APP695 cells show reduced ATP level, MMP and O2 consumption compared to their non-transfected SH-SY5Y-MOCK cells [61]. Mg and Fol are vital compounds for enzymes and ATP production in cells [31,33,36]. A deficit leads to the reduced production of ATP [31,34]. In our case, which is not a deficit model, we did not observe any improvement in ATP level, MPP, O2 consumption or citrate synthase activity in SH-SY5Y-APP695 cells (Figure 4). In a study by Viel et al. using a similar cocktail consisting of some of our compounds, the mitochondrial complex activity in a transgenic rat model was increased to that of wild type rats [28]. This effect is not found in our case, possibly due to the additional substances contained in the cocktail, which had been the decisive factor here.
It has been shown that in the brains of AD patients there is a switch from aerobic respiration to glycolytic metabolism [62,63]. This is accompanied by an increase in lactate and pyruvate values [64,65], which results from insufficient utilization in oxidative phosphorylation [66]. Both biofactor combinations used in our investigations were able to significantly reduce the lactate values compared to the untreated control cells. The switch to increased oxidative phosphorylation could not be shown in our work, because there was no effect on ATP, MMP, OXPHOS or citrate synthase activity in the respiratory chain. To investigate the impact of the two combinations on the glycolytic genes, mRNA levels of PDK1 and LDHA were determined (Figure 6). There was an increase in the expression of PDK1 by both combinations compared to the control. PDK1 phosphorylates pyruvate dehydrogenase and inactivates it. This may lead to a reverse transport of pyruvate from the mitochondrion into the cytosol, where it is used for glycolytic energy production via lactate [67,68]. Both combinations were able to increase the expression of LDHA, while ID64 did so significantly. LDHA converts pyruvate to lactate and vice versa [23,69], although the expression was increased there were decreased lactate levels with both ID63 and ID64 (Figure 5). By upregulating PDK1 and LDHA expression, the cell may reduce the effects of Aβ toxicity and ROS production by shifting from mitochondrial to glycolytic energy production [23,69]. Both combinations appear to support this process, resulting in an upregulation of expression relative to control.
Based on the results obtained, especially those related to Aβ, we wanted to test our compounds in another model of AD. For this purpose, we adjusted the concentrations and tested them in two invertebrate models of AD. CL2006 and GMC101 both express human Aβ in their muscle cells. While CL2006 produces Aβ continuously at 20 °C [70], GMC101 needs a temperature shift to 25 °C to initiate Aβ production [71]. Phenotypically, both are identified like wild-type N2 [72]. ID63worm had no significant life-prolonging effect on CL2006 compared to the control. Whereas the single substances and ID64worm had a significant effect on the lifespan (Figure 7A,B). In contrast, all tested combinations and single substances, have a significantly increased effect on mean survival (Figure 7C). CL2006 continuously produces Aβ, which has a toxic effect on the lifespan [70,73]. In particular, it has effects on DAF-16, which is expressed in the nucleus during stress and has an effect on life span extension [74]. DAF-16 is notable for being responsible for activating genes involved in longevity, lipogenesis, heat shock survival and oxidative stress responses [75,76], homologs being found in C. elegans, humans and mice [77]. It was demonstrated that incubation with Fol extended the lifespan by increasing the expression of DAF-16 [78]. It seems that the substances used have a similar effect on lifespan, whereas the single substance Fol seems to be superior. Furthermore, it was investigated whether the substances can reduce the toxic effect caused by Aβ. For this purpose, it was examined whether the paralysis in GMC101 changes because of the administration (Figure 8). Both combinations were able to reduce the paralyzes, indicating the significantly reduced toxicity of Aβ. Similar effects have been shown with other substances, which reduced the paralysis and thus the toxicity of Aβ [73,79,80,81]. The reduced toxicity could be a consequence of the reduction of Aβ levels in C. elegans. It could be shown that the administration of single substances leads to a reduction of the Aβ levels [37,48,50,54,55]. To verify this, the Aβ1–42 levels were determined in GMC101 (Figure 9). Here, we found no significant effect in reduced Aβ level after incubation with both combinations. It should be noted here that the effects on Aβ1–42 were also relatively moderate in the cells (see above). Aβ1–40 was not measured in GMC101 because the worm does not produce these peptides. To examine the aggregation of Aβ after incubation with both combinations, samples were stained with ThT, which labels Aβ-structures in proteins (Figure 10). A significant reduction in Aβ-aggr was observed after incubation with ID63worm. The combination with additional vitamin B6 did not reduce aggregation further. A similar effect was found in a study by Yu et al., in which the aggregation of Aβ in mice was reduced by incubation with magnesium [82].
It remains to be considered that there are both advantages and disadvantages to administering the substances as a single or combination preparation. Combined administration could lead to synergistic effects that enhance the positive effects and thus lead to an additive effect, as shown in the Aβ1–40 values Figure 1. However, it cannot be ruled out that negative effects may occur when more than one substance is administered, as the substances may influence each other. Complex formation or competition for transport systems into the cell could occur. Especially when moving from an in vitro to an in vivo experiment. In order to exclude these effects, further experiments will have to be carried out in the future.

4. Materials and Methods

4.1. Cell Culture

The cultivation of SY5Y cells was performed in 75 cm2 cell culture flasks under sterile conditions. To ensure optimal growth, cells were split several times per week once a cell density of approximately 70–80% was reached. All cells were cultured in an incubator at 37 °C and 5% CO2 in DMEM supplemented with 10% (v/v) heat-inactivated fetal calf serum, 60 µg/mL streptomycin, 0.3 mg/mL hygromycin, 1% MEM non-essential amino acids, and 1 mM sodium pyruvate 1%, 60 units/mL penicillin. SH-SY5Y cells were stably transfected with DNA constructs harboring human wild-type APP695 (APP695) and were kindly donated by A. Eckert (Basel, Switzerland) (for details; please refer to [83]).

4.2. Cell Treatment

First of all, cells were incubated for 24 h with different concentrations of zinc orotate (ZnOr), magnesium-orotate (MgOr), benfotiamine (vitamin B1), folic acid (Fol), cholecalciferol (Vit D3), cobalamin (Vit B12), and pyridoxine (Vit B6) for possible hit substances. After the hit substances were determined, cells were incubated with 200 µM magnesium-orotate (MgOr) and folic acid 10 µM (Fol) (combination ID63) or 200 µM MgOr, 10 µM folic acid and 100 nM Vit B6 (combination ID64). We have derived the concentrations used here from the literature [37,43,44,45,46,47]. The solution medium NaOH diluted 1:8 with water served as a control. The ratio had the best dissolving properties without being toxic to the cells.

4.3. ATP Measurement

A bioluminescence assay was used to determine the ATP levels, which is based on the production of light from ATP and luciferin in the presence of luciferase. The test was performed using the ATPlite Luminescence Assay System (PerkinElmer, Rodgau, Germany) according to the previously published protocol [84].

4.4. MMP Measurement

Mitochondrial membrane potential (MMP) was measured using the fluorescence dye rhodamine-123 (R123). Cells were incubated for 15 min with 0.4 µM R123 and centrifuged at 750× g for 5 min before being washed with Hank’s Balanced Salt Solution (HBSS) buffer supplemented with Mg2+, Ca2+, and HEPES. The cells were suspended with fresh HBSS before they were evaluated by measuring the R123 fluorescence. The excitation wavelength was set to 490 nm and the emission wavelength to 535 nm witch CLARIOstar (BMG Labtech, Ortenberg, Germany).

4.5. Cellular Respiration

Respiration in SH-SY5Y695 cells was assessed using an Oxygraph-2k (Oroboros, Innsbruck, Austria) and DatLab 7.0.0.2. The cells were treated according to a complex protocol developed by Dr. Erich Gnaiger [85]. They were incubated with different substrates, inhibitors and uncouplers. First, cells were washed with PBS (containing potassium chloride 26.6 mM, potassium phosphate monobasic 14.705 mM, sodium chloride 1379.31 mM and sodium phosphate dibasic 80.59 mM) and scraped into mitochondrial respiration medium (MiRO5) developed by Oroboros [85]. Afterwards, the cells were centrifuged, resuspended in MiRO5, and diluted to 106 cells/mL. After 2 mL of cell suspension was added to each chamber and endogenous respiration was stabilized, the cells were treated with digitonin (10 µg/106 cells) to permeabilize the membrane, leaving the outer and inner mitochondrial membrane intact. OXPHOS was measured by adding the complex I and II substrates malate (2 mM), glutamate (10 mM) and ADP (2 mM), followed by succinate (10 mM). Gradual addition of carbonyl cyanide-4- before it is evaluated by measuring the R123 fluorescence (trifluoromethoxy) phenylhydrazone showed the maximum capacity of the electron transfer system. Rotenon (0.1 mM) was added to measure the activity of complex II. To investigate the leak respiration, oligomycin (2 µL/mL) was injected. To inhabitation of complex III to determined residual oxygen consumption, antimycin A (2.5 µM) was added. This value was subtracted from all respiratory states. Adding N measured N, N′, N′-tetramethyl-p-phenylenediamine (0.5 mM) and ascorbate (2 mM) the activity of complex IV. To measure the sodium autoxidation rate, azide (≥100 mM) was added. Afterwards, complex IV respiration was corrected by subtracting the autoxidation rate of azid. NaOH served as control.

4.6. Citrate Synthase Activity

Cell samples from respirometry measurements were frozen and stored at −80 °C for the determination of citrate synthase activity. Samples were thawed while the reaction mix (0.1 mM 5,5′-dithiol-bis-(2-nitrobenzoic acid) (DTNB), 0.5 mM oxaloacetate, 50 μM EDTA, 0.31 mM acetyl coenzyme A, 5 mM triethanolamine hydrochloride, and 0.1 M Tris-HCl) was mixed and heated at 30 °C for 5 min. Afterwards, 40 µL of samples were submitted in triplets and mixed with 110 µL of the reaction mix. The absorption was measured at 412 nm.

4.7. Aβ1–40 Measurement

After 24 h incubation, the Aβ1–40 levels were determined in SH-SY5Y-APP695 cells using HTRF Amyloid-Beta 1–40 kit (Cisbio, Codolet, France). The protocol was the same as described earlier [61]. Aβ concentrations were normalized against protein content.

4.8. Aβ1–42 Measurement

After 24 h incubation, the Aβ1–42 levels were determined in SH-SY5Y-APP695 cells and nematodes GMC101 using the Human-Aβ1–42 ELISA Kit (InvitrogenTM, Waltham, MA, USA). The protocol was performed according to the manufacturer’s instructions. Aβ concentrations were normalized against protein content.

4.9. Protein Quantification

Protein content was determined using a PierceTM Protein Assay Kit (Thermo Fisher Scientific, Waltham, MA, USA) according to the manufacturer’s instructions. Bovine serum albumin was used as a standard.

4.10. Quantification of Human Soluble Amyloid Precursor Protein α (sAPPα)

The sample preparation was the same according to the Aβ1–40 quantification. The sAPPα levels were determined using the Human Soluble Amyloid Precursor Protein α (sAPPα) ELISA Kit (Cusabio, Wuhan, China). The process was carried out according to the manufacturer’s instructions. Levels were normalized to the protein content.

4.11. Quantification of Human Soluble Amyloid Precursor Protein β (sAPPβ)

The sample preparation was the same according to the Aβ1–40 quantification. The sAPPβ levels were determined using the Human Soluble Amyloid Precursor Protein β (sAPPβ) ELISA Kit (BT LAB, Zhejiang, China). The process was carried out according to the manufacturer’s instructions. Levels were normalized to the protein content.

4.12. Pyruvate and Lactate Content

Frozen cells, which were previously harvested and incubated for 24 h, were thawed at room temperature. Pyruvate and lactate concentrations were assessed using a pyruvate assay kit (MAK071, Sigma Aldrich, Darmstadt, Germany) and a lactate assay kit (MAK064, Sigma Aldrich, Darmstadt, Germany) according to the manufacturer’s instructions.

4.13. Real-Time qRT-PCR

To isolate RNA, we used the RNeasy Mini Kit (Qiagen, Hilden, Germany) according to the manufacturer’s guidelines. NanodropTM 2000c spectrometer (Thermo Fisher Scientific, Waltham, MA, USA) was used to quantify RNA. The TURBO DNA-freeTM kit was used according to the manufacturer’s instructions (Thermo Fisher Scientific, Waltham, MA, USA) to remove residual genomic DNA. cDNA was synthesized from 1 µg total RNA using an iScript cDNA Synthesis Kit (Bio-Rad, Munich, Germany). qRT-PCR was conducted using a CfX 96 Connect™ system (Bio-Rad, Munich, Germany). All used primers are listed in Table 2. The cDNA aliquots were analyzed in triplicate and diluted 1:10 with RNase-free water (Qiagen, Hilden, Germany). PCR cycling conditions were as follows: initial denaturation for 3 min at 95 °C, followed by 45 cycles at 95 °C for 10 s, 58 °C for 30 s (or 56 °C for 45 s, depending on the primer), and 72 °C for 29 s. Expression was analyzed with −(2∆∆Cq) using Bio-Rad CfX manager software. To normalize the values a factor was calculated based on the geometric mean of the levels of multiple control genes of ß-actin (ACTB), glyceraldehyde-3-phosphate dehydrogenase (GAPDH), and phosphoglycerate kinase 1 (PGK1) according to the MIQE guidelines [86]. RNA free water served as an assay control to exclude impurities.

4.14. Nematode and Bacterial Strain

C. elegans strains were obtained from the Caenorhabditis Genetics Center (University of Minnesota, MN, USA) and included CL2006 [Punc-54::human A-beta 3–42; pRF4 (rol-6(su1006))] and GMC101 [(Punc-54::A-beta::unc-54 3Prime UTR; Pmtl2::GFP)]. The strain GMC101 expresses the full-length human Aβ1–42 peptide in body-wall muscle cells that aggregates in vivo. Shifting L4 or young adult animals from 20 °C to 25 °C could induce the expression of Aβ and cause paralysis. The strain CL2006 constitutively expressed Aβ when cultured at 20 °C.
Nematodes were maintained on nematode growth medium (NGM) agar plates seeded with the bacterial E. coli strain OP50. According to standard protocols, the seeded plates were stored at 20 °C [87]. Synchronous populations were generated for all experiments by using a standard bleaching protocol [88].

4.15. Cultivation and Treatment

Post-bleaching generated larvae were washed twice in M9-buffer and the number of larvae in 10 µL were adjusted to 10 larvae. Afterward, the synchronized larvae were raised in cell culture flasks (Sarstedt, Nümbrecht, Germany) in either an amount of 1000 or 5000 nematodes, depending on the experiments. OP50-NGM was added to the flasks as a standardized source of food. The larvae were maintained under shaking at 20 °C until they reached young adulthood within 3 days. The micronutrients were dissolved in advance in M9 buffer. For each micronutrient observed in this study, we generated a series of concentrations as follows. Folic acid (Fol) 50 µM, magnesium orotate (MgOr) 0.1 mM (together ID63worm) and Fol 50 µM, MgOr 0.1 mM and vitamin B6 (Vit B6) 100 µM (together ID64worm). After reaching adulthood (48 h before the experiment), the micronutrients were added to the flasks. Pure M9-buffer was used as a control. Then, 24 h before the experiment amyloid aggregation was proceeded by upshifting young adult GMC101 from 20 °C to 25 °C.

4.16. Paralyze Assay

Cell culture flasks containing approximately 1000 adult amyloid beta producing nematodes were incubated for several hours to achieve Aβ induced paralysis (GMC101 24 h at 25 °C). On a NGM Agar Plate, 25 nematodes were placed and by physically touching with a platinum tip the paralysis status was recorded. Nematodes which normally act after being touched by the wire are recognized as “not paralyzed” whereas uncoordinated movements or just head movements were recorded as “paralyzed”.

4.17. Heat-Stress Survival Assay

After 48 h of incubation of CL2006 with the mentioned effectors, the time till death was determined using a microplate thermotolerance assay [89]. In preparation, the nematodes were washed out of the flasks with M9-buffer into 15 mL tubes followed by 3 additional washing steps. Each well of a black 384-well low-volume microtiter plate (Greiner Bio-One, Frickenhausen, Germany) was prefilled with 6.5 µL M9-buffer/Tween®20 (1% v/v). In the following step, one nematode in 1 µL M9-buffer was transferred and immersed in the well under a stereomicroscope (Breukhoven Microscope systems, Netherlands). SYTOX™ Green (Life Technologies, Karlsruhe, Germany) in a final concentration of 1 µM was added to reach a final volume of 15 µL in the well. SYTOX™ Green creates a fluorescent signal after binding to DNA. The plates were sealed with a Rotilab sealing film (Greiner Bio-One, Frickenhausen, Germany). The heat-shock was applied and the fluorescence was measured every 30 min for 17 h at 37 °C following the protocol previously described [90]. The excitation was set at 485 nm and the emission was detected at 538 nm.

4.18. ThT Dying of Aβ Aggregates

Detection and quantification of Aβ aggregates (Aβ-aggr) in GMC101 were performed using the fluorescent dye thioflavin T (ThT) according to a previously described method with minor modifications [91]. Synchronized and heat incubated nematodes were washed out of the cell culture flasks with M9-buffer/Tween®20 (1% v/v) and separated from larvae. After centrifugation, 200 µL of a thick pellet of nematodes was transferred into a microcentrifuge tube and were frozen in liquid nitrogen. Samples were thawed with 500 µL of PBS including proteinase inhibitor. Afterward, the samples were homogenized with a sonifier 3 × 20 s on ice. Protein contents in the homogenate were assessed according to the Pierce™ BCA Protein Assay Kit (Thermo Fisher Scientific, Waltham, MA, USA). Bovine serum albumin was used as a standard. Finally, fluorescence was measured in a black 96-well plate by adding 1 mM ThT (final concentration 20 mM). The volume in each well was 100 µL by adding M9. To determine the fluorescence of ThT, samples were measured by excitation at 440 nm and emission at 482 nm.

4.19. Statistics

Unless otherwise stated, values are presented as mean ± standard error of the mean (SEM). Statistical analyses were performed by applying one-way ANOVA with Tukey’s multiple comparison post-hock test, log-rank (Mantel-Cox) test and student’s unpaired t-test (Prism 9.1 GraphPad Software, San Diego, CA, USA). Statistical significance was defined for p values ns = not significant, * p < 0.05, ** p < 0.01, *** p < 0.001 and **** p < 0.0001.

5. Conclusions

In the present study, we reported that different combinations of folic acid, magnesium orotate, and vitamin B6 had significant effects on glycolysis, Aβ production, and Aβ aggregation in SH-SY5Y-APP695 cells and C. elegans. The phenotype of the in vivo model was significantly improved, highlighting the potential of the tested biofactor combinations as candidate therapeutics in AD. However, since the data did not consistently show a benefit of either combination, this study does not allow a clear statement as to whether vitamin B6 is required in addition to the combination of folic acid and magnesium orotate.

Author Contributions

Investigation, L.B., F.S., Y.F. and T.H.; Supervision, G.P.E.; Writing—original draft, L.B. All authors have read and agreed to the published version of the manuscript.

Funding

This research received grants from the Wörwag Pharma Böblingen, Germany (#82540149).

Institutional Review Board Statement

Not applicable.

Informed Consent Statement

Not applicable.

Data Availability Statement

The data presented in this study are available on request from the corresponding author.

Acknowledgments

We would like to thank the Wörwag Pharma GmbH & Co. KG and the research team for their support of our research.

Conflicts of Interest

The authors declare that they have no conflict of interest.

References

  1. Livingston, G.; Huntley, J.; Sommerlad, A.; Ames, D.; Ballard, C.; Banerjee, S.; Brayne, C.; Burns, A.; Cohen-Mansfield, J.; Cooper, C.; et al. Dementia prevention, intervention, and care: 2020 report of the Lancet Commission. Lancet 2020, 396, 413–446. [Google Scholar] [CrossRef]
  2. Breijyeh, Z.; Karaman, R. Comprehensive Review on Alzheimer’s Disease: Causes and Treatment. Molecules 2020, 25, 5789. [Google Scholar] [CrossRef] [PubMed]
  3. Ortiz, J.M.P.; Swerdlow, R.H. Mitochondrial dysfunction in Alzheimer’s disease: Role in pathogenesis and novel therapeutic opportunities. J. Cereb. Blood Flow Metab. 2019, 176, 3489–3507. [Google Scholar] [CrossRef]
  4. Gallardo, G.; Holtzman, D.M. Amyloid-β and Tau at the Crossroads of Alzheimer’s Disease. Tau Biol. 2019, 1184, 187–203. [Google Scholar] [CrossRef]
  5. Landau, S.M.; Harvey, D.; Madison, C.M.; Koeppe, R.A.; Reiman, E.M.; Foster, N.L.; Weiner, M.W.; Jagust, W.J.; The Alzheimer’s Disease Neuroimaging Initiative. Associations between cognitive, functional, and FDG-PET measures of decline in AD and MCI. Neurobiol. Aging 2011, 32, 1207–1218. [Google Scholar] [CrossRef] [PubMed] [Green Version]
  6. Chandrasekaran, K.; Giordano, T.; Brady, D.R.; Stoll, J.; Martin, L.J.; Rapoport, S.I. Impairment in mitochondrial cytochrome oxidase gene expression in Alzheimer disease. Mol. Brain Res. 1994, 24, 336–340. [Google Scholar] [CrossRef]
  7. Parker, W.D., Jr.; Parks, J.; Filley, C.M.; Kleinschmidt-DeMasters, B.K. Electron transport chain defects in Alzheimer’s disease brain. Neurology 1994, 44, 1090–1096. [Google Scholar] [CrossRef]
  8. Müller, W.E.; Eckert, A.; Kurz, C.; Eckert, G.P.; Leuner, K. Mitochondrial Dysfunction: Common Final Pathway in Brain Aging and Alzheimer’s Disease—Therapeutic Aspects. Mol. Neurobiol. 2010, 41, 159–171. [Google Scholar] [CrossRef] [PubMed]
  9. Wang, X.; Su, B.; Zheng, L.; Perry, G.; Smith, M.A.; Zhu, X. The role of abnormal mitochondrial dynamics in the pathogenesis of Alzheimer’s disease. J. Neurochem. 2009, 109, 153–159. [Google Scholar] [CrossRef] [Green Version]
  10. Rhein, V.; Song, X.; Wiesner, A.; Ittner, L.M.; Baysang, G.; Meier, F.; Ozmen, L.; Bluethmann, H.; Dröse, S.; Brandt, U.; et al. Amyloid-β and tau synergistically impair the oxidative phosphorylation system in triple transgenic Alzheimer’s disease mice. Proc. Natl. Acad. Sci. USA 2009, 106, 20057–20062. [Google Scholar] [CrossRef] [Green Version]
  11. Chen, G.F.; Xu, T.H.; Yan, Y.; Zhou, Y.R.; Jiang, Y.; Melcher, K.; Xu, H.E. Amyloid beta: Structure, biology and structure-based therapeutic development. Acta Pharmacol. Sin. 2017, 38, 1205–1235. [Google Scholar] [CrossRef] [PubMed]
  12. Nunan, J.; Small, D.H. Regulation of APP cleavage by α-, β- and γ-secretases. FEBS Lett. 2000, 483, 6–10. [Google Scholar] [CrossRef] [Green Version]
  13. Gu, L.; Guo, Z. Alzheimer’s Aβ42 and Aβ40 peptides form interlaced amyloid fibrils. J. Neurochem. 2013, 126, 305–311. [Google Scholar] [CrossRef]
  14. Kuperstein, I.; Broersen, K.; Benilova, I.; Rozenski, J.; Jonckheere, W.; Debulpaep, M.; Vandersteen, A.; Segers-Nolten, G.M.; Van Der Werf, K.; Subramaniam, V.; et al. Neurotoxicity of Alzheimer’s disease Aβ peptides is induced by small changes in the Aβ42 to Aβ40 ratio. EMBO J. 2010, 29, 3408–3420. [Google Scholar] [CrossRef] [PubMed]
  15. Pauwels, K.; Williams, T.L.; Morris, K.L.; Jonckheere, W.; Vandersteen, A.; Kelly, G.; Schymkowitz, J.; Rousseau, F.; Pastore, A.; Serpell, L.C.; et al. Structural Basis for Increased Toxicity of Pathological Aβ42:Aβ40 Ratios in Alzheimer Disease. J. Biol. Chem. 2012, 287, 5650–5660. [Google Scholar] [CrossRef] [PubMed] [Green Version]
  16. Chasseigneaux, S.; Allinquant, B. Functions of Aβ, sAPPα and sAPPβ: Similarities and differences. J. Neurochem. 2011, 120, 99–108. [Google Scholar] [CrossRef]
  17. Zhang, H.; Ma, Q.; Zhang, Y.-W.; Xu, H. Proteolytic processing of Alzheimer’s β-amyloid precursor protein. J. Neurochem. 2011, 120, 9–21. [Google Scholar] [CrossRef] [Green Version]
  18. Yin, F.; Sancheti, H.; Patil, I.; Cadenas, E. Energy metabolism and inflammation in brain aging and Alzheimer’s disease. Free Radic. Biol. Med. 2016, 100, 108–122. [Google Scholar] [CrossRef] [Green Version]
  19. Blass, J.P.; Sheu, R.K.-F.; Gibson, G.E. Inherent Abnormalities in Energy Metabolism in Alzheimer Disease: Interaction with Cerebrovascular Compromise. Ann. N. Y. Acad. Sci. 2000, 903, 204–221. [Google Scholar] [CrossRef]
  20. Harris, R.A.; Tindale, L.; Lone, A.; Singh, O.; Macauley, S.L.; Stanley, M.; Holtzman, D.M.; Bartha, R.; Cumming, R.C. Aerobic Glycolysis in the Frontal Cortex Correlates with Memory Performance in Wild-Type Mice But Not the APP/PS1 Mouse Model of Cerebral Amyloidosis. J. Neurosci. 2016, 36, 1871–1878. [Google Scholar] [CrossRef] [Green Version]
  21. Soucek, T.; Cumming, R.; Dargusch, R.; Maher, P.; Schubert, D. The Regulation of Glucose Metabolism by HIF-1 Mediates a Neuroprotective Response to Amyloid Beta Peptide. Neuron 2003, 39, 43–56. [Google Scholar] [CrossRef] [Green Version]
  22. Zhang, M.; Cheng, X.; Dang, R.; Zhang, W.; Zhang, J.; Yao, Z. Lactate Deficit in an Alzheimer Disease Mouse Model: The Relationship with Neuronal Damage. J. Neuropathol. Exp. Neurol. 2018, 77, 1163–1176. [Google Scholar] [CrossRef] [PubMed] [Green Version]
  23. Newington, J.T.; Rappon, T.; Albers, S.; Wong, D.Y.; Rylett, R.J.; Cumming, R.C. Overexpression of Pyruvate Dehydrogenase Kinase 1 and Lactate Dehydrogenase A in Nerve Cells Confers Resistance to Amyloid β and Other Toxins by Decreasing Mitochondrial Respiration and Reactive Oxygen Species Production. J. Biol. Chem. 2012, 287, 37245–37258. [Google Scholar] [CrossRef] [PubMed] [Green Version]
  24. Frank, J.; Kisters, K.; Stirban, O.A.; Obeid, R.; Lorkowski, S.; Wallert, M.; Egert, S.; Podszun, M.C.; Eckert, G.P.; Pettersen, J.A.; et al. The role of biofactors in the prevention and treatment of age-related diseases. BioFactors 2021, 47, 522–550. [Google Scholar] [CrossRef]
  25. Botchway, B.O.; Moore, M.K.; Akinleye, F.O.; Iyer, I.C.; Fang, M. Nutrition: Review on the Possible Treatment for Alzheimer’s Disease. J. Alzheimer’s Dis. 2018, 61, 867–883. [Google Scholar] [CrossRef] [PubMed]
  26. Dangour, A.D.; Whitehouse, P.J.; Rafferty, K.; Mitchell, S.A.; Smith, L.; Hawkesworth, S.; Vellas, B. B-Vitamins and Fatty Acids in the Prevention and Treatment of Alzheimer’s Disease and Dementia: A Systematic Review. J. Alzheimer’s Dis. 2010, 22, 205–224. [Google Scholar] [CrossRef] [PubMed] [Green Version]
  27. Mielech, A.; Puścion-Jakubik, A.; Markiewicz-Żukowska, R.; Socha, K. Vitamins in Alzheimer’s Disease—Review of the Latest Reports. Nutrients 2020, 12, 3458. [Google Scholar] [CrossRef]
  28. Viel, C.; Brandtner, A.T.; Weißhaar, A.; Lehto, A.; Fuchs, M.; Klein, J. Effects of Magnesium Orotate, Benfotiamine and a Combination of Vitamins on Mitochondrial and Cholinergic Function in the TgF344-AD Rat Model of Alzheimer’s Disease. Pharmaceuticals 2021, 14, 1218. [Google Scholar] [CrossRef]
  29. Ebara, S. Nutritional role of folate. Congenit. Anomalies 2017, 57, 138–141. [Google Scholar] [CrossRef]
  30. Gressner, A.M.; Arndt, T. Lexikon der Medizinischen Laboratoriumsdiagnostik; Living reference work, continuously updated ed., Springer Reference Medizin; Springer: Berlin, Germany, 2017. [Google Scholar]
  31. Hinterberger, M.; Fischer, P. Folate and Alzheimer: When time matters. J. Neural Transm. 2012, 120, 211–224. [Google Scholar] [CrossRef]
  32. Robinson, N.; Grabowski, P.; Rehman, I. Alzheimer’s disease pathogenesis: Is there a role for folate? Mech. Ageing Dev. 2018, 174, 86–94. [Google Scholar] [CrossRef] [PubMed] [Green Version]
  33. Classen, H.G. Magnesium orotate—Experimental and clinical evidence. Rom. J. Intern. Med. 2004, 42, 491–501. [Google Scholar] [PubMed]
  34. Toffa, D.H.; Magnerou, M.A.; Kassab, A.; Djibo, F.H.; Sow, A.D. Can magnesium reduce central neurodegeneration in Alzheimer’s disease? Basic evidences and research needs. Neurochem. Int. 2019, 126, 195–202. [Google Scholar] [CrossRef] [PubMed]
  35. Volpe, S.L. Magnesium in Disease Prevention and Overall Health. Adv. Nutr. Int. Rev. J. 2013, 4, 378S–383S. [Google Scholar] [CrossRef] [PubMed]
  36. Gröber, U.; Schmidt, J.; Kisters, K. Magnesium in Prevention and Therapy. Nutrients 2015, 7, 8199–8226. [Google Scholar] [CrossRef] [Green Version]
  37. Yu, J.; Sun, M.; Chen, Z.; Lu, J.; Liu, Y.; Zhou, L.; Xu, X.; Fan, D.; Chui, D. Magnesium Modulates Amyloid-β Protein Precursor Trafficking and Processing. J. Alzheimer’s Dis. 2010, 20, 1091–1106. [Google Scholar] [CrossRef]
  38. Du, K.; Zheng, X.; Ma, Z.-T.; Lv, J.-Y.; Jiang, W.-J.; Liu, M.-Y. Association of Circulating Magnesium Levels in Patients with Alzheimer’s Disease From 1991 to 2021: A Systematic Review and Meta-Analysis. Front. Aging Neurosci. 2022, 13. [Google Scholar] [CrossRef]
  39. Hellmann, H.; Mooney, S. Vitamin B6: A Molecule for Human Health? Molecules 2010, 15, 442–459. [Google Scholar] [CrossRef] [Green Version]
  40. Hashim, A.; Wang, L.; Juneja, K.; Ye, Y.; Zhao, Y.; Ming, L.-J. Vitamin B6s inhibit oxidative stress caused by Alzheimer’s disease-related CuII-β-amyloid complexes—cooperative action of phospho-moiety. Bioorganic Med. Chem. Lett. 2011, 21, 6430–6432. [Google Scholar] [CrossRef]
  41. Flicker, L.; Martins, R.; Thomas, J.; Acres, J.; Taddei, K.; Vasikaran, S.D.; Norman, P.; Jamrozik, K.; Almeida, O.P. B-vitamins reduce plasma levels of beta amyloid. Neurobiol. Aging 2008, 29, 303–305. [Google Scholar] [CrossRef]
  42. Douaud, G.; Refsum, H.; de Jager, C.A.; Jacoby, R.; Nichols, T.E.; Smith, S.M.; Smith, A.D. Preventing Alzheimer’s disease-related gray matter atrophy by B-vitamin treatment. Proc. Natl. Acad. Sci. USA 2013, 110, 9523–9528. [Google Scholar] [CrossRef] [PubMed] [Green Version]
  43. Allen, G.F.G.; Neergheen, V.; Oppenheim, M.; Fitzgerald, J.C.; Footitt, E.; Hyland, K.; Clayton, P.T.; Land, J.M.; Heales, S.J.R. Pyridoxal 5′-phosphate deficiency causes a loss of aromatic l-amino acid decarboxylase in patients and human neuroblastoma cells, implications for aromatic l-amino acid decarboxylase and vitamin B6 deficiency states. J. Neurochem. 2010, 114, 87–96. [Google Scholar] [CrossRef] [PubMed]
  44. Budni, J.; Romero, A.; Molz, S.; Martín-De-Saavedra, M.; Egea, J.; Del Barrio, L.; Tasca, C.; Rodrigues, A.; López, M. Neurotoxicity induced by dexamethasone in the human neuroblastoma SH-SY5Y cell line can be prevented by folic acid. Neuroscience 2011, 190, 346–353. [Google Scholar] [CrossRef]
  45. Li, W.; Jiang, M.; Xiao, Y.; Zhang, X.; Cui, S.; Huang, G. Folic acid inhibits tau phosphorylation through regulation of PP2A methylation in SH-SY5Y cells. J. Nutr. Health Aging 2014, 19, 123–129. [Google Scholar] [CrossRef] [PubMed]
  46. Lin, L.; Ke, Z.; Lv, M.; Lin, R.; Wu, B.; Zheng, Z. Effects of MgSO 4 and magnesium transporters on 6-hydroxydopamine-induced SH-SY5Y cells. Life Sci. 2017, 172, 48–54. [Google Scholar] [CrossRef]
  47. Vrolijk, M.F.; Opperhuizen, A.; Jansen, E.H.; Hageman, G.J.; Bast, A.; Haenen, G.R. The vitamin B6 paradox: Supplementation with high concentrations of pyridoxine leads to decreased vitamin B6 function. Toxicol. Vitr. 2017, 44, 206–212. [Google Scholar] [CrossRef]
  48. Li, W.; Jiang, M.; Zhao, S.; Liu, H.; Zhang, X.; Wilson, J.X.; Huang, G. Folic Acid Inhibits Amyloid β-Peptide Production through Modulating DNA Methyltransferase Activity in N2a-APP Cells. Int. J. Mol. Sci. 2015, 16, 25002–25013. [Google Scholar] [CrossRef] [Green Version]
  49. Chen, H.; Liu, S.; Ji, L.; Wu, T.; Ji, Y.; Zhou, Y.; Zheng, M.; Zhang, M.; Xu, W.; Huang, G. Folic Acid Supplementation Mitigates Alzheimer’s Disease by Reducing Inflammation: A Randomized Controlled Trial. Mediat. Inflamm. 2016, 2016, 1–10. [Google Scholar] [CrossRef] [Green Version]
  50. Scarpa, S.; Fuso, A.; D’Anselmi, F.; Cavallaro, R.A. Presenilin 1 gene silencing by S-adenosylmethionine: A treatment for Alzheimer disease? FEBS Lett. 2003, 541, 145–148. [Google Scholar] [CrossRef] [Green Version]
  51. Lyon, P.; Strippoli, V.; Fang, B.; Cimmino, L. B Vitamins and One-Carbon Metabolism: Implications in Human Health and Disease. Nutrients 2020, 12, 2867. [Google Scholar] [CrossRef]
  52. Das, N.; Ren, J.; Spence, J.; Chapman, S.B. Phosphate Brain Energy Metabolism and Cognition in Alzheimer’s Disease: A Spectroscopy Study Using Whole-Brain Volume-Coil 31Phosphorus Magnetic Resonance Spectroscopy at 7Tesla. Front. Neurosci. 2021, 15, 641739. [Google Scholar] [CrossRef]
  53. Ahmed, A.S.; Elgharabawy, R.; Al-Najjar, A.H. Ameliorating effect of anti-Alzheimer’s drugs on the bidirectional association between type 2 diabetes mellitus and Alzheimer’s disease. Exp. Biol. Med. 2017, 242, 1335–1344. [Google Scholar] [CrossRef] [PubMed]
  54. Tian, T.; Bai, D.; Li, W.; Huang, G.-W.; Liu, H. Effects of Folic Acid on Secretases Involved in Aβ Deposition in APP/PS1 Mice. Nutrients 2016, 8, 556. [Google Scholar] [CrossRef] [Green Version]
  55. Kamenetz, F.; Tomita, T.; Hsieh, H.; Seabrook, G.; Borchelt, D.; Iwatsubo, T.; Sisodia, S.; Malinow, R. APP Processing and Synaptic Function. Neuron 2003, 37, 925–937. [Google Scholar] [CrossRef] [Green Version]
  56. Xiong, Y.; Ruan, Y.-T.; Zhao, J.; Yang, Y.-W.; Chen, L.-P.; Mai, Y.-R.; Yu, Q.; Cao, Z.-Y.; Liu, F.-F.; Liao, W.; et al. Magnesium-L-threonate exhibited a neuroprotective effect against oxidative stress damage in HT22 cells and Alzheimer’s disease mouse model. World J. Psychiatry 2022, 12, 410–424. [Google Scholar] [CrossRef] [PubMed]
  57. Zetterberg, H.; Andreasson, U.; Hansson, O.; Wu, G.; Sankaranarayanan, S.; Andersson, M.E.; Buchhave, P.; Londos, E.; Umek, R.M.; Minthon, L.; et al. Elevated Cerebrospinal Fluid BACE1 Activity in Incipient Alzheimer Disease. Arch. Neurol. 2008, 65, 1102–1107. [Google Scholar] [CrossRef] [PubMed] [Green Version]
  58. Olsson, A.; Höglund, K.; Sjögren, M.; Andreasen, N.; Minthon, L.; Lannfelt, L.; Buerger, K.; Möller, H.-J.; Hampel, H.; Davidsson, P.; et al. Measurement of α- and β-secretase cleaved amyloid precursor protein in cerebrospinal fluid from Alzheimer patients. Exp. Neurol. 2003, 183, 74–80. [Google Scholar] [CrossRef]
  59. Li, W.; Liu, H.; Yu, M.; Zhang, X.; Zhang, M.; Wilson, J.X.; Huang, G. Folic acid administration inhibits amyloid β-peptide accumulation in APP/PS1 transgenic mice. J. Nutr. Biochem. 2015, 26, 883–891. [Google Scholar] [CrossRef]
  60. Liu, H.; Li, W.; Zhao, S.; Zhang, X.; Zhang, M.; Xiao, Y.; Wilson, J.X.; Huang, G. Folic acid attenuates the effects of amyloid β oligomers on DNA methylation in neuronal cells. Eur. J. Nutr. 2015, 55, 1849–1862. [Google Scholar] [CrossRef]
  61. Babylon, L.; Grewal, R.; Stahr, P.-L.; Eckert, R.; Keck, C.; Eckert, G. Hesperetin Nanocrystals Improve Mitochondrial Function in a Cell Model of Early Alzheimer Disease. Antioxidants 2021, 10, 1003. [Google Scholar] [CrossRef]
  62. Ryu, W.-I.; Bormann, M.K.; Shen, M.; Kim, D.; Forester, B.; Park, Y.; So, J.; Seo, H.; Sonntag, K.-C.; Cohen, B.M. Brain cells derived from Alzheimer’s disease patients have multiple specific innate abnormalities in energy metabolism. Mol. Psychiatry 2021, 26, 5702–5714. [Google Scholar] [CrossRef]
  63. Ross, J.M.; Öberg, J.; Brené, S.; Coppotelli, G.; Terzioglu, M.; Pernold, K.; Goiny, M.; Sitnikov, R.; Kehr, J.; Trifunovic, A.; et al. High brain lactate is a hallmark of aging and caused by a shift in the lactate dehydrogenase A/B ratio. Proc. Natl. Acad. Sci. USA 2010, 107, 20087–20092. [Google Scholar] [CrossRef] [Green Version]
  64. Parnetti, L.; Gaiti, A.; Polidori, M.; Brunetti, M.; Palumbo, B.; Chionne, F.; Cadini, D.; Cecchetti, R.; Senin, U. Increased cerebrospinal fluid pyruvate levels in Alzheimer’s disease. Neurosci. Lett. 1995, 199, 231–233. [Google Scholar] [CrossRef]
  65. Liguori, C.; Stefani, A.; Sancesario, G.; Sancesario, G.; Marciani, M.; Pierantozzi, M. CSF lactate levels, τ proteins, cognitive decline: A dynamic relationship in Alzheimer’s disease. J. Neurol. Neurosurg. Psychiatry 2015, 86, 655–659. [Google Scholar] [CrossRef]
  66. Parnetti, L.; Reboldi, G.; Gallai, V. Cerebrospinal fluid pyruvate levels in Alzheimer’s disease and vascular dementia. Neurology 2000, 54, 735. [Google Scholar] [CrossRef] [PubMed]
  67. Koltai, T.; Reshkin, S.J.; Harguindey, S. Pharmacological interventions part IV: Metabolic modifiers. In An Innovative Approach to Understanding and Treating Cancer: Targeting pH—From Etiopatho-Genesis to New Therapeutic Avenues; Koltai, T., Ed.; Elsevier Science & Technology: San Diego, CA, USA, 2020; pp. 361–416. [Google Scholar]
  68. Uyeda, K. Pyruvate Kinase. In Encyclopedia of Biological Chemistry, 2nd ed.; Elsevier: London, UK, 2013; pp. 719–721. [Google Scholar]
  69. Newington, J.T.; Pitts, A.; Chien, A.; Arseneault, R.; Schubert, D.; Cumming, R.C. Amyloid Beta Resistance in Nerve Cell Lines Is Mediated by the Warburg Effect. PLoS ONE 2011, 6, e19191. [Google Scholar] [CrossRef] [PubMed] [Green Version]
  70. Link, C.D. Expression of human beta-amyloid peptide in transgenic Caenorhabditis elegans. Proc. Natl. Acad. Sci. USA 1995, 92, 9368–9372. [Google Scholar] [CrossRef] [PubMed] [Green Version]
  71. Yang, T.; Zhao, X.; Zhang, Y.; Xie, J.; Zhou, A. 6‴-Feruloylspinosin alleviated beta-amyloid induced toxicity by promoting mitophagy in Caenorhabditis elegans (GMC101) and PC12 cells. Sci. Total Environ. 2020, 715, 136953. [Google Scholar] [CrossRef]
  72. McColl, G.; Roberts, B.R.; Pukala, T.L.; Kenche, V.B.; Roberts, C.M.; Link, C.D.; Ryan, T.M.; Masters, C.L.; Barnham, K.J.; Bush, A.I.; et al. Utility of an improved model of amyloid-beta (Aβ1-42) toxicity in Caenorhabditis elegans for drug screening for Alzheimer’s disease. Mol. Neurodegener. 2012, 7, 57. [Google Scholar] [CrossRef] [Green Version]
  73. Leiteritz, A.; Dilberger, B.; Wenzel, U.; Fitzenberger, E. Betaine reduces β-amyloid-induced paralysis through activation of cystathionine-β-synthase in an Alzheimer model of Caenorhabditis elegans. Genes Nutr. 2018, 13, 21. [Google Scholar] [CrossRef] [Green Version]
  74. Kim, S.; Kim, B.; Park, S. Selenocysteine mimics the effect of dietary restriction on lifespan via SKN-1 and retards age-associated pathophysiological changes in Caenorhabditis elegans. Mol. Med. Rep. 2018, 18, 5389–5398. [Google Scholar] [CrossRef] [PubMed] [Green Version]
  75. Henderson, S.T.; Johnson, T.E. daf-16 integrates developmental and environmental inputs to mediate aging in the nematode Caenorhabditis elegans. Curr. Biol. 2001, 11, 1975–1980. [Google Scholar] [CrossRef] [Green Version]
  76. Lin, K.; Dorman, J.B.; Rodan, A.; Kenyon, C. daf-16: An HNF-3/forkhead Family Member That Can Function to Double the Life-Span of Caenorhabditis elegans. Science 1997, 278, 1319–1322. [Google Scholar] [CrossRef] [PubMed] [Green Version]
  77. Hesp, K.; Smant, G.; Kammenga, J.E. Caenorhabditis elegans DAF-16/FOXO transcription factor and its mammalian homologs associate with age-related disease. Exp. Gerontol. 2015, 72, 1–7. [Google Scholar] [CrossRef] [PubMed] [Green Version]
  78. Rathor, L.; Akhoon, B.A.; Pandey, S.; Srivastava, S.; Pandey, R. Folic acid supplementation at lower doses increases oxidative stress resistance and longevity in Caenorhabditis elegans. AGE 2015, 37, 1–15. [Google Scholar] [CrossRef] [Green Version]
  79. Bai, S.; Wang, W.; Zhang, Z.; Li, M.; Chen, Z.; Wang, J.; Zhao, Y.; An, L.; Wang, Y.; Xing, S.; et al. Ethanol Alleviates Amyloid-β-Induced Toxicity in an Alzheimer’s Disease Model of Caenorhabiditis elegans. Front. Aging Neurosci. 2021, 13. [Google Scholar] [CrossRef]
  80. Regitz, C.; Dußling, L.M.; Wenzel, U. Amyloid-beta (Aβ1-42)-induced paralysis in Caenorhabditis elegans is inhibited by the polyphenol quercetin through activation of protein degradation pathways. Mol. Nutr. Food Res. 2014, 58, 1931–1940. [Google Scholar] [CrossRef]
  81. Regitz, C.; Fitzenberger, E.; Mahn, F.L.; Dußling, L.M.; Wenzel, U. Resveratrol reduces amyloid-beta (Aβ1–42)-induced paralysis through targeting proteostasis in an Alzheimer model of Caenorhabditis elegans. Eur. J. Nutr. 2015, 55, 741–747. [Google Scholar] [CrossRef]
  82. Yu, X.; Guan, P.; Guo, J.; Wang, Y.; Cao, L.; Xu, G.; Konstantopoulos, K.; Wang, Z.; Wang, P. By suppressing the expression of anterior pharynx-defective-1α and -1β and inhibiting the aggregation of β-amyloid protein, magnesium ions inhibit the cognitive decline of amyloid precursor protein/presenilin 1 transgenic mice. FASEB J. 2015, 29, 5044–5058. [Google Scholar] [CrossRef]
  83. Grewal, R.; Reutzel, M.; Dilberger, B.; Hein, H.; Zotzel, J.; Marx, S.; Tretzel, J.; Sarafeddinov, A.; Fuchs, C.; Eckert, G.P. Purified oleocanthal and ligstroside protect against mitochondrial dysfunction in models of early Alzheimer’s disease and brain ageing. Exp. Neurol. 2020, 328, 113248. [Google Scholar] [CrossRef]
  84. Hagl, S.; Grewal, R.; Ciobanu, I.; Helal, A.; Khayyal, M.T.; Muller, W.E.; Eckert, G.P. Rice Bran Extract Compensates Mitochondrial Dysfunction in a Cellular Model of Early Alzheimer’s Disease. J. Alzheimer’s Dis. 2015, 43, 927–938. [Google Scholar] [CrossRef] [PubMed]
  85. Stadlmann, S.; Renner, K.; Pollheimer, J.; Moser, P.L.; Zeimet, A.G.; Offner, F.A.; Gnaiger, E. Preserved Coupling of Oxidative Phosphorylation but Decreased Mitochondrial Respiratory Capacity in IL-1β-Treated Human Peritoneal Mesothelial Cells. Cell Biophys. 2006, 44, 179–186. [Google Scholar] [CrossRef]
  86. Bustin, S.A.; Benes, V.; Garson, J.A.; Hellemans, J.; Huggett, J.; Kubista, M.; Mueller, R.; Nolan, T.; Pfaffl, M.W.; Shipley, G.L.; et al. The MIQE Guidelines: Minimum Information for Publication of Quantitative Real-Time PCR Experiments. Clin. Chem. 2009, 55, 611–622. [Google Scholar] [CrossRef] [PubMed] [Green Version]
  87. Brenner, S. The genetics of Caenorhabditis elegans. Genetics 1974, 77, 71–94. [Google Scholar] [CrossRef] [PubMed]
  88. Stiernagle, T. Maintenance of C. elegans; WormBook: Pasadena, CA, USA, 2006; pp. 1–11. [Google Scholar] [CrossRef] [Green Version]
  89. Fitzenberger, E.; Deusing, D.J.; Marx, C.; Boll, M.; Lüersen, K.; Wenzel, U. The polyphenol quercetin protects themev-1mutant of Caenorhabditis elegans from glucose-induced reduction of survival under heat-stress depending on SIR-2.1, DAF-12, and proteasomal activity. Mol. Nutr. Food Res. 2014, 58, 984–994. [Google Scholar] [CrossRef] [PubMed]
  90. Schmitt, F.; Babylon, L.; Dieter, F.; Eckert, G.P. Effects of Pesticides on Longevity and Bioenergetics in Invertebrates—The Impact of Polyphenolic Metabolites. Int. J. Mol. Sci. 2021, 22, 13478. [Google Scholar] [CrossRef]
  91. Huang, J.; Chen, S.; Hu, L.; Niu, H.; Sun, Q.; Li, W.; Tan, G.; Li, J.; Jin, L.; Lyu, J.; et al. Mitoferrin-1 is Involved in the Progression of Alzheimer’s Disease Through Targeting Mitochondrial Iron Metabolism in a Caenorhabditis elegans Model of Alzheimer’s Disease. Neuroscience 2018, 385, 90–101. [Google Scholar] [CrossRef] [PubMed]
Figure 1. Effect of ID63 and ID64 in SH-SY5Y695 cells compared to the control or their single substances on the Aβ1–40 level after 24 h incubation. N = 6. Aβ1–40 levels were adjusted to the protein content. Significance was determined by Student’s unpaired t-test and one-way ANOVA. + significant against control; * significant against ID63; # significant against ID64. * p < 0.05, **** p < 0.0001, #### p < 0.0001 and + p < 0.05, ++++ p < 0.0001. Data are displayed as the mean ± SEM. ID63 = 200 µM MgOr and 10 µM Fol; ID64 = 200 µM MgOr, 10 µM Fol and 100 nM Vit B6.
Ijms 23 08670 g001
Figure 2. Effect of ID63 and ID64 in SH-SY5Y695 cells compared to the control or their single substances on the Aβ1–42 level after 24 h incubation. N = 6. Aβ1–42 levels were adjusted to the protein content. Significance was determined by Student’s unpaired t-test and one-way ANOVA. ** p < 0.01 and *** p < 0.001. Data are displayed as the mean ± SEM. ID63 = 200 µM MgOr and 10 µM Fol; ID64 = 200 µM MgOr, 10 µM Fol and 100 nM Vit B6.
Ijms 23 08670 g002
Figure 3. Effect of the incubation with ID63 or ID64 on the human soluble amyloid precursor protein α (sAPPα) and β (sAPPβ) after 24 h of incubation. (A) sAPPα level of SH-SY5Y695 cells after the incubation with ID63 or ID64 compared to the control. (B) sAPPβ level of SH-SY5Y695 cells after the incubation with ID63 or ID64 compared to the control. N = 6. sAPP levels were adjusted to the protein content. Significance was determined by one-way ANOVA. * p < 0.05 and **** p < 0.0001. Data are displayed as the mean ± SEM. ID63 = 200 µM MgOr and 10 µM Fol; ID64 = 200 µM MgOr, 10 µM Fol and 100 nM Vit B6.
Ijms 23 08670 g003
Figure 4. ATP level, MMP level, respiration and citrate synthase activity of SH-SY5Y-APP695 cells incubated for 24 h with ID63 or ID64. (A) ATP level of SH-SY5Y-APP695 cells incubated with ID63 and (B) ATP level of incubation with ID64 compared to the control. Cells treated with cell culture medium served as control (100%). N = 12. (C) MMP level of 2 × 10⁵ SH-SY5Y-APP695 cells incubated with ID63 and (D) MMP level of incubation with ID64 compared to the control. N = 16. (E) Respiration of SH-SY5Y-APP695 cells incubated with ID63 and (F) incubation with ID64 compared to the control. SH-SY5Y-APP695 cells adjusted to international units (IU) of citrate synthase activity. N = 15. (G) Citrate synthase activity of SH-SY5Y-APP695 cells incubated with ID63 and (H) Citrate synthase activity incubated with ID64 compared to control. N = 12. Significance was determined by Student’s unpaired t-test. Data are displayed as the mean ± SEM. ID63 = 200 µM MgOr and 10 µM Fol; ID64 = 200 µM MgOr, 10 µM Fol and 100 nM Vit B6. Leak I (G + M) = leak respiration with glutamate and malate; OXPHOS = oxidative phosphorylation system; ETC = electron transport chain; Leak II (Omy) = leak respiration with olygomycin.
Ijms 23 08670 g004
Figure 5. Effect of the incubation with ID63 or ID64 on lactate and pyruvate level after 24 h of incubation. (A) Lactate level of SH-SY5Y695 cells after the incubation with ID63 or ID64 compared to the control. (B) Pyruvate level of SH-SY5Y695 cells after the incubation with ID63 or ID64 compared to the control. (C) Lactate to pyruvate ratio. N = 6. Levels were adjusted to the protein content. Significance was determined by one-way ANOVA. * p < 0.05, ** p < 0.01 and **** p < 0.0001. Data are displayed as the mean ± SEM. ID63 = 200 µM MgOr and 10 µM Fol; ID64 = 200 µM MgOr, 10 µM Fol and 100 nM Vit B6.
Ijms 23 08670 g005
Figure 6. Effect of the incubation with ID63 or ID64 on the gene expression after 24 h of incubation. (A) Gene expression of pyruvate dehydrogenase kinase 1 (PDK1) of SH-SY5Y695 cells after the incubation with ID63 or ID64 compared to the control. (B) Gene expression of lactate dehydrogenase A (LDHA) of SH-SY5Y695 cells after the incubation with ID63 or ID64 compared to the control. N = 8. Significance was determined by one-way ANOVA. * p < 0.05. Data are displayed as the mean ± SEM. ID63 = 200 µM MgOr and 10 µM Fol; ID64 = 200 µM MgOr, 10 µM Fol and 100 nM Vit B6.
Ijms 23 08670 g006
Figure 7. The lifespan under heat-stress of C. elegans after treatment with either ID63worm, ID64worm or their single substances in CL2006. (A) The single substances lead to an increase in heat-stress resistance of the nematodes although the combination of them does not have a significant impact. (B) After combination with vitamin B6, the resulting treatment leads to a significant increase in heat-stress resistance. For heat-stress experiments, the survival was assessed according to the penetration of SYTOX Green nucleic acid stain into dead cells. N > 60. log-rank (MantelCox) test. (C) Mean Survival of C. elegans after treatment with either ID63worm, ID64worm or their single substances in CL2006. Significance was determined by one-way ANOVA. p * < 0.05, p ** < 0.01, p *** < 0.001 and p **** < 0.0001. ID63worm = Fol 50 µM and MgOr 100 µM; ID64worm Fol 50 µM, MgOr 100 µM and Vit B6 100 µM.
Ijms 23 08670 g007
Figure 8. The Aβ induced paralysis after treatment with either ID63worm or ID64worm in GMC101. Both the feeding of both treatment combinations leads to significant reduction of Aβ induced paralysis after incubation of the nematodes for 24 h at 25 °C. N = 4. Mean ± SEM. One-way ANOVA with Tukey’s comparison post hoc test. p * < 0.05 ID63worm = Fol 50 µM and MgOr 100 µM; ID64worm Fol 50 µM, MgOr 100 µM and Vit B6 100 µM.
Ijms 23 08670 g008
Figure 9. Effect of ID63 and ID64 in transgene nematodes GMC101 compared to the controls on the Aβ1–42 level after 48 h incubation. Neither ID63 nor ID64 did not lead to a significant alteration of Aβ1–42. N = 8. Aβ1–42 levels were adjusted to the protein content. N = 8. Mean ± SEM. Student’s t-test. ID63worm = Fol 50 µM and MgOr 100 µM; ID64worm Fol 50 µM, MgOr 100 µM and Vit B6 100 µM.
Ijms 23 08670 g009
Figure 10. The effect of either ID63worm or ID64worm on the accumulation of aggregated Aβ (Aβ-aggr) in GMC101 after 48 h incubation. The treatment of the nematodes with ID63 leads to a significant reduction of accumulated Aβ. Whereby the treatment with ID64 combination did not lead to an alteration of Aβ levels; N = 8; mean ± SEM; one-way ANOVA with Tukey’s comparison post hoc test. * p < 0.05. ID63worm = Fol 50 µM and MgOr 100 µM; ID64worm Fol 50 µM, MgOr 100 µM and Vit B6 100 µM.
Ijms 23 08670 g010
Table 1. General overview of all tests and results of all biofactors. Combinations ID63 and ID64 and the single substances compared to the control.
ID63 vs. CTRID64 vs. CTRMgOr vs. CTRFol vs. CTRVit B6 vs. CTR
1–40Significant lowerSignificant lowerSignificant lowerSignificant lowerNo significant change
1–42No significant changeSignificant lowerSignificant lowerSignificant lowerSignificant lower
sAPPαSignificant lowerSignificant lowerNot testedNot testedNot tested
sAPPβNo significant changeNo significant changeNot testedNot testedNot tested
ATP levelNo significant changeNo significant changeNot testedNot testedNot tested
MMP levelNo significant changeNo significant changeNot testedNot testedNot tested
RespirationNo significant changeNo significant changeNot testedNot testedNot tested
Citrate synthase activityNo significant changeNo significant changeNot testedNot testedNot tested
Lactate levelSignificant lowerSignificant lowerNot testedNot testedNot tested
Pyruvate levelNo significant changeNo significant changeNot testedNot testedNot tested
Lactate/Pyruvate RatioNo significant changeSignificant lowerNot testedNot testedNot tested
Gen expression
PDK1
No significant changeNo significant changeNot testedNot testedNot tested
Gen expression
LDHA
No significant changeSignificant higherNot testedNot testedNot tested
Lifespan C. elegans in %No significant changeSignificant higherSignificant higherSignificant higherSignificant higher
Mean survival C. elegansSignificant higherSignificant higherSignificant higherSignificant higherSignificant higher
Paralysis C. elegansSignificant lowerSignificant lowerNot testedNot testedNot tested
1–42 C. elegansNo significant changeNo significant changeNot testedNot testedNot tested
1–42 aggreation C. elegansSignificant lowerNo significant changeNot testedNot testedNot tested
Table 2. Oligonucleotide primer sequences, product sizes, and primer concentrations for quantitative real-time PCR.
PrimerSequenceManufacturerProduct SizeConcentration (nM)
ß-Actin (ACTB)
NM_001101.2
5′-ggacttcgagcaagagatgg-3′
5′-agcactgtgttggcgtacag-3′
Biomol, Hamburg,
Germany
234200
Glyceraldehyde-3-phosphate dehydrogenase
(GAPDH)
NM_002046.2
5′-gagtcaacggatttggtcgt-3′
5′-ttgattttggagggatctcg-3′
Biomol, Hamburg,
Germany
238200
Phosphoglycerate kinase 1
(PGK1)
NM_000291.2
5′-ctgtgggggtatttgaatgg-3′
5′-cttccaggagctccaaa-3′
Biomol, Hamburg,
Germany
198200
Pyruvate dehydrogenase kinase, isozyme 1
(PDK1)
NM_002610
5′-atacggatcagaaaccgaca-3′
5′-cagacgcctagcattttcat-3′
Biomol, Hamburg,
Germany
291100
Human lactate dehydrogenase A like 6B
(LDHA)
NM_033195
5′-ggtgtccctttgaaggatct-3′
5′-tgcagtcacttctttgtgga-3′
Biomol, Hamburg,
Germany
87400
Publisher’s Note: MDPI stays neutral with regard to jurisdictional claims in published maps and institutional affiliations.

