
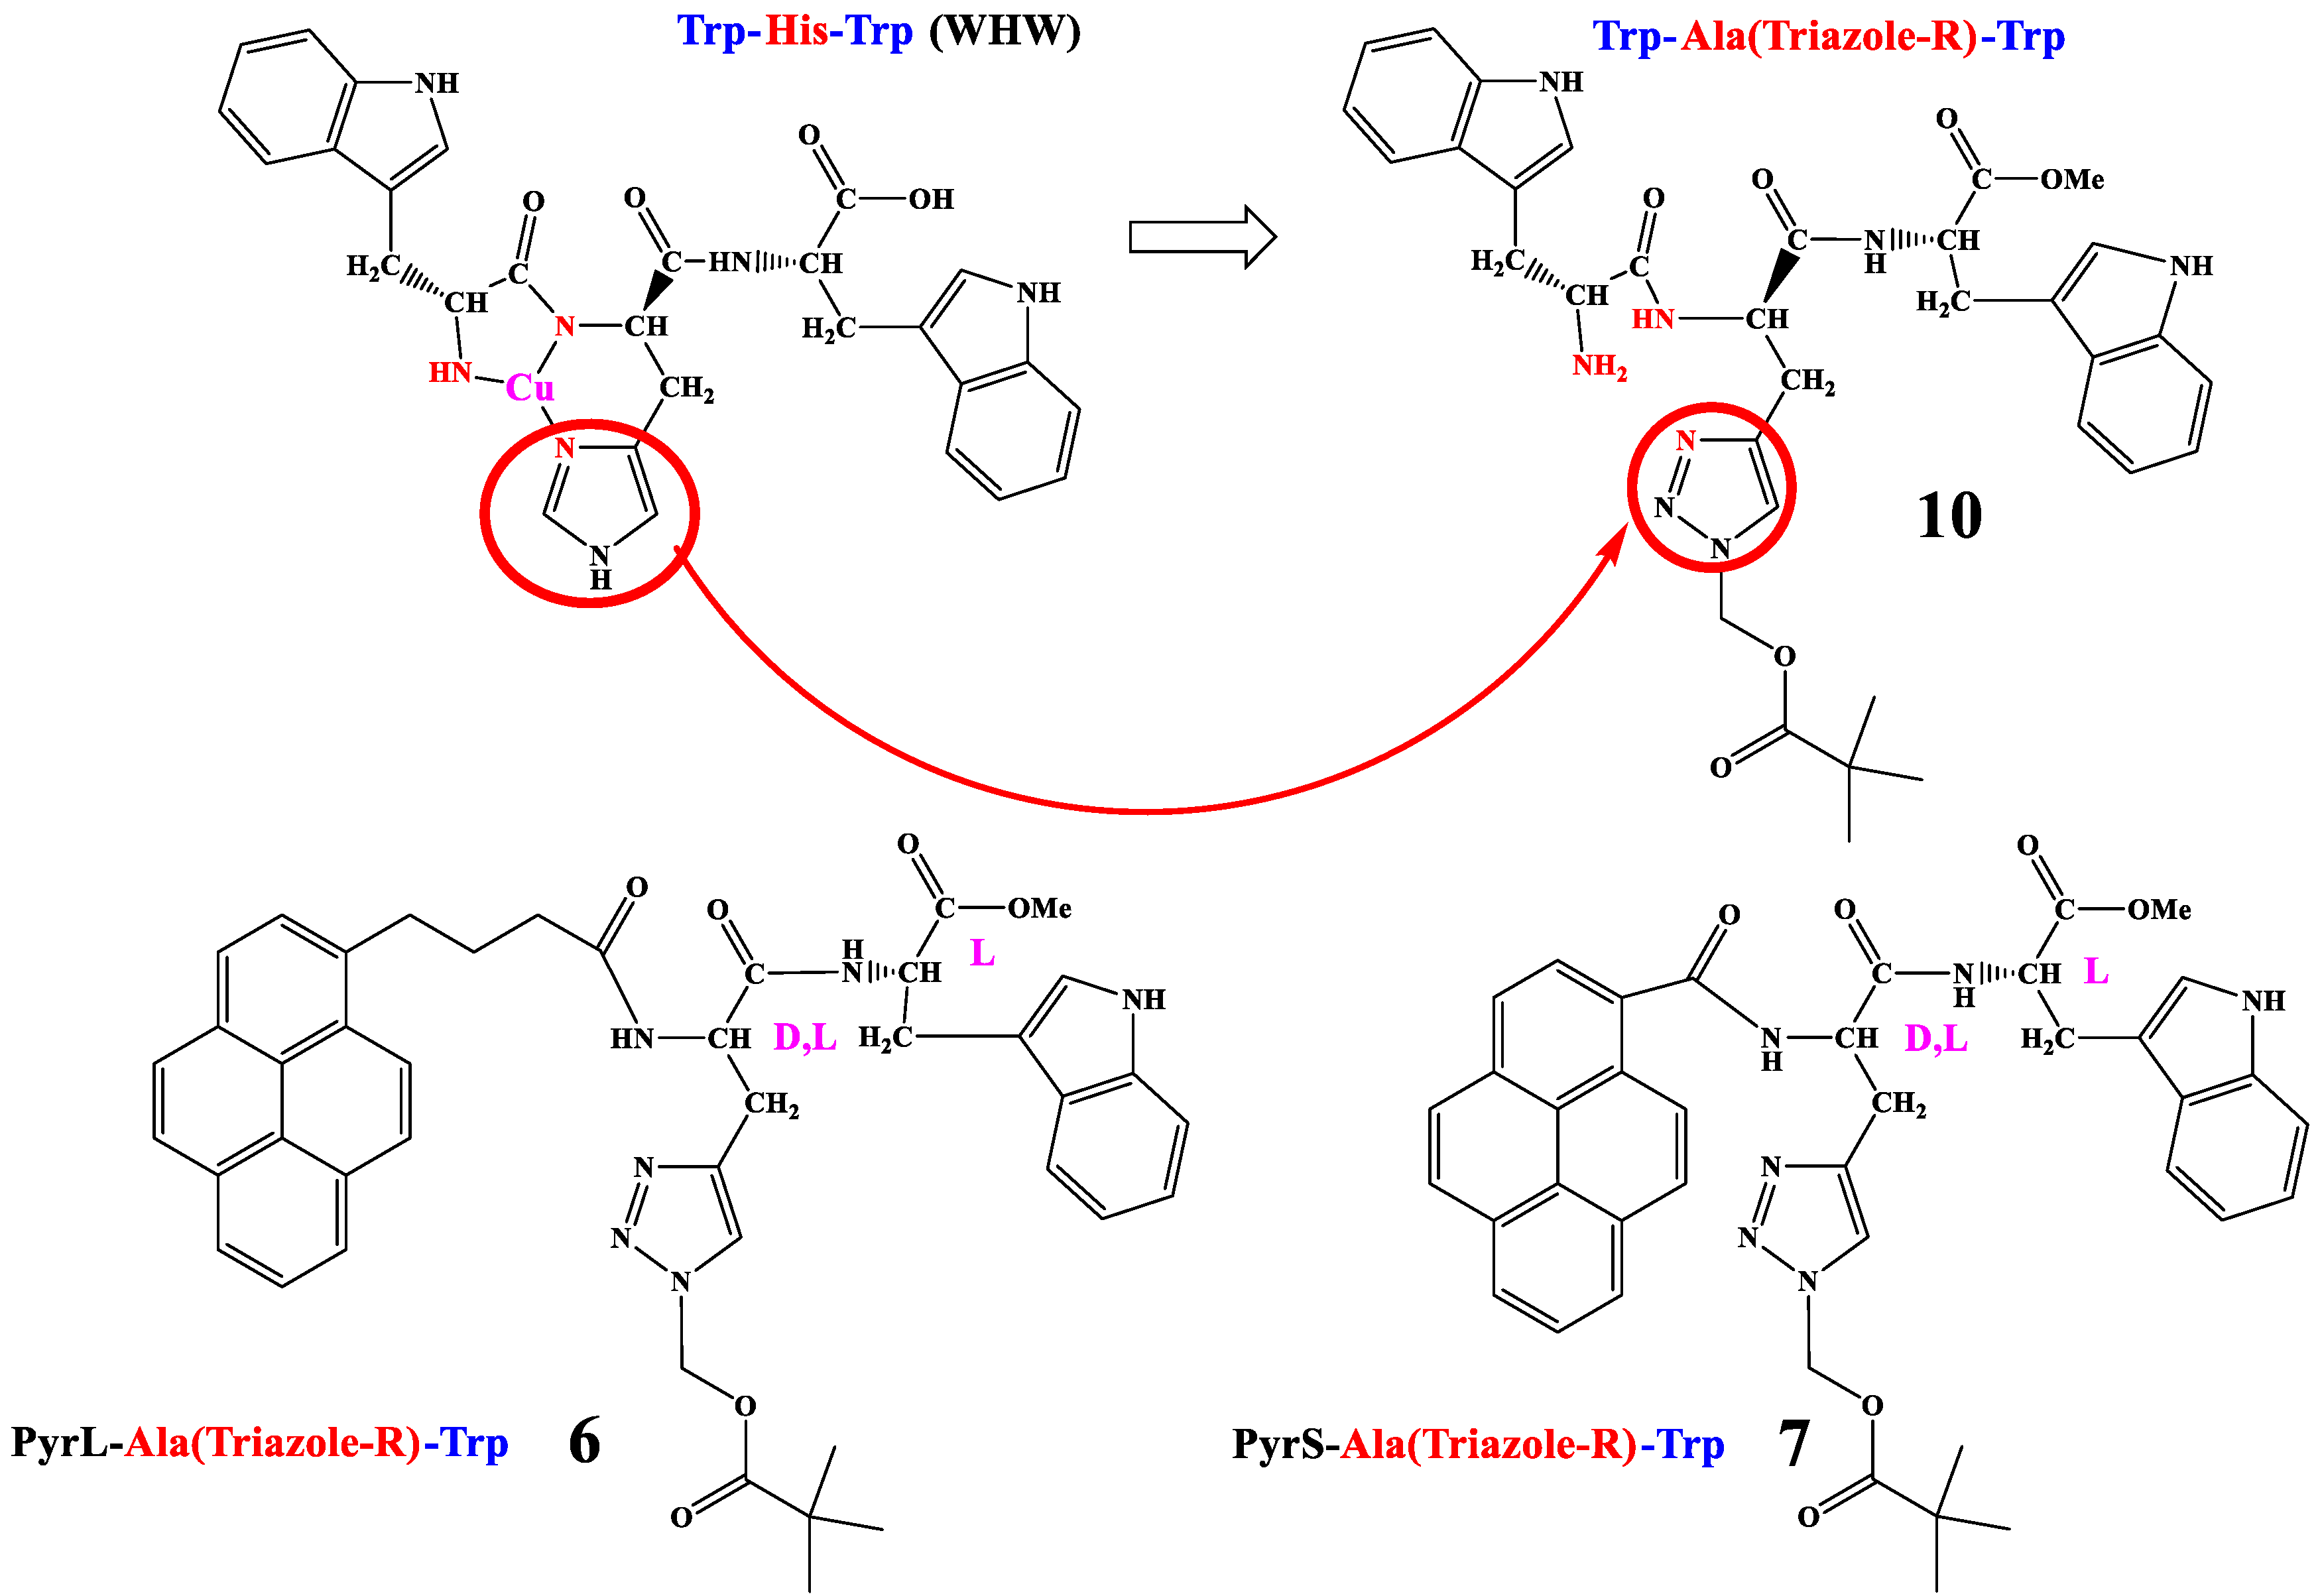
Impact of the Histidine-Triazole and Tryptophan-Pyrene Exchange in the WHW Peptide: Cu(II) Binding, DNA/RNA Interactions and Bioactivity

 , ,
, ,  and
and
Abstract
:1. Introduction
2. Results
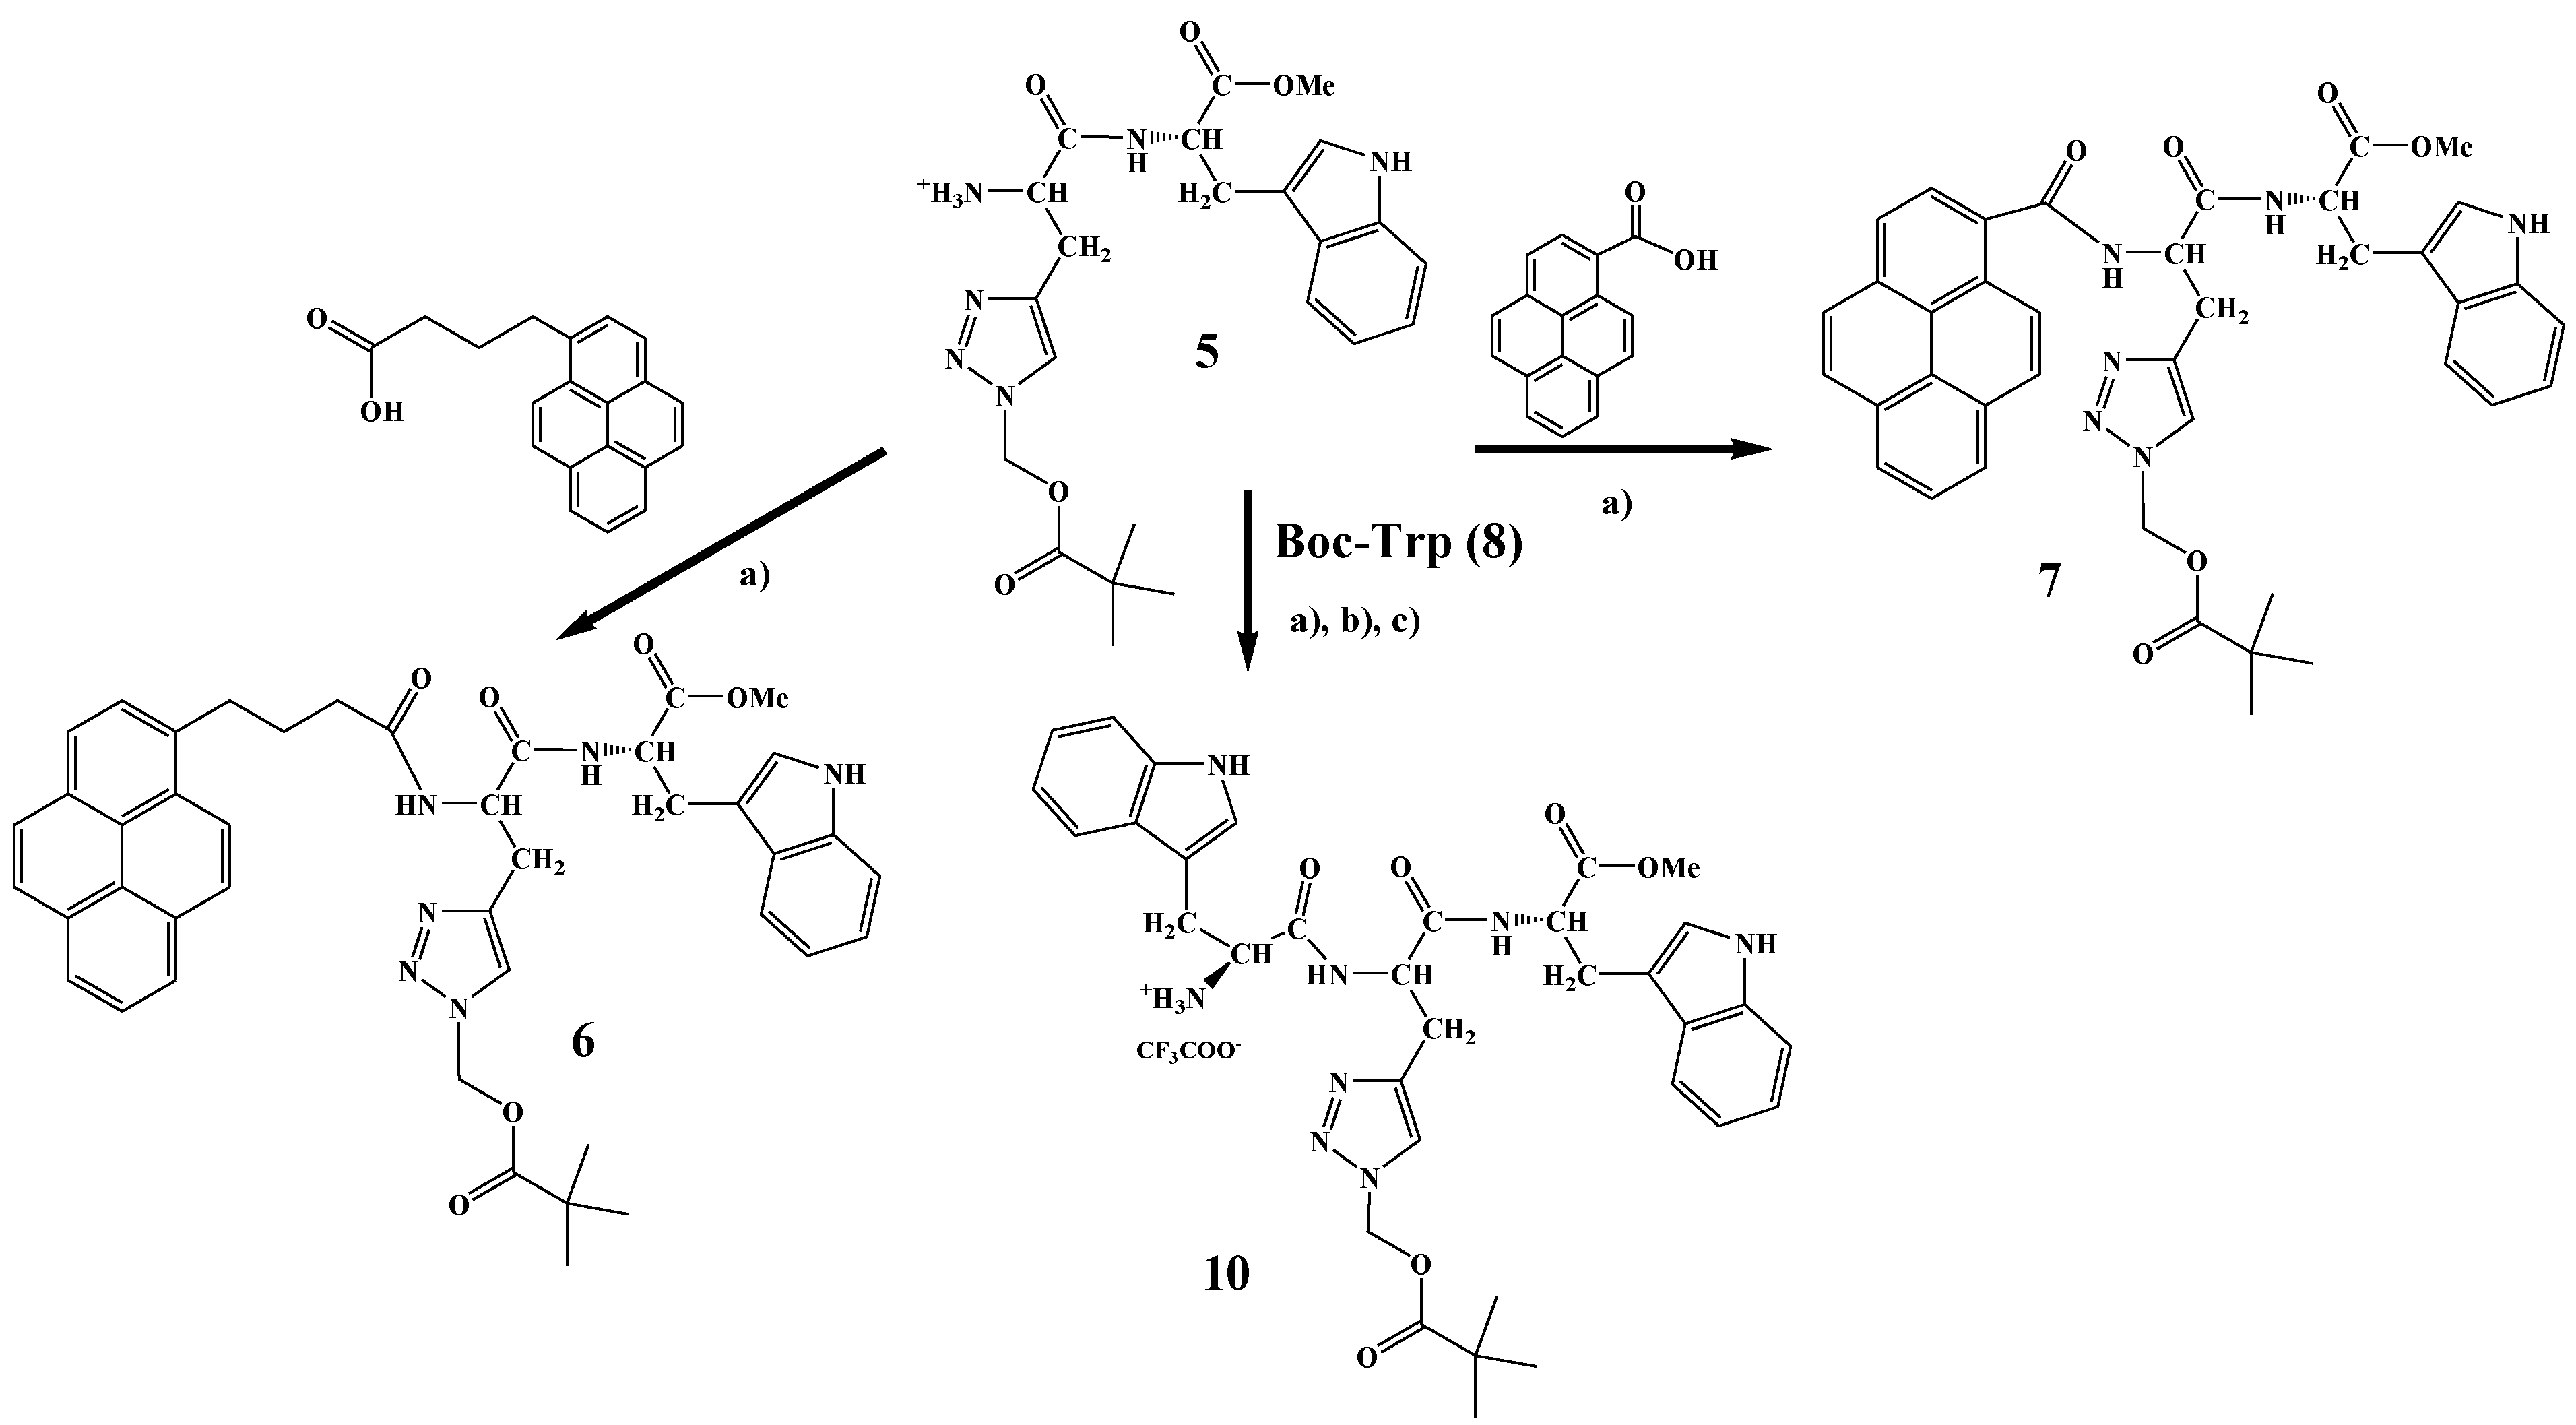
2.1. Synthesis
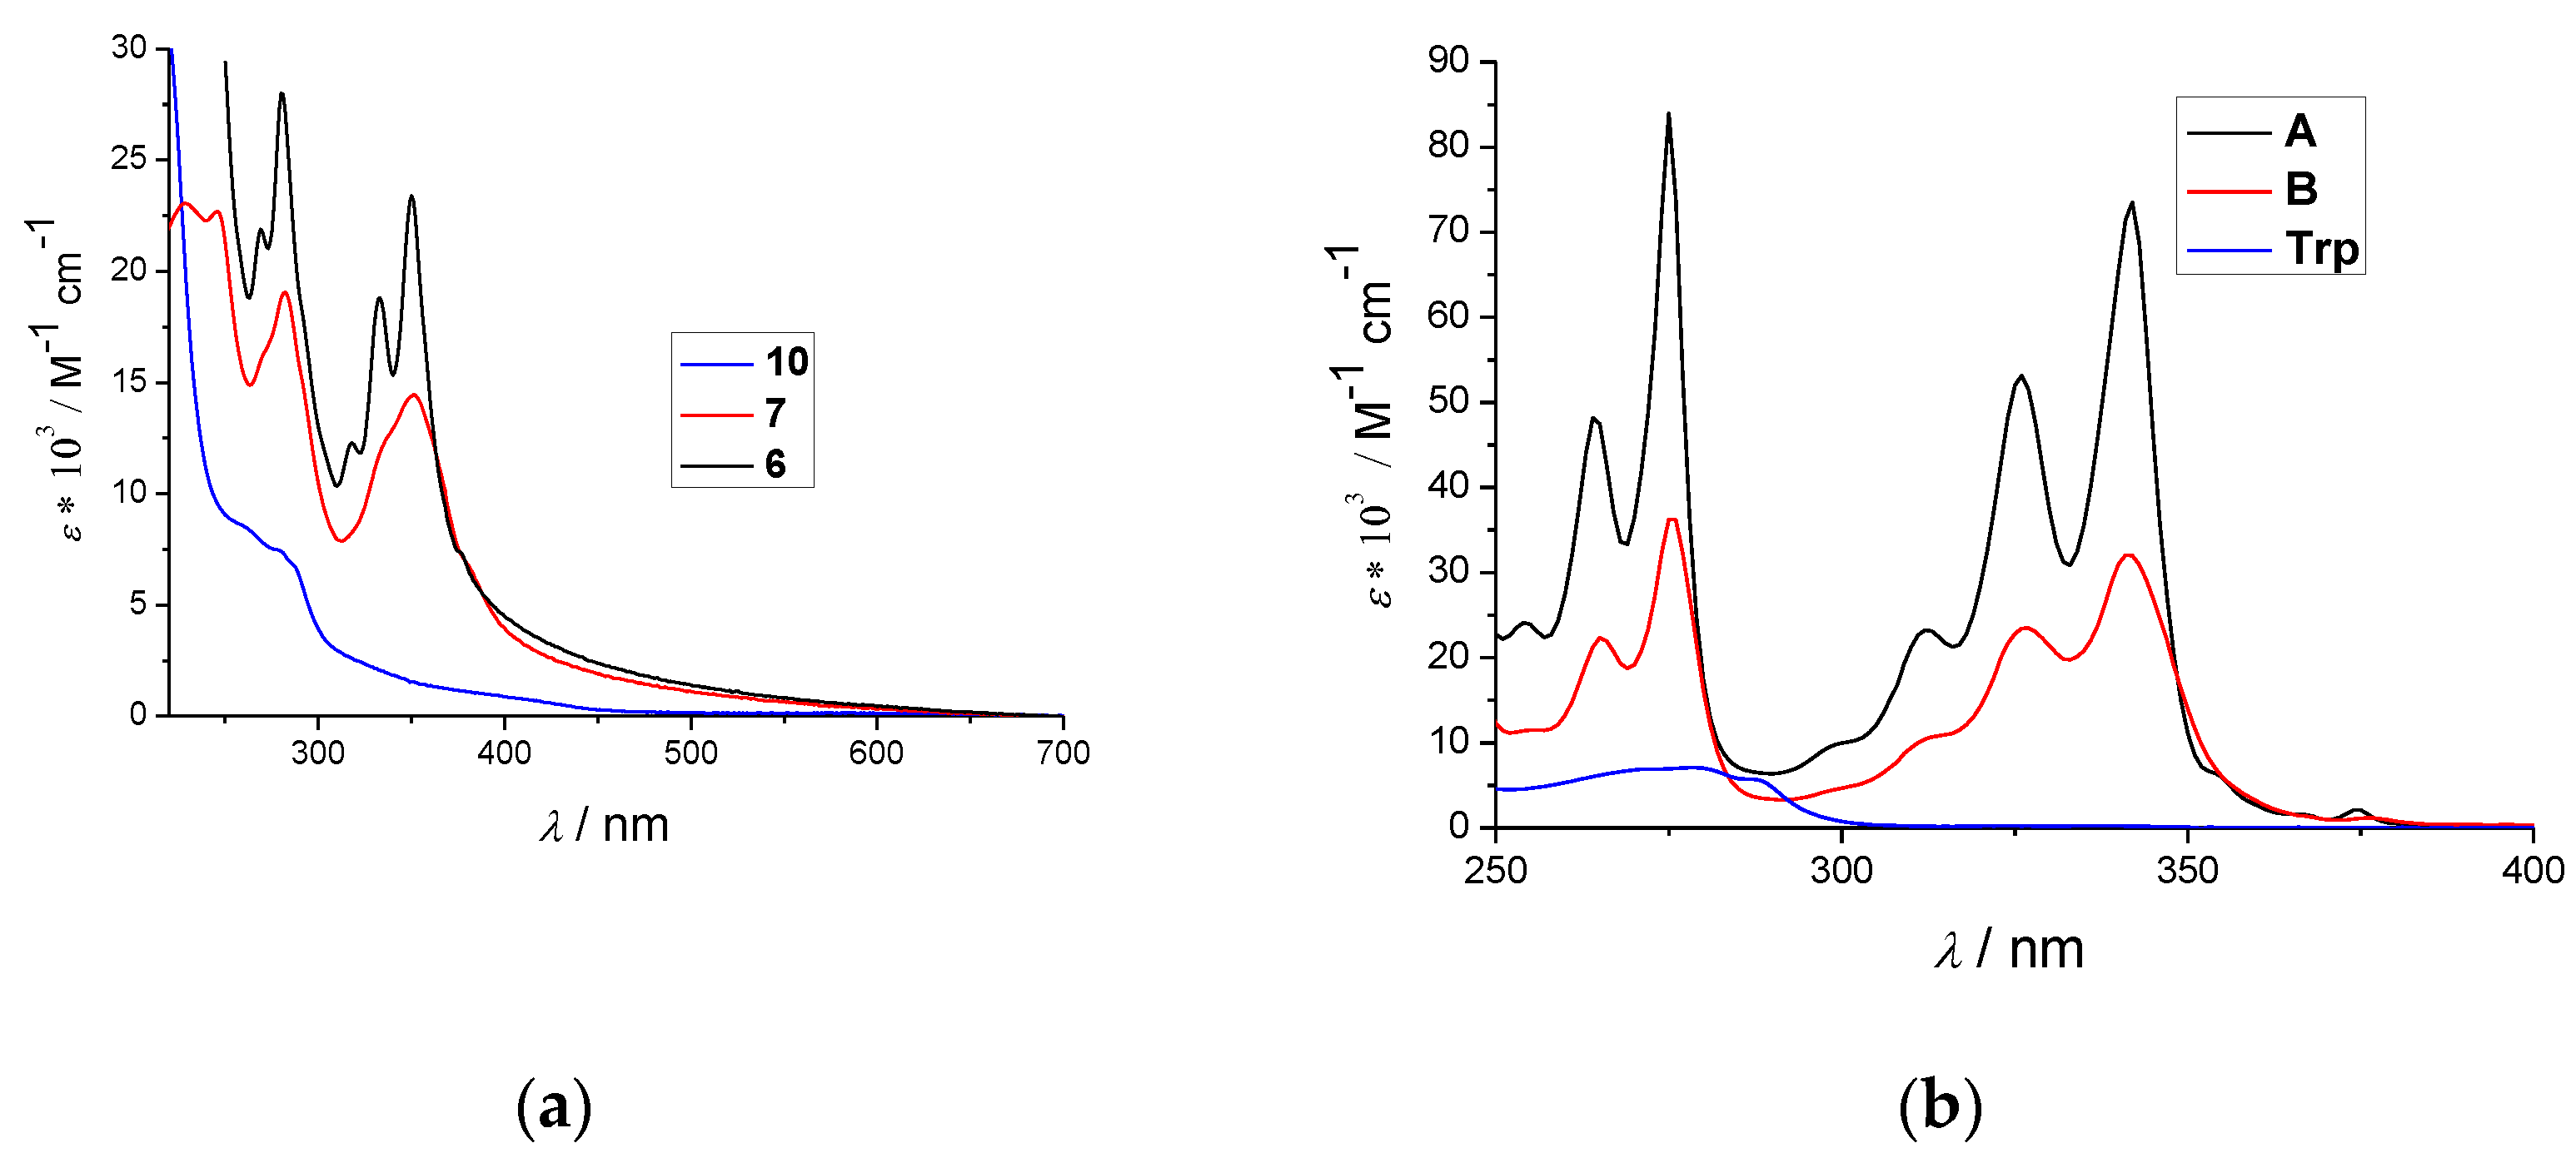
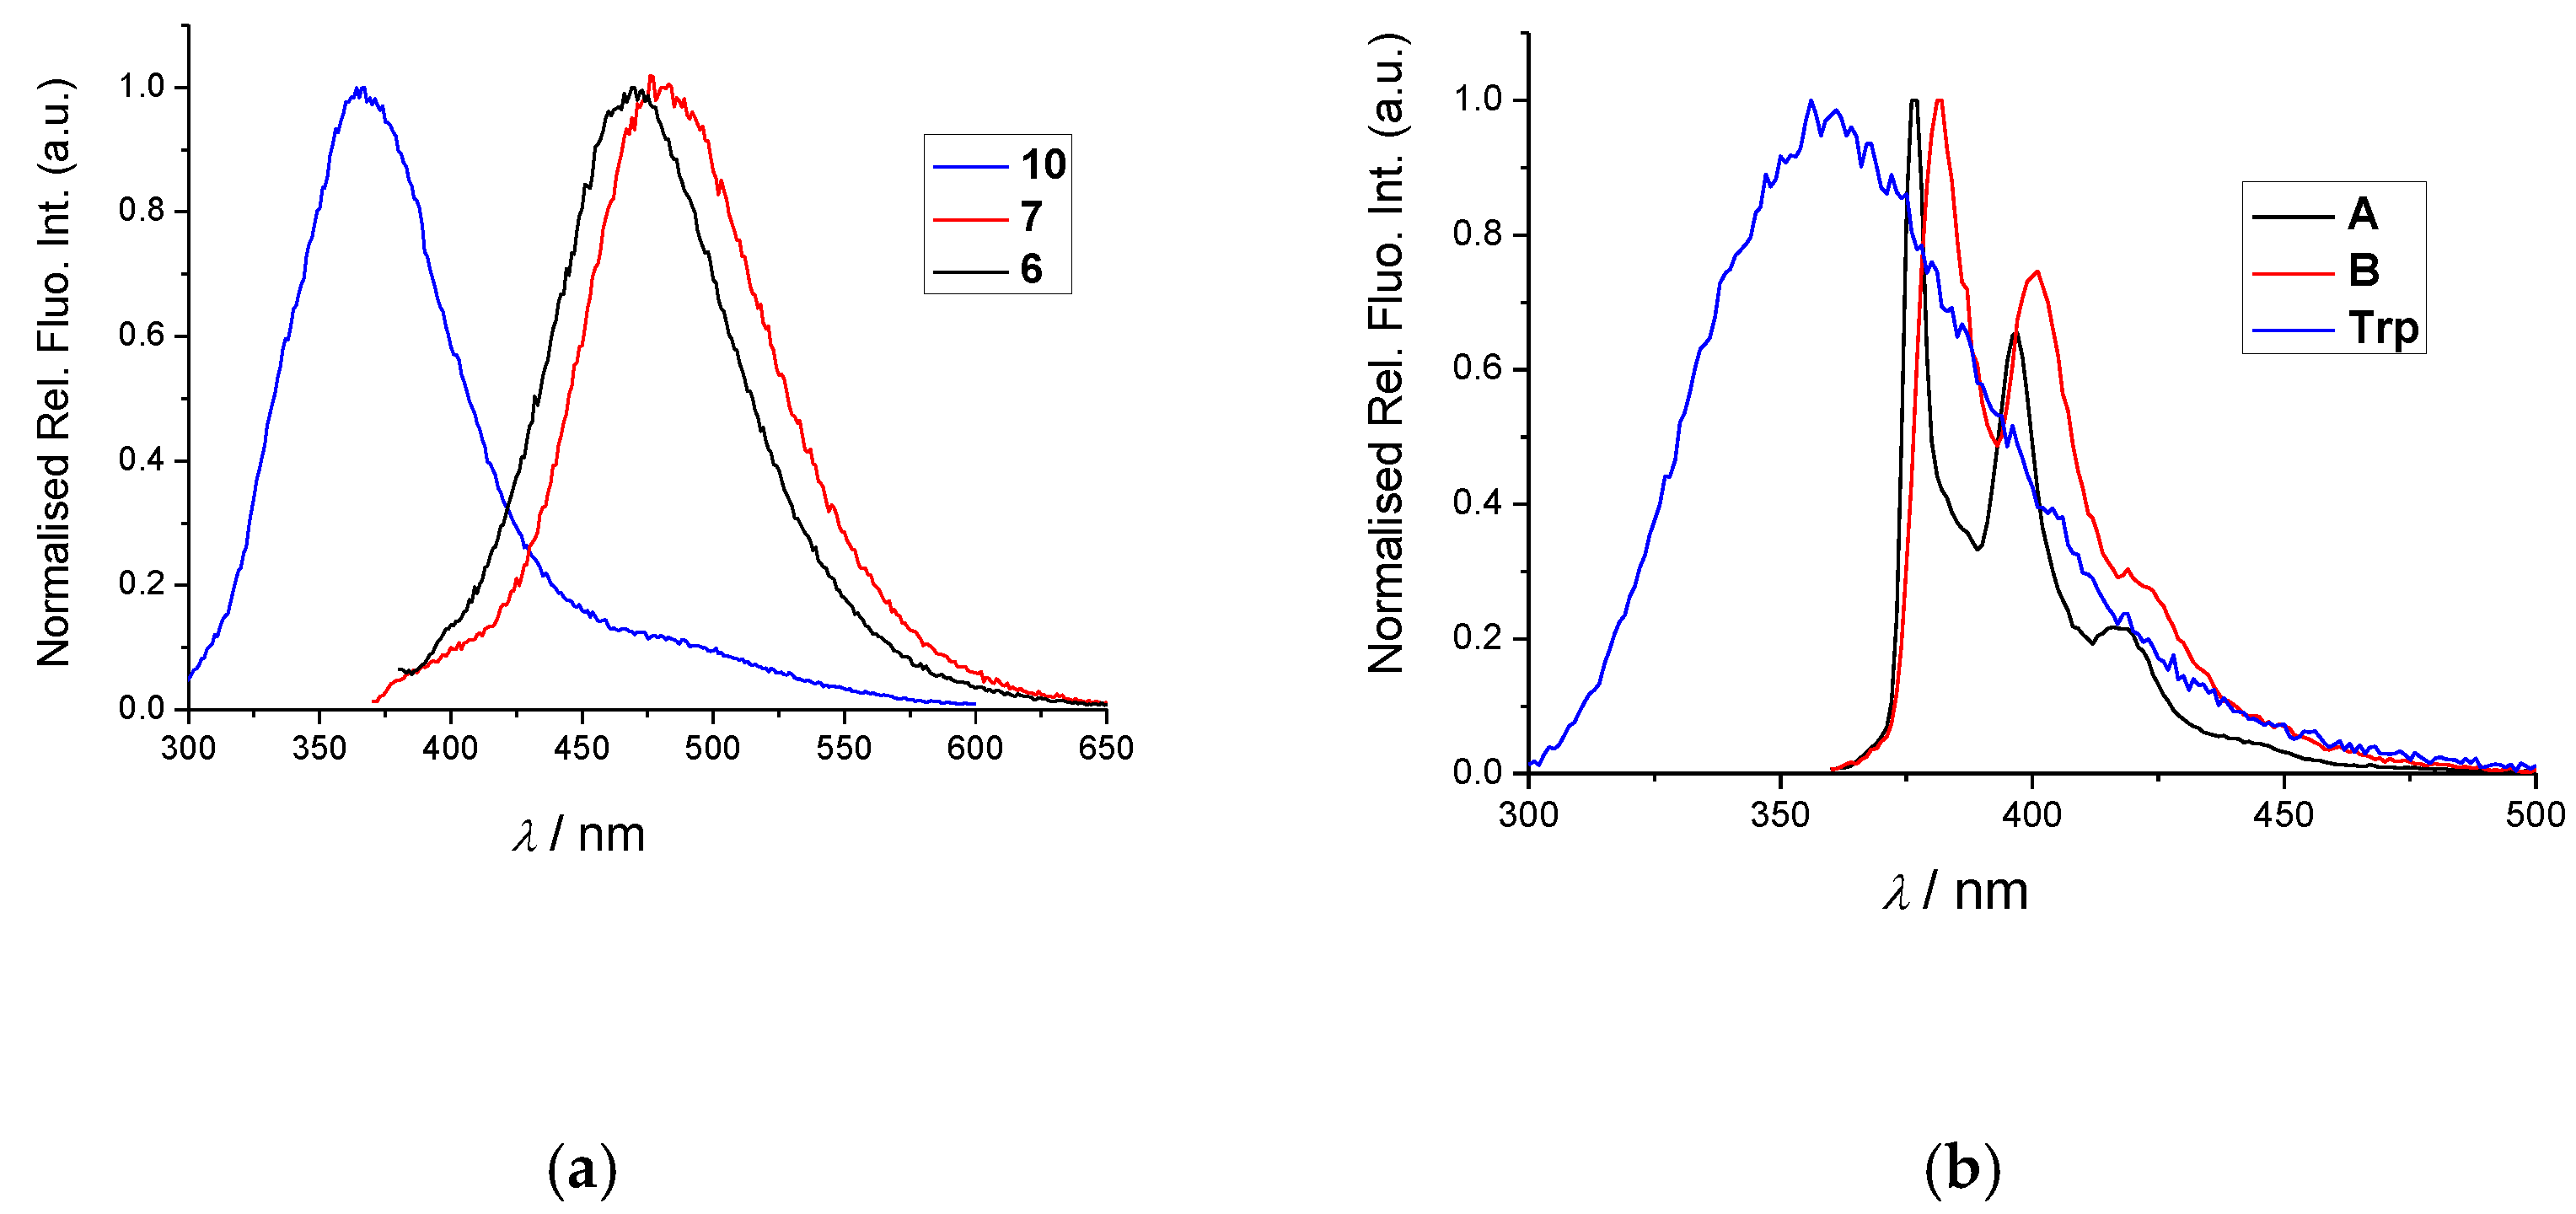
2.2. Spectrophotometric Characterisation
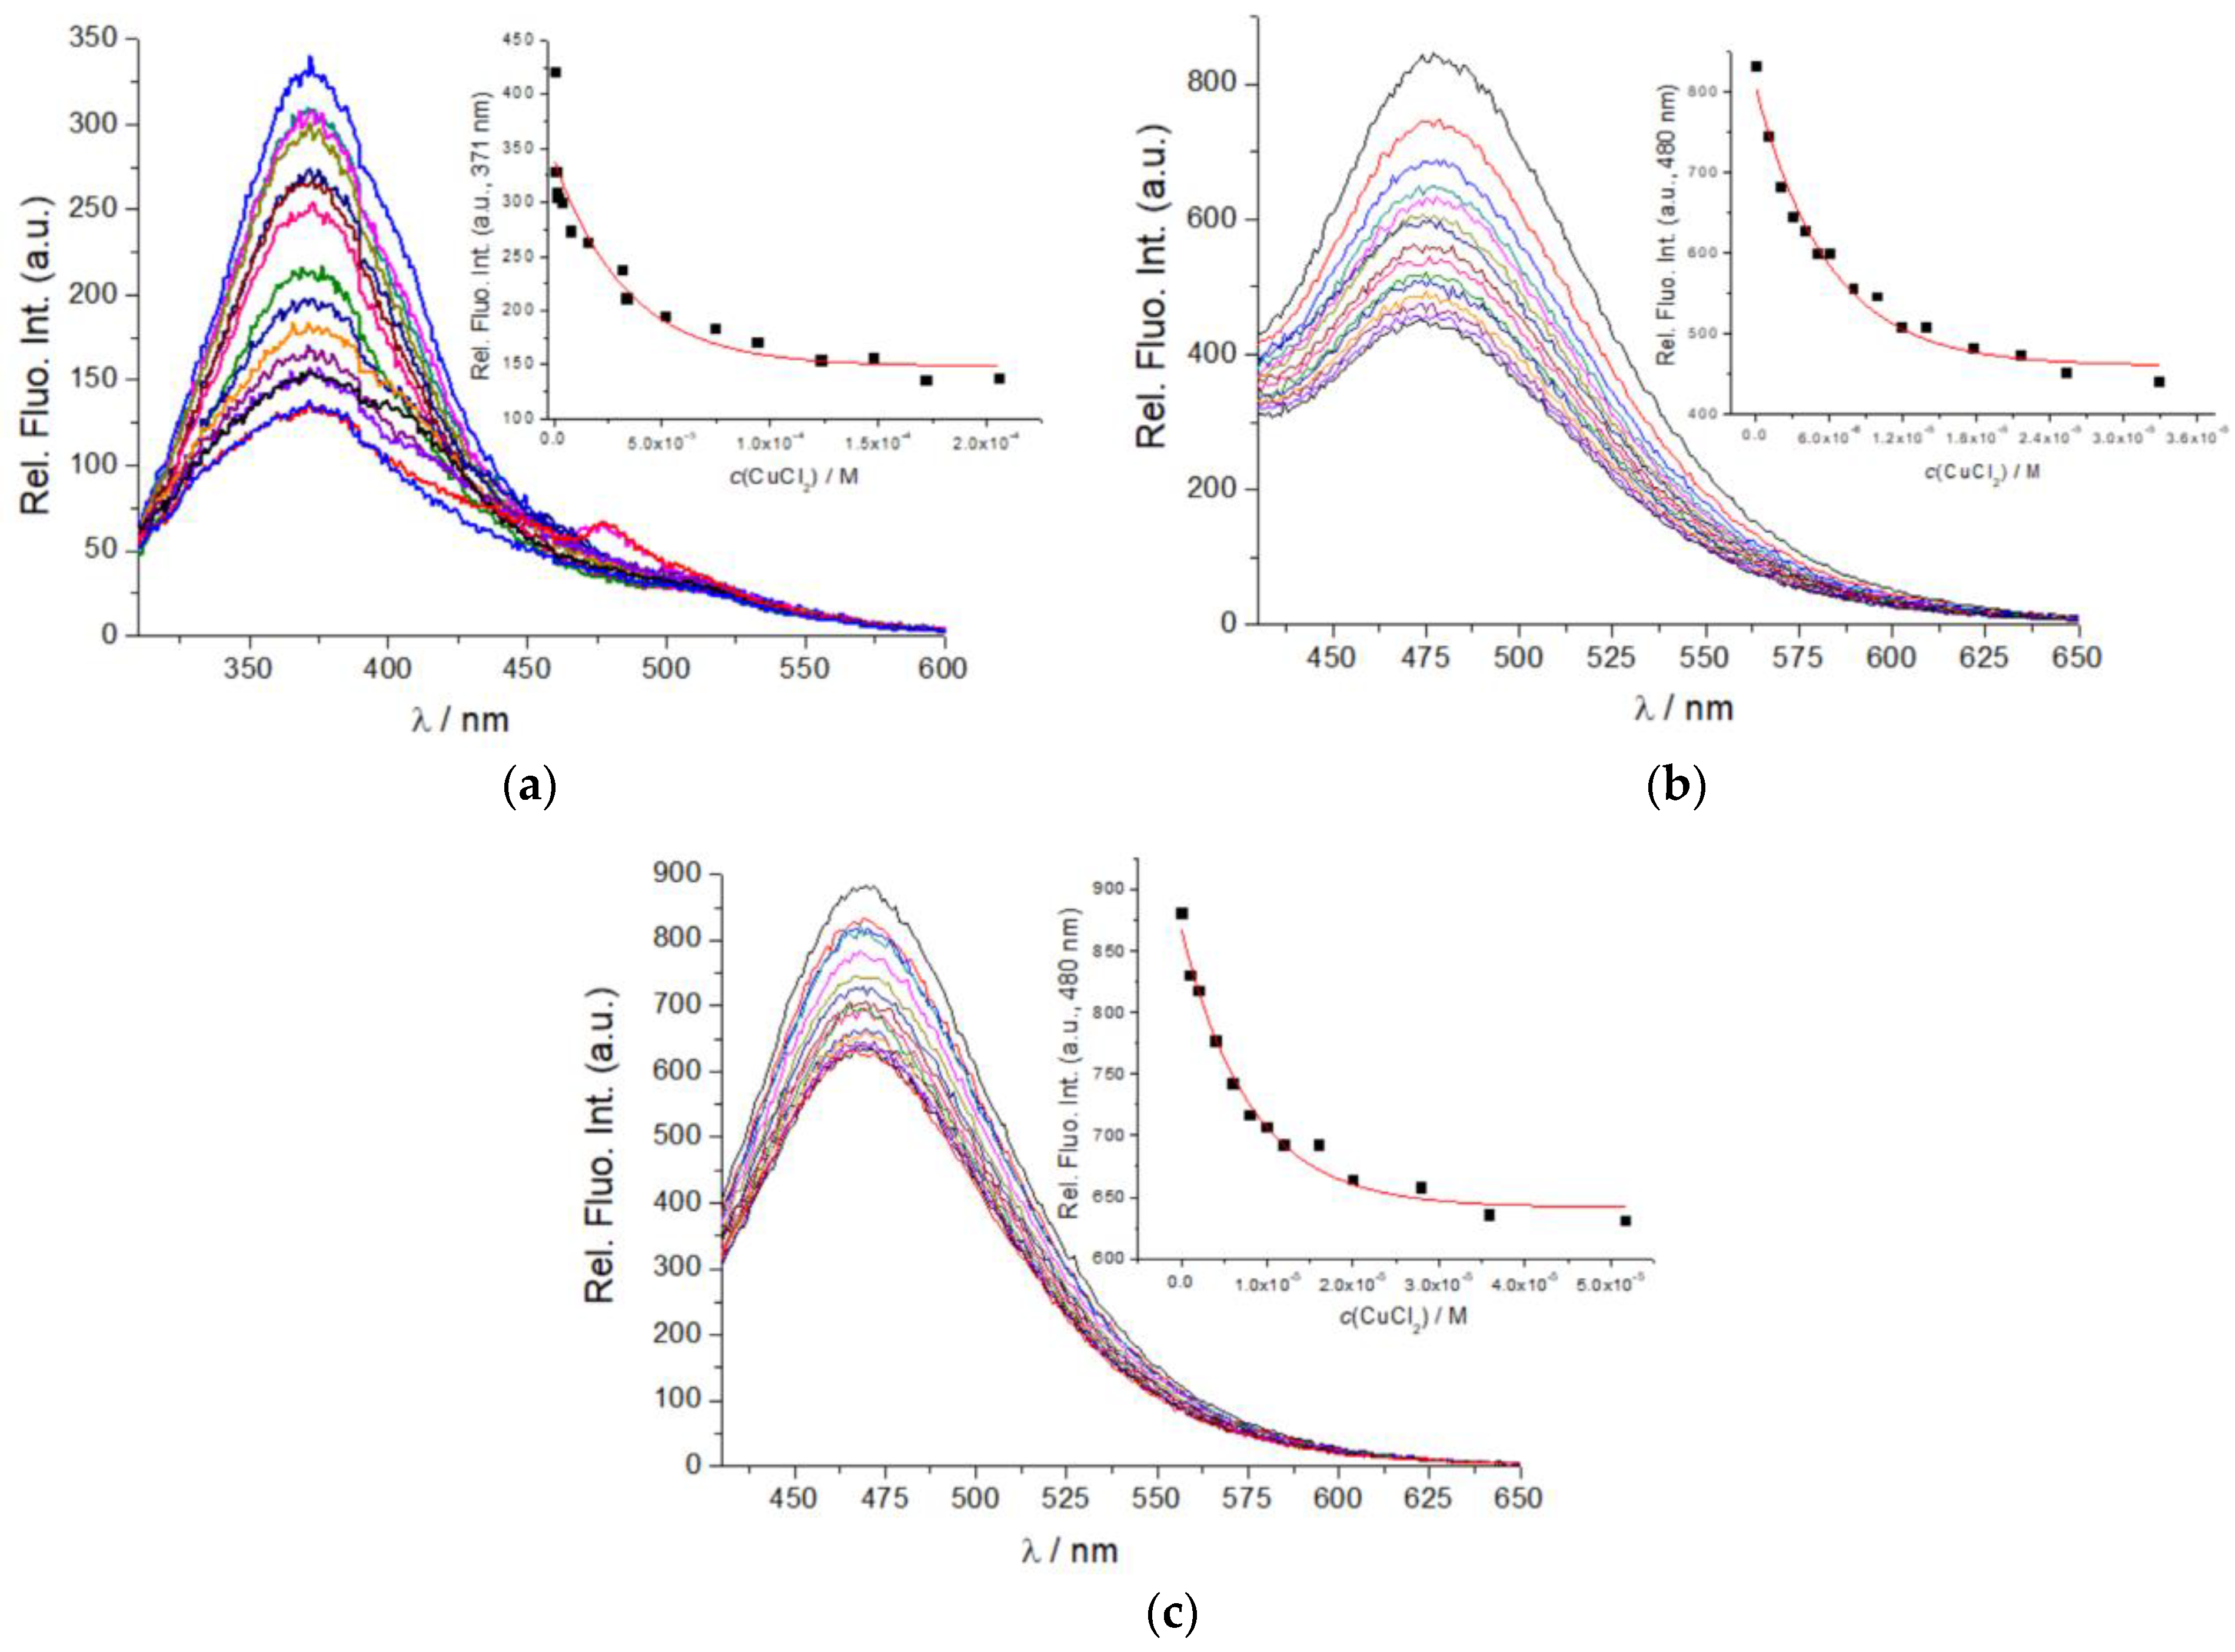
2.3. Binding of Cu2+ Cation
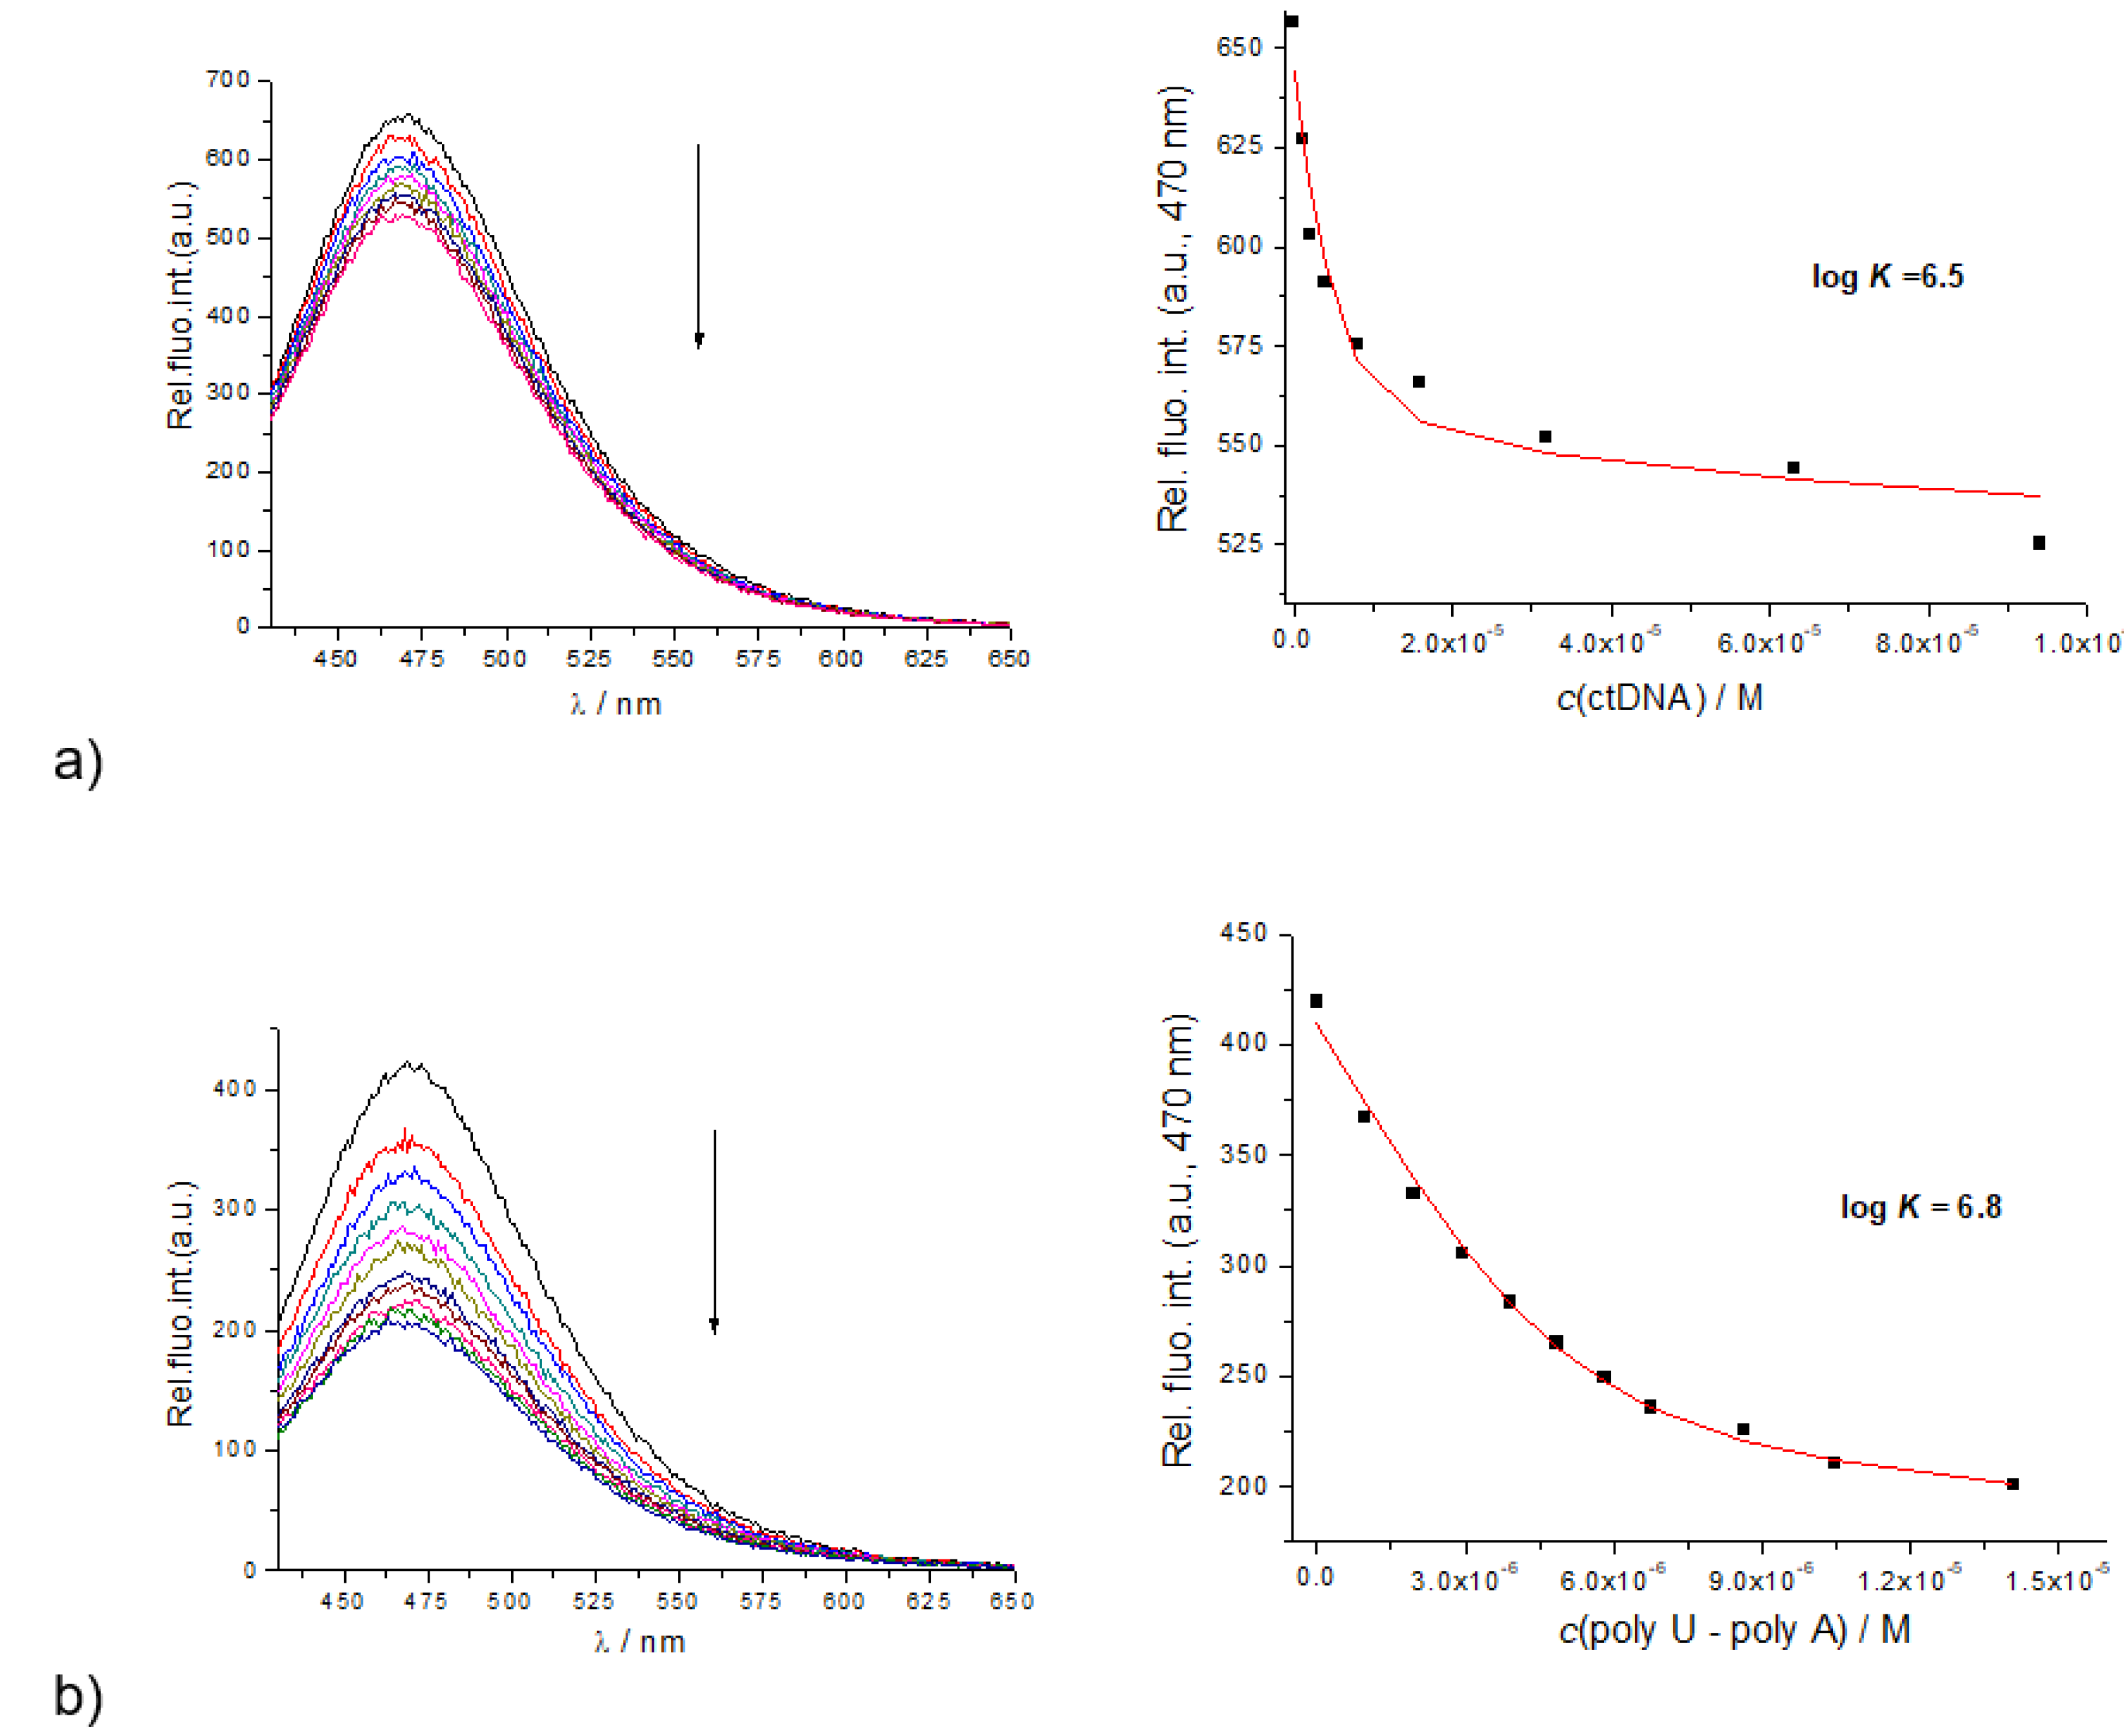
2.4. Study of Interactions of 6, 7 and 10 with Ds-DNA and Ds-RNA in the Presence/Absence of Cu2+
2.4.1. Fluorimetric Titrations
2.4.2. Circular Dichroism (CD) Experiments
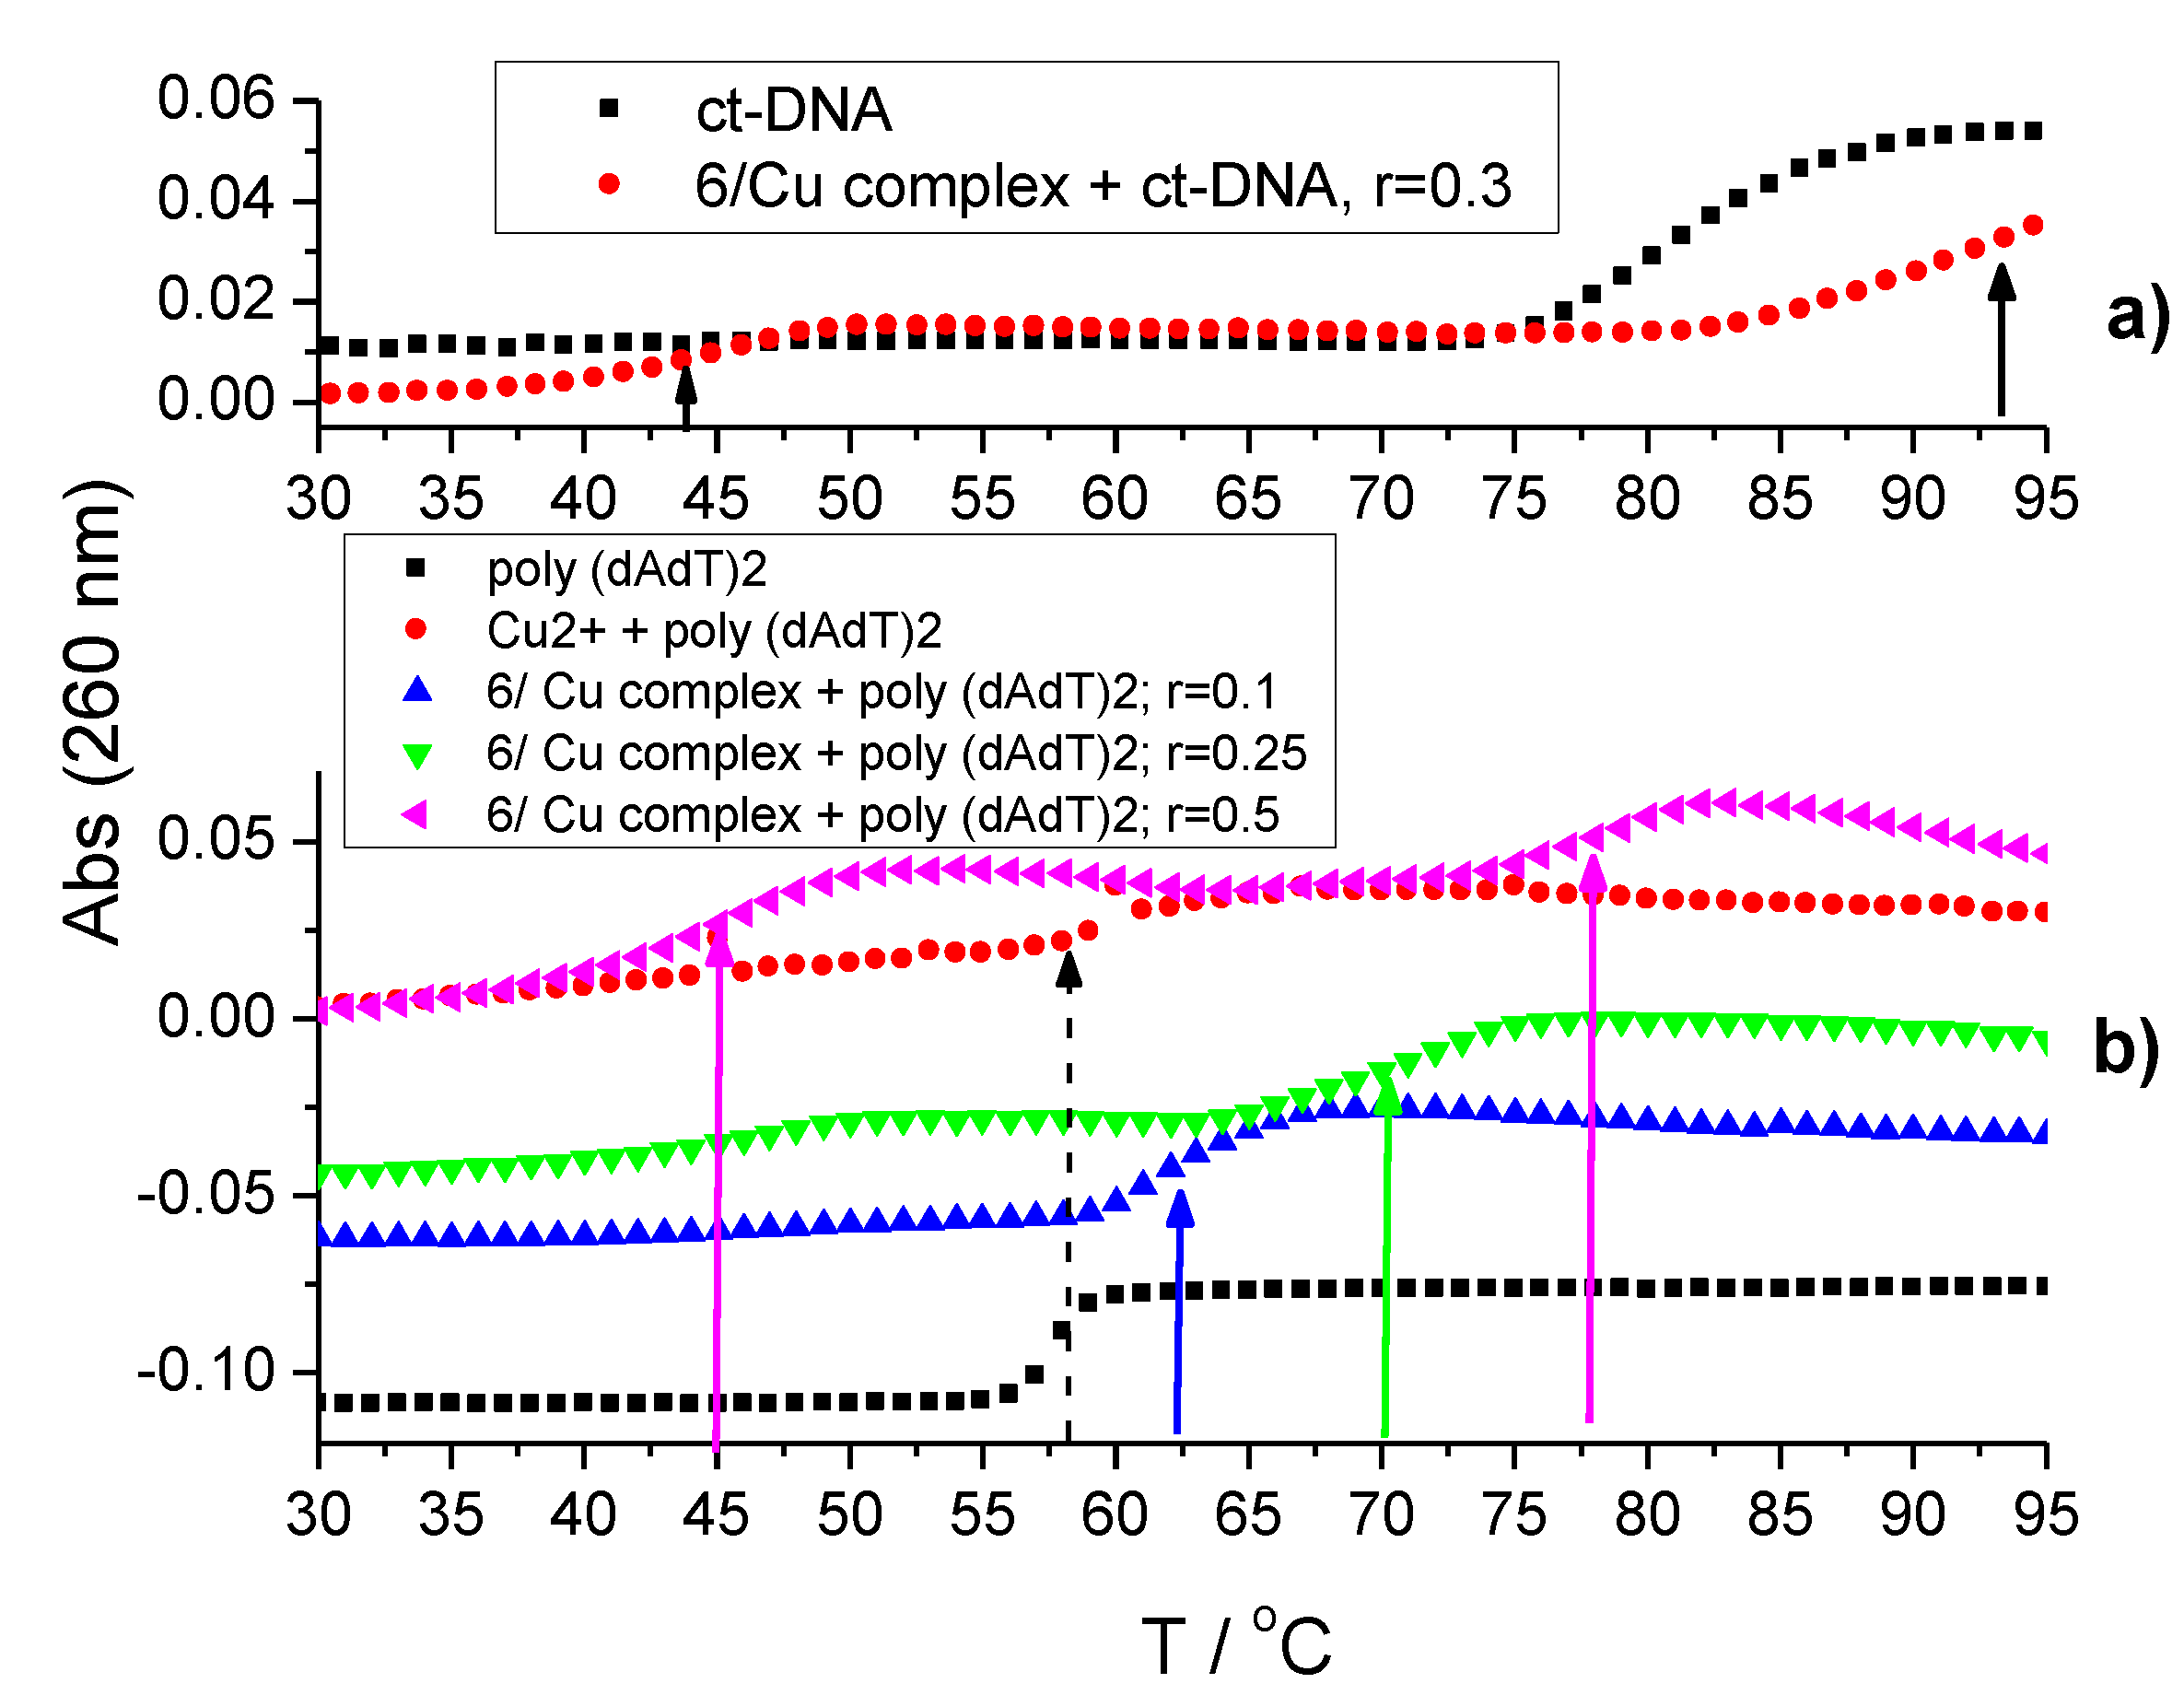
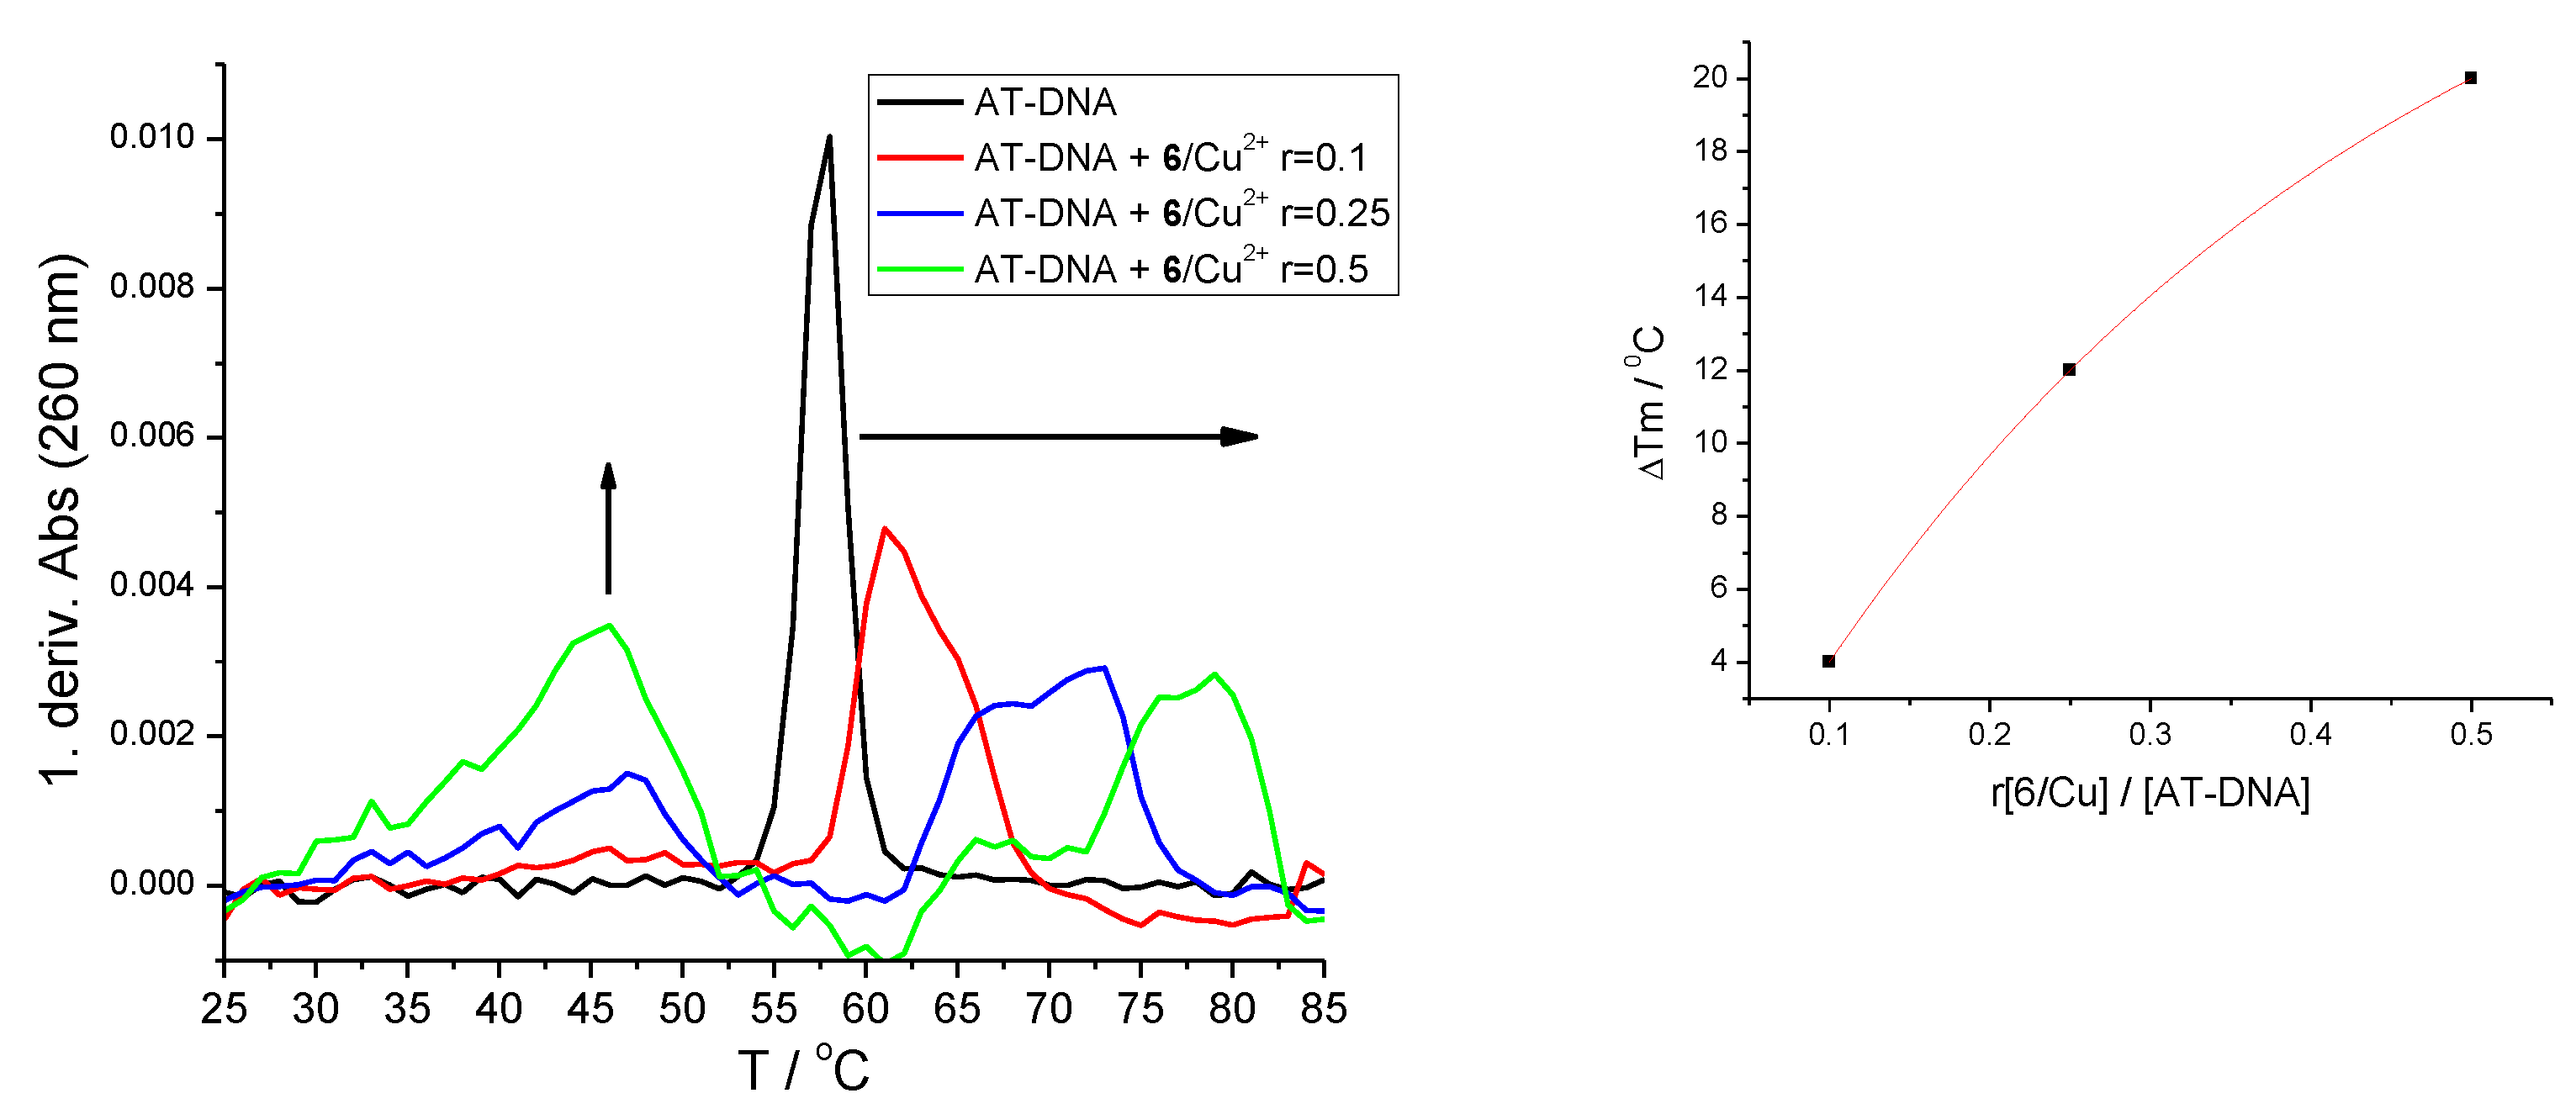
2.4.3. Thermal Denaturation of Ds-DNA/RNA
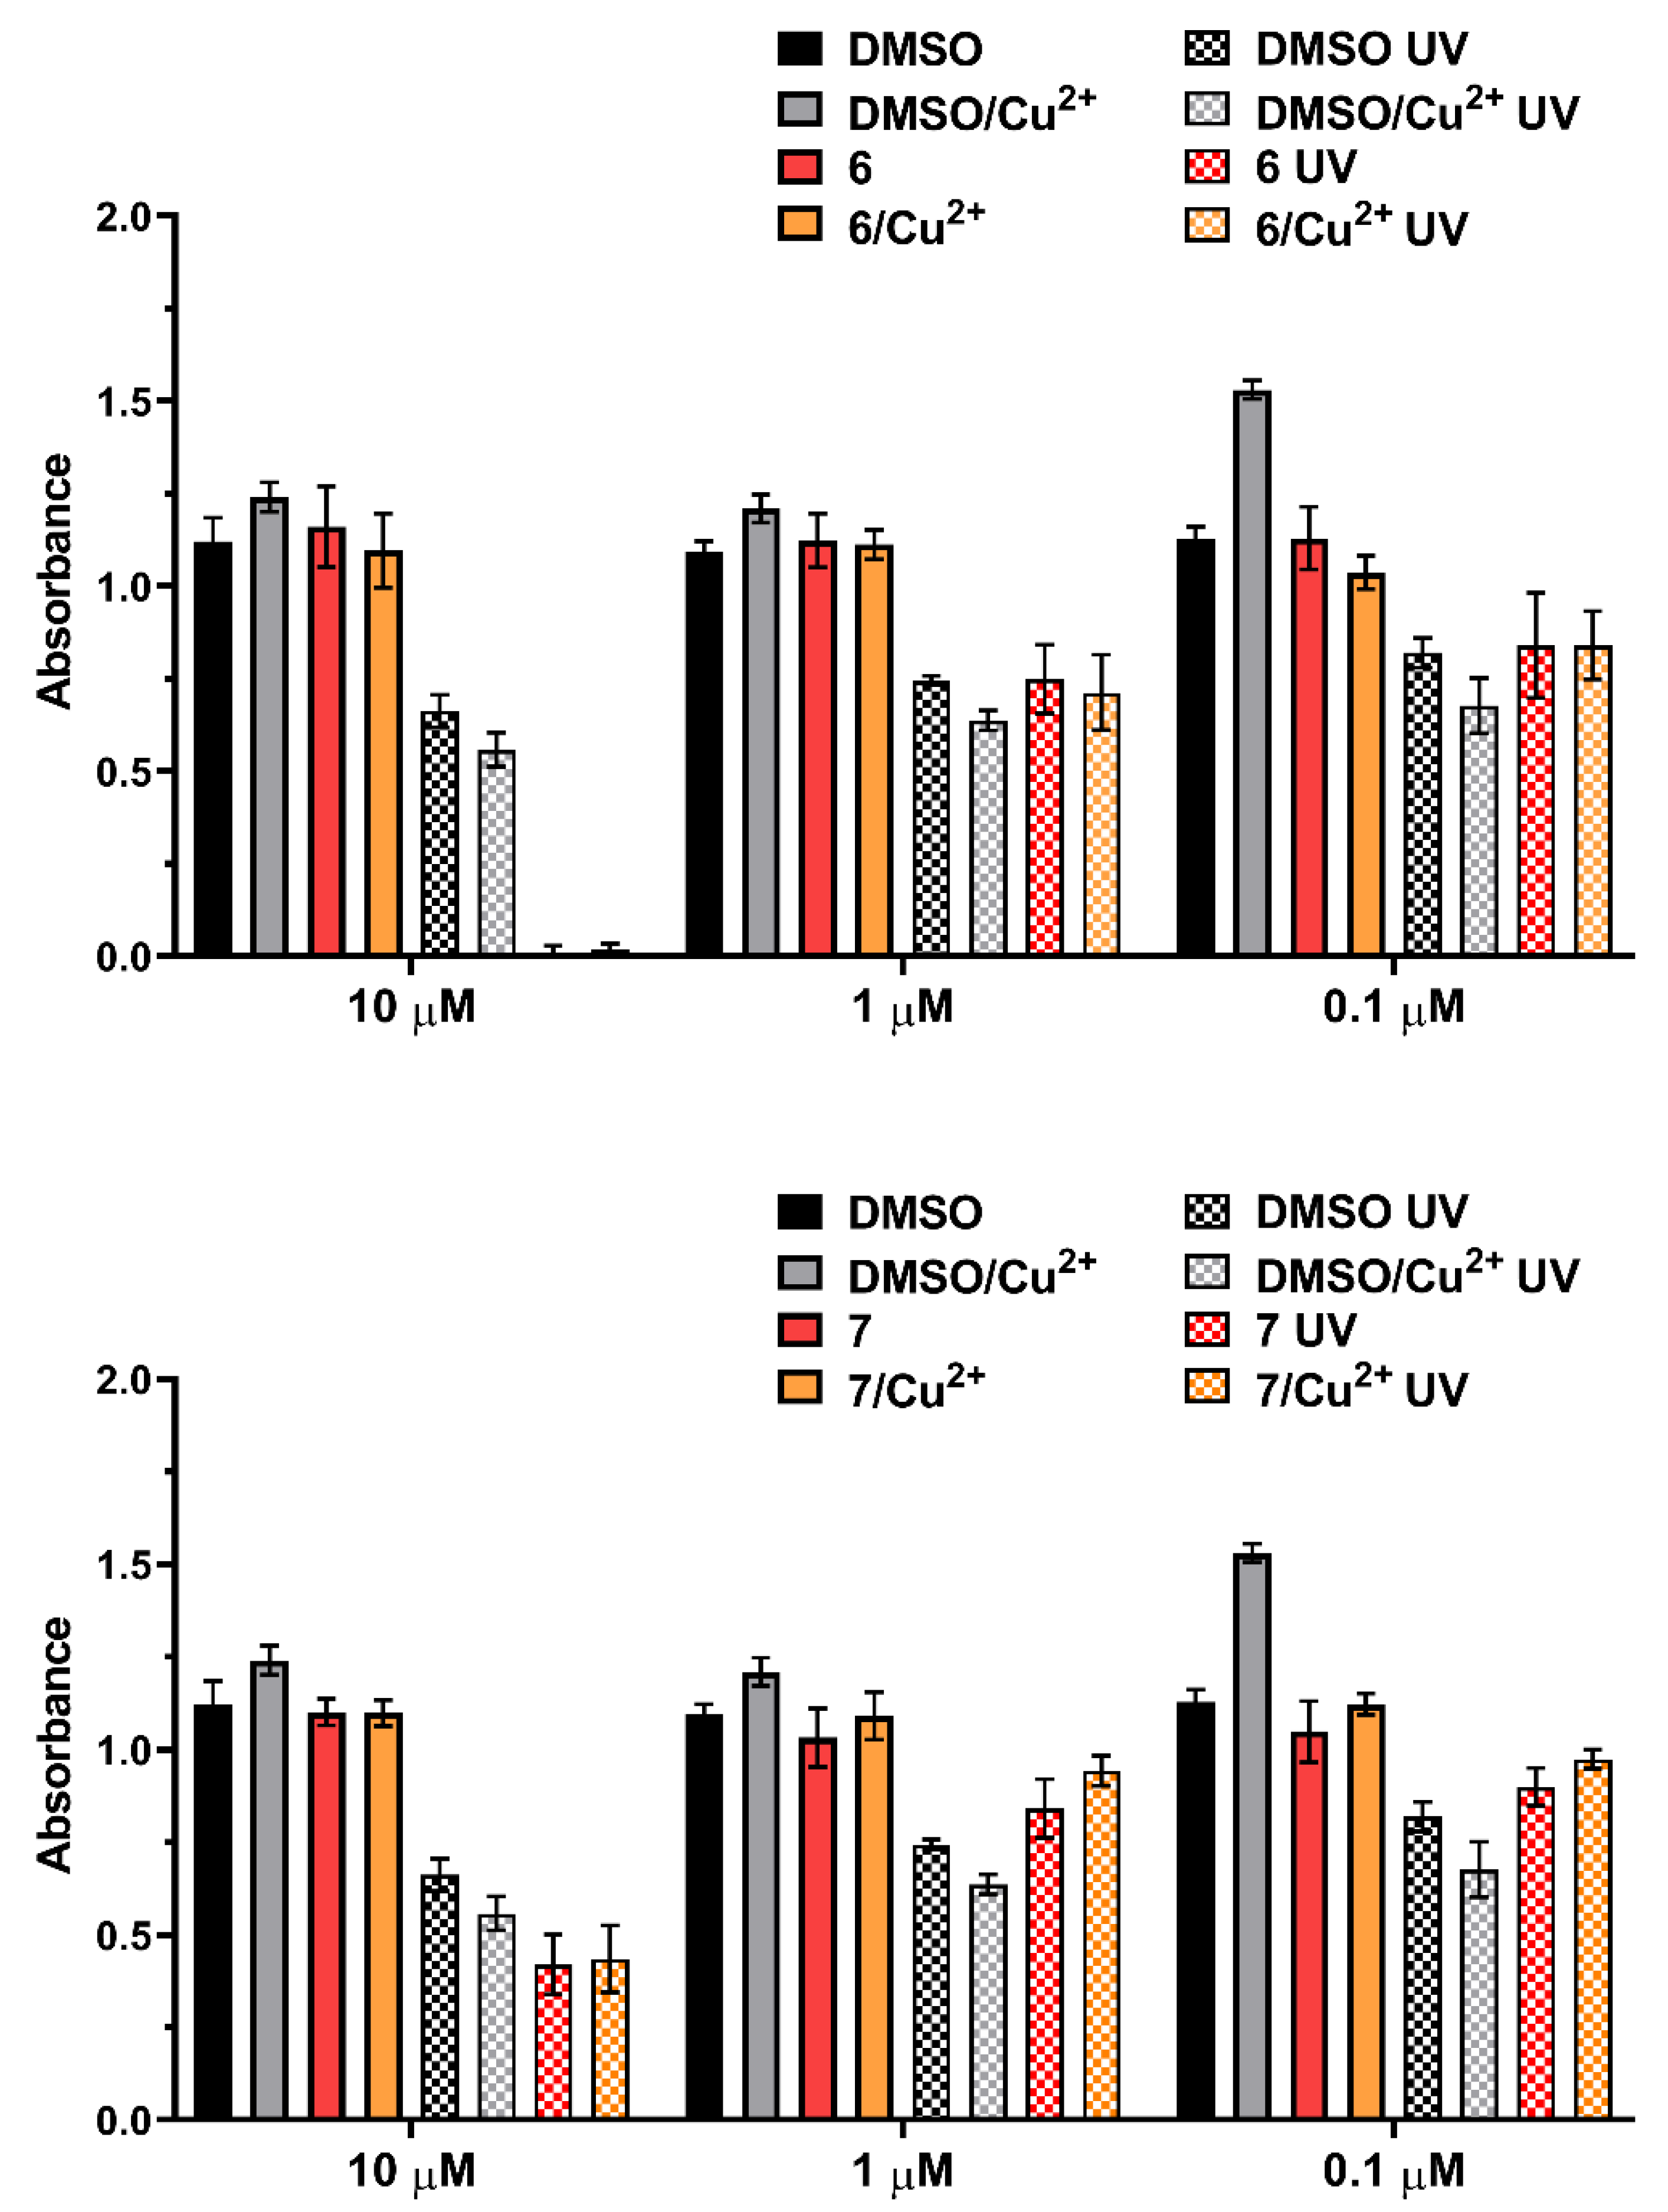
2.4.4. UV Exposure of Compounds 6 and 7 and/or Complexes with Cu Cation Induces Plasmid DNA Breaks
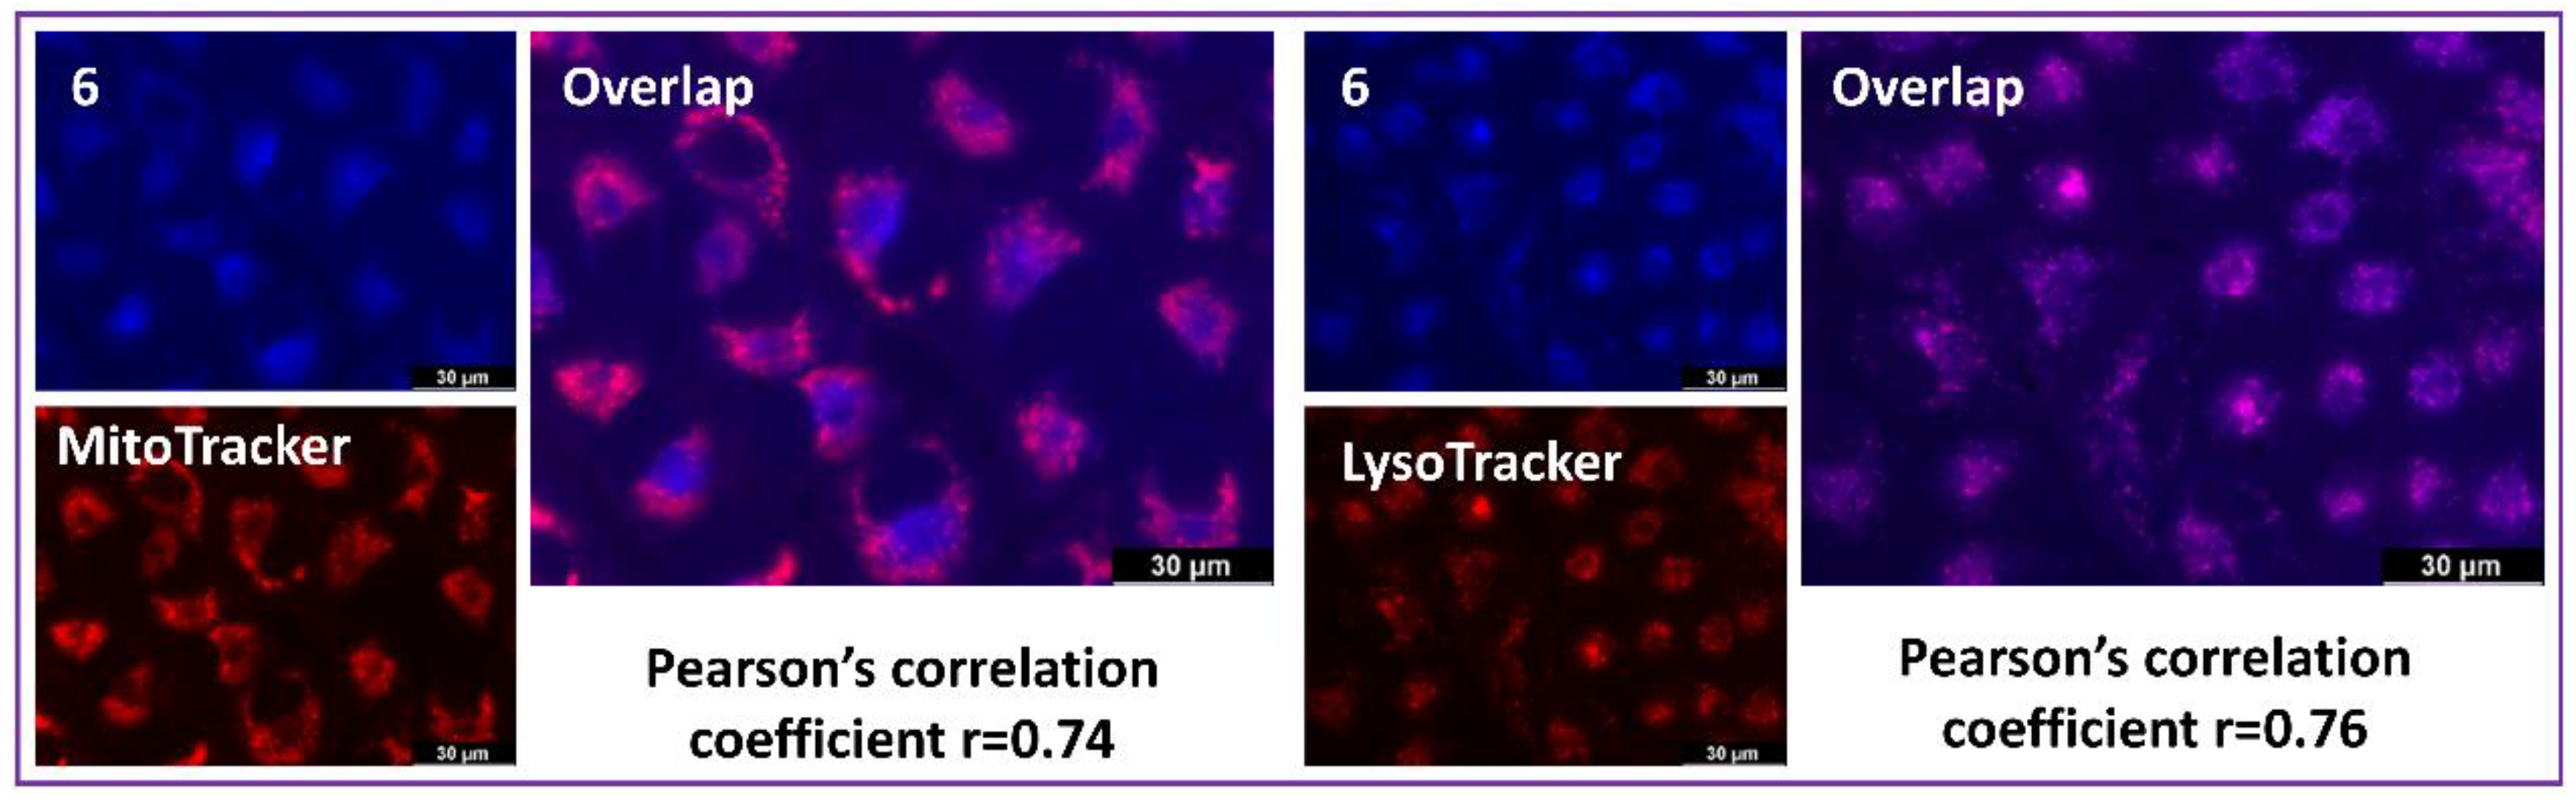
2.5. Biological Experiments
3. Materials and Methods
3.1. General
3.2. Synthesis
3.3. Spectrophotometric Characterisation
3.4. Study of DNA/RNA Interactions
3.5. Plasmid Electrophoresis
3.5.1. Photoinduced DNA Nuclease Activity of Compounds 6 and 7
3.5.2. Thermal-Dependent Plasmid DNA Linearization
3.6. Biology
4. Conclusions
Supplementary Materials
Author Contributions
Funding
Institutional Review Board Statement
Informed Consent Statement
Data Availability Statement
Acknowledgments
Conflicts of Interest
References
- Rodzik, A.; Pomastowski, P.; Sagandykova, G.N.; Buszewski, B. Interactions of Whey Proteins with Metal Ions. Int. J. Mol. Sci. 2020, 21, 2156. [Google Scholar] [CrossRef] [PubMed] [Green Version]
- Tisato, F.; Marzano, C.; Porchia, M.; Pellei, M.; Santini, C. Copper in diseases and treatments and copper-based anticancer strategies. Med. Res. Rev. 2010, 30, 708–749. [Google Scholar] [CrossRef] [PubMed]
- Sathyadevi, P.; Krishnamoorthy, P.; Jayanthi, E.; Butorac, R.R.; Cowley, A.H.; Dharmaraj, N. Studies on the effect of metal ions of hydrazone complexes on interaction with nucleic acids, bovine serum albumin and antioxidant properties. Inorg. Chim. Acta 2012, 384, 83–96. [Google Scholar] [CrossRef]
- Harding, M.M.; Nowicki, M.W.; Walkinshaw, M.D. Metals in protein structures: A review of their principal features. Crystallogr. Rev. 2010, 16, 247–302. [Google Scholar] [CrossRef]
- Zou, J.; Sugimoto, N. Complexation of peptide with Cu2+ responsible to inducing and enhancing the formation of α-helix conformation. BioMetals 2000, 13, 349–359. [Google Scholar] [CrossRef]
- Berg, J.M. Metal Ions in Proteins: Structural and Functional Roles; Cold Spring Harbor Laboratory Press: New York, NY, USA, 1987; Volume 52, pp. 579–585. [Google Scholar]
- Horn, D.; Barrientos, A. Mitochondrial copper metabolism and delivery to cytochromec oxidase. IUBMB Life 2008, 60, 421–429. [Google Scholar] [CrossRef] [Green Version]
- Katoh, S. Early research on the role of plastocyanin in photosynthesis. Photosynth. Res. 2003, 76, 255–261. [Google Scholar] [CrossRef]
- Robinett, N.G.; Peterson, R.L.; Culotta, V.C. Eukaryotic copper-only superoxide dismutases (SODs): A new class of SOD enzymes and SOD-like protein domains. J. Biol. Chem. 2017, 293, 4636–4643. [Google Scholar] [CrossRef] [Green Version]
- Solomon, E.I.; Heppner, D.E.; Johnston, E.M.; Ginsbach, J.W.; Cirera, J.; Qayyum, M.; Tian, L. Copper Active Sites in Biology. Chem. Rev. 2014, 114, 3659–3853. [Google Scholar] [CrossRef] [Green Version]
- Laurie, S.H. Handbook of Metal-Ligand Interactions in Biological Fluids: Bioinorganic Chemistry; Berthon, G., Ed.; Marcel Dekker: New York, NY, USA, 1995; Volume 1, pp. 603–619. [Google Scholar]
- Khoury, R.R.; Sutton, G.J.; Ebrahimi, D.; Hibbert, D.B. Formation constants of copper(II) complexes with tripeptides containing Glu, Gly, and His: Potentiometric measurements and modeling by generalized multiplicative analysis of variance. Inorg. Chem. 2014, 53, 1278–1287. [Google Scholar] [CrossRef]
- Sóvágó, I.; Várnagy, K.; Lihi, N.; Grenács, Á. Coordinating properties of peptides containing histidyl residues. Coord. Chem. Rev. 2016, 327–328, 43–54. [Google Scholar] [CrossRef]
- Rimola, A.; Rodríguez-Santiago, L.; Sodupe, M. Cation-pi Interactions and oxidative effects on Cu+ and Cu2+ binding to Phe, Tyr, Trp and His amino acids in the gas phase. Insights from first-principles calculations. J. Phys. Chem. B 2006, 110, 24189–24199. [Google Scholar] [CrossRef] [PubMed]
- Bossak, K.; Mital, M.; Poznański, J.; Bonna, A.; Drew, S.; Bal, W. Interactions of α-Factor-1, a Yeast Pheromone, and Its Analogue with Copper(II) Ions and Low-Molecular-Weight Ligands Yield Very Stable Complexes. Inorg. Chem. 2016, 55, 7829–7831. [Google Scholar] [CrossRef] [PubMed]
- Wezynfeld, N.E.; Tobolska, A.; Mital, M.; Wawrzyniak, U.E.; Wiloch, M.Z.; Plonka, D.; Bossak-Ahmad, K.; Wroblewski, W.; Bal, W. Aβ5–x Peptides: N-Terminal Truncation Yields Tunable Cu(II) Complexes. Inorg. Chem. 2020, 59, 14000–14011. [Google Scholar]
- Ufnalska, I.; Wawrzyniak, U.E.; Bossak-Ahmad, K.; Bal, W.; Wroblewski, W.J. Electrochemical studies of binary and ternary copper(II) complexes with α-factor analogues. J. Electroanal. Chem. 2020, 862, 114003. [Google Scholar] [CrossRef]
- Gonzalez, P.; Bossak, K.; Stefaniak, E.; Hureau, C.; Raibaut, L.; Bal, W.; Faller, P. N-Terminal Cu-Binding Motifs (Xxx-Zzz-His, Xxx-His) and Their Derivatives: Chemistry, Biology and Medicinal Applications. Chem.-Eur. J. 2018, 24, 8029–8041. [Google Scholar] [CrossRef]
- Mahon, K.P.; Roy, M.D.; Carreon, J.R.; Prestwich, E.G.; Rouge, J.L.; Shin, S.; Kelley, S.O. Tunable DNA Cleavage by Intercalating Peptidoconjugates. ChemBioChem 2006, 7, 766–773. [Google Scholar] [CrossRef]
- Ida, S.; Iwamaru, K.; Fujita, M.; Okamoto, Y.; Kudo, Y.; Kurosaki, H.; Otsuka, M. L-Histidyl-glycyl-glycyl-L-histidine. Amino-acid structuring of the bleomycin-type pentadentate metal-binding environment capable of efficient double-strand cleavage of plasmid DNA. Bioorg. Chem. 2015, 62, 8–14. [Google Scholar] [CrossRef]
- Le, X.Y.; Gu, Q.; Song, Z.J.; Zhuang, C.X.; Feng, X.L. Synthesis, molecular structure, DNA binding and cleavage properties of a novel ternary Cu(II) complex containing dipyrido[3,2-a: 2‘3‘-c]phenazine and L-tryptophanate. J. Coord. Chem. 2007, 60, 1359–1371. [Google Scholar] [CrossRef]
- Ruiz, R.; García, B.; Garcia-Tojal, J.; Busto, N.; Ibeas, S.; Leal, J.M.; Martins, C.; Gaspar, J.; Borrás, J.; Gil-García, R.; et al. Biological assays and noncovalent interactions of pyridine-2-carbaldehyde thiosemicarbazonecopper(II) drugs with [poly(dA-dT)](2), [poly(dG-dC)] (2), and calf thymus DNA. J. Biol. Inorg. Chem. 2010, 15, 515–532. [Google Scholar] [CrossRef]
- Crowley, J.D.; McMorran, D.A. “Click-Triazole” Coordination Chemistry: Exploiting 1,4-Disubstituted-1,2,3-Triazoles as Ligands. Top. Heterocycl. Chem. 2012, 28, 31–84. [Google Scholar] [CrossRef]
- Bedeche, S.; Daran, J.-C.; Ruiz, J.; Astruc, D. Synthesis and Coordination Chemistry of Ferrocenyl-1,2,3-triazolyl Ligands. Inorg. Chem. 2008, 47, 4903–4908. [Google Scholar]
- Valverde, I.E.; Mindt, T.L. 1,2,3-Triazoles as Amide-bond Surrogates in Peptidomimetics. CHIMIA 2013, 67, 262–266. [Google Scholar] [CrossRef] [PubMed]
- Hamdan, F.; Tahoori, F.; Balalaie, S. Synthesis of novel cyclopeptides containing heterocyclic skeletons. RSC Adv. 2018, 8, 33893–33926. [Google Scholar] [CrossRef] [PubMed] [Green Version]
- Bonnamour, J.; Legros, J.; Crousse, B.; Bonnet-Delpon, D. Synthesis of new trifluoromethyl peptidomimetics with a triazole moiety. Tetrahedron Lett. 2007, 48, 8360–8362. [Google Scholar] [CrossRef]
- Agalave, S.G.; Maujan, S.R.; Pore, V.S. Click Chemistry: 1,2,3-Triazoles as Pharmacophores. Chem. Asian J. 2011, 6, 2696–2718. [Google Scholar] [CrossRef]
- Kharb, R.; Sharma, P.C.; Yar, M.S. Pharmacological significance of triazole scaffold. J. Enzyme Inhib. Med. Chem. 2010, 26, 1–21. [Google Scholar] [CrossRef]
- Koscak, M.; Krosl, I.; Zinic, B.; Piantanida, I. Fluorescent Analogues of FRH Peptide: Cu(II) Binding and Interactions with ds-DNA/RNA. Chemosensors 2022, 10, 34. [Google Scholar] [CrossRef]
- Lakowicz, J.R. Principles of Fluorescence Spectroscopy; Springer: Boston, MA, USA, 2006. [Google Scholar]
- Kostenko, E.; Dobrikov, M.; Pyshnyi, D.; Petyuk, V.; Komarova, N.; Vlassov, V.; Zenkova, M. 5′-bis-pyrenylated oligonucleotides displaying excimer fluorescence provide sensitive probes of RNA sequence and structure. Nucleic Acids Res. 2001, 29, 3611–3620. [Google Scholar] [CrossRef] [Green Version]
- Østergaard, M.E.; Hrdlicka, P.J. Pyrene-functionalized oligonucleotides and locked nucleic acids (LNAs): Tools for fundamental research, diagnostics, and nanotechnology. Chem. Soc. Rev. 2011, 40, 5771–5788. [Google Scholar] [CrossRef]
- Mukherjee, S.; Das Sarma, J.; Shunmugam, R. pH-Sensitive Nanoaggregates for Site-Specific Drug-Delivery as Well as Cancer Cell Imaging. Acs Omega 2016, 1, 755–764. [Google Scholar] [CrossRef] [PubMed]
- Ban, Ž.; Žinić, B.; Matković, M.; Tomašić Paić, A.; Crnolatac, I.; Piantanida, I. Pyrrolocytosine-pyrene conjugates as fluorescent and CD probes for a fine sensing of ds- polynucleotide secondary structure and specific recognition of poly G. New J. Chem. 2019, 43, 8204–8214. [Google Scholar] [CrossRef]
- Ban, Ž.; Matić, J.; Žinić, B.; Foller Füchtbauer, A.; Wilhelmsson, L.M.; Piantanida, I. Flexibility and Preorganization of Fluorescent Nucleobase-Pyrene Conjugates Control DNA and RNA Recognition. Molecules 2020, 25, 2188. [Google Scholar] [CrossRef] [PubMed]
- Astakhova, I.V.; Korshun, V.A.; Wengel, J. Highly Fluorescent Conjugated Pyrenes in Nucleic Acid Probes: (Phenylethynyl)pyrenecarbonyl-Functionalized Locked Nucleic Acids. Chem. Eur. J. 2008, 14, 11010–11026. [Google Scholar] [CrossRef] [PubMed]
- Banik, B.K.; Becker, F.F. Synthesis, electrophilic substitution and structure-activity relationship studies of polycyclicaromatic compounds towards the development of anticancer agents. Curr. Med. Chem. 2001, 12, 1513–1533. [Google Scholar] [CrossRef] [PubMed]
- Kanamori, T.; Matsuyama, A.; Naito, H.; Tsuga, Y.; Ozako, Y.; Ogura, S.; Okazaki, S.; Yuasa, H. Water-Soluble Glucosyl Pyrene Photosensitizers: An Intramolecularly Synthesized 2-C-Glucoside and an O-Glucoside. J. Org. Chem. 2018, 83, 13765–13775. [Google Scholar] [CrossRef]
- Yang, Y.; Wang, L.; Cao, H.Q.; Li, Q.; Li, Y.; Han, M.J.; Wang, H.; Li, J.B. Photodynamic Therapy with Liposomes Encapsulating Photosensitizers with Aggregation-Induced Emission. Nano Lett. 2019, 19, 1821–1826. [Google Scholar] [CrossRef]
- Dobos, A.; Steiger, W.; Theiner, D.; Gruber, P.; Lunzer, M.; Van Hoorick, J.; Van Vlierberghe, S.; Ovsianikov, A. Screening of two-photon activated photodynamic therapy sensitizers using a 3D osteosarcoma model. Analyst 2019, 144, 3056–3063. [Google Scholar] [CrossRef] [Green Version]
- Bolze, F.; Jenni, S.; Sour, A.; Heitz, V. Molecular photosensitisers for two-photon photodynamic therapy. Chem. Commun. 2017, 53, 12857–12877. [Google Scholar] [CrossRef]
- Sun, B.B.; Wang, L.; Li, Q.; He, P.P.; Liu, H.L.; Wang, H.; Yang, Y.; Li, J.B. Bis(pyrene)-Doped Cationic Dipeptide Nanoparticles for Two-Photon-Activated Photodynamic Therapy. Biomacromolecules 2017, 18, 3506–3513. [Google Scholar] [CrossRef]
- Keller, O.; Keller, W.E.; Van Look, G.; Wersin, G. Tert-Butoxycarbonylation of Amino Acids and their Derivatives: N-tert-Butoxycarbonyl-l-phenylalanine. Org. Synth. 1985, 63, 160. [Google Scholar] [CrossRef]
- Orehovec, I.; Glavac, D.; Dokli, I.; Gredicak, M.; Piantanida, I. Impact of the Supramolecular Organisation of Pyrene—Quinoline Conjugates on their Interaction with ds—DNA. Croat. Chem. Acta 2017, 90, 603–611. [Google Scholar] [CrossRef]
- McGhee, J.D.; Von Hippel, P.H. Theoretical aspects of DNA-protein interactions: Co-operative and non-co-operative binding of large ligands to a one-dimensional homogeneous lattice. J. Mol. Biol. 1974, 86, 469–489. [Google Scholar] [CrossRef]
- Rodger, A.; Norden, B. Circular Dichroism and Linear Dichroism; Oxford University Press: New York, NY, USA, 1997. [Google Scholar]
- Šmidlehner, T.; Piantanida, I.; Pescitelli, G. Polarization Spectroscopy Methods in the Determination of Interactions of Small Molecules with Nucleic Acids-Tutorial. Beilstein J. Org. Chem. 2018, 14, 84–105. [Google Scholar] [CrossRef]
- Eriksson, M.; Norden, B. Linear and Circular Dichroism of Drug-Nucleic Acid Complexes. Methods Enzymol. 2001, 340, 68–98. [Google Scholar] [CrossRef]
- List, N.H.; Knoops, J.; Rubio-Magnieto, J.; Ide, J.; Beljonne, D.; Norman, P.; Surin, M.; Linares, M. Origin of DNA-Induced Circular Dichroism in a Minor-Groove Binder. J. Am. Chem. Soc. 2017, 139, 14947–14953. [Google Scholar] [CrossRef]
- Sedgwick, A.C.; Brewster, J.T.; Wu, T.H.; Feng, X.; Bull, S.D.; Qian, X.H.; Sessler, J.L.; James, T.D.; Anslyn, E.V.; Sun, X.L. Indicator displacement assays (IDAs): The past, present and future. Chem. Soc. Rev. 2021, 50, 9–38. [Google Scholar] [CrossRef]
- Mergny, J.L.; Lacroix, L. Analysis of Thermal Melting Curves. Oligonucleotides 2003, 13, 515–537. [Google Scholar] [CrossRef]
- Wilson, W.D.; Ratmeyer, L.; Zhao, M.; Strekowski, L.; Boykin, D. The search for structure-specific nucleic acid-interactive drugs: Effects of compound structure on RNA versus DNA interaction strength. Biochemistry 1993, 32, 4098–4104. [Google Scholar] [CrossRef]
- Demeunynck, M.; Bailly, C.; Wilson, W.D. Small Molecule DNA and RNA Binders: From Synthesis to Nucleic Acid Complexes; Wiley-VCH: Weinheim, Germany, 2004. [Google Scholar]
- Wawi, M.J.; Bijoux, A.; Inguimbert, N.; Mahler, C.; Wagner, S.; Marder, T.B.; Ribou, A.C. Peptide Vectors Carry Pyrene to Cell Organelles Allowing Real-Time Quantification of Free Radicals in Mitochondria by Time-Resolved Fluorescence Microscopy. ChemBioChem 2021, 22, 1676–1685. [Google Scholar] [CrossRef]
- Stanley, N.J.; Sejer Pedersen, D.; Nielsen, B.; Kvist, T.; Mathiesen, J.M.; Bräuner-Osborne, H.; Taylor, D.K.; Abell, A.D. 1,2,3-Triazolyl amino acids as AMPA receptor ligands. Bioorg. Med. Chem. Lett. 2010, 20, 7512–7515. [Google Scholar] [CrossRef]
- Li, J.; Sha, Y. A Convenient Synthesis of Amino Acid Methyl Esters. Molecules 2008, 13, 1111–1119. [Google Scholar] [CrossRef] [Green Version]
- Dourtoglou, V.; Gross, B.; Lambropoulou, V.; Zioudrou, C. O-benzotriazolyl-N,N,N',N'-tetramethyluronium hexafluoro-phosphate as coupling reagent for the synthesis of peptides of biological interest. Synthesis 1984, 07, 572–574. [Google Scholar] [CrossRef]
- Feldman, A.K.; Colasson, B.; Fokin, V.V. One-Pot Synthesis of 1,4-Disubstituted 1,2,3-Triazoles from In Situ Generated Azides. Org. Lett. 2004, 6, 3897–3899. [Google Scholar] [CrossRef]
- Hassan, S.; Mueller, T.J.J. ChemInform Abstract: Multicomponent Syntheses Based upon Copper-Catalyzed Alkyne-Azide Cycloaddition. ChemInform 2015, 46. [Google Scholar] [CrossRef]
- Keller, O.; Keller, W.E.; van Look, G.; Wersin, G. Working with Hazardous Chemicals. Org. Synth. 1985, 63, 160. [Google Scholar]
- Chaires, J.; Dattagupta, N.; Crothers, D.M. Studies on interaction of anthracycline antibiotics and deoxyribonucleic acid: Equilibrium binding studies on the interaction of daunomycin with deoxyribonucleic acid. Biochemistry 1982, 21, 3933–3940. [Google Scholar] [CrossRef]
- Tumir, L.-M.; Piantanida, I.; Cindrić, I.J.; Hrenar, T.; Meić, Z.; Žinić, M. New permanently charged phenanthridinium-nucleobase conjugates. Interactions with nucleotides and polynucleotides and recognition of ds-polyAH+. J. Phys. Org. Chem. 2003, 16, 891–899. [Google Scholar] [CrossRef]
- Saenger, W. Principles of Nucleic Acid Structure; Springer: New York, NY, USA, 1983. [Google Scholar]
- Cantor, C.R.; Schimmel, P.R. Biophysical Chemistry; WH Freeman and Co.: San Francisco, CA, USA, 1980; Volume 3, pp. 1109–1181. [Google Scholar]


| Compd. | λmax/nm | ε/M−1cm−1 | Φf | c λexc/nm | λem/nm | τ/ns b (Purged) | χ2 |
|---|---|---|---|---|---|---|---|
| A(ref6) | 342 | 62,596+/−1248 | a 0.15 ± 0.02 | 340 | 398 | 2.5 (1%) 100.3 (99.2%) | 1.060 |
| B(ref7) | 341 | 31,586+/−1297 | a 0.16 ± 0.03 | 340 | 401 | 38.3 (-) 566.2(-B) | 1.207 |
| 6 | 350 | 25,012+/−638 | d 0.02 ± 0.005 | 340 | 472 | 11.6 (62%) 36.4 (37%) | 1.223 |
| 7 | 352 | 15,197+/−225 | d 0.08 ± 0.001 | 340 | 481 | 32.2 (100%) | 1.286 |
| a Trp | 295 | 5600 | a 0.14 ± 0.02 | 280 | 366 | a 0.53 a 3.1 | - |
| 10 | 295 | 8322+/−0.5 | d 0.017 ± 0.002 | 280 | 360 | 0.96 (29%) 4.1 (71%) | 1.091 |
| Compound | ct-DNA | Poly A–Poly U |
|---|---|---|
| 6 | 6.5 | 6.8 |
| 7 | 6.8 | 6.6 |
| 10 | 4.6 | - |
| WHW | 4.1 | - |
| Compound | ct-DNA | AU-RNA | AT-DNA |
|---|---|---|---|
| 6 b6 + 5Cu2+ | 0 c −38; +>12 | 0 +32 | 0 c −12; +>12 |
| 7 b7 + 5Cu2+ | 0 +2.5 | 0 +1.0 | - - |
| 10 b10 + 5Cu2+ | 0 +9.8 | 0 0 | - - |
Publisher’s Note: MDPI stays neutral with regard to jurisdictional claims in published maps and institutional affiliations. |
© 2022 by the authors. Licensee MDPI, Basel, Switzerland. This article is an open access article distributed under the terms and conditions of the Creative Commons Attribution (CC BY) license (https://creativecommons.org/licenses/by/4.0/).
Share and Cite
Krošl, I.; Košćak, M.; Ribičić, K.; Žinić, B.; Majhen, D.; Božinović, K.; Piantanida, I. Impact of the Histidine-Triazole and Tryptophan-Pyrene Exchange in the WHW Peptide: Cu(II) Binding, DNA/RNA Interactions and Bioactivity. Int. J. Mol. Sci. 2022, 23, 7006. https://doi.org/10.3390/ijms23137006
Krošl I, Košćak M, Ribičić K, Žinić B, Majhen D, Božinović K, Piantanida I. Impact of the Histidine-Triazole and Tryptophan-Pyrene Exchange in the WHW Peptide: Cu(II) Binding, DNA/RNA Interactions and Bioactivity. International Journal of Molecular Sciences. 2022; 23(13):7006. https://doi.org/10.3390/ijms23137006
Chicago/Turabian StyleKrošl, Ivona, Marta Košćak, Karla Ribičić, Biserka Žinić, Dragomira Majhen, Ksenija Božinović, and Ivo Piantanida. 2022. "Impact of the Histidine-Triazole and Tryptophan-Pyrene Exchange in the WHW Peptide: Cu(II) Binding, DNA/RNA Interactions and Bioactivity" International Journal of Molecular Sciences 23, no. 13: 7006. https://doi.org/10.3390/ijms23137006