Article

Genome-Wide Identification and Characterization of Growth Regulatory Factor Family Genes in Medicago

1
Institute of Animal Science, Chinese Academy of Agricultural Sciences, Beijing 100193, China
2
College of Horticulture, Hunan Agricultural University, Changsha 410128, China
3
West Arid Region Grassland Resource and Ecology Key Laboratory, College of Grassland and Environmental Sciences, Xinjiang Agricultural University, Urumqi 830052, China
4
Key Laboratory of Forage and Endemic Crop Biotechnology, Ministry of Education, School of Life Sciences, Inner Mongolia University, Hohhot 010010, China
*
Authors to whom correspondence should be addressed.
Int. J. Mol. Sci. 2022, 23(13), 6905; https://doi.org/10.3390/ijms23136905
Submission received: 6 May 2022 / Revised: 5 June 2022 / Accepted: 7 June 2022 / Published: 21 June 2022
(This article belongs to the Special Issue Molecular Mechanisms of Plant Defense against Abiotic Stress)

Abstract

:
Growth Regulatory Factors (GRF) are plant-specific transcription factors that play critical roles in plant growth and development as well as plant tolerance against stress. In this study, a total of 16 GRF genes were identified from the genomes of Medicago truncatula and Medicago sativa. Multiple sequence alignment analysis showed that all these members contain conserved QLQ and WRC domains. Phylogenetic analysis suggested that these GRF proteins could be classified into five clusters. The GRF genes showed similar exon–intron organizations and similar architectures in their conserved motifs. Many stress-related cis-acting elements were found in their promoter region, and most of them were related to drought and defense response. In addition, analyses on microarray and transcriptome data indicated that these GRF genes exhibited distinct expression patterns in various tissues or in response to drought and salt treatments. In particular, qPCR results showed that the expression levels of gene pairs MtGRF2MsGRF2 and MtGRF6MsGRF6 were significantly increased under NaCl and mannitol treatments, indicating that they are most likely involved in salt and drought stress tolerance. Collectively, our study is valuable for further investigation on the function of GRF genes in Medicago and for the exploration of GRF genes in the molecular breeding of highly resistant M. sativa.

1. Introduction

Growth Regulatory Factors (GRFs) are plant-specific transcription factors that are widely distributed in the plant kingdom. Growth Regulatory Factor genes have been reported to play important roles in regulating plant growth and development as well as in plant responsiveness to abiotic stress [1]. Growth Regulatory Factors are a small family of transcription factors, and they contain two signature and conserved functional domains at N-terminal regions, namely the QLQ domain (Gln, Leu, Gln, IPR014978) and the WRC domain (Trp, Arg, Cys, IPR014977) [2,3]. The QLQ domain can interact with GRF Interaction Factor (GIF) to exert their functions [4]. The WRC domain functions in DNA binding and transcription factors targeting the nucleus, which consist of a C3H motif for DNA binding and a nuclear localization signal (NLS) [5]. The C-terminal region of GRF is variable when compared with the conservative amino acid residues in the N-terminal region, and this region has the transactivation activity [4,5,6,7]. In addition, several other motifs, such as TQL (Thr, Gln, Leu) and FFD (Phe, Phe, Asp), are usually present in the C-terminal region of GRFs, although they are not highly conservative [8].
GRF genes participate in the early growth and development of plants, and they play an important regulatory role in the formation of plant tissues or organs, such as leaf development, stem elongation and root growth [9,10]. These transcription factors directly affect the morphological establishment of the plant, which in turn affects plant yield. OsGRF1 from deepwater rice (Oryza sativa) was the first member identified in plants, which encodes a protein that could induce stem elongation by regulating gibberellins biosynthesis [2]. It was also reported that GRF could regulate the shape and size of leaves by regulating cell proliferation [11,12]. In the model plant Arabidopsis thaliana, the overexpression of AtGRF1, AtGRF2 and AtGRF5 resulted in larger leaves than the wild-type plant but much smaller leaves in the grf mutants than in the wide type, including mutants of grf3-1, grf5-1, grf1-1/grf2, grf2/grf3 and grf1/2/3 [3,11,12,13]. GRF genes may act by regulating cell proliferation through the suppression of KNOX gene expression [14], which inhibits GA biosynthesis in the S-adenosyl methionine (SAM) cycle by down-regulating the key biosynthetic gene GA20 oxidase [15] or by controlling the level of GA2 oxidase 1 that degrades GA [16]. Recently, many studies have reported the involvement of GRF genes in the regulation of flower development [17].
Most GRF genes are the target genes of microRNA396 (miR396). Evidence showed that miR396 can directly inhibit GRF expression through post-transcriptional regulation [17]. AtGRF1-4 and AtGRF7-9 are the target genes of miR396 in Arabidopsis [1]. The expression of miR396 is induced by various types of abiotic stresses such as high salinity, low temperature, drought stress, and UV-B as well as TCP transcription factors (TCP4) [18]. Interestingly, the overexpression of miR396 resulted in a decreased expression of AtGRF6, although it was not a target of miR396 [19]. Furthermore, GIF interacts with GRFs, floral identity factors [20], and chromatin remodeling complexes [21] to regulate reproductive competence and organogenesis [14]. Therefore, the transcript level of GRF is regulated by the miRNA–GRF–GIF cascade.
The expression of GRFs responds to certain abiotic stresses. In Arabidopsis, the expression level of AtGRF7 is inhibited under high salt and drought conditions to activate osmotic stress response genes [22]. The functional classification of downstream genes of AtGRF1 and AtGRF3 indicates that most of their target genes are involved in stress defense responses [4]. This study indicated that GRF is also involved in resistance to stress adversity. Plant morphogenesis is influenced by plant growth, development, regulatory capacity, and environment [23,24]; thus, the GRF gene family can regulate both the growth and development of the aboveground part to improve yield as well as the development of roots to increase stress resistance. With the release of plant reference genomes, members of the GRF gene family have been identified in several plant species, such as 9 members in Arabidopsis thaliana [3], 12 in rice (Oryza sativa) [5], 18 in soybean (Glycine max) [25], 14 in maize (Zea mays L.) and 12 in tomato (Lycopersicon esculentum) [26]. Although the functions of some GRF proteins in model plant species have been identified, the information on the members, characteristics, and functions of the GRF gene family in legume Medicago is still unknown.
Medicago sativa is a perennial legume that is widely used as an important forage crop with high yield and quality. M. sativa is rich in protein, minerals, vitamins and other nutrients, which is the optimal forage for improving the quality of livestock products [27,28]. However, due to the genetic complexity of tetraploid M. sativa and its intolerance to environmental stress, its yield and quality improvement have been restricted [28]. M. truncatula is a close relative of M. sativa that has been developed as a model legume species. These genetic advantages and genomic resources of M. truncatula make the research on M. sativa convenient. In this study, the GRF family genes were identified and analyzed in two Medicago species. Multiple sequence alignment, phylogenetic relationship, gene structure, protein motifs and cis-acting elements were systematically analyzed. In particular, the expression profiles of GRFs in response to salt and drought stress were analyzed in M. truncatula and M. sativa. Our results also identified potential new GRF genes for genetic modification in M. sativa.

2. Results

2.1. Identification of GRF Genes in the M. sativa and M. truncatula Genome

A total of eight candidate GRF genes were obtained from the M. truncatula genome and eight were obtained from M. sativa. Characteristics of GRF genes, including TIGR locus, chromosome location, homologous gene, isoelectric point (pI), molecular weight (MW), and putative subcellular localization, which are listed in Table 1. As a result, the corresponding predicted precursor proteins of MtGRF/MsGRF varied from 325 to 654 aa and 157 to 516 aa, respectively. We also found the pI value ranges of MtGRF and MsGRF were 7.07–9.03 and 6.28–10.15 kDa, respectively. In addition, the corresponding MW of MtGRF and MsGRF ranges were 36.40–70.74 and 17.55–56.20 kDa, respectively. Moreover, the corresponding homologous GRF genes of M. truncatula and M. sativa were identified based on sequence alignment. Subcellular location analysis showed that most of the predicted GRF proteins from M. truncatula and M. sativa were located in the nucleus or extracellularly (Table 1).

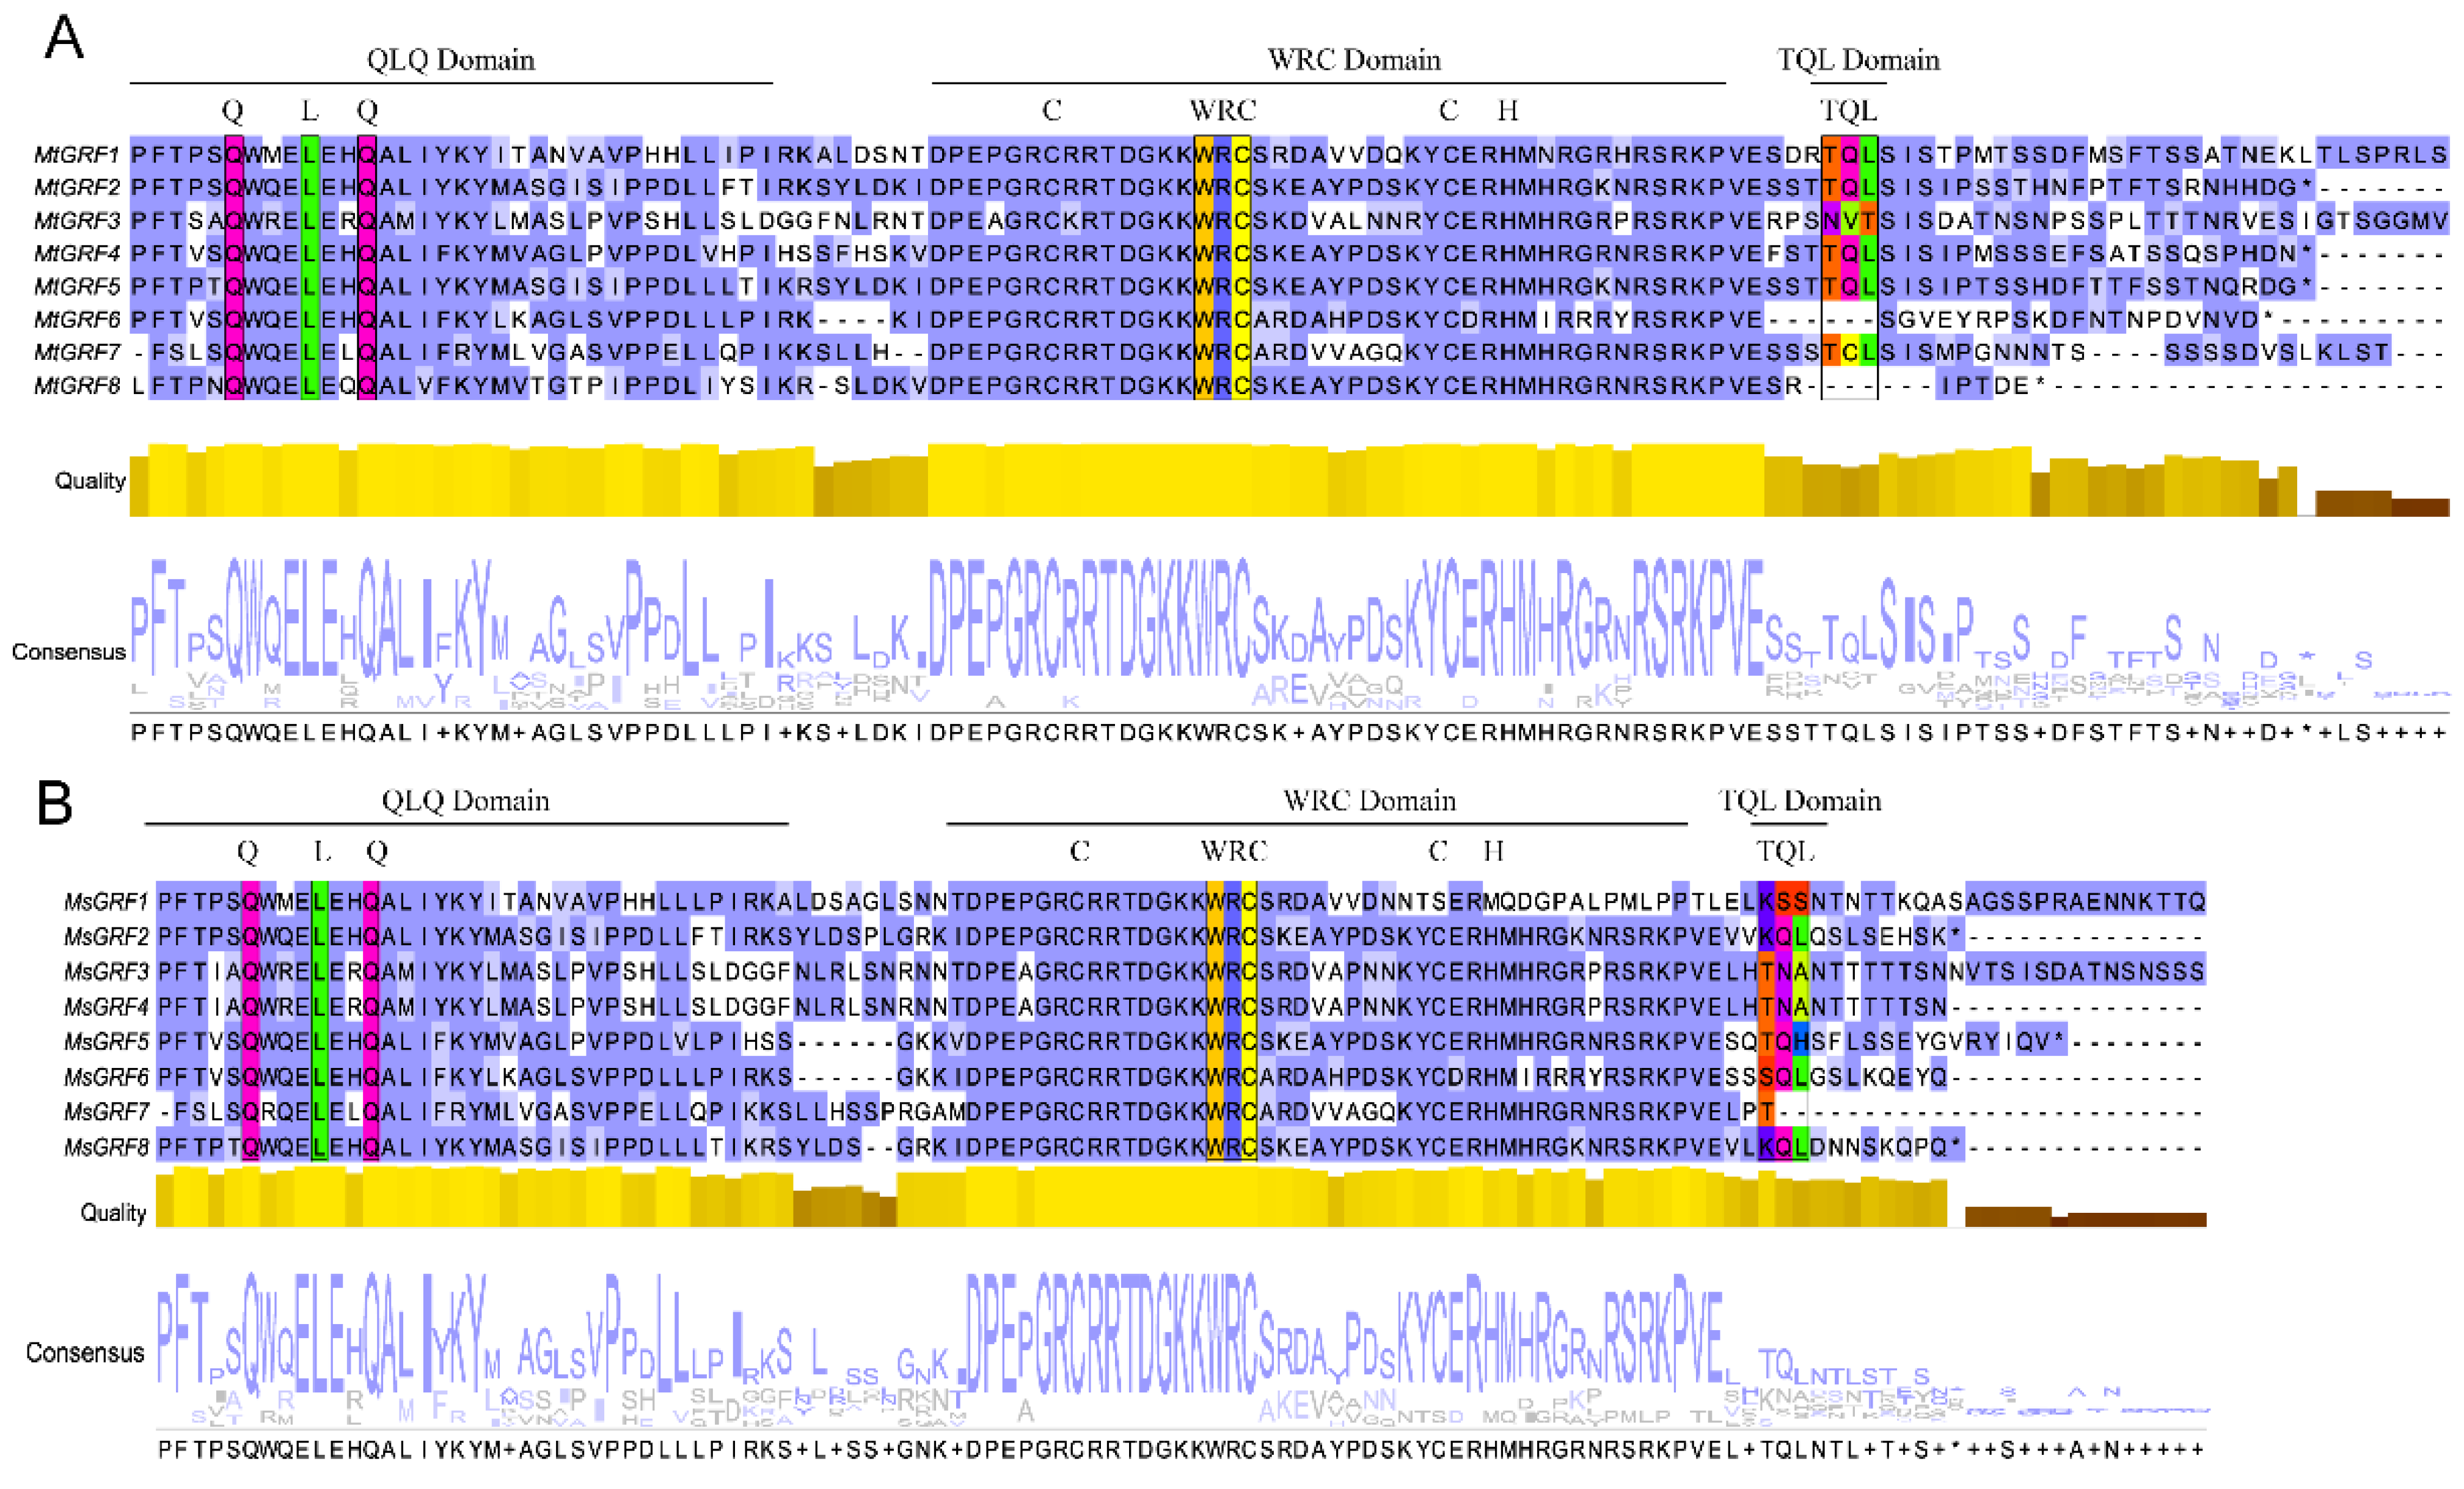
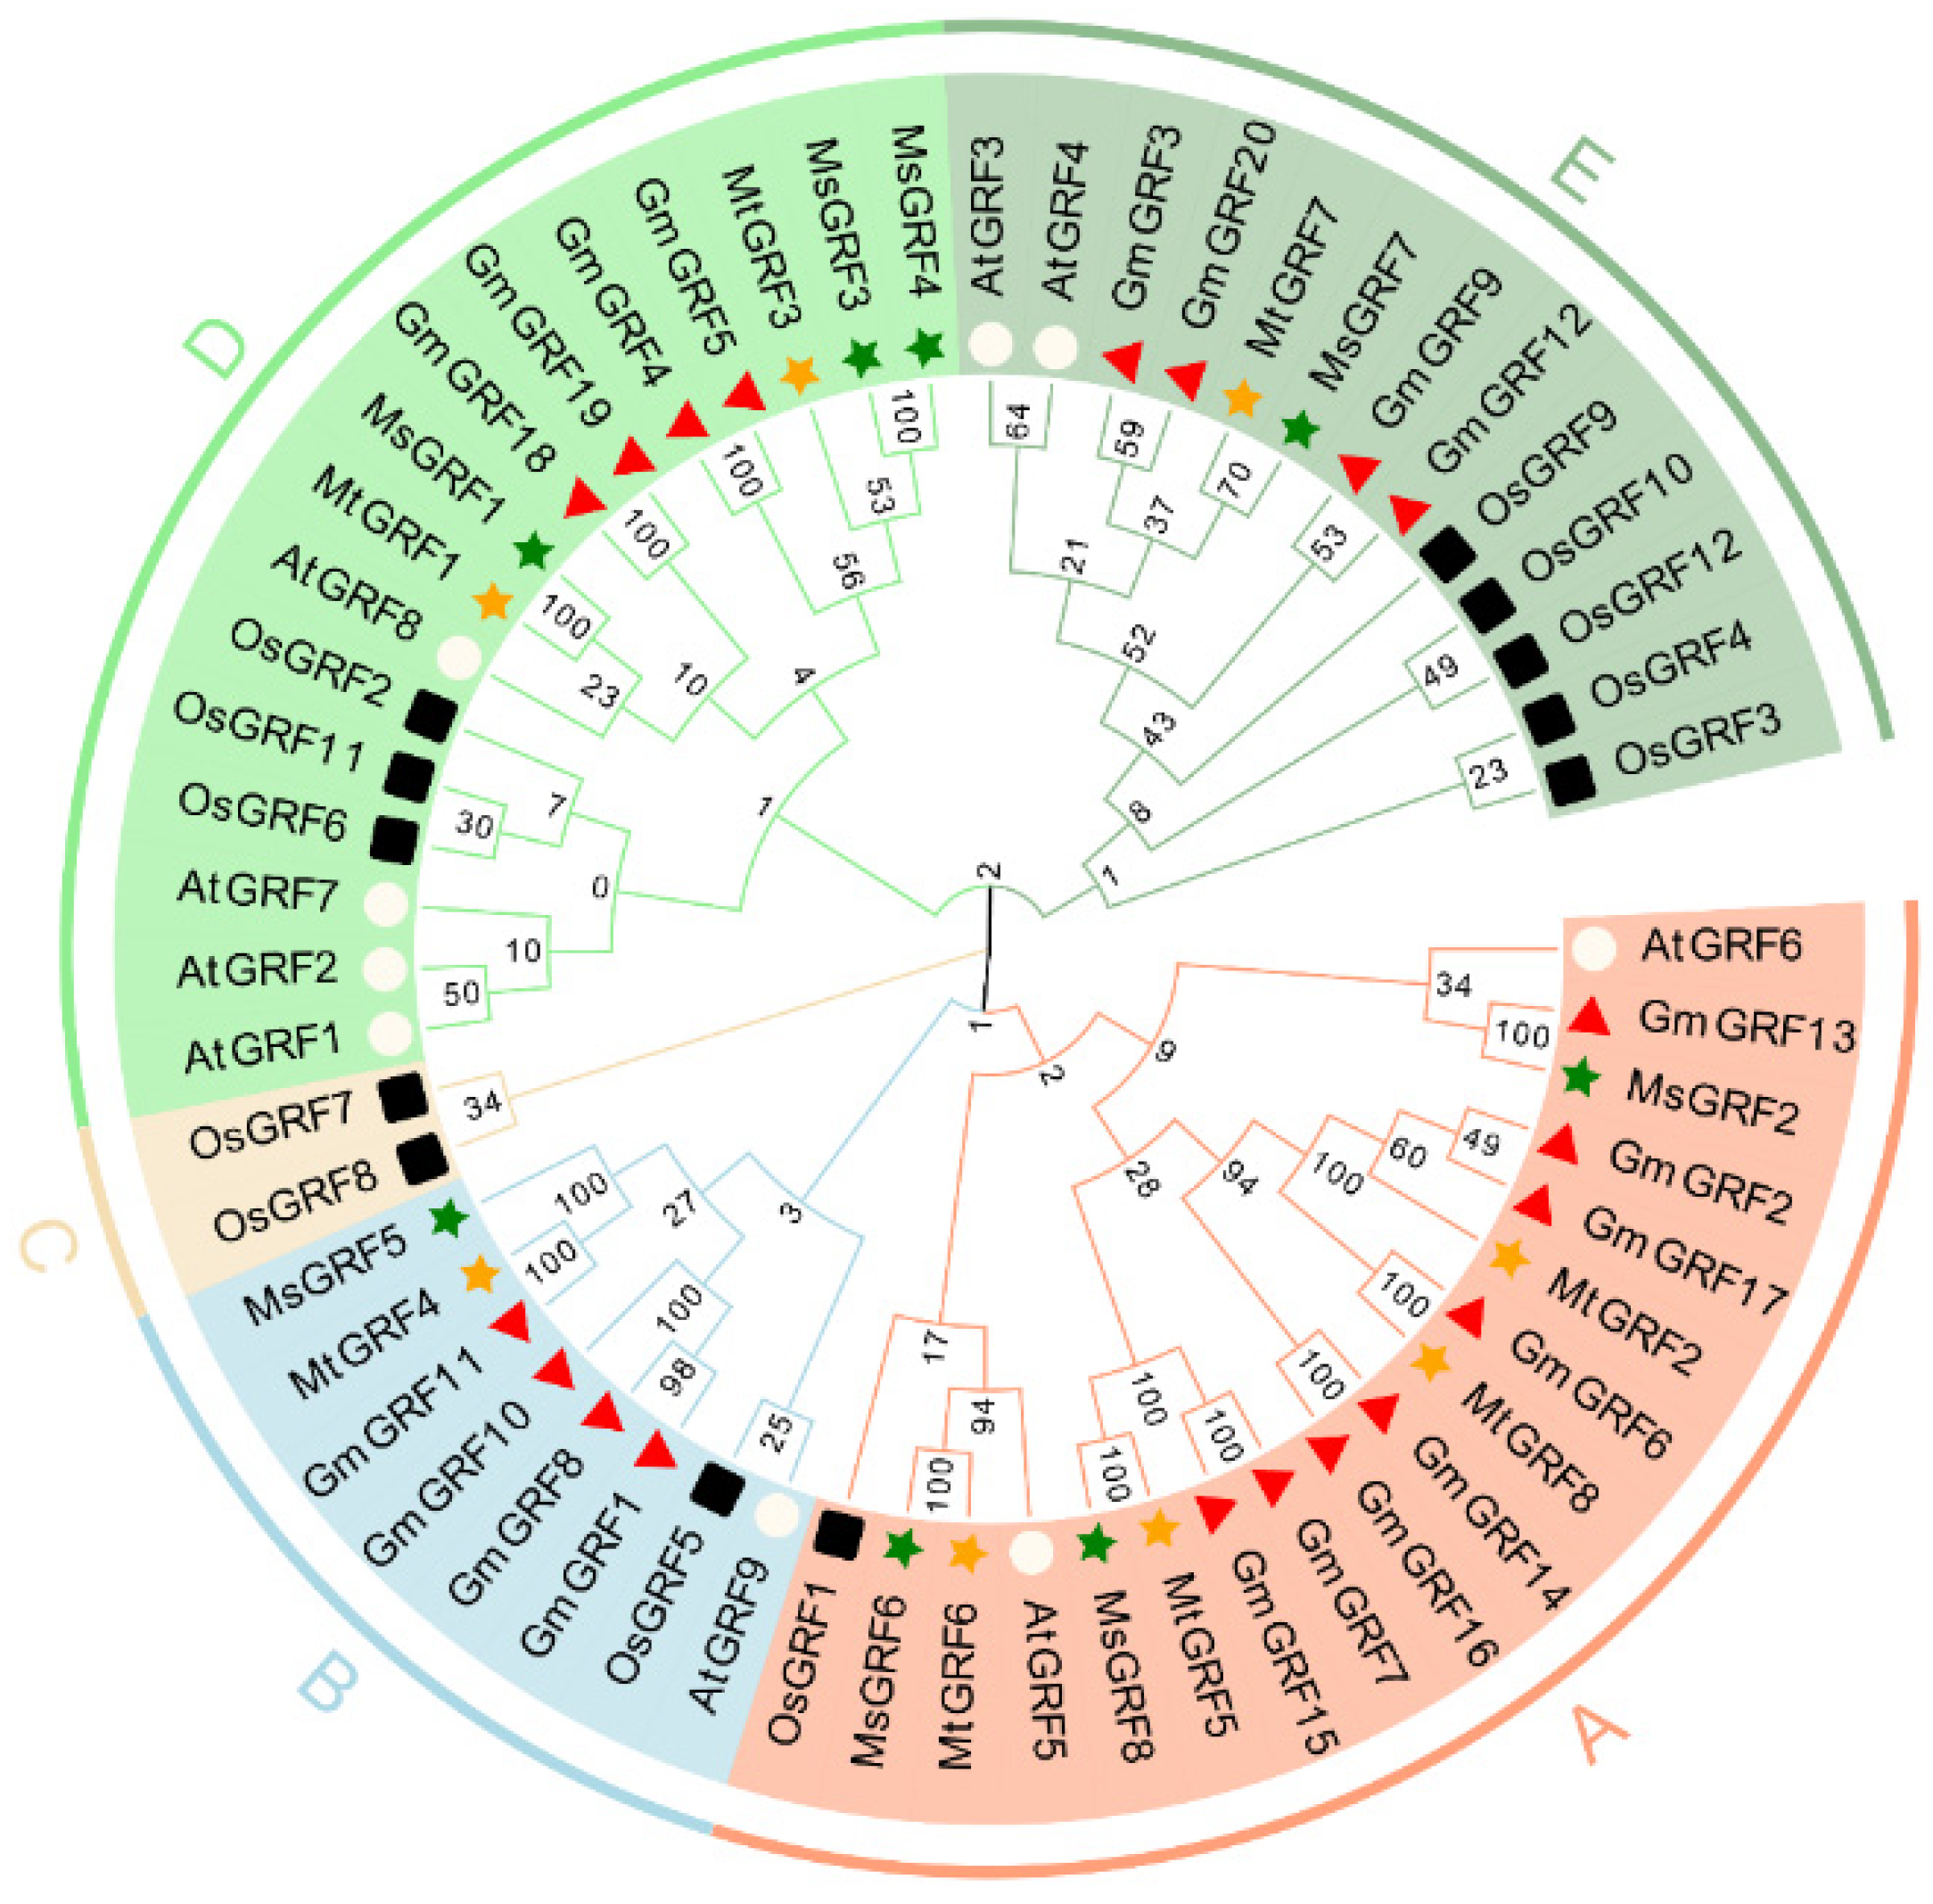
2.2. Multiple Sequence Alignment, Phylogenetic Analysis and Classification of GRF Genes in Medicago

In order to better understand the characteristics of the GRF protein sequence, the most conservative region covering QLQ and WRC domains was analyzed (Figure 1A,B). It was shown that all 16 GRF proteins shared the same QLQ and WRC amino acids, and the sequences were highly conserved among these two domains (Figure 1). In contrast, the TQL domain was only present in the C-terminal of some GRF members that were similar to those GRFs members from Arabidopsis [3].
Sequence-based phylogenetic analysis among M. truncatula, M. sativa, G. max, O. sativa and Arabidopsis showed that these proteins were grouped into five distinct clusters (A–E, Figure 2). The largest cluster was group A with 18 members from all five species, and the smallest cluster was group C with two members (OsGRF7 and OsGRF8 from rice) (Figure 2), and they may be unique for monocot plants such as rice. Cluster A and D contained the most GRF members from Medicago, with Cluster A containing three MsGRFs and two MtGRFs, and cluster D containing three MsGRFs and four MtGRFs. Cluster C and E contained one member from M. truncatula and M. sativa, respectively (Figure 2).

2.3. Analyses of Conserved Motif and Gene Structure

To identify the conservative structure of Ms/Mt GRF proteins, 20 motifs were analyzed through the MEME program (Supplementary Figure S1), and their positions were illustrated on each gene (Figure 3B). Most of them had similar motif positions and types. GRF members with fewer motif numbers and types were found for sub-clusters A, B and E, whereas sub-cluster D contained more numbers and types. All GRF members contain motifs 1 and 2, and the homologous gene pairs (MtGRF2/MsGRF2, MtGRF5/MsGRF8, and MtGRF6/MsGRF6) had identical motif structures; it is suggested that they may share the same roles in Medicago.
Analysis of the GRF genes structure showed that they had one to four introns and two to four exons. In particular, MsGRF7 had only one intron (Figure 3C). Nevertheless, some of the MsGRF genes lacked the 5′-UTR or 3′-UTR, indicating that their sequences are incomplete, which may be due to the genome assembly.

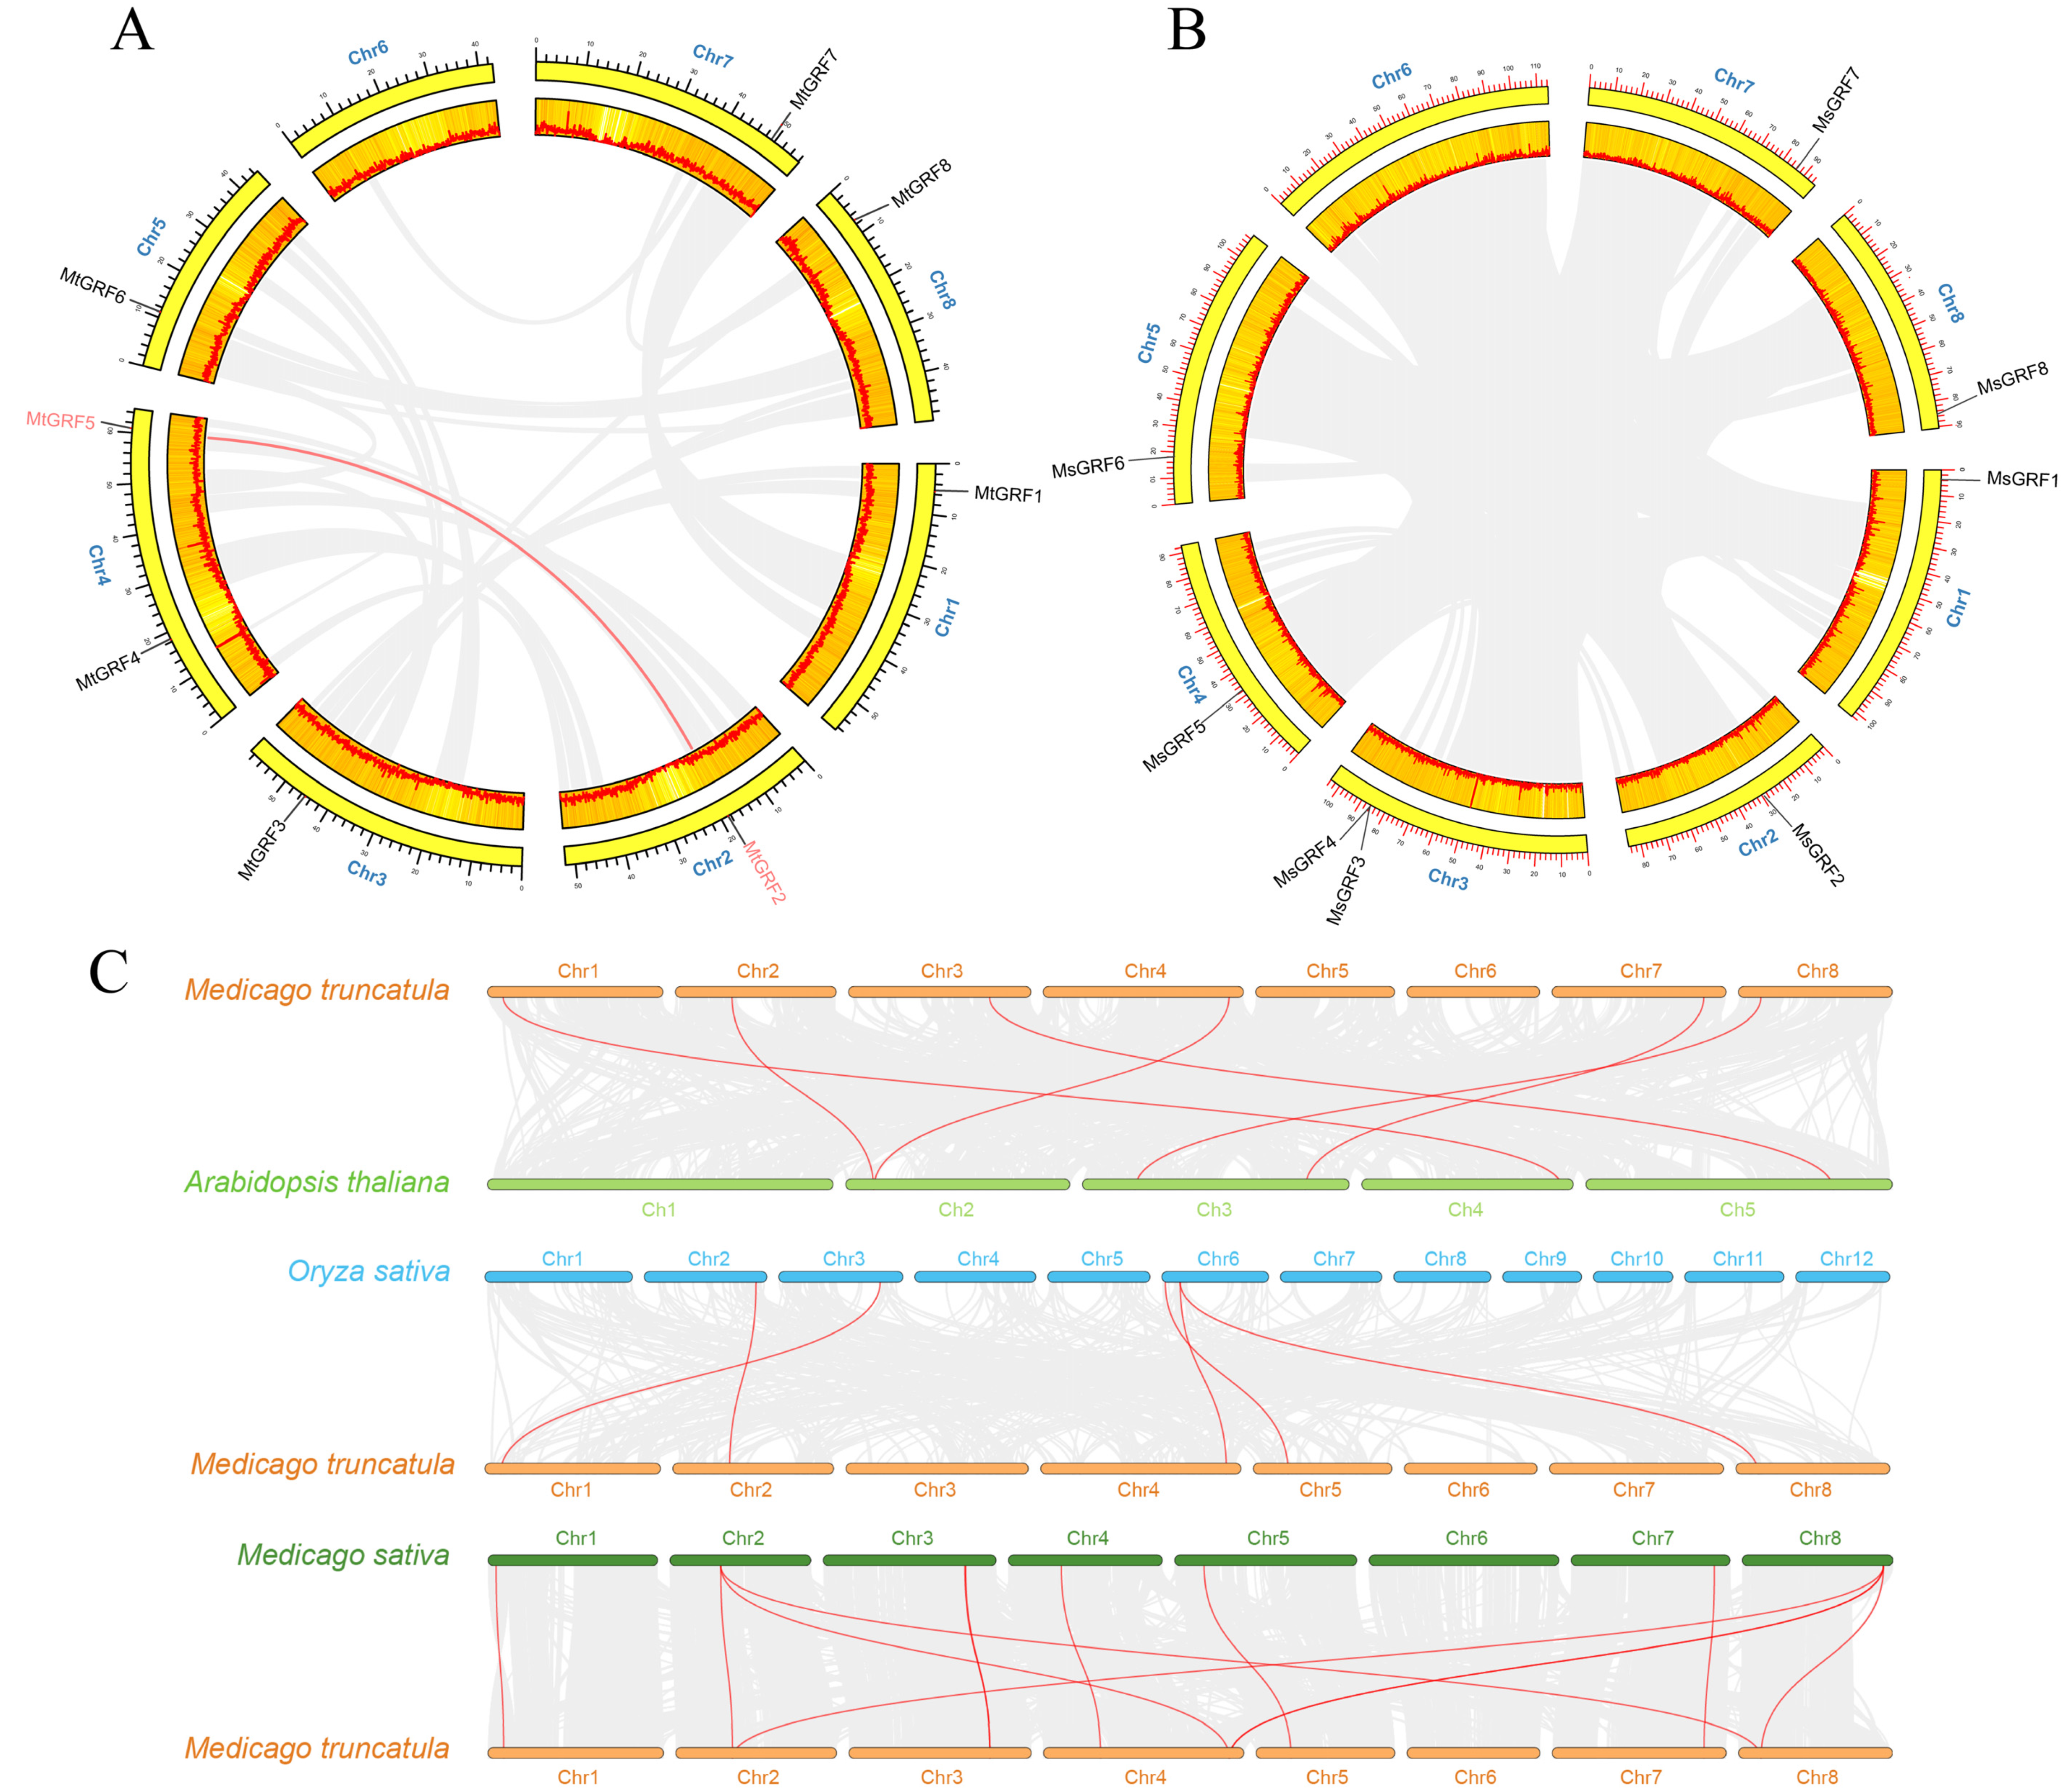
2.4. Analysis of Chromosome Location and Collinearity of GRF Genes

The distribution of GRF genes was not even in either M. truncatula or M. sativa, and they were distributed on seven chromosomes, except for chromosome 6. Four homologous gene pairs (Mt/MsGRF1, Mt/MsGRF2, Mt/MsGRF6, Mt/MsGRF7) were distributed in four chromosomes (Chr1, 2, 6, 7) of M. truncatula and M. sativa, respectively, and one GRF gene was distributed in each chromosome (Figure 4A,B). In M. truncatula, the remaining GRF members MtGRF3, 4, 5 and 8 are distributed in chromosomes 3, 4, 4, and 8, respectively. In M. sativa, the remaining GRF members MsGRF3, 4, 5 are distributed in chromosomes Chr3, 3, 4, and 8, respectively (Figure 4A,B).
To further investigate the evolutionary mechanism of the GRF gene family, both tandem and segmental duplication events were analyzed. Only one MtGRF gene pair (MtGRF2/MtGRF5) could be identified as segmental duplication events, but neither segmental duplication nor tandem duplication was identified in M. sativa (Figure 4A,B).
Comparative syntenic maps of A. thaliana, O. sativa and M. sativa associated with M. truncatula were constructed to illustrate the evolution relationship of the GRF gene family (Figure 4C). Notably, 6, 5 and 11 orthologous pairs were found between A. thaliana and O. sativa, M. sativa and M. truncatula, M. truncatula and M. sativa, respectively (Supplementary File S1). Four genes in M. truncatula (MtGRF1, 2, 5 and 8) showed a collinear relationship with those in A. thaliana, O. sativa and M. sativa, respectively (Figure 4C). These genes may play an irreplaceable role in the evolution of the GRF family.
To better understand the evolutionary selection pressure during the formation of the GRF gene family, the Ka/Ks values of GRF gene pairs were analyzed for both M. truncatula and M. sativa (Supplementary File S1). The Ka/Ks values of the M. truncatula and M. sativa orthologous gene pairs were all less than 1. Taken together, these results indicated that the GRF genes of M. truncatula and M. sativa may have undergone strong purification selection pressure during evolution.

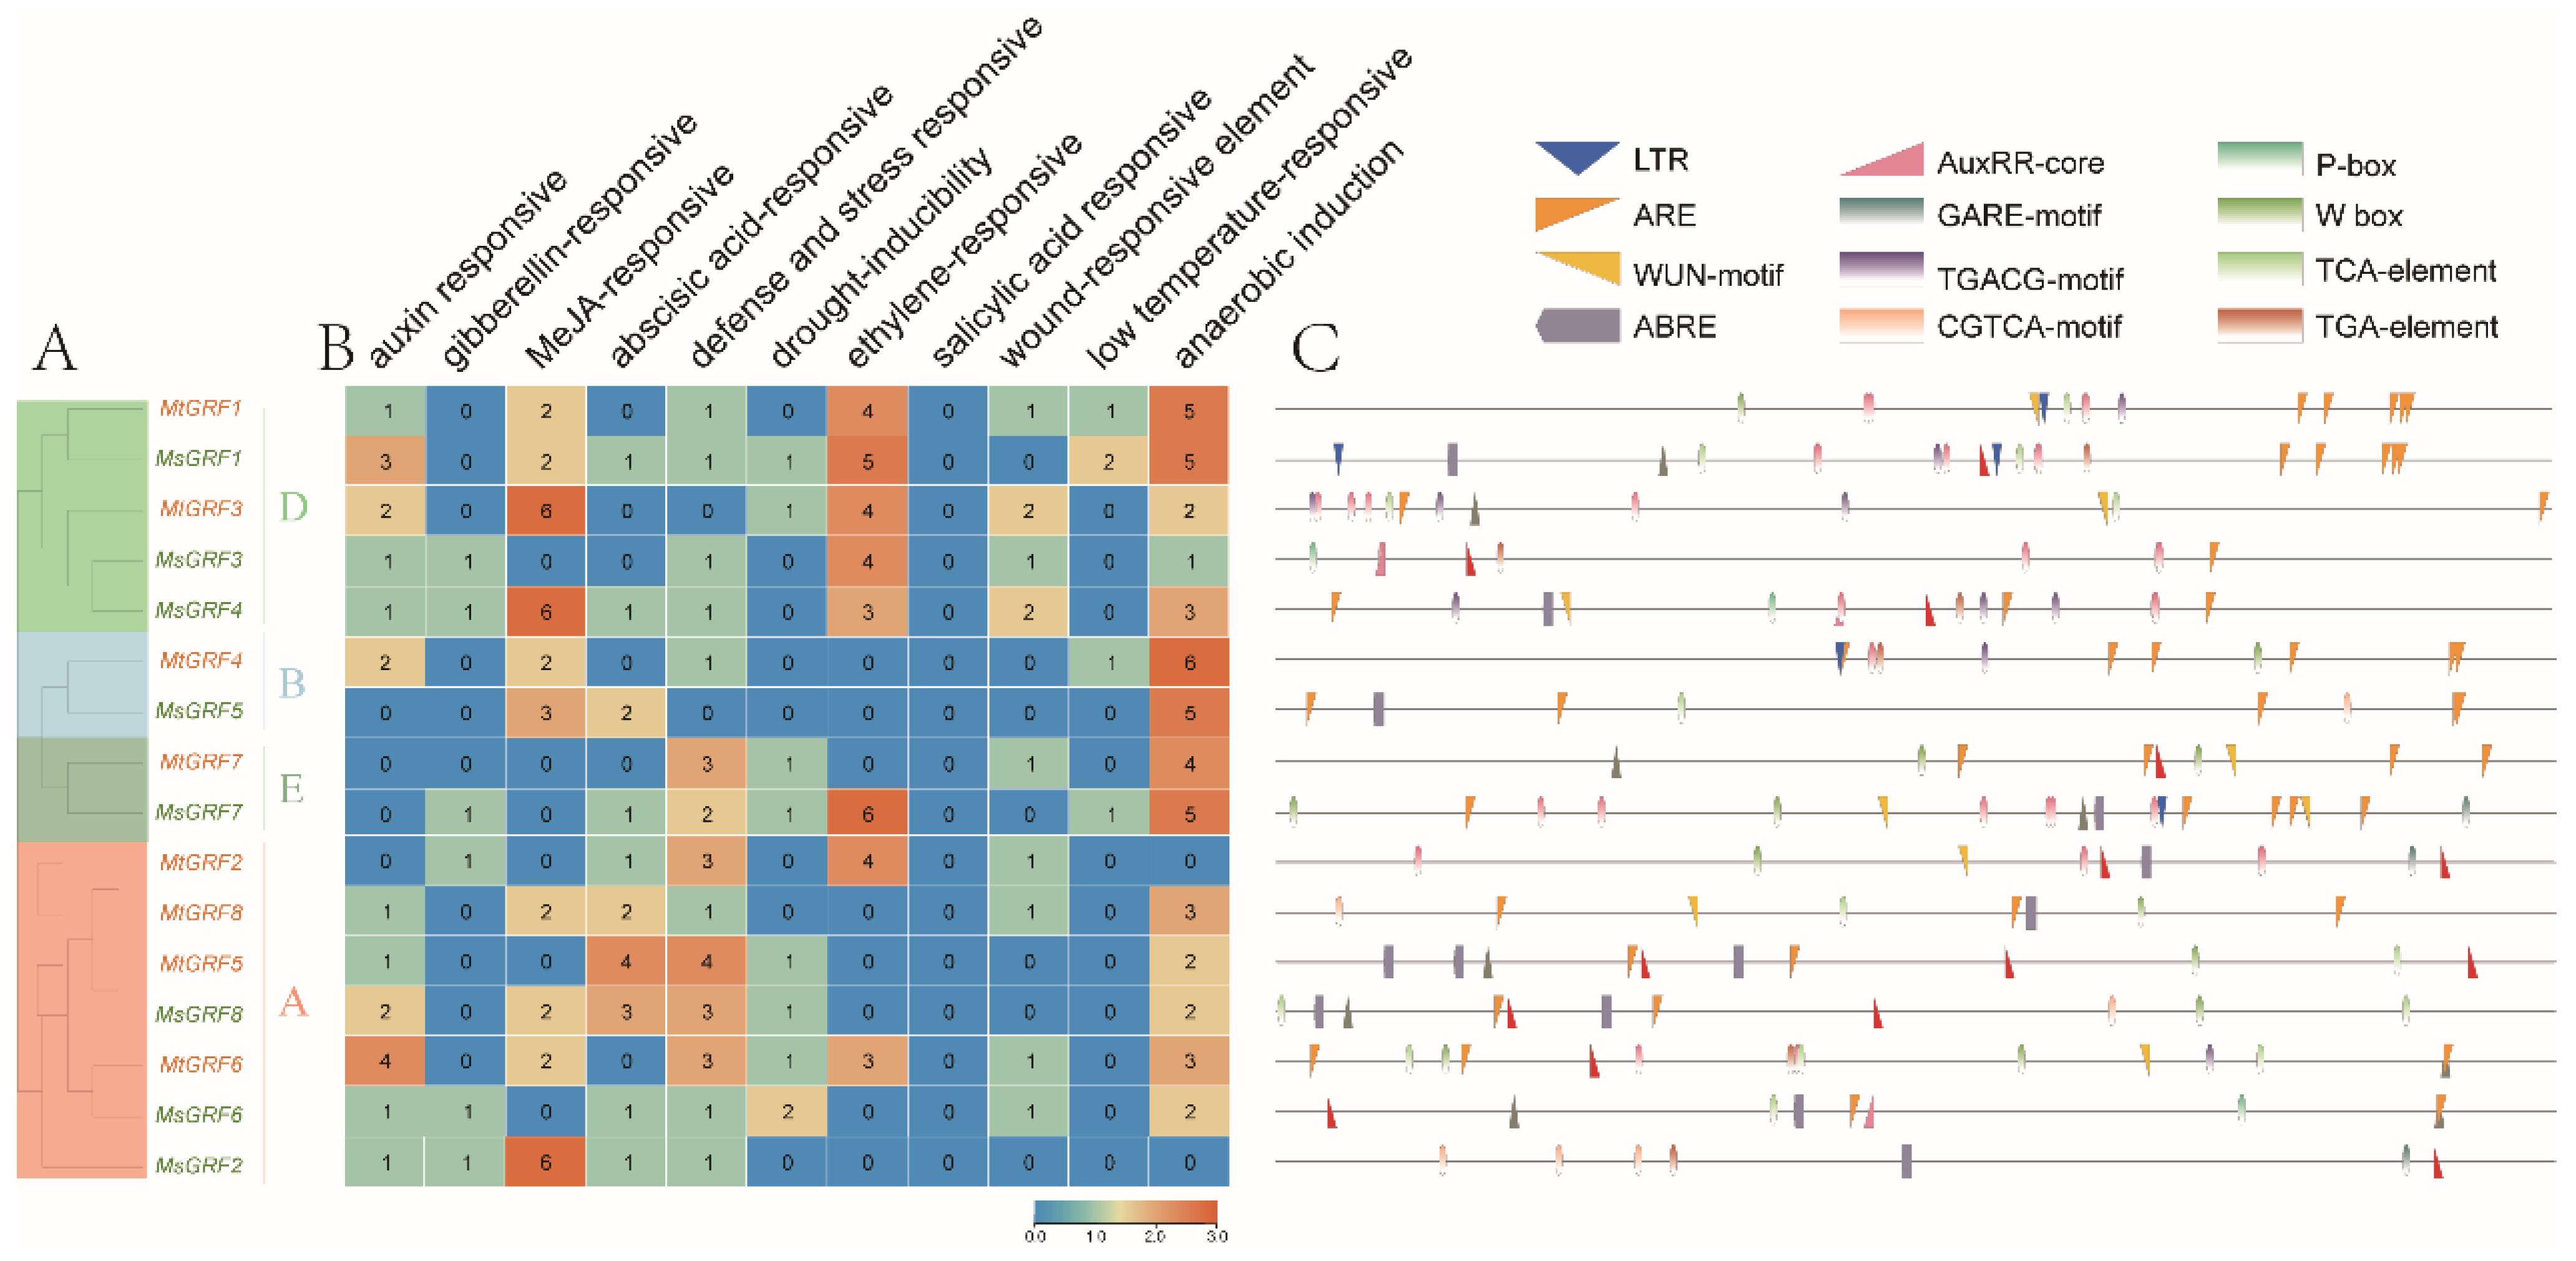
2.5. Analysis of cis-Acting Element of GRF Genes

The cis-acting elements are important for the binding of transcription factors, which control the expression of their downstream target genes. The promoter sequence of 2000 bp for the eight MtGRF and eight MsGRF genes were analyzed. Several different types of cis-acting elements were identified, including: auxin responsive (AuxRE-core), gibberellin-responsive (GARE-motif, P-box, TATC-box), MeJA-responsive (TGACG-motif, CGTCA-motif), abscisic acid-responsive (ABRE), defense and stress responsiveness (TC-rich repeats, W-box), MYB binding site involved in drought-inducibility (MBS), ethylene-responsive (ERE), salicylic acid responsiveness (TCA-element), wound responses (WUN motif), low-temperature responsive (LTR), and anaerobic induction (ARE) (Figure 5 and Supplementary File S2).
With an emphasis on defense and stress-related cis-acting elements, we found that the promoter of MtGRF6 and MsGRF7 had at least two W-box repeat elements, and MsGRF6 contained two MBS repeat elements (Figure 5B,C). Moreover, most Mt/MsGRFs contained many cis-elements related with anaerobic induction elements (Figure 5B,C), which may play a regulatory role under root hypoxic conditions. Notably, GRF genes with a high number of ethylene-responsive elements were clustered in the D group. These genes may play a key role in promoting plant development and maturation.

2.6. Expression Profiles of GRF Genes in Different Tissues

We investigated the expression profiles of GRFs in various tissues of M. truncatula with the genechip dataset, including roots, stems, leaves, flowers, pods, petioles, seeds and buds (Figure 6A). Remarkably, three genes (MtGRF4, 1, 2) showed a relatively high expression level in these tissues, whereas MtGRF5 and MtGRF6 were expressed at a relatively low level in different tissues (Figure 6A). Their expression levels in four tissues (roots, stems, leaves and flowers) were further verified by qPCR (Figure 6B, Supplementary File S5). Notably, the expression level of MtGRF2 was high than that of other genes, whereas that of MtGRF6 was relatively low in all four tissue. This was consistent with the results as shown in Figure 6A. In addition, MtGRF1, 3, 4, 5, and 7 were highly expressed in flowers, and MtGRF8 was more highly expressed in both stems and flowers than in other tissues (Figure 6B).
Six tissues from M. sativa were analyzed based on transcriptome data, including roots, elongated stems, pre-elongated-stems, leaves, flowers and nodules. Among them, MsGRF1 showed relatively high expression level in various tissues, especially in roots and elongated stems. Three genes (MsGRF2, 3, 4) were expressed at a relatively low level in all tissues. MsGRF7 gene was expressed at a higher level than in other tissues. MsGRF5, 6, and 8 were expressed at a relatively higher in elongated stems and flowers than in other tissues (Figure 6C). Using qPCR analysis, we found that MsGRF4 showed the highest expression level in flowers (Figure 6D), which was consistent with that in Figure 6C. Analysis revealed that the expression level of MsGRF8 gene was much higher in roots and flowers than in stems and leaves, which was even higher than those of all other MsGRF genes (Figure 6D).

2.7. Expression Profiles of MtGRF Genes under Stress Treatments

Expression profiles of GRF genes from M. truncatula were initially analyzed based on the data retrieved from the MtGEA web server, including samples from roots and shoots under drought treatment, and roots under vitro culture salinity and under hydroponic salinity (Supplementary Figure S1). One probe set was selected as representative for each MtGRF gene, and six out of eight MtGRF genes have their corresponding probe set: MtGRF1, 2, 4, 5, 6, 8 (Supplementary File S4).
Under drought conditions, the expression levels of MtGRF1, MtGRF2, MtGRF6 and MtGRF8 were highly induced in both roots and shoots (Figure 7A, left panel). Specifically, the expression level of several genes was significantly increased under drought, but it decreased after re-watering. These include MtGRF8 and MtGRF6 in roots and MtGRF5, MtGRF8, MtGRF1 and MtGRF6 in shoots. In contrast to drought treatment, the expression level of all six MtGRF genes decreased under NaCl treatment (Figure 7A, right panel).
To further understand the potential roles of MtGRF genes under abiotic stress, seedlings were treated with 300 mM NaCl and 15% mannitol, respectively. The expression levels of MtGRF genes were analyzed at 0 h, 1 h, 3 h, 6 h, 12 h, 24 h, and 48 h for two treatments by qPCR analysis (Figure 7B). It was shown that the expression level of almost all MtGRFs changed differently from the control in both treatments (Figure 7B). The detailed results were also displayed in Supplementary File S5. Notably, MtGRF2 was highly induced in response to both NaCl and mannitol treatment at 1 h and 3 h (Figure 7B). All genes except MtGRF7 were significantly up-regulated in response to at least one treatment at different time intervals. For example, MtGRF4 and MtGRF6 were up-regulated at 6 h for NaCl treatment, MtGRF3 at 3 h, 6 h, MtGRF5 at 12 h, 24 h, and MtGRF8 at 48 h, under mannitol treatment (Figure 7B).

2.8. Expression Profiles of MsGRF Genes under Stress Treatments

The expression levels of MsGRF genes were analyzed under NaCl and drought treatment with transcriptome data. It was found that most genes were induced at different levels (Figure 8A). Under both treatments, MsGRF1 maintained a relatively higher level than all the other genes (Figure 8A). The expression levels of MsGRF3, MsGRF7, and MsGRF6 were slightly increased at 1 h under NaCl treatment (Figure 8A, left), and those of MsGRF2, MsGRF8, MsGRF7, and MsGRF6 were slightly increased at 1 h under drought treatment (Figure 8A, right).
qPCRs were performed to verify the expression of all MsGRF genes at the same time intervals with both NaCl and mannitol (as drought) treatment (Figure 8B). Our results showed that all genes except MsGRF5 and MsGRF7 were up-regulated in response to at least one treatment. All MsGRF genes were significantly more sensitive to mannitol treatment than to NaCl treatment (Figure 8B). In particular, MsGRF1, MsGRF3, MsGRF4, and MsGRF8 responded remarkably at 12 h under mannitol treatment (Figure 8B). Correlation analysis between qPCR data and transcriptome data showed that they were positively correlated for six genes MsGRF2-7 (Figure 8B). In particular, the co-efficiency values were much higher for MsGRF2 and MsGRF6 than for the other four genes (MsGRF3, 4, 5, 7, Figure 8C).

3. Discussion

Growth Regulatory Factors are plant-specific transcription factors that regulate early plant morphogenesis and root development, and they play a critical role in the genetic improvement of crops on yield and resistance [29]. In general, the number of GRF members in plants ranged from 8 to 20 [30]. In the current study, eight MtGRF and eight MsGRF genes were identified in M. truncatula and M. sativa, respectively.
Multiple sequence alignment confirmed that all GRF members from M. truncatula and M. sativa contained the QLQ domains and WRC motifs. All of them were present at the N-terminus (Figure 1). This observation was consistent with those from model plants such as rice [2], Arabidopsis [3], and soybean [25]. We found that two structural domains at the N-terminus determine the basic architecture of the GRF family in Medicago. Moreover, we performed gene annotation based on the presence of these motifs. Motif1 was associated with WRC domains, whereas motif2 was annotated as an ATP-binding domain and associated with the QLQ domain. Notably, in M. truncatula, the TQL domain at the C-terminus was present only in MtGRF1, 2, 4, 5 and 7, whereas M. sativa did not contain a TQL domain. Thus, we speculated that the functional diversity of GRF proteins is based on the diversity of the C-terminal domain. Phylogenetic tree analysis revealed that the GRF members of Medicago clusters were identical to those of Arabidopsis [31].
Duplication and divergence play critical roles in the expansion and evolution of gene families [29,32]. We found only one segmental duplication among eight MtGRFs (Figure 4), while no duplication events were found in M. sativa. This indicates that GRF genes were conservative during the evolution of Medicago. The combination of phylogenetic and collinearity analyses based on gene expression is valuable for understanding the function of GRF genes in specific physiological processes. For example, by analyzing the genechip data (Figure 6), we found that the transcript levels of MtGRFs were higher in seeds and buds than in the other tissues examined, whereas previous studies have shown that in other plant species, the transcript levels of GRFs are higher in young leaves. These findings suggest that GRFs in Medicago may function primarily in regulating seeds and buds development. It was reported that AtGRF7, a gene homologous to MtGRF5, can bind the DREB2A promoter and repress its expression under non-stress conditions. It should be noted, however, that abiotic stress suppresses AtGRF7 expression, thereby activating osmotic stress-responsive genes [22]. In our study, MtGRF5 contains more ABRE elements (ABA responsive) and can possibly respond effectively to osmotic stress. It is possible therefore that MtGRF2 and MtGRF5 may share a similar function in the regulation of osmotic stress in Medicago as AtGRF7.
Since salinity and drought soils are the most prevalent and severe abiotic stresses affecting plant growth [33], it is extremely important to improve salt and drought tolerance in plants such as M. sativa. Analyses on the expressions level of several GRF genes were either highly induced or drastically changed under NaCl and mannitol treatments (Figure 7 and Figure 8). Meanwhile, the expression of several GRF genes were verified to be up-regulated under two treatments in M. truncatula and M. sativa (Figure 7 and Figure 8). MtGRF2 and MtGRF8 showed high expression levels under drought stress (Figure 6B), which was consistent with their expression level in roots as analyzed by microarray data. All these data indicates that they may play an important role in resistance against abiotic stress in roots. Correspondingly, two gene pairs (MtGRF2/MsGRF2 and MtGRF6/MsGRF6) were significantly up-regulated under both treatments, and their expression patterns were the same in M. truncatula and M. sativa. By identifying the cis-acting elements’ bound specific transcription factors, it is possible to reveal the transcriptional regulatory mechanism and gene expression patterns during plant environmental adaptation. Since MtGRF6 had at least two W-box repeat elements, and since MsGRF6 contained two MBS repeat elements (Figure 5C), they may play key roles in increasing the stress resistance of M. truncatula and M. sativa.
Previous studies have confirmed that GRF functions by regulating the complex process of plant growth and responses to environmental stress [22]. For example, OsGRF1 may regulate gibberellic acid (GA)-induced stem elongation and transcriptional activity [2]. Meanwhile, in plants overexpressing AtGRF5, the exit of the cell proliferation phase is delayed in early leaf development and chloroplasts divide extensively, while the onset of the cell expansion phase is delayed. Cytokinins are thought to increase the number of chloroplasts in the cell and act synergistically with AtGRF5 to increase photosynthesis rates, thereby increasing leaf size, plant productivity, and leaf longevity [34]. Notably, the homologous genes (MtGRF6/MsGRF6) are more closely related to AtGRF5 and OsGRF1, and this gene pair exhibited high expression under NaCl and mannitol stress, indicating that these two genes are possibly involved in early leaf development and transcriptional activity. OsGRF6 positively regulates auxin synthesis, promotes inflorescence development, and increases spike number [34]. The closely related genes in Medicago were MtGRF1 and MsGRF1, and they may also play a similar role in plant development. In A. thaliana, plants overexpressing AtGRF9 significantly inhibited the growth of leaves [35]. Its closely related gene was MsGRF5 in M. sativa, which was down-regulated under NaCl treatment, suggesting that this gene may be involved in stress response and the promotion of plant growth. These results suggested the potential roles of GRF genes in M. truncatula and M. sativa under abiotic stresses resistance. Not all these homologous genes in M. truncatula and M. sativa exhibit the same expression pattern under different stress treatments. It is possible that these genes have been subjected to varying degrees during species evolution.

4. Conclusions

This study analyzed the GRF genes on a genome-wide scale in M. sativa and M. truncatula. A total of eight MsGRFs and eight MtGRFs were identified, respectively, in M. sativa and M. truncatula. These genes show highly similarity in amino acid sequence, motif compositions and conservative gene structure. In addition, phylogenetic analysis and collinearity analysis on GRF in different species revealed their evolutionary patterns and predicted their functions in complex environments. Moreover, the expression profile of GRF genes in different tissues and two stress treatments were analyzed and further verified by qPCR. It was found that most genes were highly expressed, especially MtGRF2MsGRF2 and MtGRF6MsGRF6. These gene pairs showed the same expression pattern in M. truncatula and M. sativa, and they may play an important role in responses to stresses. This study compares the GRF family genes of M. truncatula and M. sativa, which provide new clues for understanding their evolutionary relationship and functions under abiotic stresses.

5. Materials and Methods

5.1. Identification of GRF Genes in the Medicago Genome

The genomic data of M. truncatula and M. sativa were downloaded from the websites https://figshare.com/articles/dataset/Medicago_sativa_genome_and_annotation_files/12623960 (accessed on 1 September 2021) and http://www.medicagogenome.org/ (accessed on 1 January 2020), respectively. To identify all putative GRF transcription factor proteins in each genome assembly, the conserved domains of the GRF protein (PF08879 for WRC domain and PF08880 for QLQ domain) [5] of Hidden Markov Model (HMM) profiles were downloaded from the Pfam protein family database (https://pfam.xfam.org/) (accessed on 11 September 2020). Subsequently, the GRF protein sequences from M. truncatula and M. sativa were deduced with HMM as a query (p < 1 × 10⁻⁵). Moreover, the GRF gene sequences of Arabidopsis were downloaded from the TAIR website (https://www.arabidopsis.org/) (accessed on 11 September 2020). In order to further screen the GRF genes, output putative GRF protein sequences were submitted to InterProScan (https://www.ebi.ac.uk/interpro/search/sequence-search) (accessed on 12 September 2020), CDD (https://www.ncbi.nlm.nih.gov/Structure/bwrpsb/bwrpsb.cgi) (accessed on 12 September 2020), Pfam (https://pfam.xfam.org/) (accessed on 12 September 2020), and SMART (http://smart.embl-heidelberg.de/) (accessed on 13 September 2020). Finally, 8 MsGRF and 8 MtGRF genes were identified and assigned based on their locations on chromosome. Correspondingly, ExPASy (https://web.expasy.org/compute_pi/) (accessed on 15 September 2020) was used to determine the isoelectric point (pI) and molecular weight (MW) of GRF proteins. Subcellular localization of GRF proteins were predicted by using the Softberry Home Page (http://linux1.softberry.com/berry.phtm) (accessed on 16 September 2020).

5.2. Analyses on Sequence and Structures of the Medicago GRF Genes

Conserved motifs were identified by selecting motifs from the MEME program (http://meme-suite.org/tools/meme) (accessed on 25 September 2020) with the motif number of GRF set as 20 and the width range of 10 to 200 amino acids (aa). Subsequently, sequence alignment was carried out by using jalview (http://www.jalview.org/Web_Installers/install.htm) (accessed on 25 September 2020). The visualization of exon–intron positions and conserved motifs were executed through the TBtools software [36].

5.3. Phylogenetic Analysis and Classification of GRF Genes

According to the amino acid sequences of GRF from M. truncatula, M. sativa, A. thaliana, O. sativa and G. max, the phylogenetic relationship of GRF proteins among these species was analyzed. We constructed a phylogenetic tree based on the complete GRF protein sequences using the Neighbor-Joining method as implemented in the MEGA-X software with a bootstrap value of 1000 replicates [37]. Meanwhile, clustering of the subfamily of GRFs in Medicago was based on that of Arabidopsis. The online software EvolView (https://evolgenius.info/evolview-v2/) (accessed on 29 September 2020) was used to modify the phylogenetic tree.

5.4. Analyses of Chromosome Location and Collinearity of GRF Genes

The chromosome locations of the GRF genes were determined using the NCBI website and mapped with the TBtools software. Multiple collinear Scan toolkit (Mcscanx) was used to analyze the gene duplication events with default parameters [38]. The intraspecific synteny relationship (M. truncatula and M. sativa) and interspecific synteny relationships (M. truncatula, M. sativa, Arabidopsis and O. sativa) were analyzed, and they were further mapped to the chromosomes of M. truncatula and M. sativa, respectively [39]. The simple Ka/Ks calculator software was used to calculate non-synchronous (Ka) and synchronous (Ks) values of GRF gene pairs [38].

5.5. Analyses of cis-Acting Elements and Location of GRF Genes in Medicago

The promoter sequences (2 kb upstream of the translation start site) of the GRF genes were identified by using the TBtools software, and the cis-elements in the promoters regions were predicted with the online program PlantCARE (http://bioinformatics.psb.ugent.be/webtools/plantcare/html/) (accessed on 2 October 2020) [40]. TBtools was used to visualize the cis-acting elements of all GRF genes of Medicago.

5.6. Analysis of Expression Level of GRF Genes

Genechip data from roots and shoots and those under drought and salt stress conditions for MtGRF genes were downloaded from the M. truncatula Gene Expression Atlas (https://Mtgea.noble.org/v3/) (accessed on 2 October 2020), and different tissues without stress were also covered. Amazing HeatMap software was used to generate the heatmap [36]. The original transcriptome data from M. sativa under NaCl and mannitol treatments at 0, 1, 3, 6, 12, 24 h (SRR7160314-15, 22–23, 25–49, 51–52, 56–57) were downloaded (https://www.ncbi.nlm.nih.gov/sra/) (accessed on 2 October 2020). The data were then converted into fastq files using an SRA-Toolkit v2.9 [40]. Raw reads were trimmed using the Trimmomatic-0.39 [41]. Gene expression level was determined by mapping cleaned reads to the corresponding M. sativa reference genomes using the StringTie v2.1.3 package [42].

5.7. Plant Materials and Treatments

The M. truncatula (cv. Jemalong A17) and M. sativa (cv. Zhongmu No. 1) plants used in this study were stored at the Institute of Animal Sciences of Chinese Academy of Agricultural Sciences. Stems, leaves, flowers, and roots (20-day old pods) of mature M. truncatula and M. sativa plants were collected separately for RNA extraction and qPCR analysis. To investigate the expression pattern of GRF genes in response to NaCl and mannitol stress, seeds were germinated and transferred into the MS liquid medium (MS basal salts supplemented with 30 g/L sucrose); then, they were kept in a growth chamber at 25 °C under a photoperiod of 16/8 light/dark regime (80 μmol photons m−2 s−1) and 80–90% humidity. When the third leaf was fully expanded, 300 mM NaCl and 15% mannitol [39,43] were, respectively, added into the MS liquid medium, and the whole plant was collected at 0 h, 1 h, 3 h, 6 h, 12 h, 24 h and 48 h for each treatment. The samples were frozen in liquid nitrogen and stored at −80 °C for subsequent analysis.

5.8. Analysis of Gene Expression by qPCR

Total RNAs were extracted by using an Eastep® Super total RNA Extraction kit (Promega, Shanghai, China) according to the manufacturer’s instructions. First-strand cDNA synthesis was performed using Trans® Script One-Step gDNA Removal and cDNA Synthesis SuperMix (TransGen Biotech, Beijing, China) per the manufacturer’s recommendations. qPCRs were carried out using a 2 × RealStar Green Fast Mixture (GeneStar, Shanghai, China) on an ABI 7500 real-time Detection System (Applied Biosystems, Foster City, CA, USA). The housekeeping gene actin-related protein 4A gene was used as an internal control. The reaction was carried out as follows: 94 °C for 30 s, followed by 40 cycles of 5 s at 94 °C and 34 s at 60 °C. The relative expression levels of the genes were determined with the comparative 2−ΔΔCt method. The primer sequences used in this study are shown in Table S1.

Supplementary Materials

The following supporting information can be downloaded at: https://www.mdpi.com/article/10.3390/ijms23136905/s1.

Author Contributions

Experiments were performed by W.D., J.Y., Q.L. and Q.S. W.D. and J.Y. analyzed the data. W.D. and D.Y. drafted the manuscript. Y.P. supervised the experiments and finalized the manuscript. All authors have read and agreed to the published version of the manuscript.

Funding

This project was supported by the National Nature Science Foundation of China (U1906201 and 31901386), the Key Projects in Science and Technology of Inner Mongolia (2021ZD0031), and Fundamental Research Funds for Central Non-Profit Scientific Institution (2021XC11). The funding body played no role in the design of the study, analysis and interpretation of data, and in writing the manuscript.

Data Availability Statement

All data in the present study are available in the public database as referred in the Material and Method part.

Conflicts of Interest

The authors declare no conflict of interest.

References

  1. Kim, J.H.; Tsukaya, H. Regulation of plant growth and development by the GROWTH-REGULATING FACTOR and GRF-INTERACTING FACTOR duo. J. Exp. Bot. 2015, 66, 6093–6107. [Google Scholar] [CrossRef] [PubMed] [Green Version]
  2. Knaap, E.; Kim, J.H.; Kend, H. A novel gibberellin-induced gene from rice and its potential regulatory role in stem growth. Plant Physiol. 2000, 122, 695–704. [Google Scholar] [CrossRef] [PubMed] [Green Version]
  3. Kim, J.H.; Choi, D.; Kende, H. The AtGRF family of putative transcription factors is involved in leaf and cotyledon growth in Arabidopsis. Plant J. 2003, 36, 94–104. [Google Scholar] [CrossRef] [PubMed]
  4. Kim, J.H.; Kende, H. A transcriptional coactivator, AtGIF1, is involved in regulating leaf growth and morphology in Arabidopsis. Proc. Natl. Acad. Sci. USA 2004, 101, 13374–13379. [Google Scholar] [CrossRef] [PubMed] [Green Version]
  5. Choi, D.S.; Kim, J.H.; Kende, H. Whole genome analysis of the OsGRF gene family encoding plantspecifc putative transcription activators in rice (Oryza sativa L.). Plant Cell Physiol. 2004, 45, 897–904. [Google Scholar] [CrossRef] [PubMed] [Green Version]
  6. Liu, H.; Guo, S.; Xu, Y.; Li, C.; Zhang, Z.; Zhang, D.; Xu, S.; Zhang, C.; Chong, K. OsmiR396d-regulated OsGRFs function in floral organogenesis in rice through binding to their targets OsJMJ706 and OsCR4. Plant Physiol. 2014, 165, 160–174. [Google Scholar] [CrossRef] [Green Version]
  7. Liu, J.; Rice, J.H.; Chen, N.; Baum, T.J.; Hewezi, T. Synchronization of developmental processes and defense signaling by growth regulating transcription factors. PLoS ONE 2014, 9, e98477. [Google Scholar] [CrossRef]
  8. Zhang, D.F.; Li, B.; Jia, G.Q.; Zhang, T.F.; Dai, J.R.; Li, J.S.; Wang, S.C. Isolation and characterization of genes encoding GRF transcription factors and GIF transcriptional coactivators in Maize (Zea mays L.). Plant Sci. 2008, 175, 809–817. [Google Scholar] [CrossRef]
  9. Bazin, J.; Khan, G.A.; Combier, J.P.; Bustos-Sanmamed, P.; Debernardi, J.M.; Rodriguez, R.; Sorin, C.; Palatnik, J.; Hartmann, C.; Crespi, M.; et al. miR396 affects mycorrhization and root meristem activity in the legume Medicago truncatula. Plant J. 2013, 74, 920–934. [Google Scholar] [CrossRef]
  10. Wu, L.; Zhang, D.; Xue, M.; Qian, J.; He, Y.; Wang, S. Overexpression of the maize GRF10, an endogenous truncated growth-regulating factor protein, leads to reduction in leaf size and plant height. J. Integr. Plant Biol. 2014, 56, 1053–1063. [Google Scholar] [CrossRef]
  11. Debernardi, J.M.; Mecchia, M.A.; Vercruyssen, L.; Smaczniak, C.; Kaufmann, K.; Inze, D.; Rodriguez, R.E.; Palatnik, J.F. Post-transcriptional control of GRF transcription factors by microRNA miR396 and GIF co-activator affects leaf size and longevity. Plant J. 2014, 79, 413–426. [Google Scholar] [CrossRef] [PubMed]
  12. Horiguchi, G.; Kim, G.T.; Tsukaya, H. The transcription factor AtGRF5 and the transcription coactivator AN3 regulate cell proliferation in leaf primordia of Arabidopsis thaliana. Plant J. 2005, 43, 68–78. [Google Scholar] [CrossRef] [PubMed]
  13. Kim, J.H.; Lee, B.H. GROWTH-REGULATING FACTOR4 of Arabidopsis thaliana is required for development of leaves, cotyledons, and shoot apical meristem. J. Plant Biol. 2006, 49, 463–468. [Google Scholar] [CrossRef]
  14. Kuijt, S.J.; Greco, R.; Agalou, A.; Shao, J.; Hoen, C.C.; Overnas, E.; Osnato, M.; Curiale, S.; Meynard, D.; van Gulik, R.; et al. Interaction between the GRF and KNOX families of transcription factors. Plant Physiol. 2014, 164, 1952–1966. [Google Scholar] [CrossRef] [PubMed] [Green Version]
  15. Kusaba, S.; Fukumoto, M.; Honda, C.; Yamaguchi, I.; Sakamoto, T.; Kano-Murakami, Y. Decreased GA1 content caused by the overexpression of OSH1 is accompanied by suppression of GA 20-oxidase gene expression. Plant Physiol. 1998, 117, 1179–1184. [Google Scholar] [CrossRef] [Green Version]
  16. Bolduc, N.; Hake, S. The maize transcription factor KNOTTED1 directly regulates the gibberellin catabolism gene ga2ox1. Plant Cell 2009, 21, 1647–1658. [Google Scholar] [CrossRef] [Green Version]
  17. Liang, G.; He, H.; Li, Y.; Wang, F.; Yu, D. Molecular mechanism of microRNA396 mediating pistil development in Arabidopsis. Plant Physiol. 2014, 164, 249–258. [Google Scholar] [CrossRef] [Green Version]
  18. Schommer, C.; Debernardi, J.M.; Bresso, E.G.; Rodriguez, R.E.; Palatnik, J.F. Repression of cell proliferation by miR319-regulated TCP4. Mol. Plant 2014, 7, 1533–1544. [Google Scholar] [CrossRef] [Green Version]
  19. Rodriguez, R.E.; Mecchia, M.A.; Debernardi, J.M.; Schommer, C.; Weigel, D.; Palatnik, J.F. Control of cell proliferation in Arabidopsis thaliana by microRNA miR396. Development 2010, 137, 103–112. [Google Scholar] [CrossRef] [PubMed] [Green Version]
  20. Pajoro, A.; Madrigal, P.; Muiño, J.M.; Matus, J.T.; Jin, J.; Mecchia, M.A.; Debernardi, J.M.; Palatnik, J.F.; Balazadeh, S.; Arif, M.; et al. Dynamics of chromatin accessibility and gene regulation by MADS domain transcription factors in flower development. Genome Biol. 2014, 15, R41. [Google Scholar] [CrossRef]
  21. Nelissen, H.; Eeckhout, D.; Demuynck, K.; Persiau, G.; Walton, A.; van Bel, M.; Vervoort, M.; Candaele, J.; De Block, J.; Aesaert, S.; et al. Dynamic Changes in ANGUSTIFOLIA3 Complex Composition Reveal a Growth Regulatory Mechanism in the Maize Leaf. Plant Cell 2015, 27, 1605–1619. [Google Scholar] [CrossRef] [PubMed] [Green Version]
  22. Kim, J.S.; Mizoi, J.; Kidokoro, S.; Maruyama, K.; Nakajima, J.; Nakashima, K.; Mitsuda, N.; Takiguchi, Y.; Ohme-Takagi, M.; Kondou, Y.; et al. Arabidopsis growth-regulating factor7 functions as a transcriptional repressor of abscisic acid- and osmotic stress-responsive genes, including DREB2A. Plant Cell 2012, 24, 3393–3405. [Google Scholar] [CrossRef] [PubMed] [Green Version]
  23. van Butselaar, T.; Van den Ackerveken, G. Salicylic Acid Steers the Growth-Immunity Tradeoff. Trends Plant Sci. 2020, 25, 566–576. [Google Scholar] [CrossRef] [PubMed]
  24. Jackson, R.B.; Caldwell, M.M. The scale of nutrient heterogeneity around individual plants and its quantification with geostatistics. Ecol. Soc. Am. 1993, 74, 612–614. [Google Scholar] [CrossRef]
  25. Li, X.; Dhaubhadel, S. Soybean 14-3-3 gene family: Identification and molecular characterization. Planta 2011, 233, 569–582. [Google Scholar] [CrossRef]
  26. Xu, W.F.; Shi, W.M. Expression profiling of the 14-3-3 gene family in response to salt stress and potassium and iron deficiencies in young tomato (Solanum lycopersicum) roots: Analysis by real-time RT-PCR. Ann. Bot. 2006, 98, 965–974. [Google Scholar] [CrossRef] [Green Version]
  27. Elliott, F.C.; Johnson, I.J.; Schonhorst, M.H. Breeding for forage yield and quality. In Alfalfa Science and Technology Agronomy Monographs; American Society of Agronomy: Madison, WI, USA, 1972. [Google Scholar]
  28. Li, X.H.; Brummer, E.C. Applied Genetics and Genomics in Alfalfa Breeding. Agronomy 2012, 2, 40–61. [Google Scholar] [CrossRef] [Green Version]
  29. Hughes, A.L. The evolution of functionally novel proteins after gene duplication. Proc. Biol. Sci. 1994, 256, 119–124. [Google Scholar]
  30. Vercruyssen, L.; Tognetti, V.B.; Gonzalez, N.; Van Dingenen, J.; De Milde, L.; Bielach, A.; De Rycke, R.; Van Breusegem, F.; Inze, D. GROWTH REGULATING FACTOR5 stimulates Arabidopsis chloroplast division, photosynthesis, and leaf longevity. Plant Physiol. 2015, 167, 817–832. [Google Scholar] [CrossRef] [Green Version]
  31. Ma, J.Q.; Jian, H.J.; Yang, B.; Lu, K.; Zhang, A.X.; Liu, P.; Li, J.N. Genome-wide analysis and expression profiling of the GRF gene family in oilseed rape (Brassica napus L.). Gene 2017, 620, 36–45. [Google Scholar] [CrossRef]
  32. Vision, T.J.; Brown, D.G.; Tanksley, S.D. The origins of genomic duplications in Arabidopsis. Science 2000, 290, 2114–2117. [Google Scholar] [CrossRef] [PubMed] [Green Version]
  33. Shannon, M.C.; Rhoades, J.D.; Draper, J.H.; Scardaci, S.C.; Spyres, M.D. Assessment of salt tolerance in rice cultivars in response to salinity problems in california. Crop Ecol. Prod. Manag. 1998, 38, 394–398. [Google Scholar] [CrossRef]
  34. Gao, F.; Wang, K.; Liu, Y.; Chen, Y.; Chen, P.; Shi, Z.; Luo, J.; Jiang, D.; Fan, F.; Zhu, Y.; et al. Blocking miR396 increases rice yield by shaping inflorescence architecture. Nat. Plants 2015, 2, 15196. [Google Scholar] [CrossRef] [PubMed]
  35. Omidbakhshfard, M.A.; Fujikura, U.; Olas, J.J.; Xue, G.P.; Balazadeh, S.; Mueller-Roeber, B. GROWTH-REGULATING FACTOR 9 negatively regulates arabidopsis leaf growth by controlling ORG3 and restricting cell proliferation in leaf primordia. PLoS Genet. 2018, 14, e1007484. [Google Scholar] [CrossRef] [PubMed]
  36. Chen, C.J.; Chen, H.; Zhang, Y.; Thomas, H.R.; Frank, M.H.; He, Y.H.; Xia, R. TBtools: An integrative toolkit developed for interactive analyses of big biological data. Mol. Plant 2020, 13, 1194–1202. [Google Scholar] [CrossRef]
  37. Tamura, K.; Stecher, G.; Peterson, D.; Filipski, A.; Kumar, S. MEGA6: Molecular Evolutionary Genetics Analysis version 6.0. Molelular Biol. Evol. 2013, 30, 2725–2729. [Google Scholar] [CrossRef] [Green Version]
  38. Wang, Y.P.; Tang, H.B.; Debarry, J.D.; Tan, X.; Li, J.P.; Wang, X.Y.; Lee, T.H.; Jin, H.Z.; Marler, B.; Guo, H.; et al. MCScanX: A toolkit for detection and evolutionary analysis of gene synteny and collinearity. Nucleic Acids Res. 2012, 40, e49. [Google Scholar] [CrossRef] [Green Version]
  39. Yang, J.F.; Ma, L.; Jiang, W.B.; Yao, Y.; Tang, Y.H.; Pang, Y.Z. Comprehensive identification and characterization of abiotic stress and hormone responsive glycosyl hydrolase family 1 genes in Medicago truncatula. Plant Physiol. Biochem. 2021, 158, 21–33. [Google Scholar] [CrossRef]
  40. Lescot, M.; Déhais, P.; Thijs, G.; Marchal, K.; Moreau, Y.; Van de Peer, Y.; Rouzé, P.; Rombauts, S. PlantCARE, a database of plant cis-acting regulatory elements and a portal to tools for in silico analysis of promoter sequences. Nucleic Acids Res. 2002, 30, 325–327. [Google Scholar] [CrossRef]
  41. Bolger, A.M.; Lohse, M.; Usadel, B. Trimmomatic: A flexible trimmer for Illumina sequence data. Bioinformatics 2014, 30, 2114–2120. [Google Scholar] [CrossRef] [Green Version]
  42. Pertea, M.; Pertea, G.M.; Antonescu, C.M.; Chang, T.C.; Mendell, J.T.; Salzberg, S.L. StringTie enables improved reconstruction of a transcriptome from RNA-seq reads. Nat. Biotechnol. 2015, 33, 290–295. [Google Scholar] [CrossRef] [PubMed] [Green Version]
  43. Li, W.X.; Oono, Y.; Zhu, J.; He, X.J.; Wu, J.M.; Iida, K.; Lu, X.Y.; Cui, X.; Jin, H.; Zhu, J.K. The Arabidopsis NFYA5 transcription factor is regulated transcriptionally and posttranscriptionally to promote drought resistance. Plant Cell 2008, 20, 2238–2251. [Google Scholar] [CrossRef] [PubMed] [Green Version]
Figure 1. Multiple sequence alignment of MtGRFs (A) and MsGRFs (B). The result only showed partial sequences containing the QLQ, WRC and TQL domains. The alignment was constructed by using MEGA-X and visualized by using Jalview. Residues with more than 50% similarity were shaded. Conserved regions (QLQ, WRC, and TQL) were indicated at the top.
Ijms 23 06905 g001
Figure 2. Phylogenetic analysis of GRF families across Medicago, Arabidopsis, G. max and O. sativa. Full-length protein sequences of GRFs were constructed using MEGA-X based on the Neighbor-Joining (NJ) method; bootstrap was 1000 replicates. Subfamilies were highlighted with different colors. The green solid pentagrams, orange solid pentagrams, hollow circles, red triangle and black square represent GRF proteins from M. truncatula (Mt), M. sativa (Ms), A. thaliana (At), G. max (Gm) and O. sativa (Os), respectively.
Ijms 23 06905 g002
Figure 3. Phylogenetic relationships, motifs and gene structure of GRF genes from M. truncatula and M. sativa (AC). The groups and its color in the phylogenetic tree were the same as in Figure 2. The motifs were indicated in different colored boxes with different numbers, and the sequence information for each motif was provided in Additional Figure 1. Green boxes indicate 5′- and 3′-untranslated regions; orange boxes indicate exons; black lines indicate introns.
Ijms 23 06905 g003
Figure 4. Chromosome distributions of GRFs in M. truncatula and M. sativa. The chromosomal location and interchromosomal relationship of M. truncatula (A) and M. sativa (B). The segmentally duplicated genes are connected by red curves. (C) Synteny analysis of GRF genes between A. thaliana and M. truncatula, O. sativa and M. truncatula, M. sativa and M. truncatula. Gray lines in the background indicate the collinear blocks between M. truncatula, and A. thaliana/O. sativa/M. sativa, and the red lines highlight the syntenic GRF gene pairs.
Ijms 23 06905 g004
Figure 5. Putative cis-elements and transcription factor binding sites in the promoter regions of the GRF genes from M. truncatula and M. sativa. (A) The groups and color are indicated as in Figure 2. (B) The color and number of the grid indicated numbers of different cis-acting elements in these GRF genes. (C) The colored block represented different types of cis-acting elements and their locations in each GRF gene.
Ijms 23 06905 g005
Figure 6. Expression profiles of GRF genes in various tissues. (A,C): Expression profiles of MtGRF and MsGRF genes in different tissues retrieved from genechip dataset and transcriptome, respectively. (B,D): Expression level of MtGRF and MsGRF genes in various tissues verified by qPCR. The relative expression levels are log2-transformed and visualized for heatmap. Red represents relatively high expression and blue (A,C) or green (B,D) represents relatively low expression.
Ijms 23 06905 g006
Figure 7. Expression profiles of MtGRF genes under NaCl and mannitol treatment. (A) Left, MtGRF genes expression level under drought treatment in roots and in shoots at different treatment times. Right, MtGRF genes expression level under vitro culture and hydroponics culture at different treatment times. (B) qPCR analysis on the expression of MtGRF genes treated with 300 mM NaCl and 15% mannitol at 0 h, 1 h, 3 h, 6 h, 12 h, 24 h, and 48 h. Data are the average of three independent biological samples ± SE, and vertical bars indicate standard deviation. ** indicates p < 0.01, and * for p < 0.05.
Ijms 23 06905 g007
Figure 8. Expression profiles of MsGRF genes under NaCl and mannitol stress. (A) MsGRF genes expression in roots under NaCl treatment at different time points; in root under drought treatment at different time points. (B) qPCR analysis on the expression level of MsGRF genes treated with 300 mM NaCl and 15% mannitol at 0 h, 1 h, 3 h, 6 h, 12 h, 24 h, and 48 h. Data are the average of three independent biological samples ± SE, and vertical bars indicate standard deviation. ** indicates p < 0.01, and * for p < 0.05. (C) Correlation analysis of qPCR and transcriptome data for MsGRF genes. Pearson’s r indicates the Pearson correlation coefficient.
Ijms 23 06905 g008
Table 1. Properties of the predicted GRF proteins in M. truncatula and M. sativa.
Gene NameTIGR LocusStart SiteEnd SiteHomologous GenePIMW (kDa)Protein LengthSubcellular Localization
MtGRF1MtrunA17Chr1g015219149652224969855MsG0180000350.01.T017.0770.74654Nuclear
MtGRF2MtrunA17Chr2g03005111829897518301839MsG0280008385.01.T018.7540.80357Nuclear
MtGRF3MtrunA17Chr3g01276414564349045646030MsG0380016593.01.T017.858.33540Extracellular
MtGRF4MtrunA17Chr4g00212611840885318413110MsG0480020006.01.T017.7237.22338Nuclear
MtGRF5MtrunA17Chr4g00705916017732060179812MsG0880047345.01.T017.2942.01369Nuclear
MtGRF6MtrunA17Chr5g04094711122905411232562MsG0580025368.01.T019.0336.40325Extracellular
MtGRF7MtrunA17Chr7g02659314911273549115556MsG0780041090.01.T018.842.42385Nuclear
MtGRF8MtrunA17Chr8g034388171942507196469MsG0880047345.01.T018.3939.89349Nuclear
MsGRF1MsG0180000350.01.T0147535034757720MtrunA17Chr1g01521916.2856.20516Nuclear
MsGRF2MsG0280008385.01.T013048902830491429MtrunA17Chr2g03005118.4341.97369Nuclear
MsGRF3MsG0380016593.01.T018548806285491005MtrunA17Chr3g01276417.3255.45513Extracellular
MsGRF4MsG0380016639.01.T018597754885980455MtrunA17Chr3g01276417.8150.86463Extracellular
MsGRF5MsG0480020006.01.T013181479531818355MtrunA17Chr4g00212619.5834.29305Nuclear
MsGRF6MsG0580025368.01.T011754859017551843MtrunA17Chr5g04094718.9737.23332Extracellular
MsGRF7MsG0780041090.01.T018643680986436865MtrunA17Chr7g026593110.2525.36224Nuclear
MsGRF8MsG0880047345.01.T018502901485030631MtrunA17Chr4g00705917.2942.14370Nuclear
Publisher’s Note: MDPI stays neutral with regard to jurisdictional claims in published maps and institutional affiliations.

