Article

Neurosecretory Protein GL Promotes Normotopic Fat Accumulation in Male ICR Mice

Laboratory of Neurometabolism, Graduate School of Integrated Sciences for Life, Hiroshima University, Higashi-Hiroshima, Hiroshima 739-8521, Japan
*
Author to whom correspondence should be addressed.
These authors contributed equally to this work.
Int. J. Mol. Sci. 2022, 23(12), 6488; https://doi.org/10.3390/ijms23126488
Submission received: 6 May 2022 / Revised: 8 June 2022 / Accepted: 8 June 2022 / Published: 10 June 2022
(This article belongs to the Special Issue Hypothalamic Regulation of Obesity and Diabetes)

Abstract

:
Neurosecretory protein GL (NPGL) is a small secretory protein identified in the hypothalamus of birds and mammals. We recently reported that NPGL exerts obesogenic effects in obesity-prone C57BL6/J mice. However, whether NPGL elicits adiposity in different mouse strains is poorly understood. In this study, we generated transgenic mice overexpressing Npgl using the ICR strain (Npgl Tg mice) to elucidate the obesogenic effects of NPGL in different strains. Npgl Tg mice showed increased white adipose tissue (WAT) mass. Although the mass of brown adipose tissue (BAT) was slightly altered in Npgl Tg mice, hypertrophy of lipid droplets was also observed in BAT. In contrast, fat accumulation was not induced in the liver, with the upregulation of mRNAs related to hepatic lipolysis. These results support the hypothesis that NPGL causes obesity in several strains and species. This report highlights the pivotal role of NPGL in fat accumulation in adipose tissues and contributes to the elucidation of the biological mechanisms underlying obesity and metabolic diseases in heterogeneous populations.

1. Introduction

In the 21st century, called the “Age of Plenty” in developed countries, obesity has become a major health concern. Obesity increases the risk of severe coronavirus disease 2019 (COVID-19) and metabolic syndromes such as hyperglycemia, hyperlipidemia, and hypertension [1,2,3,4]. The hypothalamus, a key regulator of whole-body homeostasis, is well known for its involvement in feeding behavior [5]. Excessive energy intake over expenditure readily causes fat accumulation and eventually obesity. Hence, many researchers have investigated the regulation between the hypothalamus and feeding behavior in rodents. For instance, neuropeptide Y (NPY), agouti-related protein (AgRP), orexin, galanin, and melanin-concentrating hormone (MCH) potently stimulate feeding behavior [6,7,8,9]. In contrast, α-melanocyte-stimulating hormone (α-MSH), derived from proopiomelanocortin (POMC), corticotropin-releasing hormone (CRH), and cocaine- and amphetamine-regulated transcript (CART), exert anorexigenic effects in rodents [10,11,12]. In addition, peripheral hormones regulate energy homeostasis, especially in the control of fat depots. Leptin secreted from adipose tissue not only inhibits food intake but also reduces fat mass due to accelerated catabolism [13]. Conversely, insulin derived from the pancreas is one of the most well-known anabolic hormones that promotes glucose uptake and suppresses lipolysis [14]. Therefore, the central and/or peripheral endocrine system intricately controls feeding behavior and lipid metabolism, ultimately leading to obesity.
The metabolic states of experimental model mice depend on their genetic background. Although MCH-deficient mice backcrossed with C57BL/6 mice were susceptible to diet-induced obesity (DIO), those backcrossed with 129 SvJ showed a slight gain in body mass [15]. A recent study has shown that hepatic inflammation and fibrosis are influenced by the genetic background of the mice [16]. Furthermore, the trends between the change in fat mass and degree of exercise were dependent on the genotype of the mice [17]. Given that the genetic polymorphisms of mice, as well as humans [18], greatly contribute to metabolic status, further studies using various strains of mice will help to elucidate the molecular mechanisms of obesity in heterogeneous populations. However, studies focusing on the association of the endocrine system with the strain of experimental mice are limited.
We recently reported the identification of a novel cDNA encoding a small secretory protein, neurosecretory protein GL (NPGL), in the hypothalamus of birds and mammals [19,20,21]. As Npgl is evolutionarily conserved in vertebrates, including humans, rats, mice, and chicks, it is possible that NPGL plays important physiological roles in some species [22]. Chronic intracerebroventricular (i.c.v.) infusion of NPGL induces a significant increase in body mass gain and food intake in chicks [23]. In C57BL/6J mice, Npgl mRNA levels were elevated by fasting and reduced by short-term high-fat diet (HFD) feeding [20]. Furthermore, central injection of NPGL increases food intake [20]. Taken together, these results suggest that NPGL participates in energy homeostasis in chicks and mice. Moreover, our latest study using C57BL/6J mice showed that NPGL leads to lipid accumulation in white adipose tissue (WAT) in the short term and eventually obesity [24]. These results indicate that NPGL is a novel neuronal regulator of lipid metabolism in mice. However, most previous reports on NPGL have employed strain C57BL/6J, and there are few studies regarding NPGL in other mouse strains.
In this study, we generated a transgenic mouse line with ubiquitous overexpression of Npgl backcrossed onto the ICR outbred strain (Npgl Tg mouse) and analyzed its phenotype to assess whether NPGL elicits fat accumulation in a mouse strain other than C57BL/6J. Here, we show that NPGL stimulates lipid accumulation in the ICR strain and supports potent lipogenic effects in rodents.

2. Results

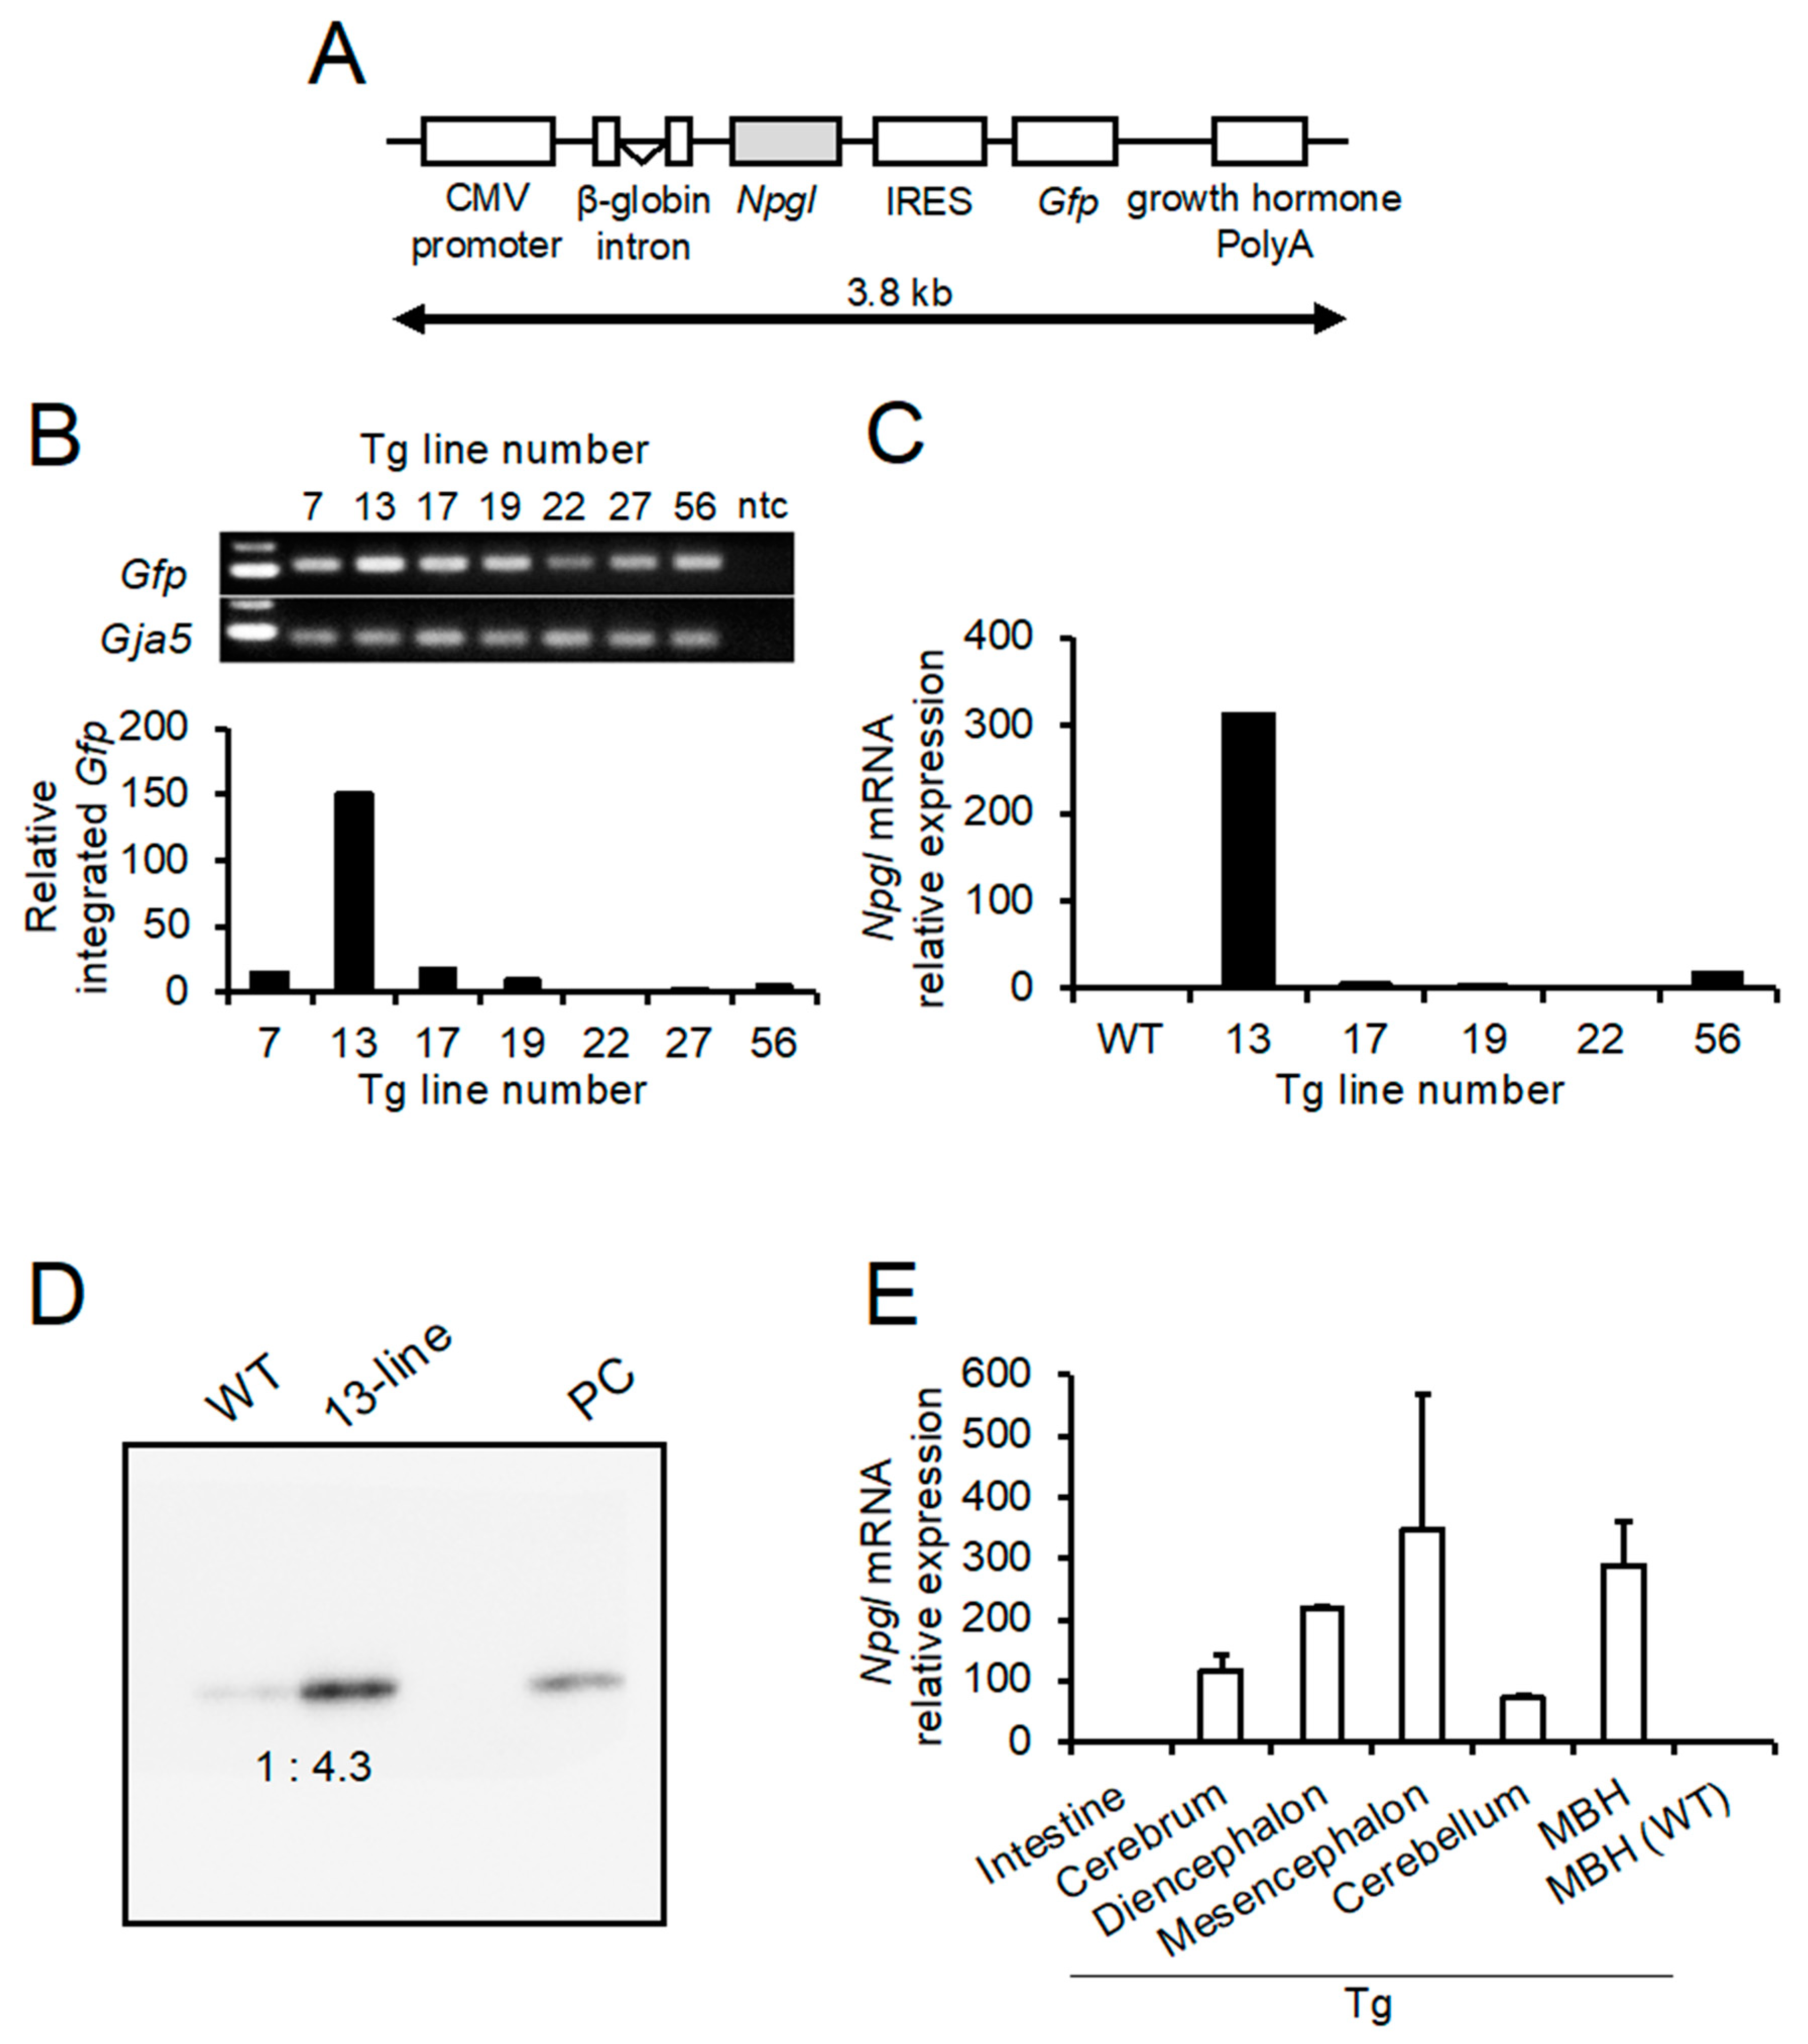
2.1. Production of Tg Mouse

Construction of the transgene is shown in Figure 1A. The ubiquitous cytomegalovirus (CMV) promoter was used to regulate the expression of Npgl. The transgene solution was microinjected into the pronuclei of fertilized eggs (ICR background), and the eggs were transferred into fallopian tubes of pseudo-pregnant female mice. As a result, 82 F0 mice were obtained. Genotyping revealed that the transgene was integrated into the genome of seven mice. The individual identification numbers were 7, 13, 17, 19, 22, 27, and 56 (Figure 1B). Quantitative analysis of integrated green fluorescent protein (Gfp) genes showed that integrated copies of the transgene were highest in the 13-line (Figure 1B). However, the amount of integrated transgene is not proportional to its expression level because the exogenous transgene is affected by the site of chromosomal integration [25,26]. Therefore, we analyzed the expression of Npgl mRNA in the mediobasal hypothalamus (MBH). The results show that the 13-line Npgl Tg mouse also had the highest level of Npgl mRNA expression among the five lines (Figure 1C). Furthermore, western blot analysis revealed that the mature NPGL protein was also overexpressed in the hypothalamus 13-line of Npgl Tg mice, and the levels were approximately 4.3 times higher than those in wild-type (WT) mice (Figure 1D). Thus, we mainly used the 13-line Npgl Tg mice for subsequent experiments. In addition, we used the 17-line Npgl Tg mice to confirm the phenotype as a different line.
Several studies have reported that the CMV promoter is prone to transcriptional silencing [27,28,29,30,31]. Therefore, the expression levels of Npgl mRNA in different tissues of Npgl Tg mice were examined using quantitative reverse transcriptase PCR (qRT-PCR). In Npgl Tg mice, Npgl mRNA was widely overexpressed in different regions of the brain, such as the cerebrum, diencephalon, mesencephalon, cerebellum, and MBH, whereas its expression was near the background level in the intestine (Figure 1E). In addition, the expression was not detected in the inguinal WAT, interscapular brown adipose tissue (BAT), or liver of Npgl Tg mice (data not shown). These results indicate that Npgl mRNA was overexpressed only in the central nervous system of Npgl Tg mice.

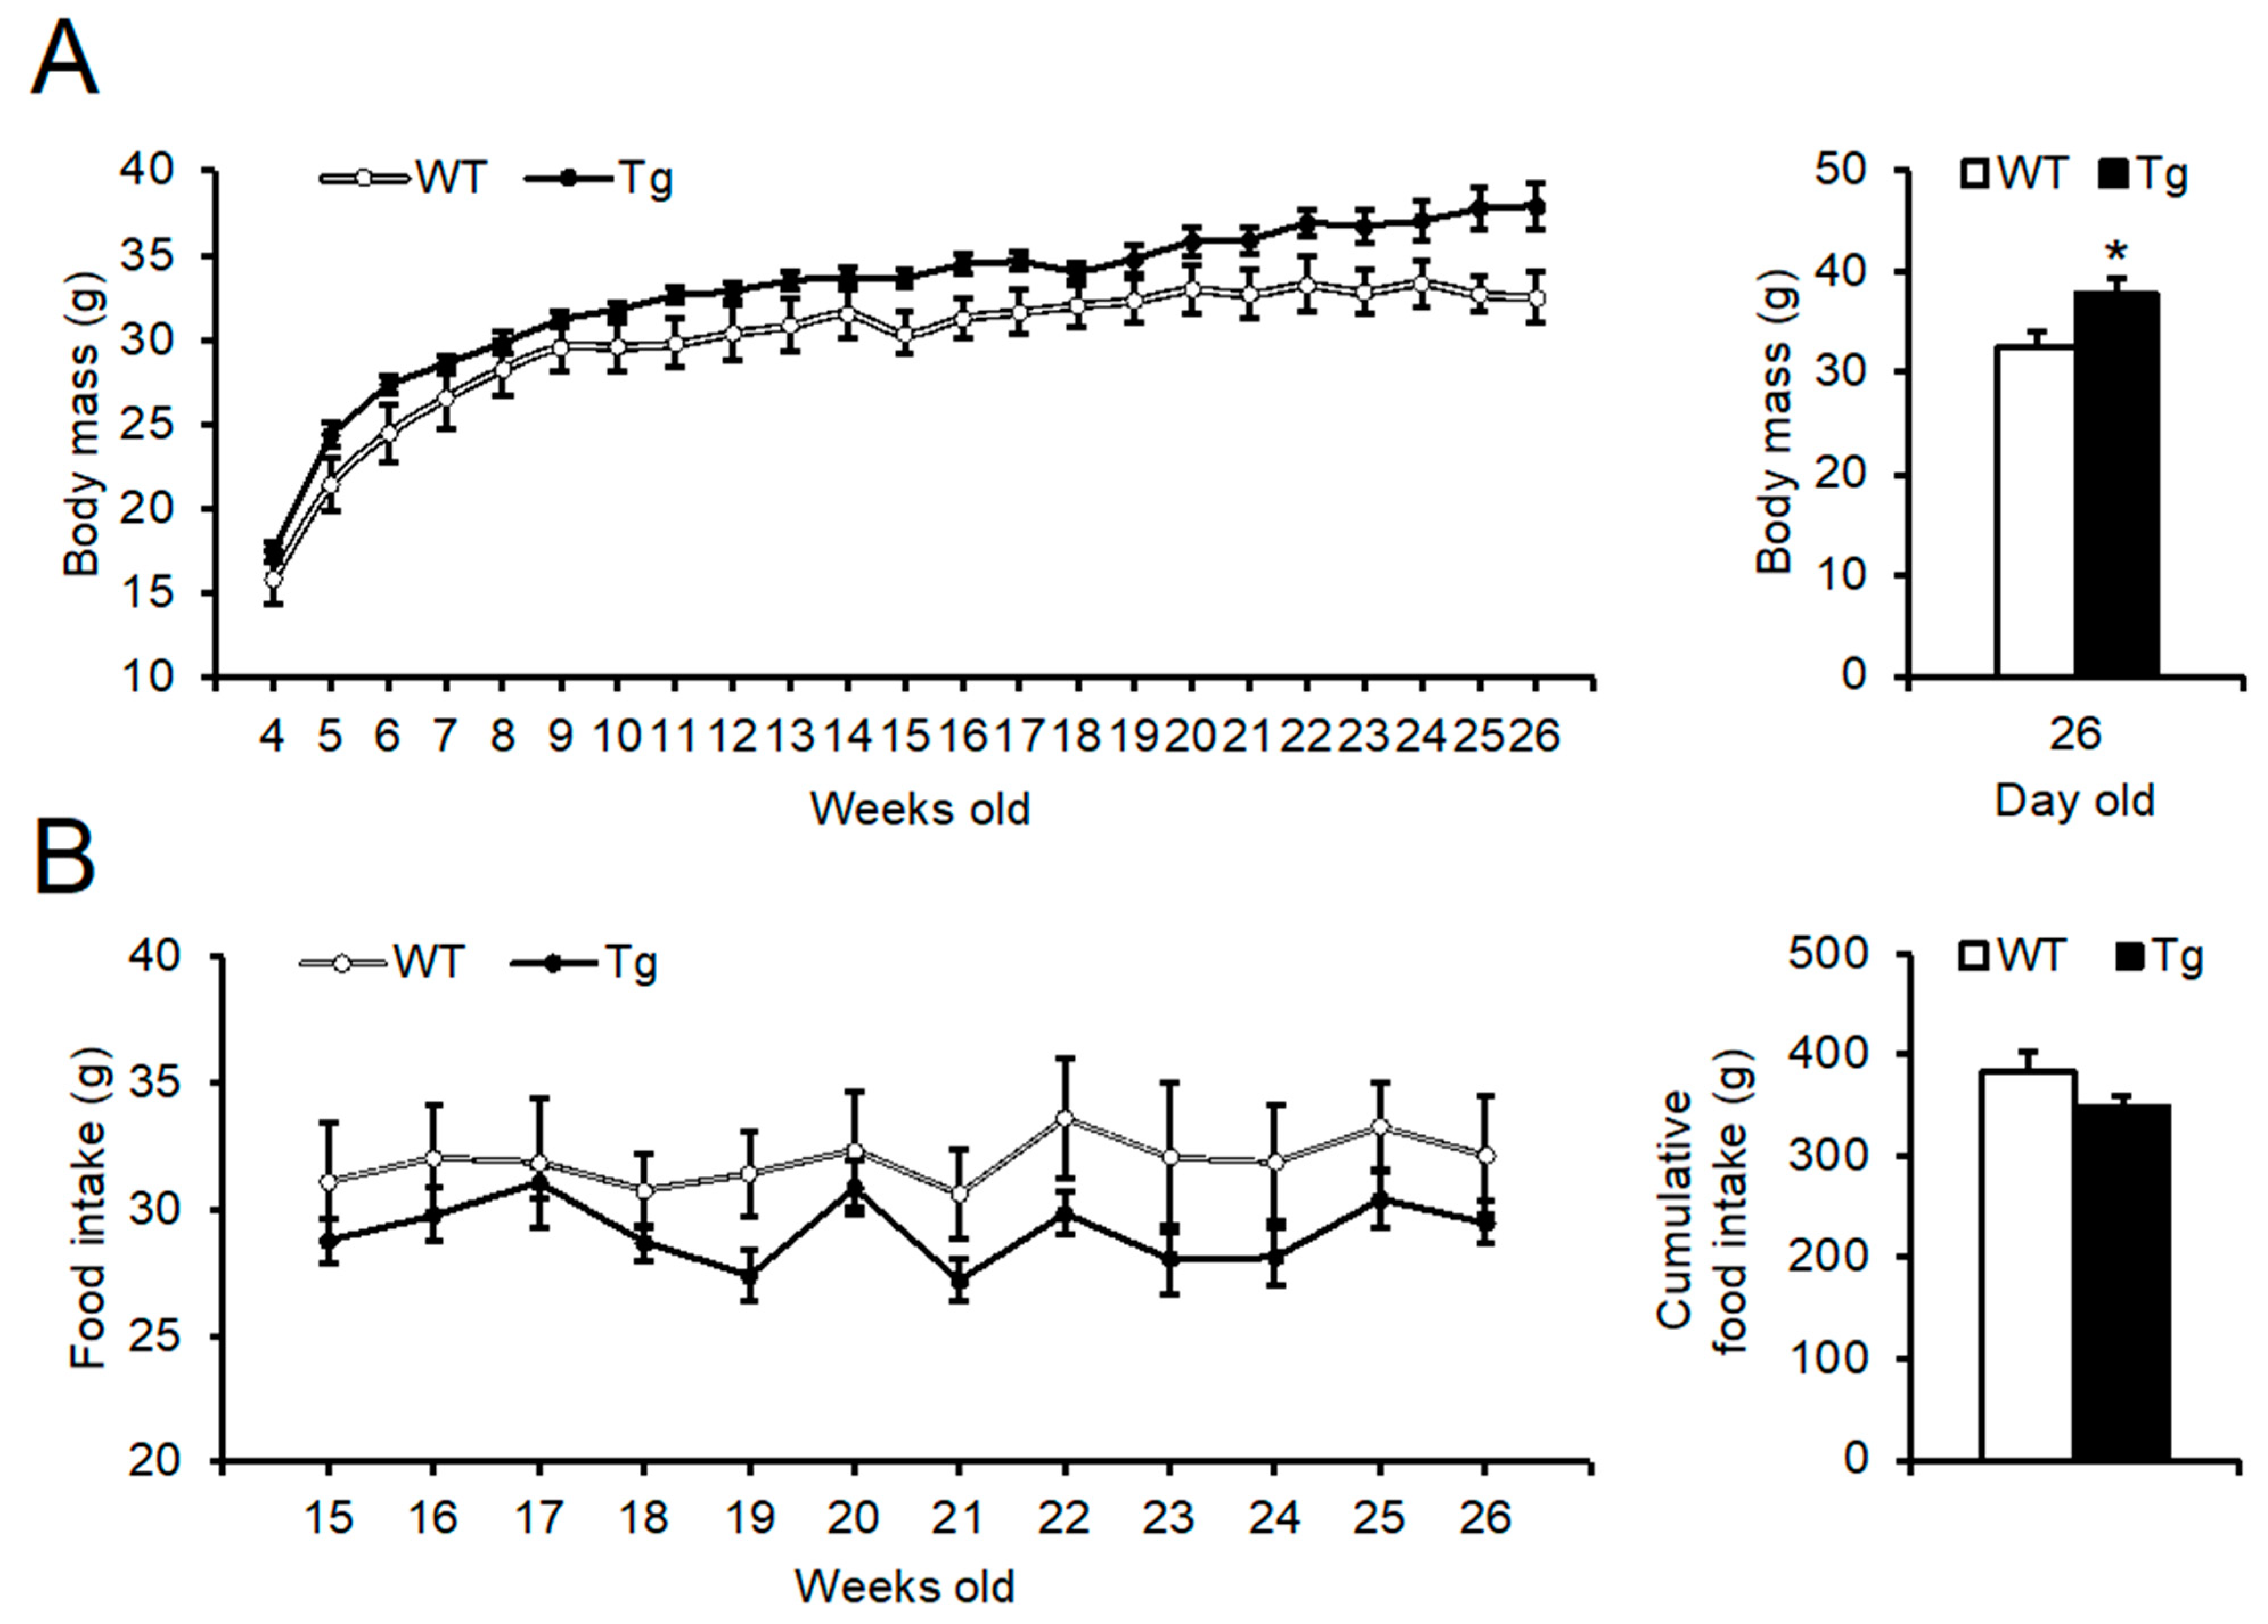
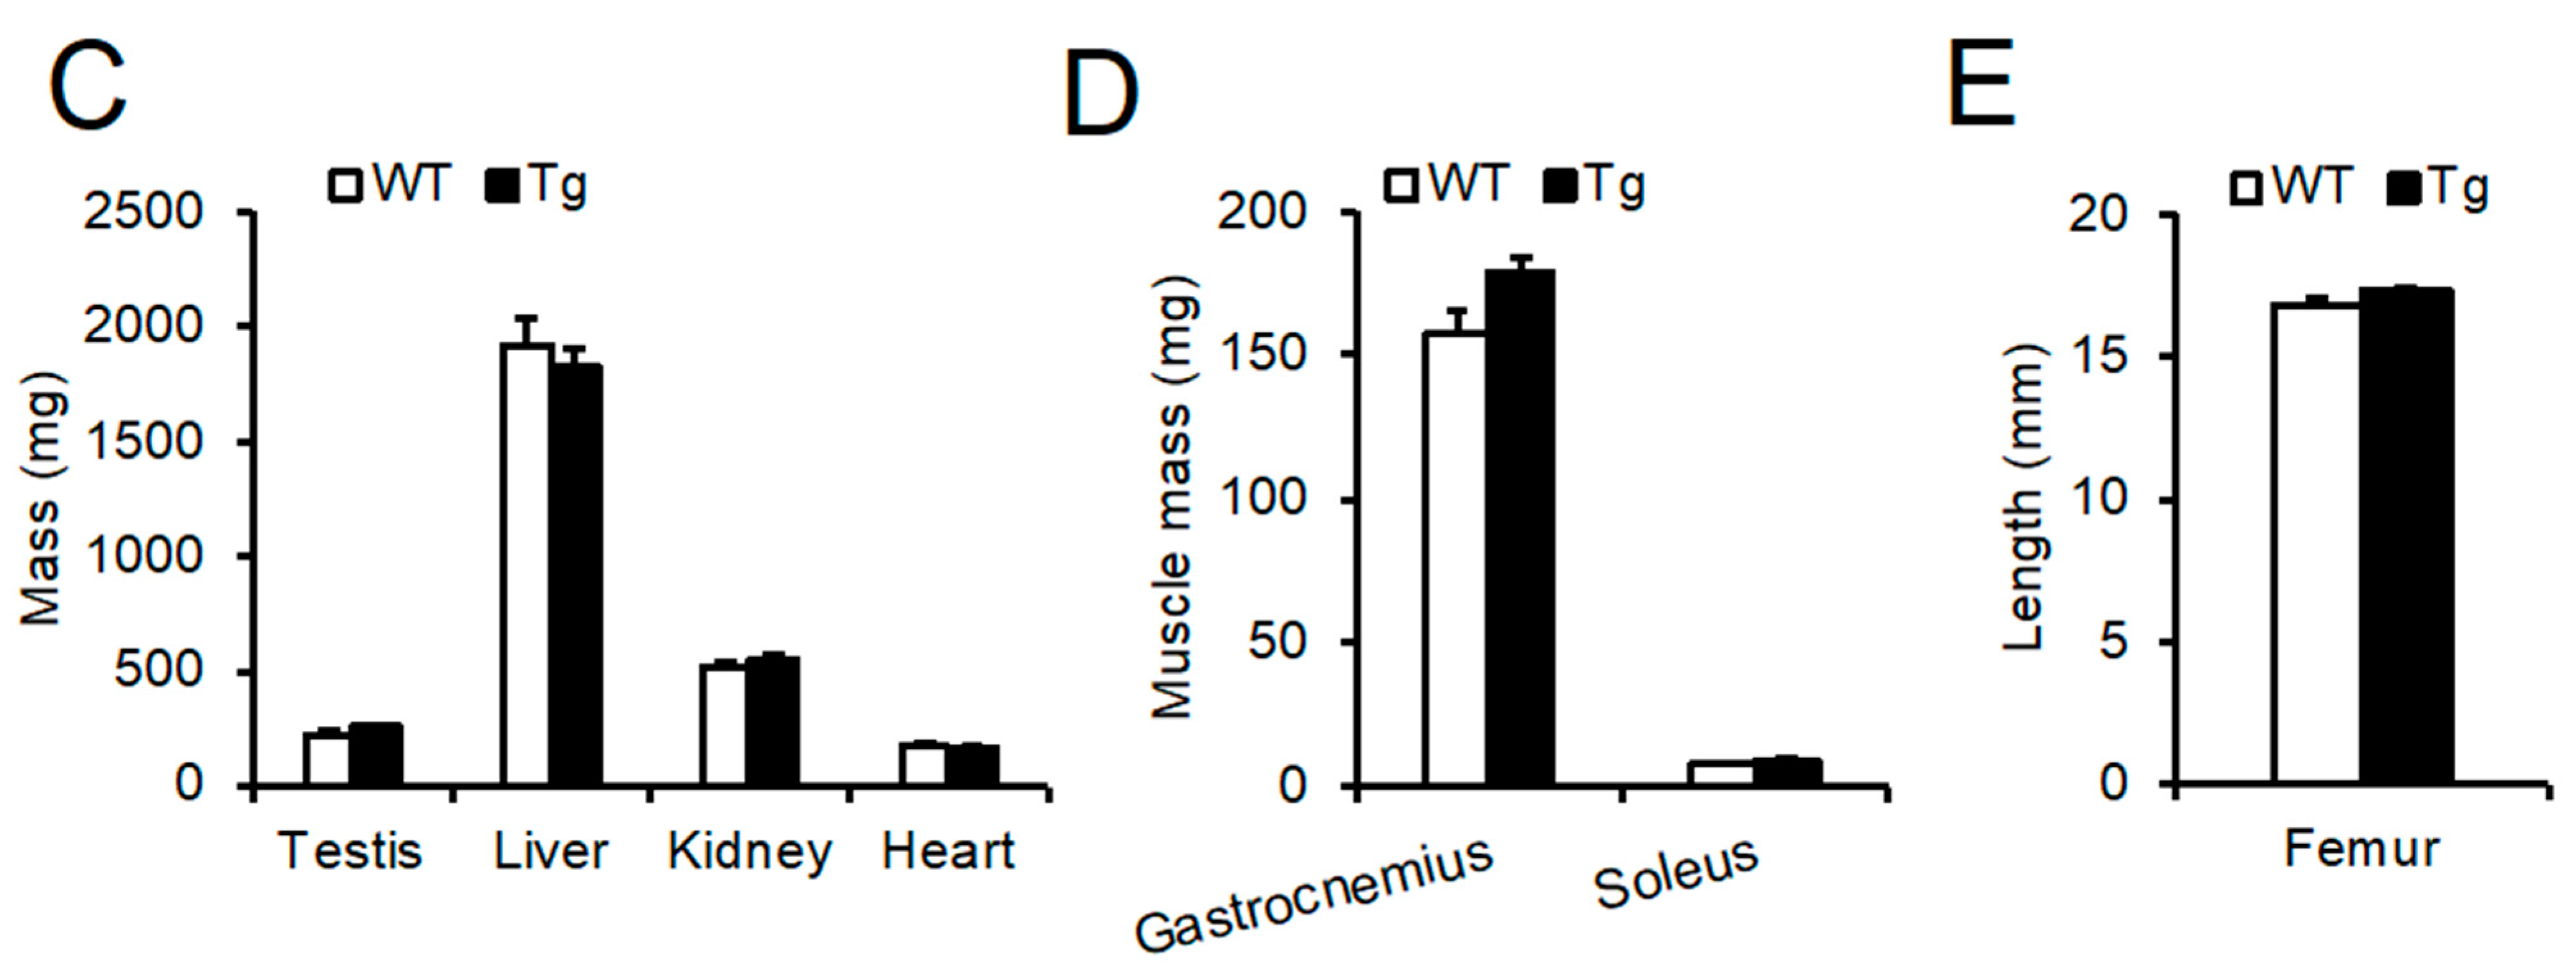
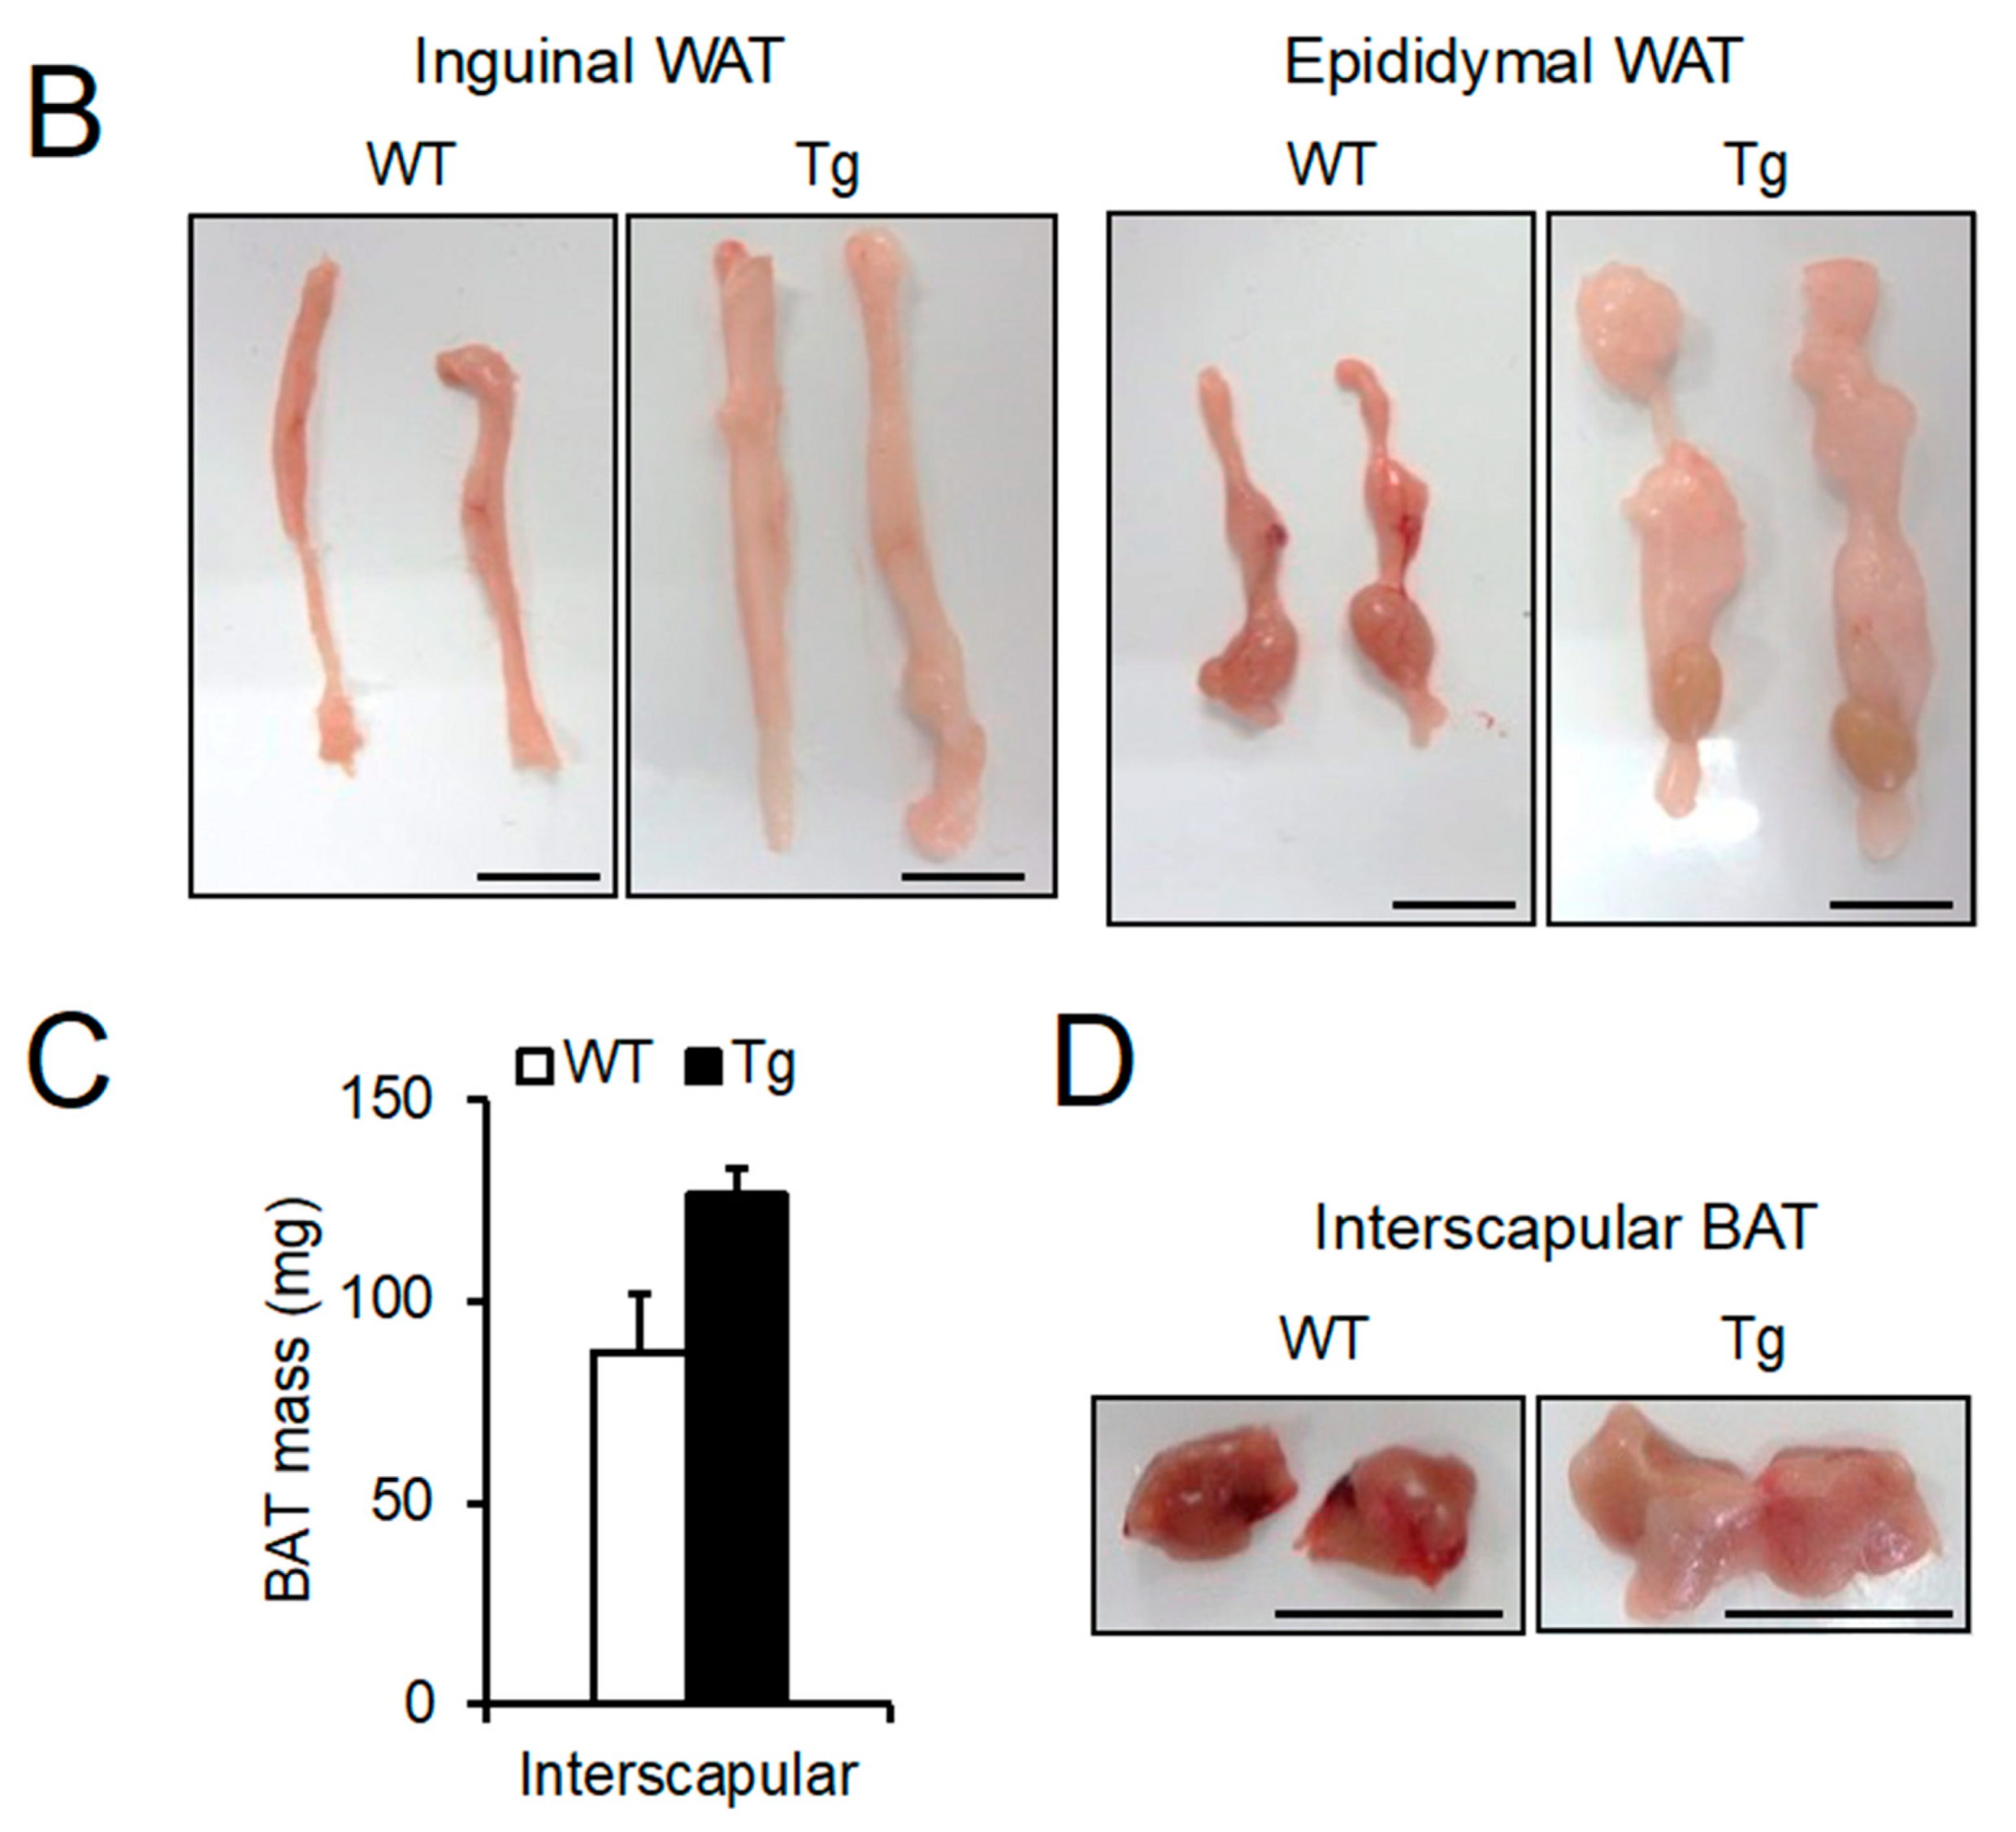
2.2. Phenotypic Analysis of Body Mass, Food Intake, and Peripheral Tissues

To determine the effects of Npgl overexpression on the central nervous system of mice, we assessed body mass, food intake, and body composition. Although two-way repeated measures ANOVA revealed no significant effect of Npgl overexpression on body mass, that of Npgl Tg mice was higher than that of WT mice at 26 weeks of age (Figure 2A). WT and Npgl Tg mice showed similar food intake from 15 to 26 weeks of age (Figure 2B).
The masses of the testis, liver, kidney, and heart did not change (Figure 2C). The masses of the gastrocnemius and soleus muscles were also unaffected (Figure 2D). In addition, the femur length, an index of body length, did not change (Figure 2E). While there were no remarkable changes in the masses of internal organs, muscles, and the length of the femur, the masses of inguinal WAT, epididymal WAT, retroperitoneal WAT, and perirenal WAT were drastically increased in Npgl Tg mice (Figure 3A,B). The mass of interscapular BAT in Npgl Tg mice was not different from that in WT mice, but the BAT of Npgl Tg mice showed whitening (Figure 3C,D). Npgl Tg mice in the 17-line, in which the Npgl mRNA expression level was lower than that in the 13-line, also showed increases in the masses of WATs and BAT, similar to that in the 13-line (Figure S1).
To examine the effects of Npgl overexpression on the expression of several neuropeptides and hormones, we conducted qRT-PCR in the hypothalamus and pituitary gland in the 13-line of mice. The mRNA expression levels did not change significantly, except for follicle-stimulating hormone (Fsh) in the pituitary gland (Figure S2A,B).

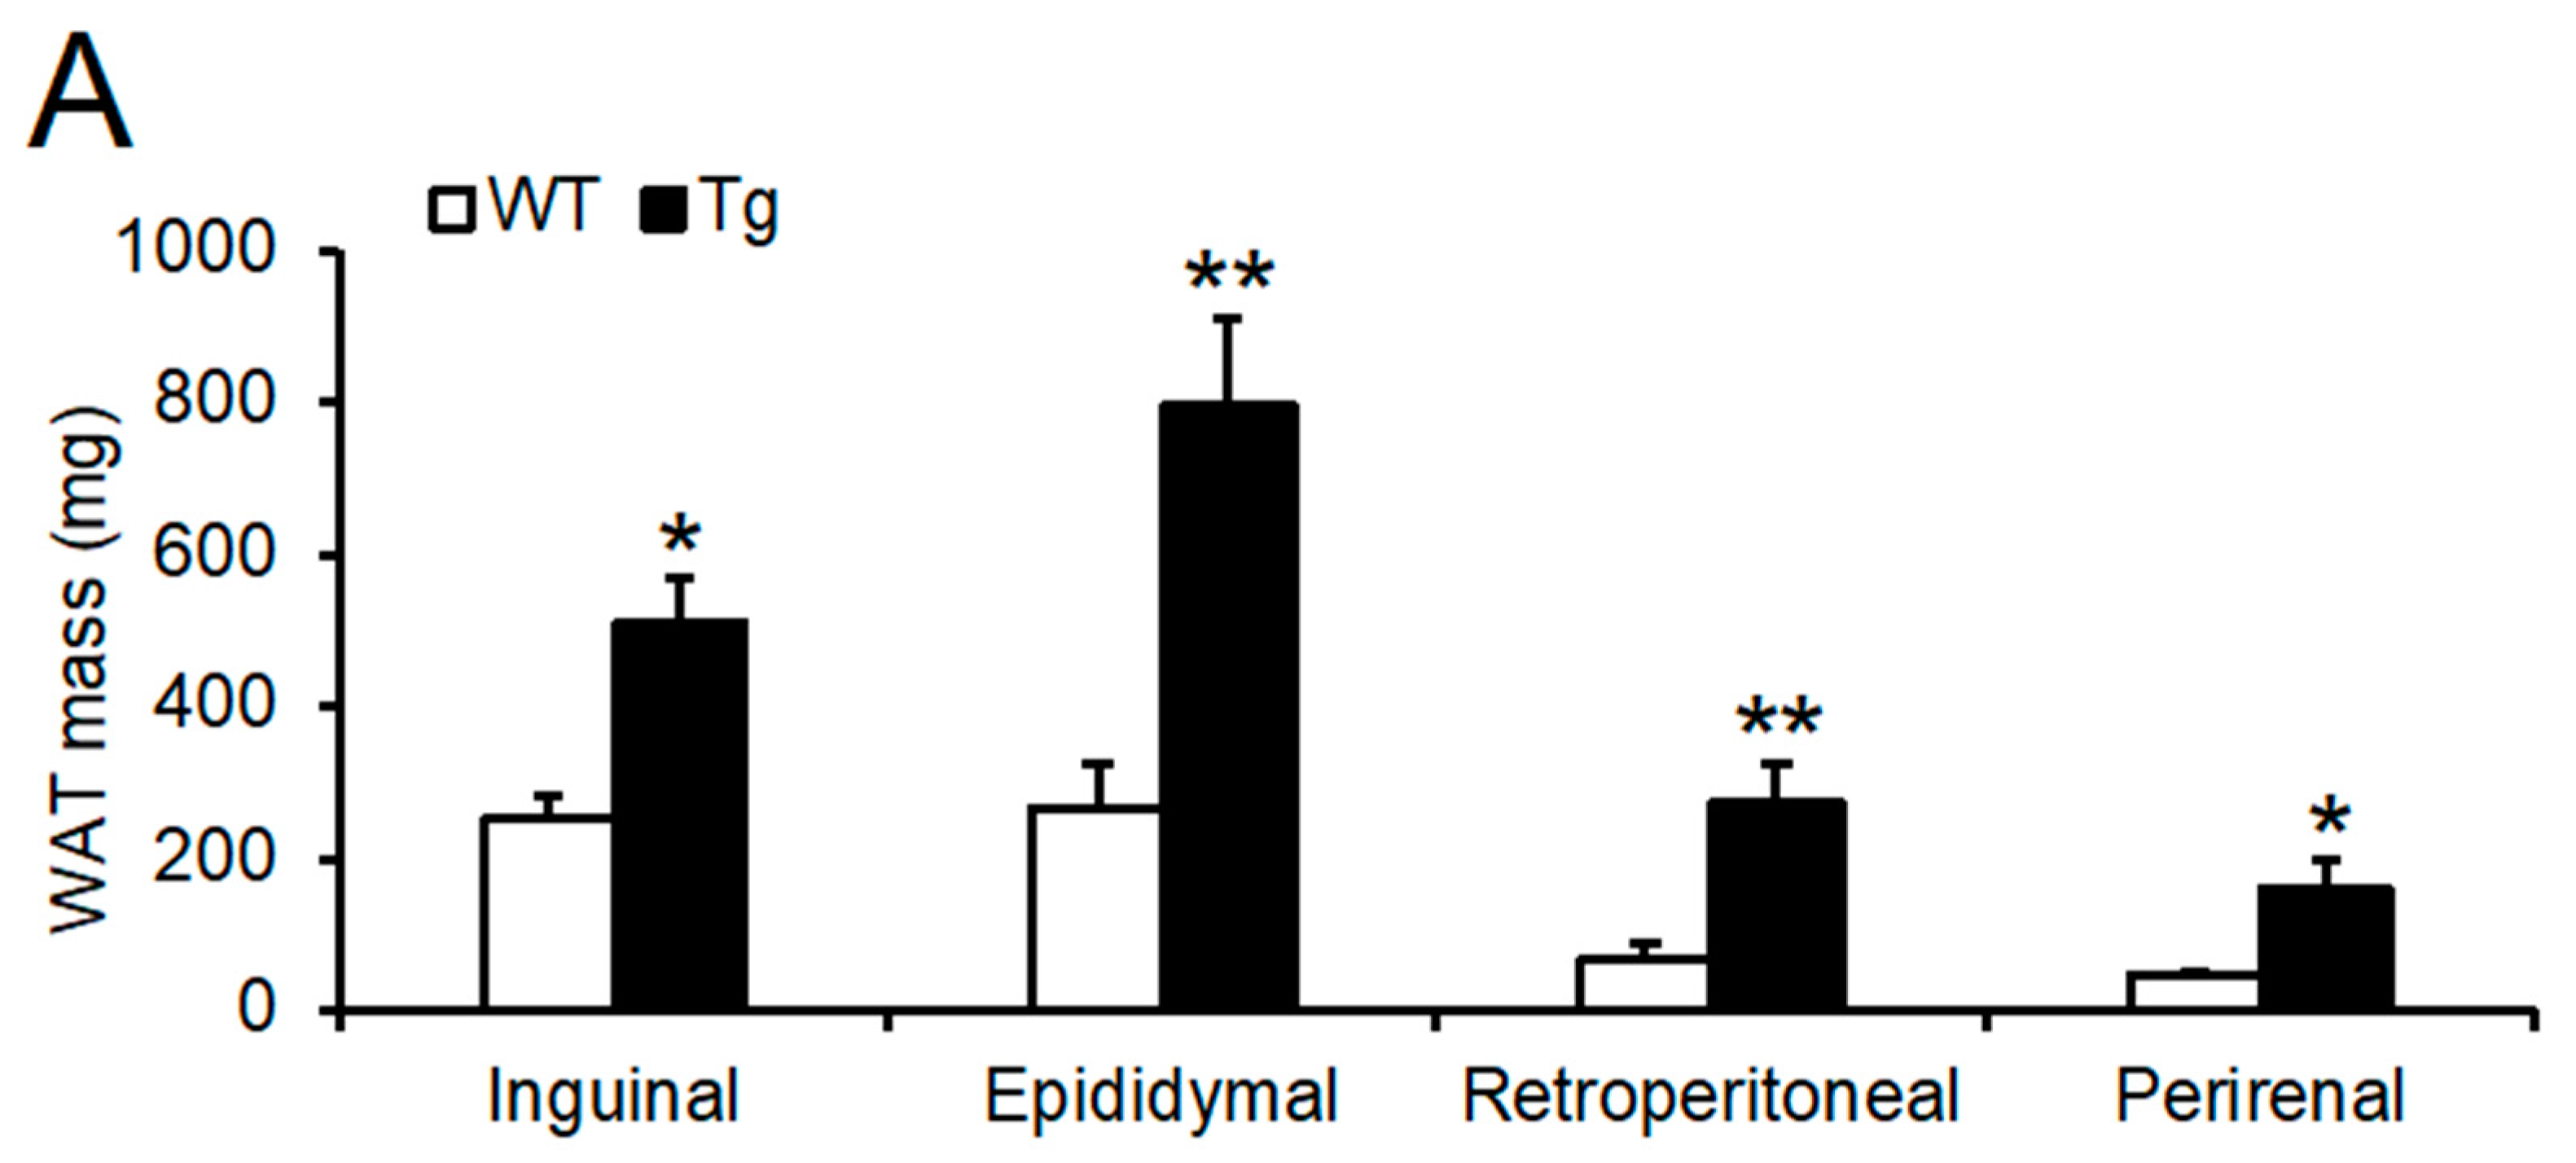
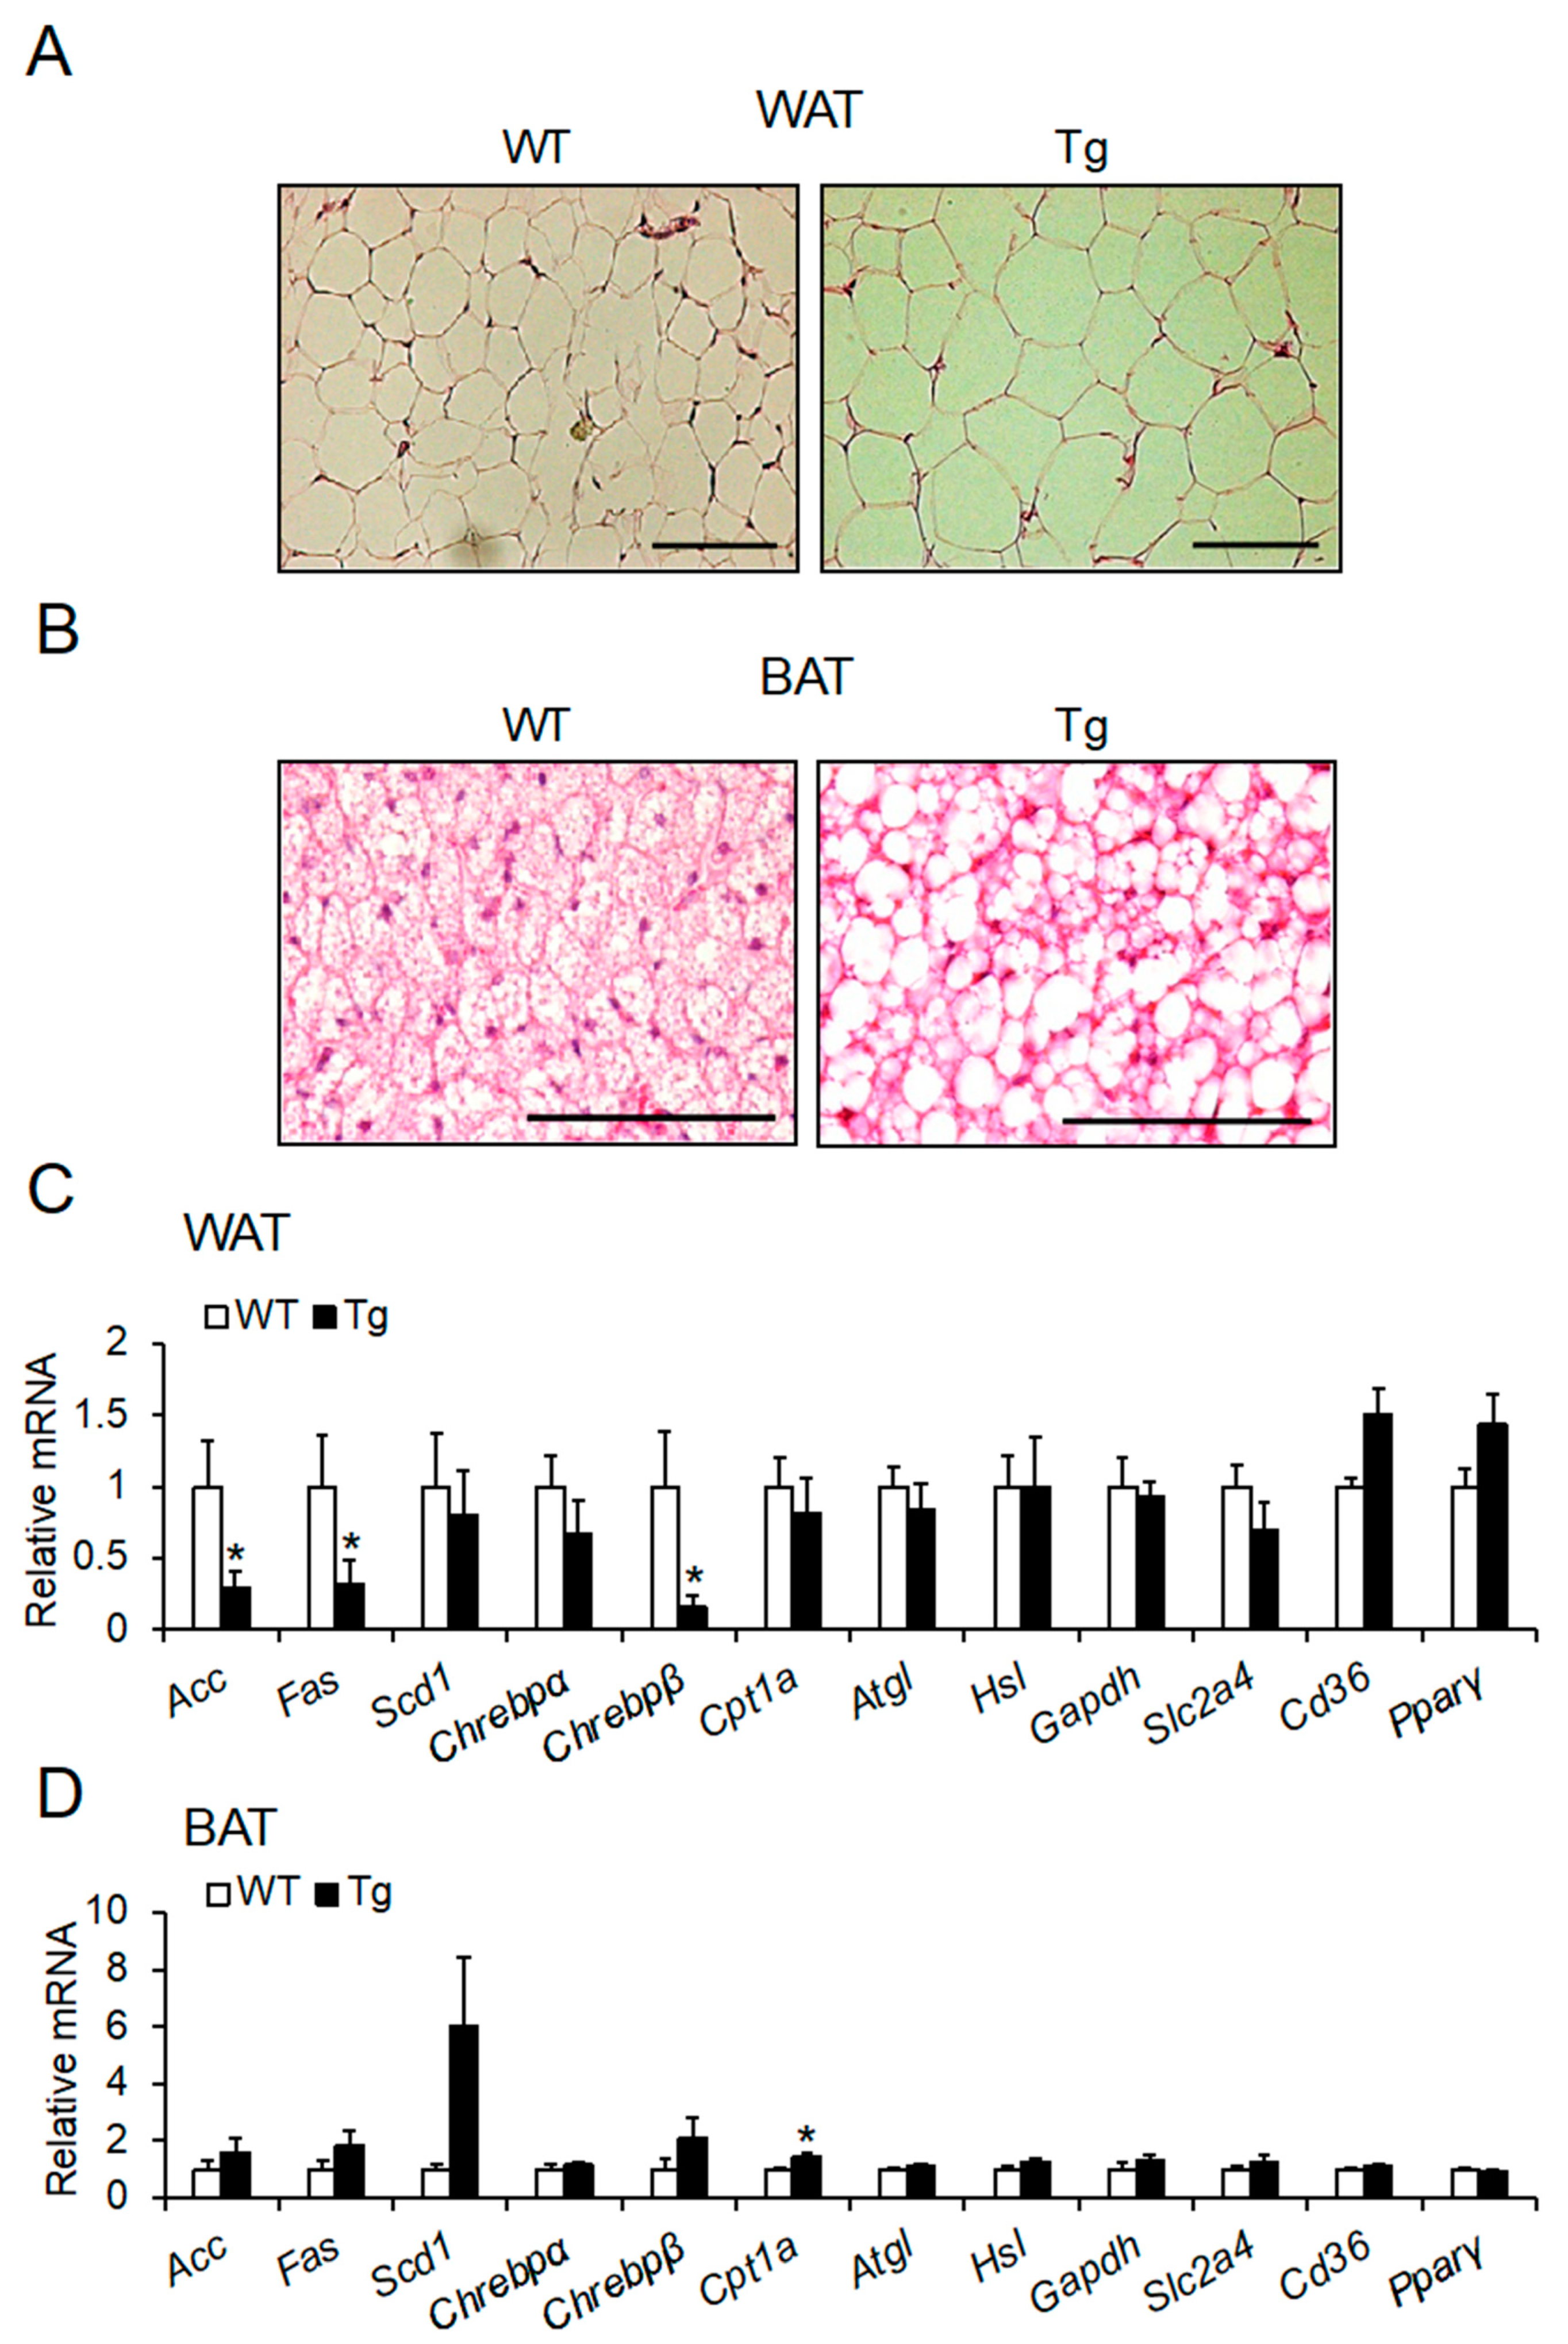
2.3. Lipid Droplet Hypertrophy in Adipose Tissues

We next performed histological analysis of WAT and BAT to determine whether the increase in WAT mass and whitening of BAT were associated with lipid droplet hypertrophy [32]. Histological analysis revealed that the droplets in WAT and BAT were hypertrophic (Figure 4A,B).
It is well known that serum leptin, an “anti-obesity” hormone secreted from WAT, increases during WAT increase. Therefore, we measured serum leptin concentration and observed that leptin levels were significantly elevated in Npgl Tg mice (Table 1). However, the serum levels of insulin, cholesterol, triglycerides, free fatty acids, and glucose did not change (Table 1).

2.4. mRNA Expression of Lipid Metabolic Factors in Adipose Tissues

As fat accumulation was accelerated in WAT and BAT, we expected that lipid metabolism in both adipose tissues would change in Npgl Tg mice. We measured the mRNA expression levels of genes involved in lipogenesis (acetyl-CoA carboxylase, Acc; fatty acid synthase, Fas; stearoyl-CoA desaturase 1, Scd1; and carbohydrate-responsive element-binding protein α and β, Chrebp α and β), lipolysis (carnitine palmitoyltransferase 1a, Cpt1a; adipose triglyceride lipase, Atgl; and hormone-sensitive lipase, Hsl), glycolysis (glyceraldehyde 3-phosphate dehydrogenase, Gapdh), glucose uptake (solute carrier family 2 member 4, Slc2a4), lipid uptake (cluster of differentiation 36, Cd36), and adipocyte differentiation (peroxisome proliferator-activated receptor γ, Pparγ). Although fat accumulation was observed in the inguinal WAT of Npgl Tg mice, the mRNA expression levels of Acc, Fas, and Chrebpβ were decreased (Figure 4C). In BAT, the mRNA expression of Cpt1a was upregulated in Npgl Tg mice (Figure 4D). Subsequently, to investigate the possibility that dysfunction in BAT thermogenesis mainly causes lipid droplet hypertrophy, we measured the mRNA expression levels of genes involved in thermogenesis in BAT, such as uncoupling protein 1 (Ucp1), type 2 iodothyronine deiodinase (Dio2), and peroxisome proliferator-activated receptor γ coactivator 1α (Pgc1α). However, no significant differences were observed (Figure S2C).

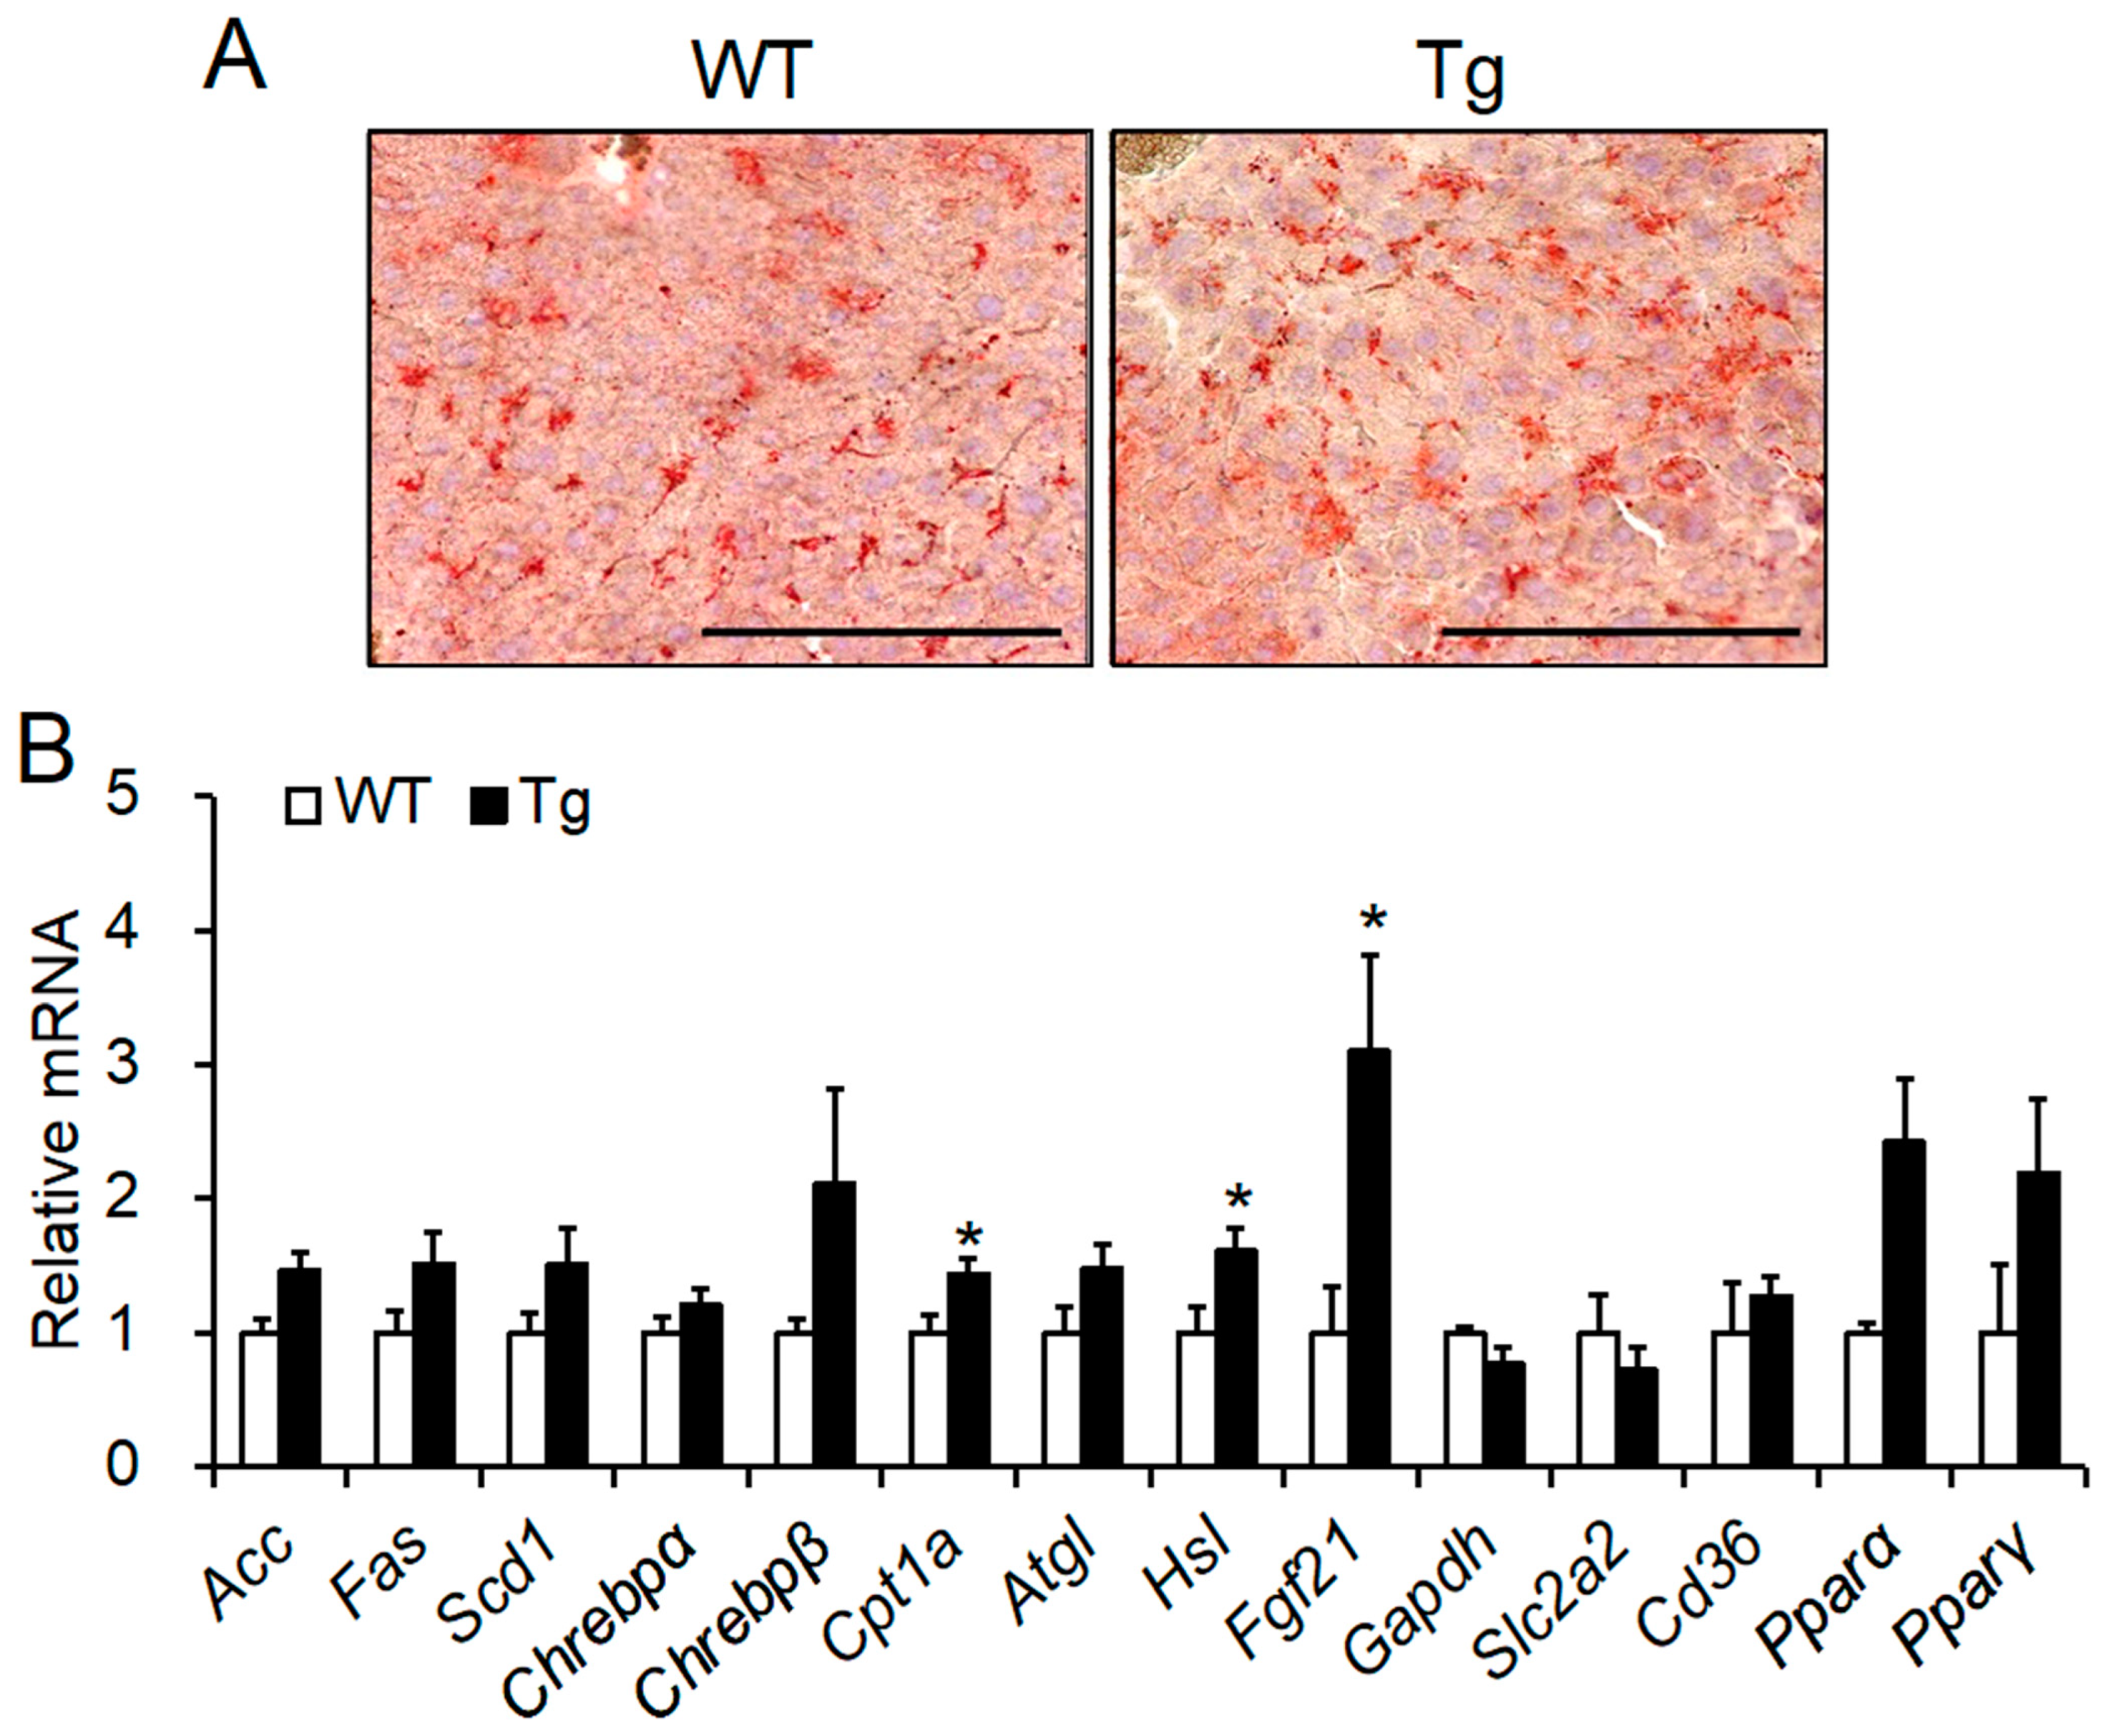
2.5. Histological Analysis and mRNA Expression of Lipid Metabolic Factors in the Liver

Next, we evaluated whether Npgl overexpression led to hepatic steatosis. Hepatic fat content in Npgl Tg mice was not different from that in WT mice despite adiposity in WAT in Npgl Tg mice (Figure 5A). qRT-PCR analysis revealed that the expression levels of Cpt1a, Hsl, and fibroblast growth factor 21 (Fgf21) mRNA were significantly elevated in the livers of Npgl Tg mice (Figure 5B). These data suggest that the hepatic lipid oxidation system is accelerated in Npgl Tg mice.

3. Discussion

We have identified that a novel gene encoding a small secretory protein, NPGL, induces fat accumulation in chicks, rats, and obesity-prone C57BL/6J mice [21,23,24]. However, whether NPGL induces adiposity in different strains of mouse is poorly understood. We showed that Npgl Tg mice backcrossed onto ICR mice showed overexpression of Npgl in the central nervous system. Npgl Tg mice showed increased WAT mass without any changes in food intake. Although BAT mass did not change in Npgl Tg mice, lipid droplet hypertrophy was observed in BAT and WAT. In addition, fat accumulation was not induced in the liver because of accelerated hepatic lipolysis. Taken together, our data indicate that NPGL leads to obesity in several mouse strains.
The present study shows that Npgl Tg mice displayed fat accumulation without increasing food intake, upregulated mRNA expression levels of lipogenic factors in adipose tissues, and changes in blood parameters. We have previously reported that NPGL rapidly leads to obesity by reducing the energy expenditure in C57BL/6J mice [24]. The mRNA expression levels of lipogenic factors in WAT decrease with adiposity [33]. Therefore, our data suggest that NPGL initially downregulates energy consumption, resulting in fat accumulation. Recently, some reports have suggested that ICR mice are a more suitable model for metabolic research than C57BL/6J mice [34,35,36]. Daruma mice, which are genetically obese mouse models generated by the ICR strain, have shown adiposity similar to leptin-deficient ob/ob mice and leptin receptor-deficient db/db mice [37]. Moreover, ICR mice are susceptible to streptozotocin/nicotinamide-induced diabetes [38]. Additional studies to unravel the effects of NPGL on insulin sensitivity and glucose tolerance using the ICR strain will help to elucidate the biological mechanisms of metabolic syndromes in heterogeneous populations.
Although we have previously reported that NPGL has an orexigenic effect in rodents [21,24,39], WT and Npgl Tg mice showed similar food intake in this study. Several studies have shown differences in the effects of neuropeptides between pharmacological approaches and genetically modified animals. I.c.v. injection of NPY potently stimulates feeding behavior, although Npy knockout has little effect on food intake [40,41]. Npy transgenic rats also exhibit normal feeding behavior [42]. Furthermore, i.c.v. injection of AgRP accelerates feeding behavior, and Agrp-deficient mice display few changes in feeding behavior [43]. Recently, the analysis of chemogenetics or optogenetics has become a powerful tool for research on the biological actions of specific neurons [44,45,46,47]. Therefore, reversible manipulation of NPGL neurons using chemogenetics and/or optogenetics is required to evaluate the orexigenic effects of NPGL.
In Npgl Tg mice, we observed normotopic fat accumulation in the WAT and prevention of ectopic adiposity, such as the development of fatty liver. In addition, upregulation of Cpt1a and Hsl mRNA expression was detected in the livers of Npgl Tg mice. FGF21, an endocrine hormone that is mainly secreted from the liver, is regulated by ChREBP [48]. CPT1a and HSL are enzymes that catalyze β-oxidation. Hepatic Cpt1a expression levels are increased by Fgf21 overexpression and reduced by Fgf21 knockdown [49,50]. A recent study has demonstrated that ipragliflozin, an inhibitor of sodium-glucose cotransporter 2 (SGLT2), accelerates normotopic fat accumulation and inhibits liver steatosis [51]. These studies suggest that NPGL promotes normotopic fat accumulation in WAT and lipolysis in the liver via the inhibition of SGLT2. Further studies to elucidate the NPGL-SGLT2 system will provide new insights into normotopic fat accumulation and metabolic diseases.
One of the limitations in the present study may be the random overexpression of Npgl in mice. In this study, we addressed Npgl overexpression using CMV promoter. As CMV promoter allows gene expressions in ubiquitous regions, we observed the expression of Npgl in several brain regions including MBH and in other regions of Npgl Tg mice. On the other hand, we have previously reported that Npgl is highly expressed in the MBH, while it is slightly expressed in other brain regions [20]. Therefore, the region-specific expression will help to develop the research on the physiological function of NPGL. Moreover, to evaluate the effects of NPGL on lipid metabolism, we only conducted qRT-PCR in adipose tissues. Lipid metabolic factors are regulated by not only mRNA levels but also protein and/or phosphorylation levels. Our present study showed the few effects of lipid metabolic factors on mRNA levels, despite fat accumulation in adipose tissues. To clarify this discrepancy, further studies to evaluate the enzymatic activities and the protein abundance of lipid metabolic factor are required.
In conclusion, NPGL induces normotopic fat accumulation in WAT and prevents the development of fatty liver in ICR mice. This report strongly supports the notion that NPGL acts as a potent anabolic neuropeptide in several mouse strains. Considering that ICR strain mice are a more reasonable model for metabolic research than C57BL/6J mice [34,35,36], our findings open up new avenues for the comprehension of metabolic status and genetic polymorphisms. A recent study reported the importance of genotype-informed treatments owing to the association between obesity and genetic polymorphisms [52]. Future studies investigating the differences in the metabolic effects of NPGL using various mouse strains or species may contribute to the progress of obesity and metabolic syndrome in heterogeneous populations.

4. Materials and Methods

4.1. Animals

Male mice were kept at 25 ± 1 °C with a 12-h light/12-h dark cycle and provided ad libitum access to water and food (CE-2; CLEA Japan, Tokyo, Japan). Heterozygous transgenic mice were used in this study. 13-line Npgl Tg mice were housed individually from 4 weeks of age, and their body mass was measured every week. Food intake was measured from 15 to 26 weeks of age. 17-line Npgl Tg mice were divided into groups of five, and their body mass was measured weekly from 4 weeks of age. All animal experiments were performed in accordance with the Guide for the Care and Use of Laboratory Animals prepared by Hiroshima University (Higashi-Hiroshima, Japan), and the procedures were approved by the Institutional Animal Care and Use Committee of Hiroshima University (permit number: C14-1-2, 19 April 2016).

4.2. Generation of Transgenic Mouse Overexpressing Npgl

The transgenes used in this study are shown in Figure 1A. The 3.8 kb transgene was electrophoresed on 1% agarose gel, and the DNA band was cut out and purified with Wizard SV Gel and the PCR Clean-Up System (Promega, Madison, WI, USA). The transgene solution was microinjected into the host pronuclei of fertilized eggs from mice (ICR outbred strain), and the eggs were transferred into fallopian tubes of pseudo-pregnant female mice.

4.3. Selection of the Line of Npgl Tg Mice

The genotypes of all F0 mice were determined by genomic DNA analysis. Genomic DNA was isolated from tails using the PureLink Genomic DNA Mini Kit (Life Technologies, Carlsbad, CA, USA) and amplified with TaKaRa Ex Taq (TaKaRa Bio, Shiga, Japan) under the following conditions: 94 °C for 3 min, followed by 25 cycles of 94 °C for 30 s and 60 °C for 30 s. The amplified product was electrophoresed on 1% agarose gel. The gap junction alpha-5 protein (Gja5) gene was used as an endogenous control. Relative transgene integration was measured by qRT-PCR. qRT-PCR was performed with THUNDERBIRD SYBR qPCR Mix (TOYOBO, Osaka, Japan) using the following conditions: 95 °C for 20 s, followed by 40 cycles of 95 °C for 3 s, and 60 °C for 30 s. The Gja5 gene was used as an endogenous control. The primers used in this study are listed in Table 2. The data were analyzed using the 2−ΔΔCt method [53]. As a result, seven F0 transgenic mice were generated. These seven mice were mated with WT mice to produce the transgenic offspring. The transgene was inherited from the offspring of five F0 mice, and we successfully obtained five transgenic lines. To select a transgenic line for further analysis, we analyzed Npgl mRNA expression levels in the MBH using qRT-PCR.

4.4. Tissue Collection

The mice were immediately euthanized by decapitation. Subsequently, the MBH, pituitary gland, adipose tissues (WAT and interscapular BAT), internal organs (liver, kidney, heart, and testis), muscles (gastrocnemius and soleus), long bones (femur), and blood were collected from mice. We measured the masses of adipose tissues, internal organs, and the length of the bone. The MBH, pituitary gland, liver, inguinal WAT, and BAT were frozen in liquid nitrogen and stored at −80 °C for RNA processing. The liver, epididymal WAT, and BAT were fixed in 4% paraformaldehyde (PFA) solution and stored at 4 °C for histological analysis. Blood was centrifuged for 15 min at 800× g and 4 °C after incubation for 30 min at 25 °C, and the serum was stored at −40 °C.

4.5. qRT-PCR

Total RNA was isolated using TRIzol reagent (Life Technologies) for the MBH and liver, QIAzol reagent for the adipose tissues (QIAGEN, Venlo, The Netherlands), or the RNAqueous-Micro Scale RNA Isolation Kit for the pituitary gland (Life Technologies). First-strand cDNA was reverse transcribed using the ReverTra Ace kit (TOYOBO). qRT-PCR was performed with THUNDERBIRD SYBR qPCR Mix (TOYOBO) under the following conditions: 95 °C for 20 s, followed by 40 cycles of 95 °C for 3 s, and 60 °C for 30 s. Data were analyzed by the 2−ΔΔCt method using β-actin (Actb) for the MBH, pituitary gland, liver, or ribosomal protein S18 (Rps18) for adipose tissues [53]. The primers used in this study are listed in Table 2.

4.6. Western Blot Analysis

To detect mature NPGL in the hypothalamus of WT and Npgl Tg mice, Western blot analysis was performed after SDS-PAGE following our previously published methods [21,24]. The hypothalamus of WT and Npgl Tg mice was boiled and homogenized. The homogenate was centrifuged at 15,000× g for 20 min at 4 °C. After extraction with dimethyl sulfoxide, the supernatant was subjected to reversed-phase HPLC using an octadecylsilane (ODS) column (TSK gel ODS-80Ts; 4.6 × 150 mm; Tosoh, Tokyo, Japan) with a linear gradient of 20−60% acetonitrile containing 0.1% trifluoroacetic acid at a flow rate of 0.5 mL/min. The fractions were evaporated and dissolved in SDS sample buffer. This solution was subjected to 15% SDS-PAGE. After transfer, the blot was detected with a rabbit antibody against NPGL (1:1000 dilution), horseradish peroxidase-labeled donkey anti-rabbit IgG (1:1000 dilution; GE Healthcare, Little Chalfont, England), and ECL Prime Western blotting detection reagent (GE Healthcare).

4.7. Hematoxylin and Eosin Staining

For paraffin embedding, epididymal WAT and interscapular BAT were fixed with 4% PFA solution for several days and delipidated with xylene and ethanol. Adipose tissues were embedded in paraffin and sectioned to a thickness of 7 µm using a microtome. The sections were air-dried and deparaffinized in a graded alcohol series. The nuclei and cytoplasm were stained with hematoxylin and eosin (5 min for each stain), and the sections were washed with tap water. After dehydration in a graded alcohol series and clearing with xylene, sections were mounted on slides and examined under a microscope.

4.8. Oil Red O Staining

To detect fat accumulation in the liver, hepatic tissue was fixed in 4% paraformaldehyde and sliced into 10-µm-thick sections. Sections were air-dried, rinsed with 60% isopropanol, stained with Oil Red O solution for 15 min at 37 °C, and rinsed with 60% isopropanol. The nuclei were counterstained with hematoxylin for 5 min, and the sections were washed with tap water. Coverslips were applied using an aqueous mounting medium, and microscopic examination was performed using a microscope.

4.9. Serum Biochemical Analysis

Glucose content was measured using a glucose content monitor (Arkray, Kyoto, Japan). The NEFA C-Test Wako (Wako Pure Chemical Industries, Osaka, Japan) was used to measure free fatty acid levels. The Triglyceride E-Test Wako (Wako Pure Chemical Industries) was used to measure triglyceride levels, the Cholesterol E-Test Wako (Wako Pure Chemical Industries) for cholesterol content, the Leptin ELISA kit (Morinaga Institute of Biological Science, Kanagawa, Japan) for leptin, and the LBIS Insulin Mouse T ELISA Kit (Shibayagi, Gunma, Japan) for insulin.

4.10. Statistical Analysis

Mann–Whitney U test was performed to assess the 2-group differences between WT and Npgl Tg mice. To assess the main effects of groups (WT and Tg) and time, two-way ANOVA with repeated measures followed by Bonferroni’s test for multiple comparisons was conducted. Differences with p values < 0.05 were considered statistically significant. All results are presented as the mean ± standard error of the mean (SEM).

Supplementary Materials

The following supporting information can be downloaded at: https://www.mdpi.com/article/10.3390/ijms23126488/s1.

Author Contributions

Conceptualization, Y.N., D.M. and K.U.; methodology, Y.N., D.M., E.I.-U. and M.F.; investigation, Y.N., D.M., E.I.-U., M.F. and K.U.; writing—original draft preparation, Y.N. and D.M.; writing—review and editing, Y.N. and K.U.; visualization, Y.N. and D.M.; project administration, K.U.; funding acquisition, E.I.-U. and K.U. All authors have read and agreed to the published version of the manuscript.

Funding

This work was supported by JSPS KAKENHI Grant (JP19H03258, JP20K21760 and JP22H00503 to K.U., and JP19K06768 to E.I.-U.), the Takeda Science Foundation (K.U.), the Uehara Memorial Foundation (K.U.), and the ONO Medical Research Foundation (K.U.).

Institutional Review Board Statement

All animal experiments were performed in accordance with the Guide for the Care and Use of Laboratory Animals prepared by Hiroshima University (Higashi-Hiroshima, Japan), and the procedures were approved by the Institutional Animal Care and Use Committee of Hiroshima University (permit number: C14-1-2, 19 April 2016).

Informed Consent Statement

Not applicable.

Data Availability Statement

The raw data supporting the findings of this manuscript will be made available by the corresponding author, K.U., to any qualified researchers upon reasonable request.

Acknowledgments

We are grateful to Kenshiro Shikano for their experimental support.

Conflicts of Interest

The authors declare no conflict of interest.

Abbreviations

ACCAcetyl-CoA carboxylase
ACTBβ-Actin
AgRPAgouti-related protein
ATGLAdipose triglyceride lipase
α-MSHα-melanocyte-stimulating hormone
BATBrown adipose tissue
CARTCocaine- and amphetamine-regulated transcript
CD36Cluster of differentiation 36
ChREBPαCarbohydrate-responsive element-binding protein α
ChREBPβCarbohydrate-responsive element-binding protein β
CMVCytomegalovirus
COVID-19Coronavirus disease 2019
CPT1aCarnitine palmitoyltransferase 1a
CRHCorticotropin-releasing hormone
DIODiet-induced obesity
DIO2Type 2 iodothyronine deiodinase
FASFatty acid synthase
FGF21Fibroblast growth factor 21
FSHFollicle stimulating hormone
GAPDHGlyceraldehyde 3-phosphate dehydrogenase
GFPGreen fluorescent protein
GHGrowth hormone
GHRHGrowth hormone releasing hormone
GJA5Gap junction alpha-5 protein
HFDHigh-fat diet
HSLHormone-sensitive lipase
i.c.v.Intracerebroventricular
IRESInternal ribosome entry sites
LHLuteinizing hormone
MBHMediobasal hypothalamus
MCHMelanin-concentrating hormone
NPGLNeurosecretory protein GL
NPYNeuropeptide Y
ODSOctadecylsilane
PFAParaformaldehyde
PCPositive control
PGC1αPeroxisome proliferator-activated receptor-γ coactivator 1α
POMCProopiomelanocortin
PPARαPeroxisome proliferator-activated receptor α
PPARγPeroxisome proliferator-activated receptor γ
PRLProlactin
qRT-PCRQuantitative reverse transcriptase PCR
RPS18Ribosomal protein S18
SCD1Stearoyl-CoA desaturase 1
SGLT2Sodium-glucose cotransporter 2
SLC2A2Glucose transporter 2
SLC2A4Glucose transporter 4
SSTSomatostatin
TgTransgenic
TRHThyrotropin-releasing hormone
TSHThyroid stimulating hormone
UCP1Uncoupling protein 1
WATWhite adipose tissue
WTWild-type

References

  1. Stefan, N.; Birkenfeld, A.L.; Schulze, M.B. Global pandemics interconnected—Obesity, impaired metabolic health and COVID-19. Nat. Rev. Endocrinol. 2021, 17, 135–149. [Google Scholar] [CrossRef] [PubMed]
  2. Jung, U.; Choi, M.-S. Obesity and its metabolic complications: The role of adipokines and the relationship between obesity, inflammation, insulin resistance, dyslipidemia and nonalcoholic fatty liver disease. Int. J. Mol. Sci. 2014, 15, 6184–6223. [Google Scholar] [CrossRef] [PubMed] [Green Version]
  3. Simha, V. Management of hypertriglyceridemia. BMJ 2020, 371, m3109. [Google Scholar] [CrossRef] [PubMed]
  4. Seravalle, G.; Grassi, G. Obesity and hypertension. Pharmacol. Res. 2017, 122, 1–7. [Google Scholar] [CrossRef] [PubMed]
  5. Waterson, M.J.; Horvath, T.L. Neuronal regulation of energy homeostasis: Beyond the hypothalamus and feeding. Cell Metab. 2015, 22, 962–970. [Google Scholar] [CrossRef] [PubMed] [Green Version]
  6. Stanley, B.G. Neuropeptide Y in multiple hypothalamic sites controls eating behavior, endocrine, and autonomic systems for body energy balance. In The Biology of Neuropeptide Y and Related Peptides. Contemporary Neuroscience; Colmers, W.F., Wahlestedt, C., Eds.; Humana Press: Totowa, NJ, USA, 1993; pp. 457–509. [Google Scholar] [CrossRef]
  7. Sakurai, T.; Amemiya, A.; Ishii, M.; Matsuzaki, I.; Chemelli, R.M.; Tanaka, H.; Williams, S.C.; Richardson, J.A.; Kozlowski, G.P.; Wilson, S.; et al. Orexins and orexin receptors: A family of hypothalamic neuropeptides and G protein-coupled receptors that regulate feeding behavior. Cell 1998, 92, 573–585. [Google Scholar] [CrossRef] [Green Version]
  8. Crawley, J.N. The role of galanin in feeding behavior. Neuropeptides 1999, 33, 369–375. [Google Scholar] [CrossRef]
  9. Tritos, N.A.; Maratos-Flier, E. Two important systems in energy homeostasis: Melanocortins and melanin-concentrating hormone. Neuropeptides 1999, 33, 339–349. [Google Scholar] [CrossRef]
  10. Yaswen, L.; Diehl, N.; Brennan, M.B.; Hochgeschwender, U. Obesity in the mouse model of pro-opiomelanocortin deficiency responds to peripheral melanocortin. Nat. Med. 1999, 5, 1066–1070. [Google Scholar] [CrossRef]
  11. Arase, K.; Shargill, N.S.; Bray, G.A. Effects of corticotropin releasing factor on genetically obese (fatty) rats. Physiol. Behav. 1989, 45, 565–570. [Google Scholar] [CrossRef]
  12. Kristensen, P.; Judge, M.E.; Thim, L.; Ribel, U.; Christjansen, K.N.; Wulff, B.S.; Clausen, J.T.; Jensen, P.B.; Madsen, O.D.; Vrang, N.; et al. Hypothalamic CART is a new anorectic peptide regulated by leptin. Nature 1998, 393, 72–76. [Google Scholar] [CrossRef] [PubMed]
  13. Harris, R.B.S. Direct and indirect effects of leptin on adipocyte metabolism. Biochim. Biophys. Acta 2014, 1842, 414–423. [Google Scholar] [CrossRef] [PubMed] [Green Version]
  14. Scherer, T.; OHare, J.; Diggs-Andrews, K.; Schweiger, M.; Cheng, B.; Lindtner, C.; Zielinski, E.; Vempati, P.; Su, K.; Dighe, S.; et al. Brain insulin controls adipose tissue lipolysis and lipogenesis. Cell Metab. 2011, 13, 183–194. [Google Scholar] [CrossRef] [PubMed] [Green Version]
  15. Kokkotou, E.; Jeon, J.Y.; Wang, X.; Marino, F.E.; Carlson, M.; Trombly, D.J.; Maratos-Flier, E. Mice with MCH ablation resist diet-induced obesity through strain-specific mechanisms. Am. J. Physiol. Regul. Integr. Comp. Physiol. 2005, 289, R117–R124. [Google Scholar] [CrossRef]
  16. Hui, S.T.; Kurt, Z.; Tuominen, I.; Norheim, F.; Davis, R.C.; Pan, C.; Dirks, D.L.; Magyar, C.E.; French, S.W.; Chella Krishnan, K.; et al. The genetic architecture of diet-induced hepatic fibrosis in mice. Hepatology 2018, 68, 2182–2196. [Google Scholar] [CrossRef] [PubMed]
  17. Nehrenberg, D.L.; Hua, K.; Estrada-Smith, D.; Garland, T.; Pomp, D. Voluntary exercise and its effects on body composition depend on genetic selection history. Obesity 2009, 17, 1402–1409. [Google Scholar] [CrossRef] [PubMed]
  18. Draisma, H.H.M.; Pool, R.; Kobl, M.; Jansen, R.; Petersen, A.K.; Vaarhorst, A.A.M.; Yet, I.; Haller, T.; Demirkan, A.; Esko, T.; et al. Genome-wide association study identifies novel genetic variants contributing to variation in blood metabolite levels. Nat. Commun. 2015, 6, 7208. [Google Scholar] [CrossRef] [PubMed] [Green Version]
  19. Ukena, K.; Iwakoshi-Ukena, E.; Taniuchi, S.; Bessho, Y.; Maejima, S.; Masuda, K.; Shikano, K.; Kondo, K.; Furumitsu, M.; Tachibana, T. Identification of a cDNA encoding a novel small secretory protein, neurosecretory protein GL, in the chicken hypothalamic infundibulum. Biochem. Biophys. Res. Commun. 2014, 446, 298–303. [Google Scholar] [CrossRef] [PubMed]
  20. Matsuura, D.; Shikano, K.; Saito, T.; Iwakoshi-Ukena, E.; Furumitsu, M.; Ochi, Y.; Sato, M.; Bentley, G.E.; Kriegsfeld, L.J.; Ukena, K. Neurosecretory protein GL, a hypothalamic small secretory protein, participates in energy homeostasis in male mice. Endocrinology 2017, 158, 1120–1129. [Google Scholar] [CrossRef]
  21. Iwakoshi-Ukena, E.; Shikano, K.; Kondo, K.; Taniuchi, S.; Furumitsu, M.; Ochi, Y.; Sasaki, T.; Okamoto, S.; Bentley, G.E.; Kriegsfeld, L.J.; et al. Neurosecretory protein GL stimulates food intake, de novo lipogenesis, and onset of obesity. eLife 2017, 6, e28527. [Google Scholar] [CrossRef] [PubMed] [Green Version]
  22. Ukena, K. Avian and murine neurosecretory protein GL participates in the regulation of feeding and energy metabolism. Gen. Comp. Endocrinol. 2018, 260, 164–170. [Google Scholar] [CrossRef] [PubMed]
  23. Shikano, K.; Iwakoshi-Ukena, E.; Kato, M.; Furumitsu, M.; Bentley, G.E.; Kriegsfeld, L.J.; Ukena, K. Neurosecretory protein GL induces fat accumulation in chicks. Front. Endocrinol. 2019, 10, 392. [Google Scholar] [CrossRef]
  24. Narimatsu, Y.; Iwakoshi-Ukena, E.; Fukumura, K.; Shikano, K.; Furumitsu, M.; Morishita, M.; Bentley, G.E.; Kriegsfeld, L.J.; Ukena, K. Hypothalamic overexpression of neurosecretory protein GL leads to obesity in male C57BL/6J mice. Neuroendocrinology 2022, 112, 606–620. [Google Scholar] [CrossRef] [PubMed]
  25. Al-Shawi, R.; Kinnaird, J.; Burke, J.; Bishop, J.O. Expression of a foreign gene in a line of transgenic mice is modulated by a chromosomal position effect. Mol. Cell. Biol. 1990, 10, 1192–1198. [Google Scholar] [CrossRef] [PubMed]
  26. Bestor, T.H. Gene silencing as a threat to the success of gene therapy. J. Clin. Investig. 2000, 105, 409–411. [Google Scholar] [CrossRef] [PubMed] [Green Version]
  27. Brooks, A.R.; Harkins, R.N.; Wang, P.; Qian, H.S.; Liu, P.; Rubanyi, G.M. Transcriptional silencing is associated with extensive methylation of the CMV promoter following adenoviral gene delivery to muscle. J. Gene Med. 2004, 6, 395–404. [Google Scholar] [CrossRef] [PubMed]
  28. Hsu, C.C.; Li, H.P.; Hung, Y.H.; Leu, Y.W.; Wu, W.H.; Wang, F.S.; Lee, K.D.; Chang, P.J.; Wu, C.S.; Lu, Y.J.; et al. Targeted methylation of CMV and E1A viral promoters. Biochem. Biophys. Res. Commun. 2010, 402, 228–234. [Google Scholar] [CrossRef] [PubMed]
  29. Kim, M.; O’Callaghan, P.M.; Droms, K.A.; James, D.C. A mechanistic understanding of production instability in CHO cell lines expressing recombinant monoclonal antibodies. Biotechnol. Bioeng. 2011, 108, 2434–2446. [Google Scholar] [CrossRef]
  30. Osterlehner, A.; Simmeth, S.; Göpfert, U. Promoter methylation and transgene copy numbers predict unstable protein production in recombinant chinese hamster ovary cell lines. Biotechnol. Bioeng. 2011, 108, 2670–2681. [Google Scholar] [CrossRef] [PubMed]
  31. Yang, Y.; Mariati; Chusainow, J.; Yap, M.G.S. DNA methylation contributes to loss in productivity of monoclonal antibody-producing CHO cell lines. J. Biotechnol. 2010, 147, 180–185. [Google Scholar] [CrossRef] [PubMed]
  32. Shimizu, I.; Aprahamian, T.; Kikuchi, R.; Shimizu, A.; Papanicolaou, K.N.; MacLauchlan, S.; Maruyama, S.; Walsh, K. Vascular rarefaction mediates whitening of brown fat in obesity. J. Clin. Investig. 2014, 124, 2099–2112. [Google Scholar] [CrossRef] [PubMed] [Green Version]
  33. Eissing, L.; Scherer, T.; Tödter, K.; Knippschild, U.; Greve, J.W.; Buurman, W.A.; Pinnschmidt, H.O.; Rensen, S.S.; Wolf, A.M.; Bartelt, A.; et al. De novo lipogenesis in human fat and liver is linked to ChREBP-β and metabolic health. Nat. Commun. 2013, 4, 1528. [Google Scholar] [CrossRef] [PubMed] [Green Version]
  34. Park, S.H.; Ko, S.K.; Chung, S.H. Euonymus alatus prevents the hyperglycemia and hyperlipidemia induced by high-fat diet in ICR mice. J. Ethnopharmacol. 2005, 102, 326–335. [Google Scholar] [CrossRef] [PubMed]
  35. Park, S.H.; Ko, S.K.; Choi, J.G.; Chung, S.H. Salicornia herbacea prevents high fat diet-induced hyperglycemia and hyperlipidemia in ICR mice. Arch. Pharm. Res. 2006, 29, 256–264. [Google Scholar] [CrossRef] [PubMed]
  36. Zhuhua, Z.; Zhiquan, W.; Zhen, Y.; Yixin, N.; WeiWei, Z.; XiaoYong, L.; Yueming, L.; Hongmei, Z.; Li, Q.; Qing, S. A novel mice model of metabolic syndrome: The high-fat-high-fructose diet-fed ICR mice. Exp. Anim. 2015, 64, 435–442. [Google Scholar] [CrossRef] [PubMed] [Green Version]
  37. Nakahara, K.; Bannai, M.; Maruyama, K.; Suzuki, Y.; Okame, R.; Murakami, N. Characterization of a novel genetically obese mouse model demonstrating early onset hyperphagia and hyperleptinemia. Am. J. Physiol. Endocrinol. Metab. 2013, 305, E451–E463. [Google Scholar] [CrossRef] [PubMed] [Green Version]
  38. Shimizu, R.; Sakazaki, F.; Okuno, T.; Nakamuro, K.; Ueno, H. Difference in glucose intolerance between C57BL/6J and ICR strain mice with streptozotocin/nicotinamide-induced diabetes. Biomed. Res. 2012, 33, 63–66. [Google Scholar] [CrossRef] [Green Version]
  39. Shikano, K.; Iwakoshi-Ukena, E.; Saito, T.; Narimatsu, Y.; Kadota, A.; Furumitsu, M.; Bentley, G.E.; Kriegsfeld, L.J.; Ukena, K. Neurosecretory protein GL induces fat accumulation in mice. J. Endocrinol. 2020, 244, 1–12. [Google Scholar] [CrossRef] [PubMed]
  40. Stanley, B.G.; Leibowitz, S.F. Neuropeptide Y injected in the paraventricular hypothalamus: A powerful stimulant of feeding behavior. Proc. Natl. Acad. Sci. USA 1985, 82, 3940–3943. [Google Scholar] [CrossRef] [PubMed] [Green Version]
  41. Erickson, C.; Clegg, K.E.; Palmiter, R.D. Sensitivity to leptin and susceptibility to seizures of mice lacking neuropeptide Y. Nature 1996, 381, 415–421. [Google Scholar] [CrossRef] [PubMed]
  42. Thorsell, A.; Heilig, M. Diverse functions of neuropeptide Y revealed using genetically modified animals. Neuropeptides 2002, 36, 182–193. [Google Scholar] [CrossRef]
  43. Qian, S.; Chen, H.; Weingarth, D.; Trumbauer, M.E.; Novi, D.E.; Guan, X.; Yu, H.; Shen, Z.; Feng, Y.; Frazier, E.; et al. Neither agouti-related protein nor neuropeptide Y is critically required for the regulation of energy homeostasis in mice. Mol. Cell. Biol. 2002, 22, 5027. [Google Scholar] [CrossRef] [PubMed] [Green Version]
  44. Krashes, M.J.; Koda, S.; Ye, C.; Rogan, S.C.; Adams, A.C.; Cusher, D.S.; Maratos-Flier, E.; Roth, B.L.; Lowell, B.B. Rapid, reversible activation of AgRP neurons drives feeding behavior in mice. J. Clin. Investig. 2011, 121, 1424–1428. [Google Scholar] [CrossRef] [Green Version]
  45. Zhan, C.; Zhou, J.; Feng, Q.; Zhang, J.; Lin, S.; Bao, J.; Wu, P.; Luo, M. Acute and long-term suppression of feeding behavior by POMC neurons in the brainstem and hypothalamus, respectively. J. Neurosci. 2013, 33, 3624–3632. [Google Scholar] [CrossRef] [PubMed]
  46. Okamoto, S.; Sato, T.; Tateyama, M.; Kageyama, H.; Maejima, Y.; Nakata, M.; Hirako, S.; Matsuo, T.; Kyaw, S.; Shiuchi, T.; et al. Activation of AMPK-regulated CRH neurons in the PVH is sufficient and necessary to Induce dietary preference for carbohydrate over fat. Cell Rep. 2018, 22, 706–721. [Google Scholar] [CrossRef] [PubMed] [Green Version]
  47. Takahashi, T.M.; Sunagawa, G.A.; Soya, S.; Abe, M.; Sakurai, K.; Ishikawa, K.; Yanagisawa, M.; Hama, H.; Hasegawa, E.; Miyawaki, A.; et al. A discrete neuronal circuit induces a hibernation-like state in rodents. Nature 2020, 583, 109–114. [Google Scholar] [CrossRef]
  48. Iizuka, K.; Takeda, J.; Horikawa, Y. Glucose induces FGF21 mRNA expression through ChREBP activation in rat hepatocytes. FEBS Lett. 2009, 583, 2882–2886. [Google Scholar] [CrossRef] [PubMed] [Green Version]
  49. Inagaki, T.; Dutchak, P.; Zhao, G.; Ding, X.; Gautron, L.; Parameswara, V.; Li, Y.; Goetz, R.; Mohammadi, M.; Esser, V.; et al. Endocrine regulation of the fasting response by PPARα-mediated induction of fibroblast growth factor 21. Cell Metab. 2007, 5, 415–425. [Google Scholar] [CrossRef] [Green Version]
  50. Liu, Y.; Zhao, C.; Xiao, J.; Liu, L.; Zhang, M.; Wang, C.; Wu, G.; Zheng, M.H.; Xu, L.M.; Chen, Y.P.; et al. Fibroblast growth factor 21 deficiency exacerbates chronic alcohol-induced hepatic steatosis and injury. Sci. Rep. 2016, 6, 31026. [Google Scholar] [CrossRef] [PubMed] [Green Version]
  51. Komiya, C.; Tsuchiya, K.; Shiba, K.; Miyachi, Y.; Furuke, S.; Shimazu, N.; Yamaguchi, S.; Kanno, K.; Ogawa, Y. Ipragliflozin improves hepatic steatosis in obese mice and liver dysfunction in type 2 diabetic patients irrespective of body weight reduction. PLoS ONE 2016, 11, e0151511. [Google Scholar] [CrossRef] [PubMed] [Green Version]
  52. Loos, R.J.F.; Yeo, G.S.H. The genetics of obesity: From discovery to biology. Nat. Rev. Genet. 2021, 23, 120–133. [Google Scholar] [CrossRef] [PubMed]
  53. Livak, K.J.; Schmittgen, T.D. Analysis of relative gene expression data using real-time quantitative PCR and the 2−ΔΔCT method. Methods 2001, 25, 402–408. [Google Scholar] [CrossRef] [PubMed]
Figure 1. Generation of Npgl Tg mice and line selection using phenotypic analysis. (A) Structure of the 3.8 kb transgene integrated into the genomic DNA of Npgl Tg mice. Npgl is under the control of the ubiquitous CMV promoter. IRES enables co-expression of Gfp with Npgl. The β-globin intron was inserted between the CMV promoter and Npgl. (B) Genomic DNA analysis (top) and quantification of integrated Gfp using qRT-PCR (bottom). Genomic DNA analysis revealed that the transgene was integrated into seven F0 mice. The numbers of transgenic mice were 7, 13, 17, 19, 22, 27, and 56. Gja5 was used as an internal standard. ntc indicates no-template control. qRT-PCR showed that the transgene was most integrated into mouse number 13. (C) qRT-PCR analysis of NPGL precursor mRNA expression in the mediobasal hypothalamus of the WT and Npgl Tg mice. (D) Western blot analysis of mature NPGL in the mediobasal hypothalamus of the WT and Npgl Tg mice. Synthesized NPGL was used as the positive control (PC). (E) qRT-PCR analysis of NPGL precursor mRNA concentrations in different brain regions and intestines of Npgl Tg mice and in the MBH of WT mice. The NPGL precursor mRNA levels were quantified relative to the level of Actb mRNA. Each value represents the mean ± SEM (n = 2). Npgl, neurosecretory protein GL; CMV, cytomegalovirus; IRES, internal ribosome entry sites; Gfp, green fluorescent protein; Gja5, gap junction alpha 5; WT, wild-type; Tg, transgenic; MBH, mediobasal hypothalamus; Actb, β-actin.
Ijms 23 06488 g001
Figure 2. Phenotypic analysis of body mass, food intake, and peripheral tissues of the 13-line of Npgl Tg mice. (A) Weekly body mass changes (left) and body mass (right) at 26 weeks of age of WT and Npgl Tg mice. (B) Weekly food intake (left) and cumulative food intake (right) from 15 to 26 weeks of age. (C) The masses of the testis, liver, kidney, and heart. (D) The masses of the gastrocnemius and soleus muscles. (E) The length of the femur as an index of body length. Statistical analyses were performed using two-way repeated measures ANOVA followed by Bonferroni’s test (left of (A,B)) or Mann–Whitney U test (right of (A,B), and (CE)). Each value represents the mean ± SEM (n = 5–8). Asterisks indicate statistically significant differences (* p < 0.05). Npgl, neurosecretory protein GL; WT, wild-type; Tg, transgenic.
Ijms 23 06488 g002aIjms 23 06488 g002b
Figure 3. Phenotypic analysis of adipose tissues of the 13-line of Npgl Tg mice. (A) The masses of inguinal, epididymal, retroperitoneal, and perirenal WAT. (B) Representative photographs of inguinal and epididymal WAT. (C) The mass of interscapular BAT. (D) Representative photographs of interscapular BAT. Scale bars = 1 cm. All statistical analyses were performed using Mann–Whitney U test. Each value represents the mean ± SEM (n = 5–8). Asterisks indicate statistically significant differences (* p < 0.05, ** p < 0.01). Npgl, neurosecretory protein GL; WT, wild-type; Tg, transgenic; WAT, white adipose tissue; BAT, brown adipose tissue.
Ijms 23 06488 g003aIjms 23 06488 g003b
Figure 4. Morphological and mRNA expression analyses of adipose tissues of Npgl Tg mice. (A,B) Hematoxylin-eosin staining of epididymal WAT (A) and interscapular BAT (B) sections. Scale bars = 100 μm. (C,D) The mRNA expression levels of lipid metabolism-related genes in inguinal WAT (C) and interscapular BAT (D). All statistical analyses were performed using Mann–Whitney U test. Each value represents the mean ± SEM (n = 5–8). Asterisks indicate statistically significant differences (* p < 0.05). Npgl, neurosecretory protein GL; WT, wild-type; Tg, transgenic; WAT, white adipose tissue; BAT, brown adipose tissue.
Ijms 23 06488 g004
Figure 5. Morphological and mRNA expression analyses of the liver of Npgl Tg mice. (A) Oil red O staining of the liver sections. Red dots show lipid droplets. Scale bars = 100 μm. (B) The expression levels of mRNA for lipid metabolism-related genes in the liver. All statistical analyses were performed using Mann-Whitney U test. Each value represents the mean ± SEM (n = 5–8). Asterisks indicate statistically significant differences (* p < 0.05). Npgl, neurosecretory protein GL; WT, wild-type; Tg, transgenic.
Ijms 23 06488 g005
Table 1. Serum biochemical parameters. All statistical analyses were performed using Mann-Whitney U test. Each value represents the mean ± SEM (n = 5–7). Asterisk indicates a statistically significant difference (* p < 0.05).
WTTg
Leptin (ng/mL)0.676 ± 0.1341.96 ± 0.438 *
Insulin (ng/mL)1.06 ± 0.2700.973 ± 0.149
Cholesterol (mg/dL)123 ± 7.19113 ± 4.64
Triglycerides (mg/dL)162 ± 12.27139 ± 16.0
Free fatty acids (mEq/L)1.70 ± 0.2561.84 ± 0.182
Glucose (mg/dL)129 ± 6.11136 ± 7.88
Table 2. Sequences of oligonucleotide primers for qRT-PCR.
GeneSense Primer (5′ to 3′)Antisense Primer (5′ to 3′)
GfpACCACTACCTGAGCACCCAGTCGTCCATGCCGAGAGTGATCC
Gja5ACCATGGAGGTGGCCTTCACATGCAGGGTATCCAGGAAGA
NpglGGAACCATGGCTTAGGAAGGTCTAAGGAGCTGAGAATATGCA
AccTCCGCACTGACTGTAACCACATTGCTCCGCACAGATTCTTCA
FasAGGGGTCGACCTGGTCCTCAGCCATGCCCAGAGGGTGGTT
Scd1CTGTACGGGATCATACTGGTTCGCCGTGCCTTGTAAGTTCTG
ChrebpαCGACACTCACCCACCTCTTCTTGTTCAGCCGGATCTTGTC
ChrebpβTCTGCAGATCGCGTGGAGCTTGTCCCGGCATAGCAAC
Cpt1aCCTGGGCATGATTGCAAAGGGACGCCACTCACGATGTT
AtglAACACCAGCATCCAGTTCAAGGTTCAGTAGGCCATTCCTC
HslGCTGGGCTGTCAAGCACTGTGTAACTGGGTAGGCTGCCAT
GapdhAAGGTCATCCCAGAGCTGAACTGCTTCACCACCTTCTTGA
Slc2a4GTAACTTCATTGTCGGCATGGAGCTGAGATCTGGTCAAACG
Cd36TCCTCTGACATTTGCAGGTCTATCAAAGGCATTGGCTGGAAGAA
PparγGCCCTTTGGTGACTTTATGGAGCAGCAGGTTGTCTTGGATG
Fgf21CCTCTAGGTTTCTTTGCCAACAGAAGCTGCAGGCCTCAGGAT
Slc2a2GGCTAATTTCAGGACTGGTTTTTCTTTGCCCTGACTTCCT
PparαTCGAATATGTGGGGACAAGGGACAGGCACTTGTGAAAACG
NpyTATCTCTGCTCGTGTGTTTGGATTGATGTAGTGTCGCAGA
AgrpTGTTCCCAGAGTTCCCAGGTCGCATTGAAGAAGCGGCAGTAGCAC
PomcAGCTGCCTTTCCGCGACAATCTATGGAGGTCTGAAGCA
GhrhTGCCATCTTCACCACCAACTCATCTGCTTGTCCTCTGTCC
SstGAGGACCTGCGACTAGACTGACCAGCAGCTCTGCCAAGAAGTA
TrhTCGTGCTAACTGGTATCCCCCCCAAATCTCCCCTCTCTTC
TshCACCATCTGTGCTGGGTATTGCATCCTGGTATTTCCACCGTTC
LhTGGCCGCAGAGAATGAGTTCACTCGGACCATGCTAGGACA
FshGGAGAGCAATCTGCTGCCATGCCGAGCTGGGTCCTTATAC
PrlGGCTACACCTGAAGACAAGGAACAATGTTCCTCAATCTCTTTGGCTCTTG
GhGGAGGCTAGTGCTTTTCCCGAGGCACGCTCGAACTCTTTG
Ucp1CAAAAACAGAAGGATTGCCGAAATCTTGGACTGAGTCGTAGAGG
Dio2CCACCTTCTTGACTTTGCCAGGTGAGCCTCATCAATGTATAC
Pgc1αGCAACATGCTCAAGCCAAACTGCAGTTCCAGAGAGTTCCA
ActbGGCACCACACCTTATACAATAGGTCTCAAACATGATCTGG
Rps18CCTGAGAAGTTCCAGCACATTTCTCCAGCCCTCTTGGTG
Publisher’s Note: MDPI stays neutral with regard to jurisdictional claims in published maps and institutional affiliations.

