Article

Morphological Characterization and Integrated Transcriptome and Proteome Analysis of Organ Development Defective 1 (odd1) Mutant in Cucumis sativus L.

State Key Laboratory of Crop Biology, Shandong Collaborative Innovation Center of Fruit & Vegetable Quality and Efficient Production, Key Laboratory of Biology and Genetic Improvement of Horticultural Crops in Huang-Huai Region, Ministry of Agriculture, College of Horticultural Science and Engineering, Shandong Agricultural University, Tai’an 271018, China
*
Authors to whom correspondence should be addressed.
Int. J. Mol. Sci. 2022, 23(10), 5843; https://doi.org/10.3390/ijms23105843
Submission received: 21 April 2022 / Revised: 9 May 2022 / Accepted: 17 May 2022 / Published: 23 May 2022
(This article belongs to the Section Molecular Plant Sciences)

Abstract

:
Cucumber (Cucumis sativus L.) is an economically important vegetable crop with the unique growth habit and typical trailing shoot architecture of Cucurbitaceae. Elucidating the regulatory mechanisms of growth and development is significant for improving quality and productivity in cucumber. Here we isolated a spontaneous cucumber mutant organ development defective 1 (odd1) with multiple morphological changes including root, plant stature, stem, leaf, male and female flowers, as well as fruit. Anatomical and cytological analyses demonstrated that both cell size and number decreased, and the shoot apical meristem (SAM) was smaller in odd1 compared with WT. Pollen vigor and germination assays and cross tests revealed that odd1 is female sterile, which may be caused by the absence of ovules. Genetic analysis showed that odd1 is a recessive single gene mutant. Using the MutMap strategy, the odd1 gene was found to be located on chromosome 5. Integrated profiling of transcriptome and proteome indicated that the different expression genes related to hormones and SAM maintenance might be the reason for the phenotypic changes of odd1. These results expanded the insight into the molecular regulation of organ growth and development and provided a comprehensive reference map for further studies in cucumber.

1. Introduction

Cucumber (Cucumis sativus L.) is an economically important vegetable crop worldwide, which has the unique growth habit and shoot architecture of Cucurbitaceae [1,2,3,4]. The vegetative and reproductive growth of cucumber proceed simultaneously after a very short juvenile stage [5,6,7]. Leaves are derived from the periphery of the shoot apical meristem (SAM). Then unisexual (male or female) flowers and tendrils occur in the leaf axils [8]. Finally, a typical vining cucumber plant formed. The generation of cucumber architecture requires a fine and coordinated process [3]. The ability to regulate shoot architecture is very useful to improve planting density and productivity and cultivation efficiency in cucumber breeding. However, the understanding of the mechanisms controlling shoot architecture in cucumber is still limited. Therefore, elucidating the regulatory molecular mechanisms of cucumber growth and development is necessary.
Developmental mutants have played important roles in the study of cucumber growth and development. Several types of developmental mutants have been described in cucumber. They are mainly divided into dwarf mutants, leaf color and leaf shape mutants, flower organ development mutants, and fruit development mutants, for example, dwarf or compact mutants with reduced vine length including compact (cp) [9], compact-2 (cp-2) [10], and super compact (scp) [11]. As the candidate gene of super compact-1 (scp-1), CsCYP85A1 encoding the brassinosteroid (BR)-6-oxidase in the BR biosynthesis pathway has been reported as the first cloned gene for plant height in cucurbit crops through map-based cloning [11]. Furthermore, CsDET2 was cloned as the candidate gene for a BR biosynthesis-deficient dwarf mutant super compact-2 (scp-2) [12]. Mutants with abnormal leaf morphology include round leaf (rl-1) mutant [13], little leaf (ll) mutant [14], and mango fruit (mf) mutant [15]. Through the genetic analysis of the mf rl double mutant, CsWOX1 regulates leaf vein patterning by CsPID-mediated auxin transport. Moreover, CsWOX1 regulates leaf development by interacting with CIN (CINCINNATA)-TCP (TEOSINTE BRANCHED1/CYCLOIDEA/PCF) proteins [15]. Using map-based cloning, the determinate growth habit gene CsTFL1 was isolated. CsTFL1 inhibits determinate growth and terminal flower formation by interacting with CsNOT2a [16]. The short fruit 1 (sf1) mutant bears short fruits owing to repressed cell division. The SF1 gene encodes a cucurbit-specific RING-type E3 ligase, which ubiquitinates and degrades both itself and ACS2 (1-aminocyclopropane-1-carboxylate synthase 2) to control ethylene synthesis for a dose-dependent effect on cell division and fruit elongation in cucumber [17]. Moreover, many natural (or artificial) mutants were also used to analyze organ or tissue development in cucumber [18,19,20,21]. In addition, some of the genes related to growth and development were identified by means of reverse genetics in cucumber. There have been about 25 genes reported as being involved in shoot architecture of cucumber, including determinate growth habit (CsTFL1 and CsLFY), leaf morphology (CsPID, CsWOX1, CsIVP, CsYAB5, CsPHB, CsSAP, CsSL1, and CsHAN1), lateral branching (CLS, CsBRC1, and CsPIN3), tendril formation (CsTEN, CsACO1, CsGCN5, and CsPID), and vine length (CsSH1, CsGPA1, CsCLV1, CsCKX, CsCullin1, CsCYP85A1, CsDET2, CsVFB1, CsIVP, and CsYAB5) [3]. Although a large number of developmental mutants has been reported and some candidate genes related to plant development cloned, the molecular mechanisms underlying plant growth and development in cucumber remains unclear.
Genes underlying growth and development in a number of plant species have been cloned and functionally characterized. In Arabidopsis, the CLAVATA (CLV)-WUSCHEL (WUS) negative feedback loop is a major genetic mechanism to maintain meristem homeostasis [22]. WUS is essential for meristem function because the stem cells are mis-specified and appear to undergo differentiation in the Arabidopsis wus mutant [23]. Mutations in the CLV genes, such as CLV1, 2, and 3, cause the enlargement of the meristem [24]. WUS is expressed in the organizing center (OC) cells, and the WUS protein moves from the OC to the central zone (CZ) and promotes CLV3 expression. CLV3 in turn moves to the OC cells to restrict the transcription of WUS [25]. The negative feedback regulation between WUS and CLV3 affects the activity of the stem cell microenvironment and determines the generation of the organizing center and stem cells [26,27,28,29]. Moreover, the expression of WUS and CLV3 is activated by cytokinin (CK), whereas it is repressed by auxin [30]. WUS is one of the WUSCHEL RELATED HOMEOBOX (WOX) proteins, which belong to the plant HB (homeobox transcription factors) family, Knotted Related Homeobox (KNOX), and play positive roles in key developmental processes in plants, such as embryonic patterning, stem-cell maintenance, and organ formation by promoting cell division activity and preventing premature cell differentiation [31]. For example, WOX4, a member of the WOX gene family, acts as a positive factor in shoot meristem maintenance and is repressed by FCP1 in rice [32]. Plant hormones including auxin, gibberellin (GA), ethylene (ETH), brassinosteroid (BR), and CK play very important roles in regulating cell elongation and division. GAs, BRs, and auxin can induce cell expansion [24]. In rice, the dwarf mutant sd1 shows higher stature when activating GA signaling [33]. In rice and Arabidopsis, BR mutants display dwarfing phenotypes, showing that BRs determine stem elongation in monocotyledonous and dicotyledonous plants [34,35]. Many cytochrome P450 (CYP) genes are involved in BR biosynthesis [11]. In addition, many transcription factors (TFs) such as basic helix–loop–helix (bHLH), auxin response factors (ARF), ethylene response factor subfamily of AP2 (AP2/ERF), C2H2, and GRAS are important regulators of plant growth and development [36,37]. For instance, a number of bHLH transcription factors is involved in the regulation of cell elongation in response to BRs, GA, temperature, light, and developmental stages [36,37]. AINTEGUMENTA (ANT) encodes AP2/ERF family proteins, which can regulate integument cell division by prolonging cell proliferation time to control flower development-related cell division and organ size [20]. JAGGED (JAG) encodes a transcription factor protein with a C2H2 zinc finger domain. Partial loss of JAG function inhibits the development of lateral organs [38,39,40].
High-throughput profiling of transcripts or proteins is an efficient method to explore changes in complex biological processes [41]. For instance, a new model for light-induced anthocyanin biosynthesis was constructed through combined transcriptomic and proteomic analysis in eggplant (Solanum melongena L.) [42]. In petunias, RNA-seq and tandem mass tag (TMT) labeling proteomics were used to analyze the effect of ethylene on flower senescence, which offered an important resource for the functional analysis of Kub and facilitated the elucidation of the senescence process [43]. Transcriptome analysis was performed to reveal that the modification of cell wall biosynthesis, phytohormone biosynthesis, and signal transduction contributes to the dwarfing and narrow-leaf phenotype of the dnl2 (new dwarf and narrow-leaf) mutant in maize [44].
In this study, we identified a spontaneous cucumber mutant that affects plant architecture including root, plant stature, stem diameter, internode, cotyledon, true leaf, male and female flowers, as well as fruit. Therefore, we named this mutant organ development defective 1 (odd1). Through a series of physiological and morphological indices, it was found that the cell size and cell number of the cotyledon in odd1 are significantly smaller than those in wild type (WT), and similar differences are observed in functional leaf and petal. The SAM became smaller, and the parthenocarpy characteristics disappeared in the odd1 mutant. Genetic analysis demonstrated that the phenotype of the odd1 mutant is controlled by a single recessive nuclear gene. Therefore, odd1 is valuable material for studying the regulatory mechanisms of growth and development in cucumber, even in Cucurbitaceae. Through bulk segregation analysis, odd1 was located on chromosome 5. Furthermore, integrated profiling of the transcriptome and proteome indicated that many genes and proteins related to growth and development showed significantly different expression in odd1. Furthermore, one model of plant hormone signaling pathways and one model of shoot apical meristem maintenance differentiation in odd1 were presented. These results not only expanded and deepened the insights into the molecular regulation of organ growth and development in cucumber, but also provided a foundation for cloning and further functional analysis of ODD1.

2. Results

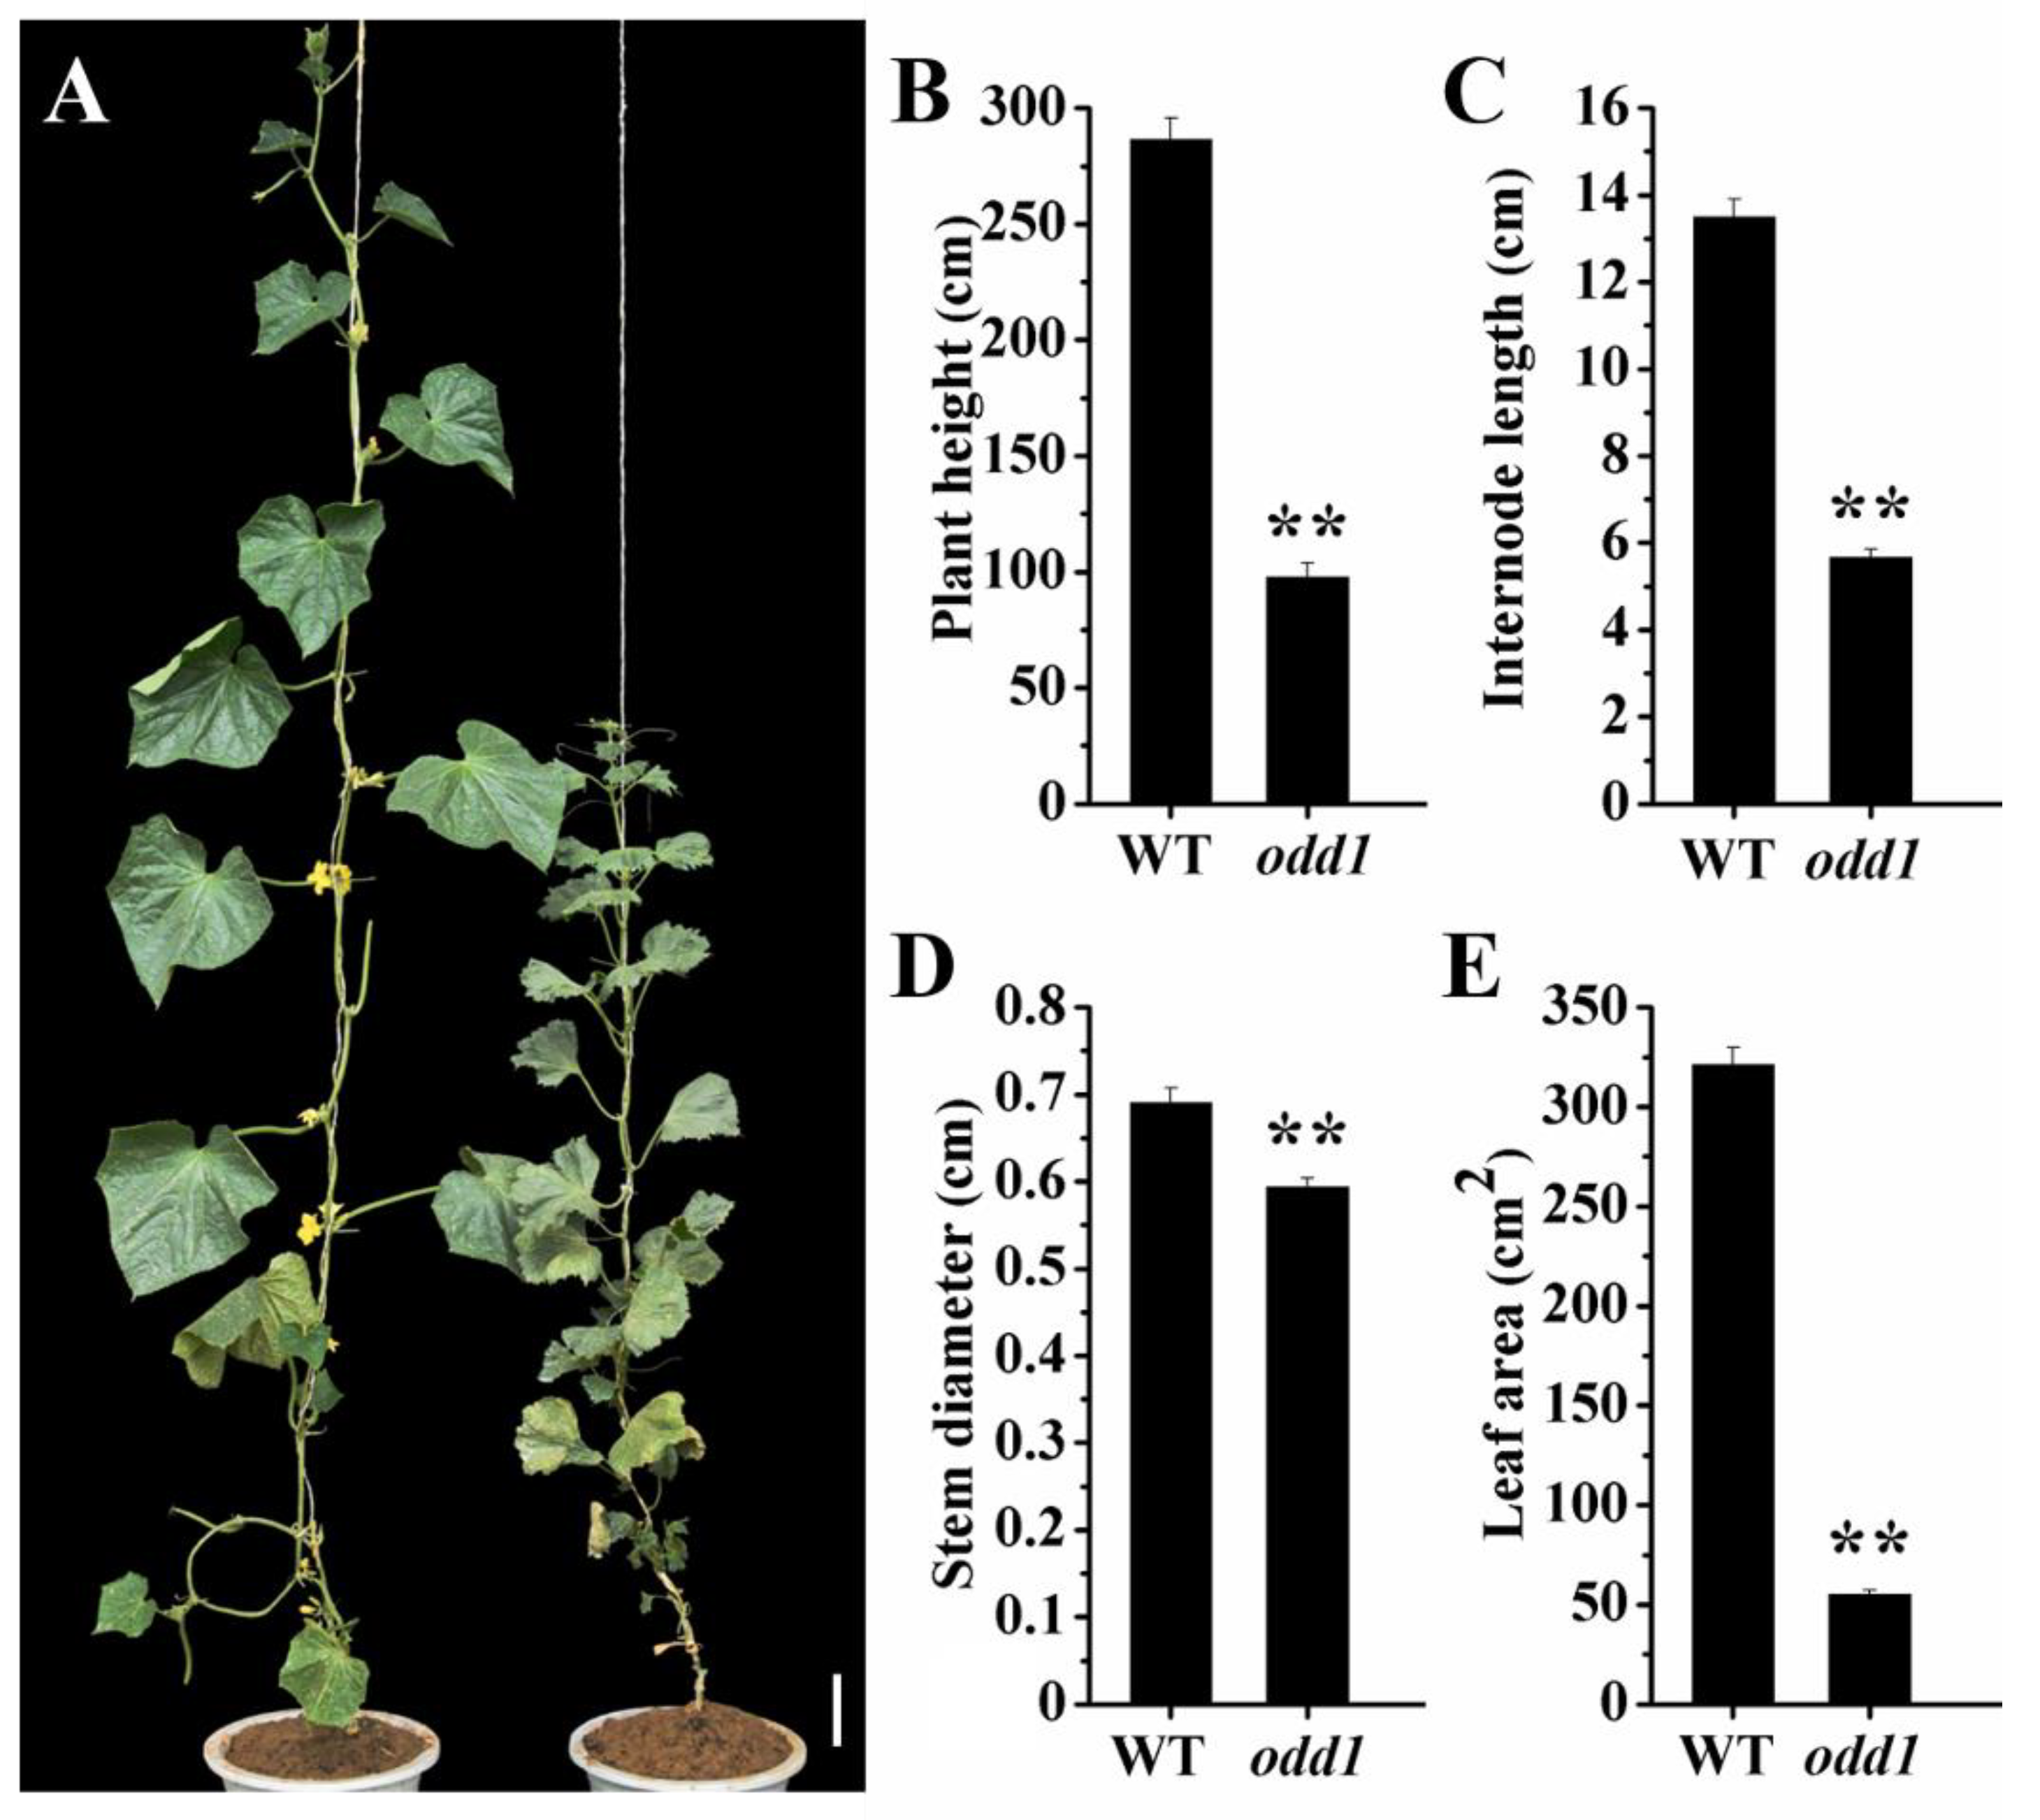
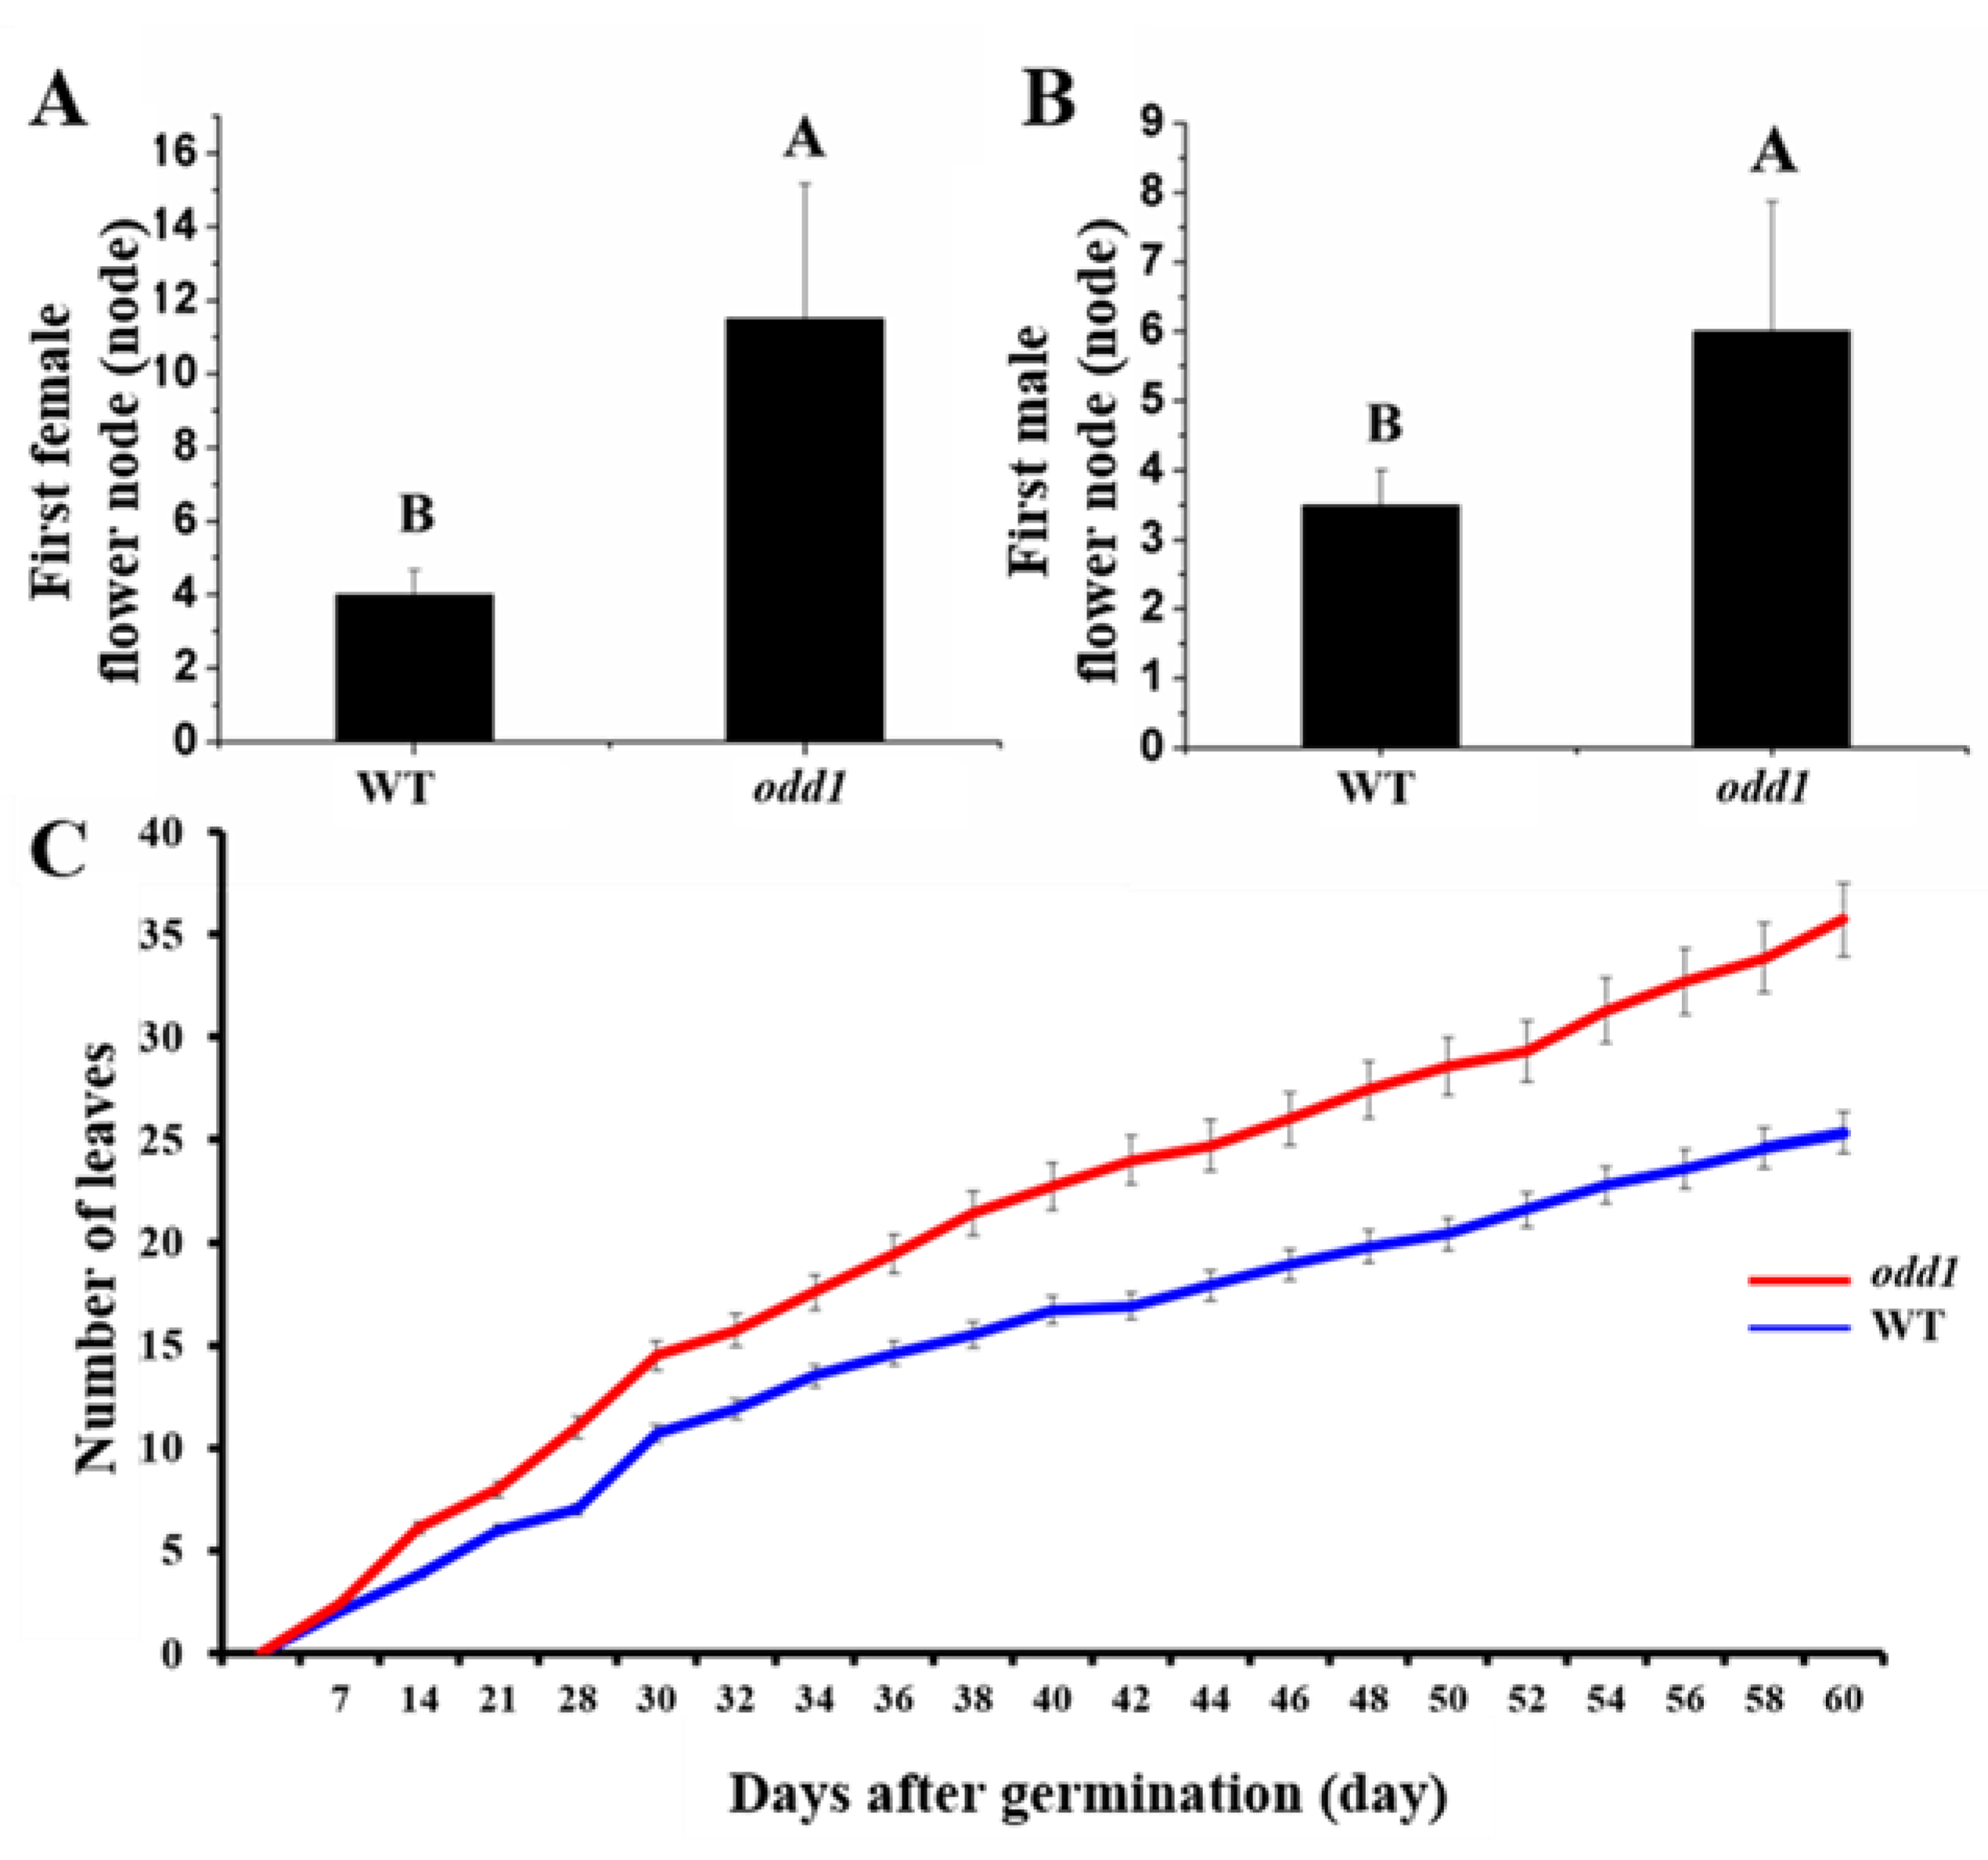
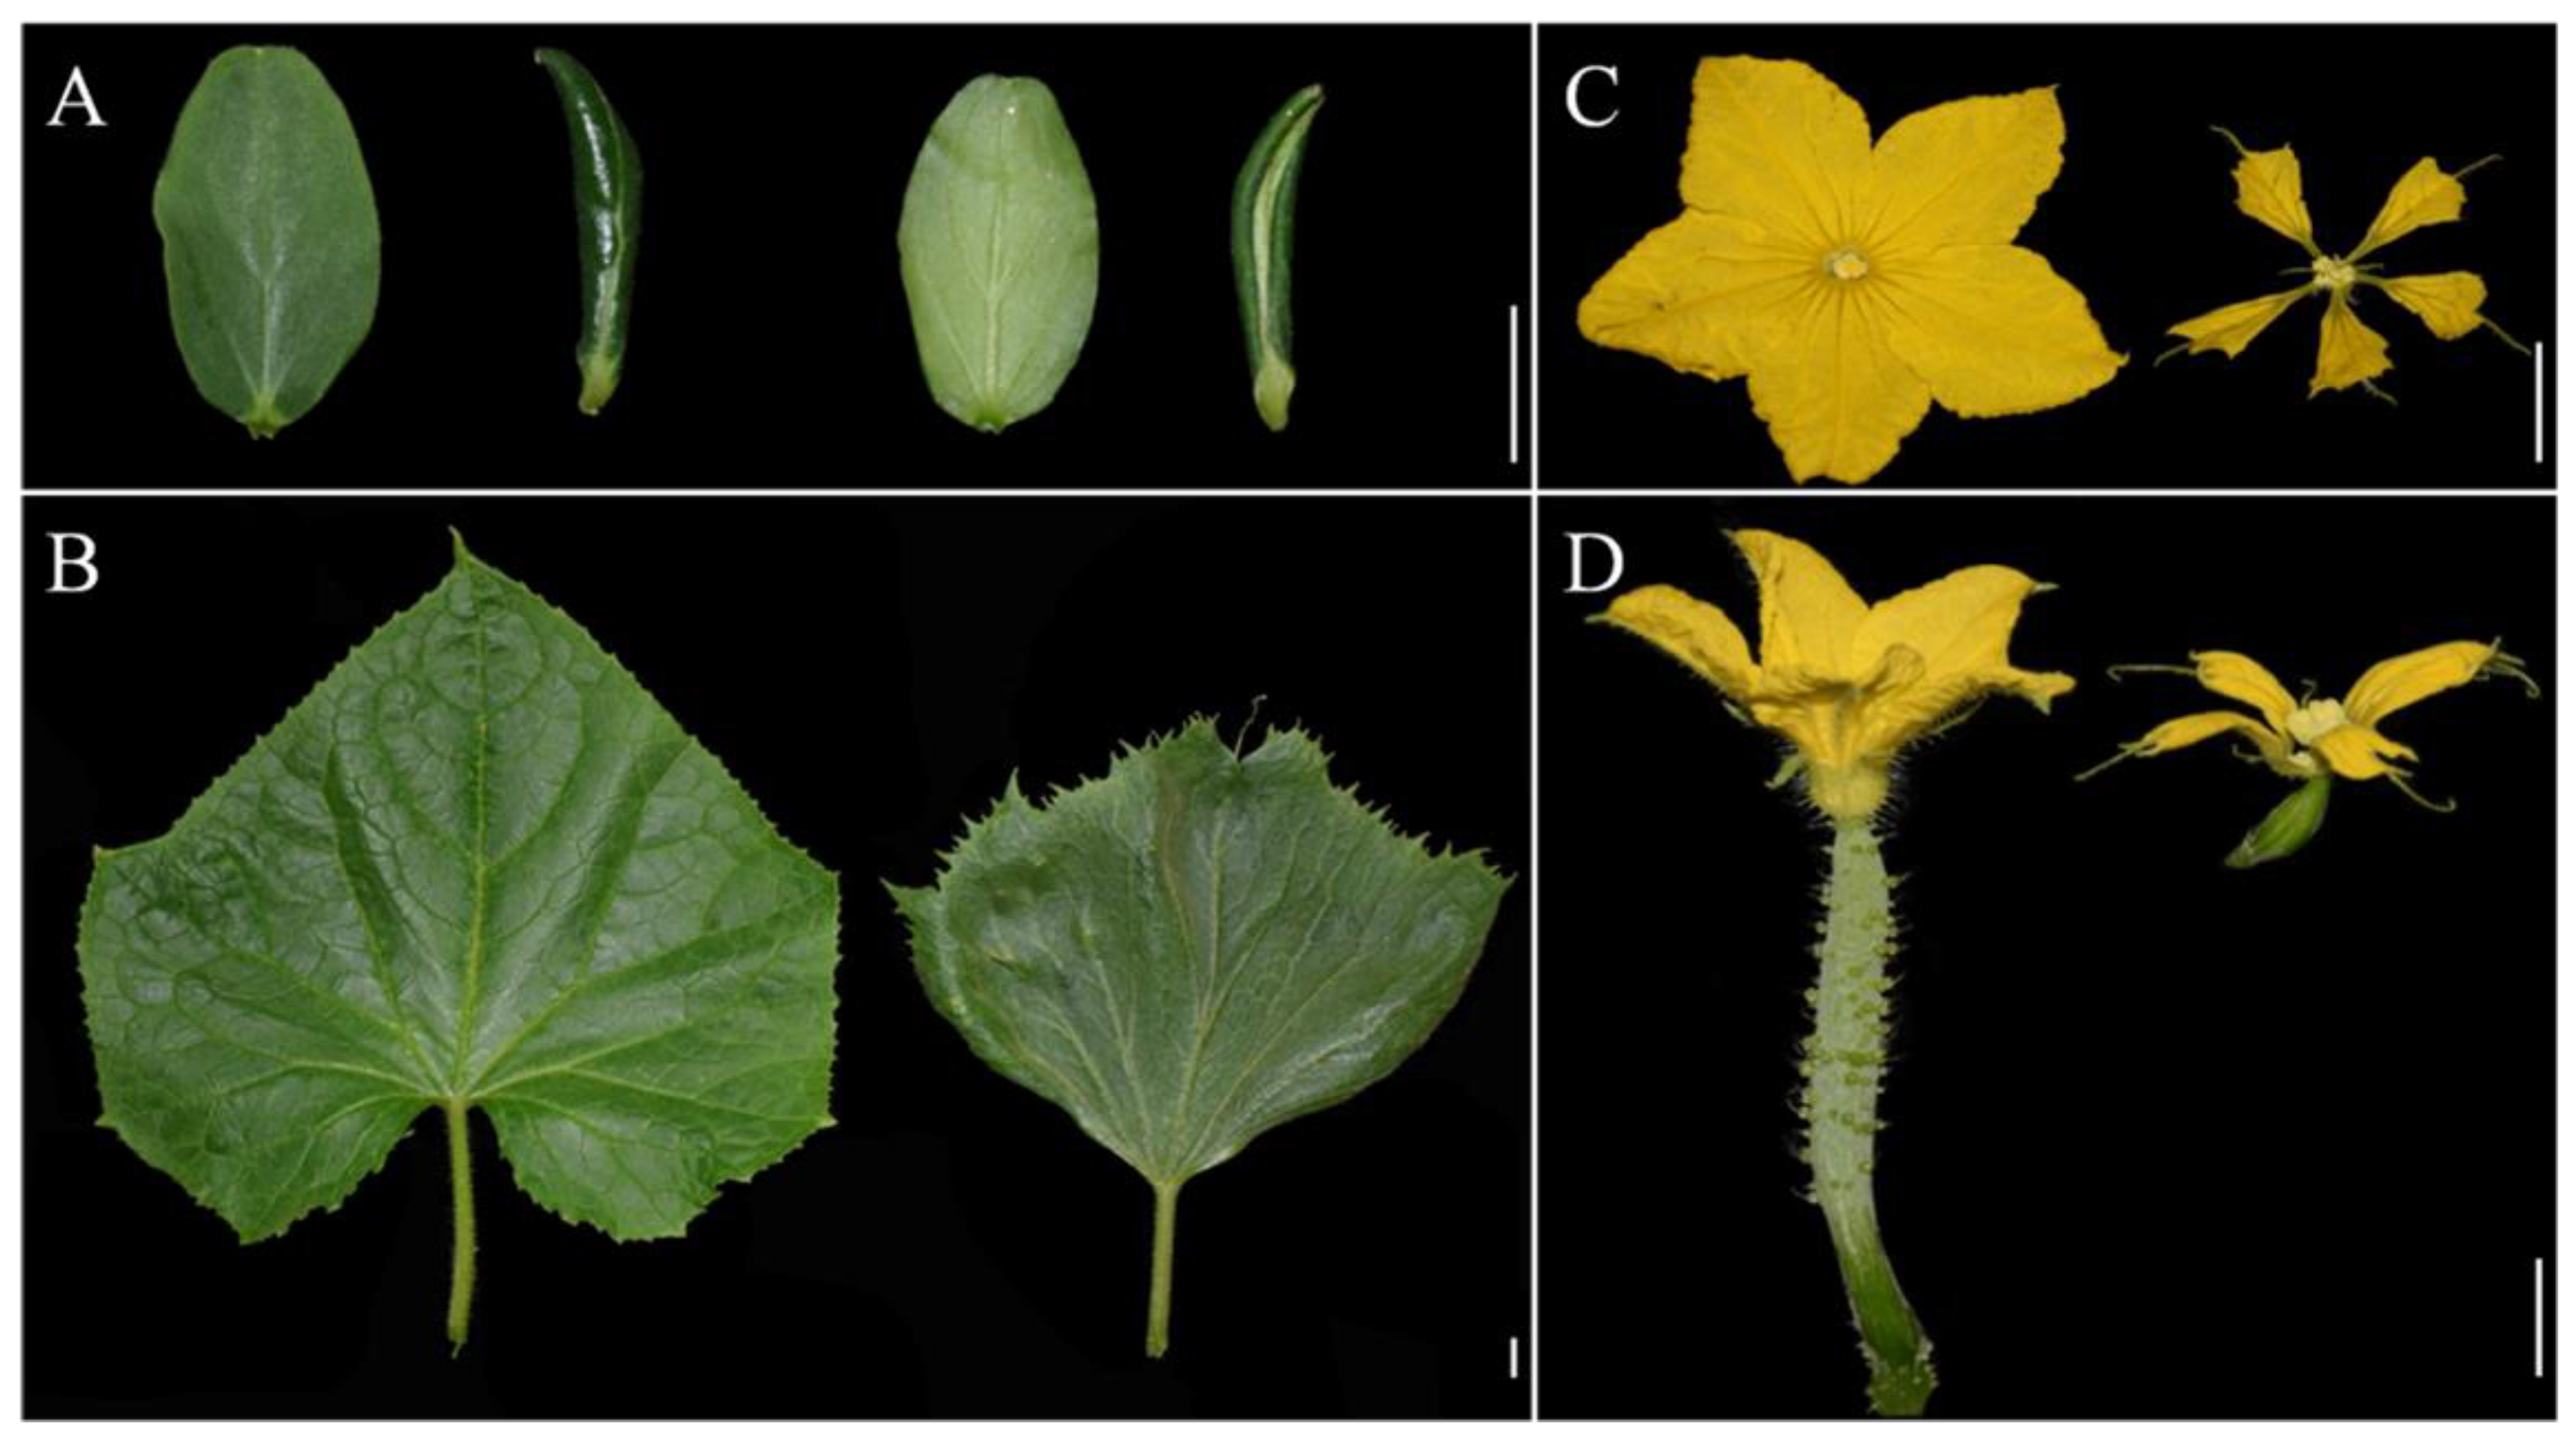
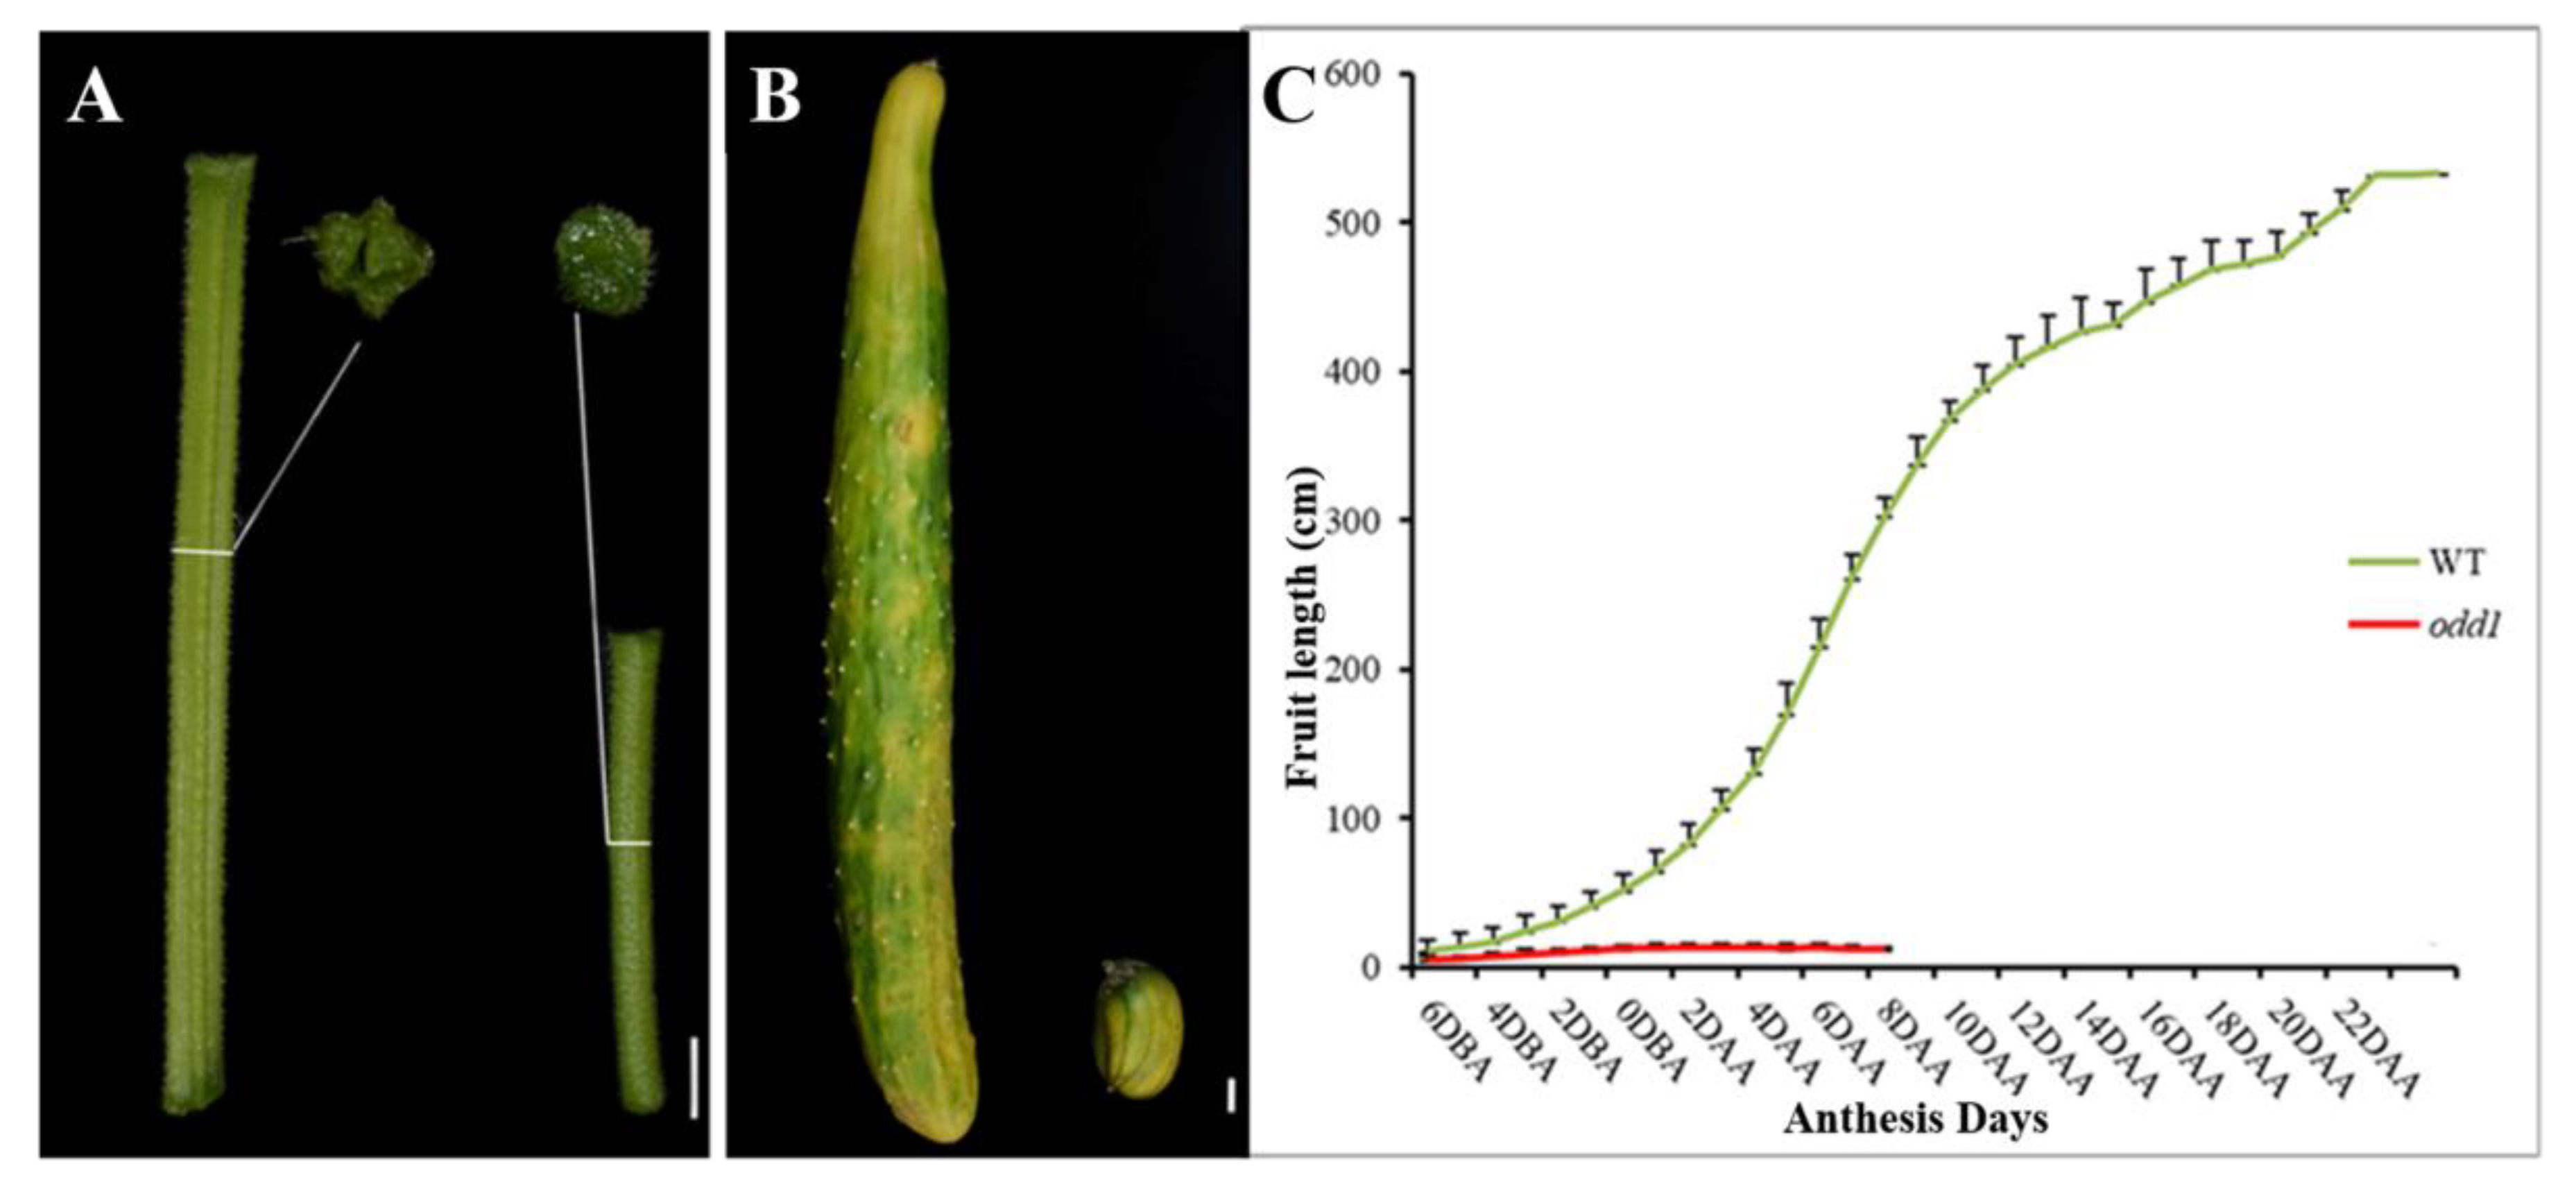
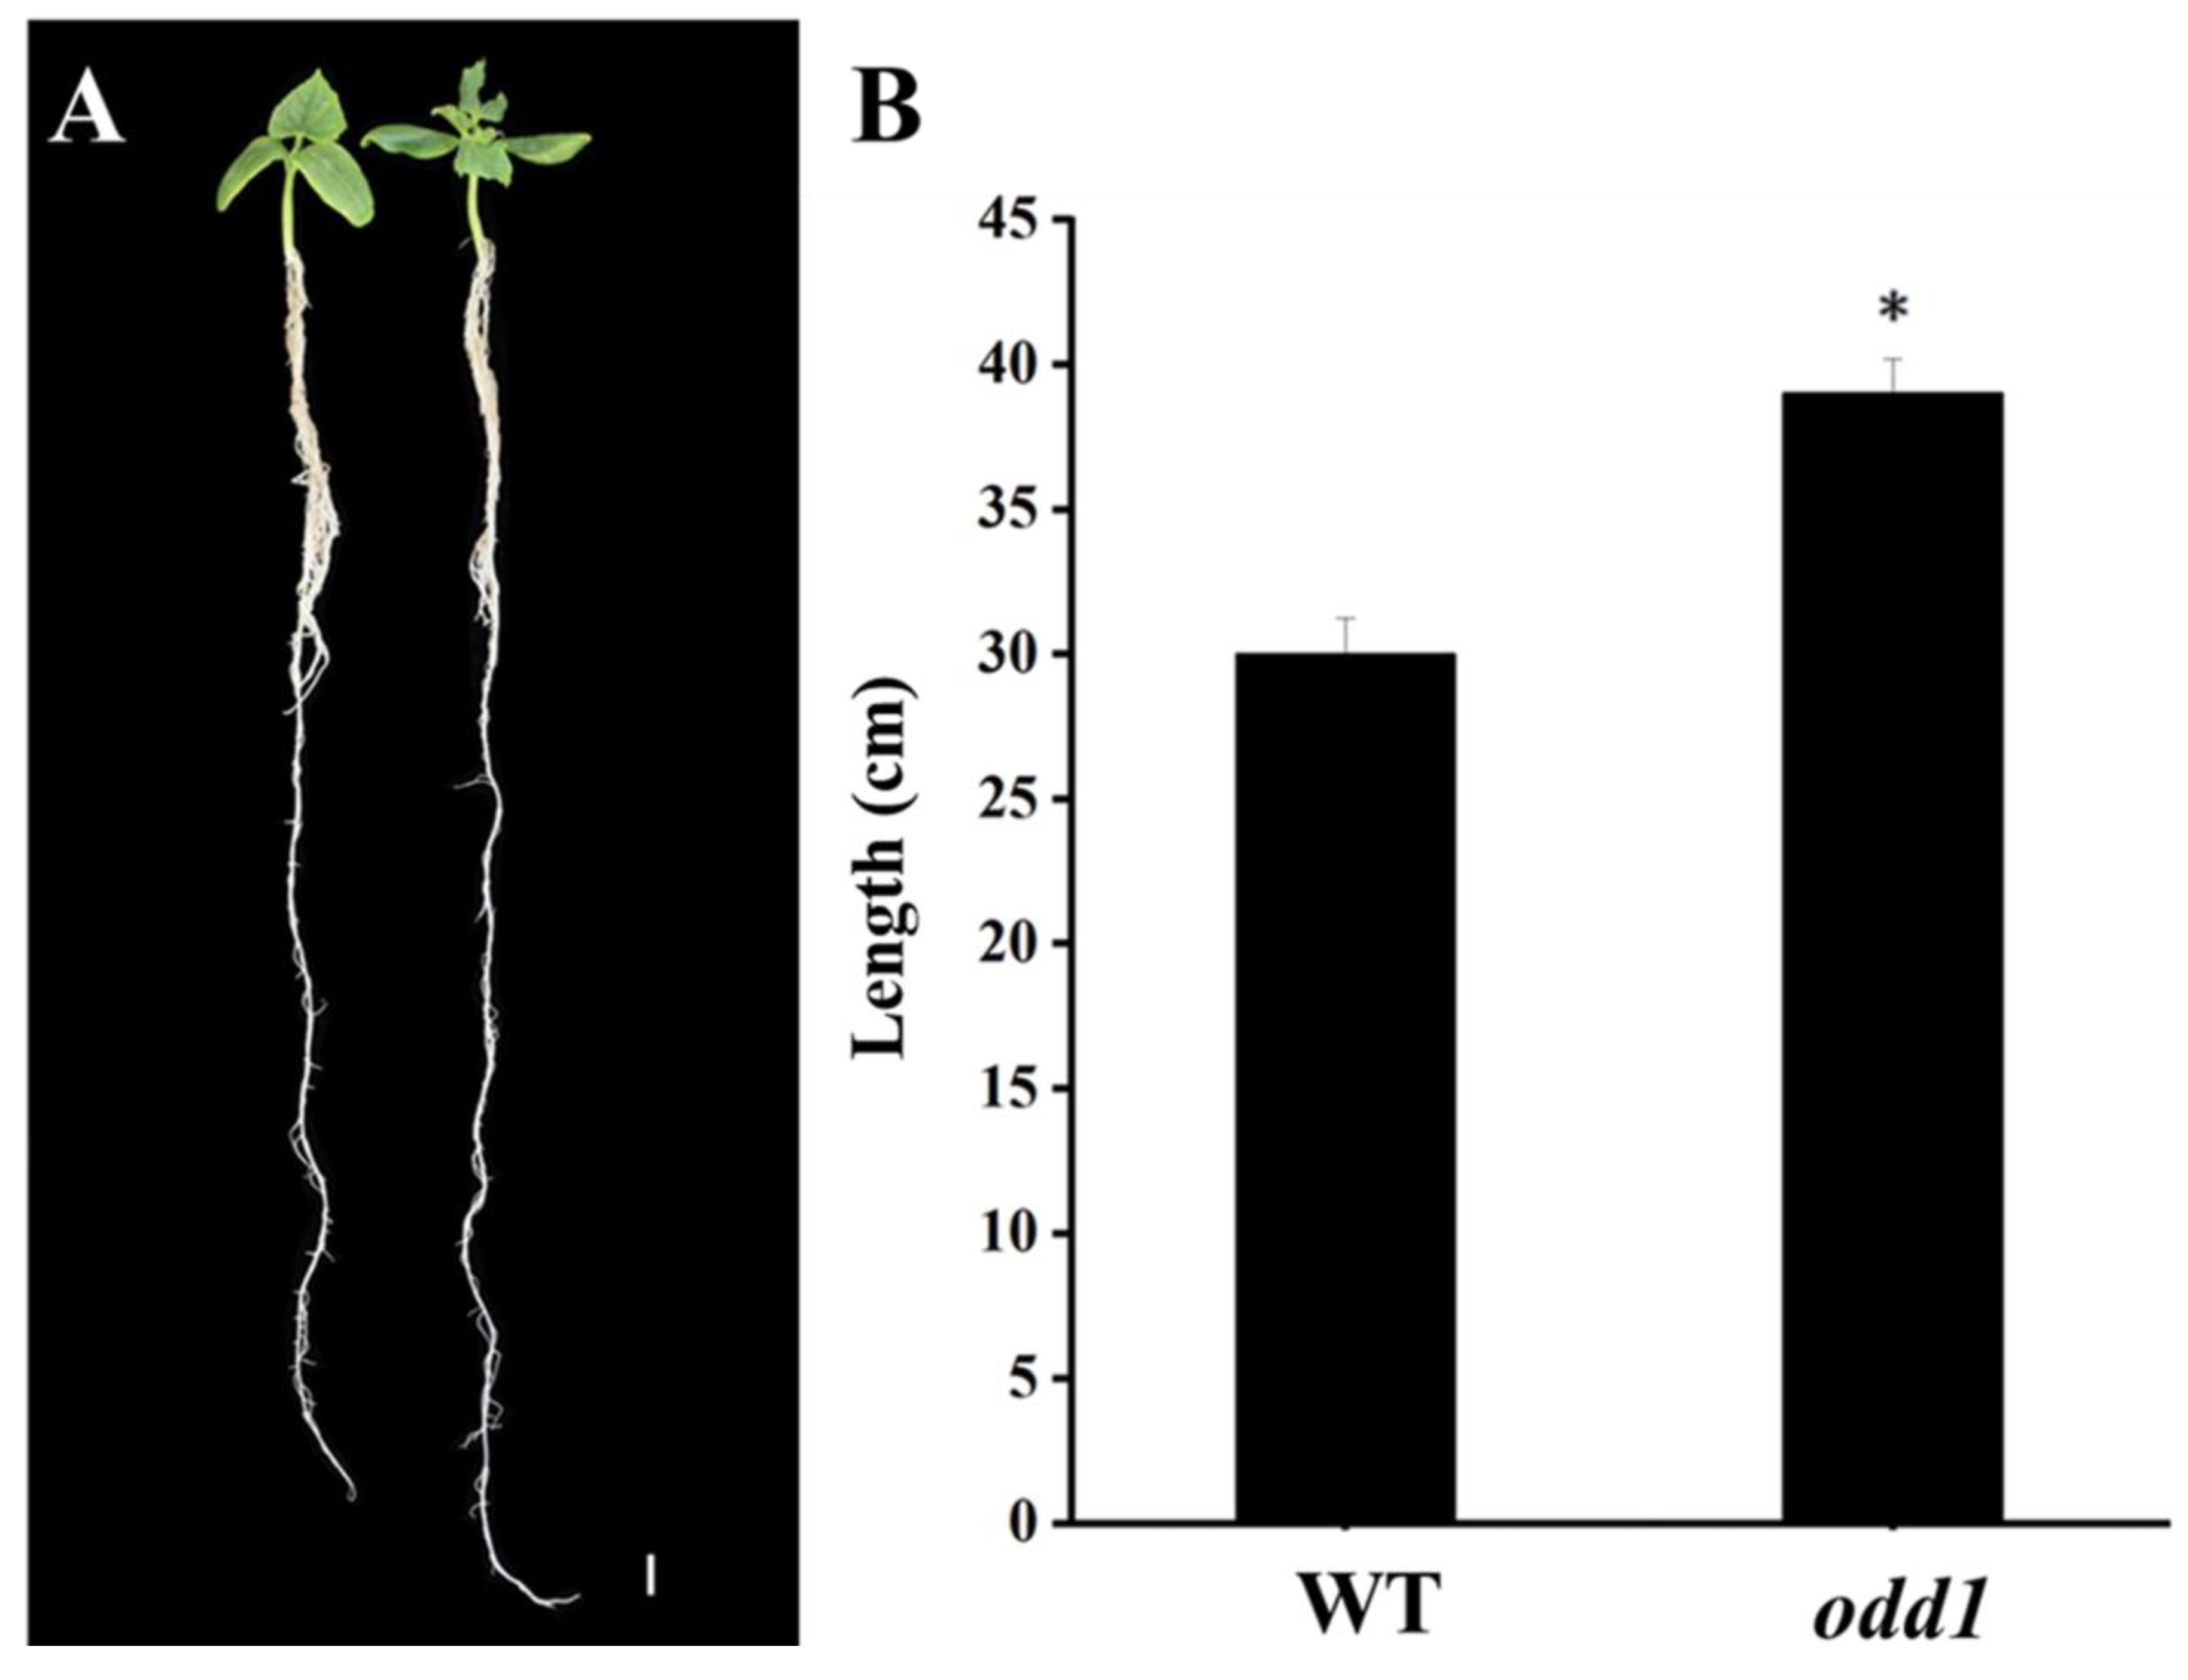
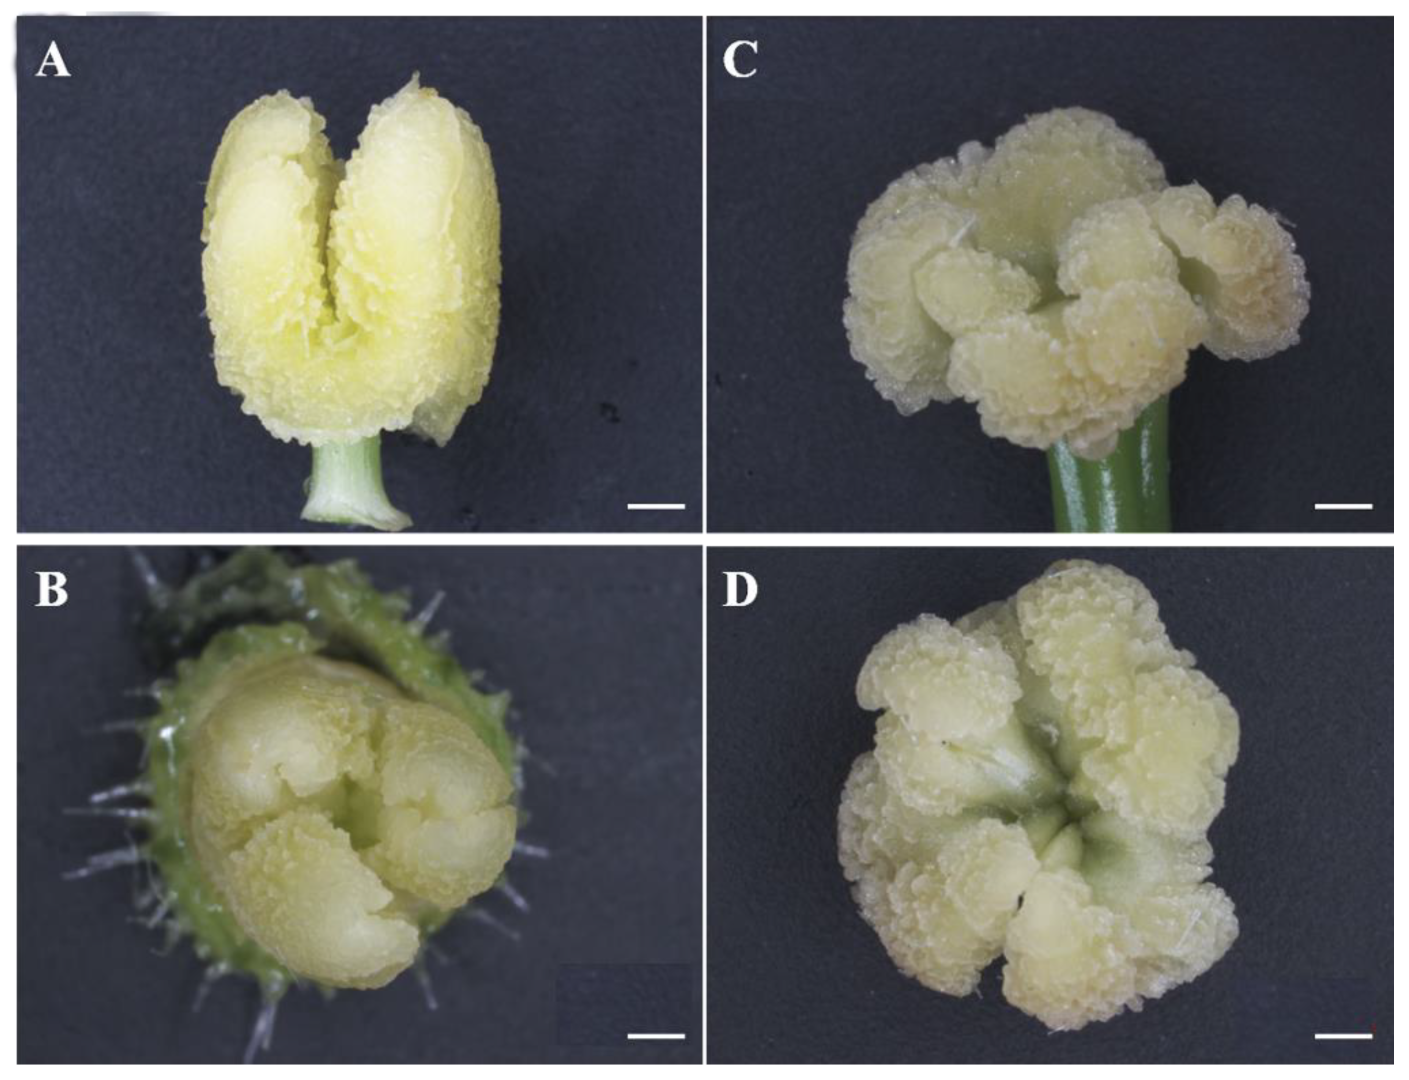
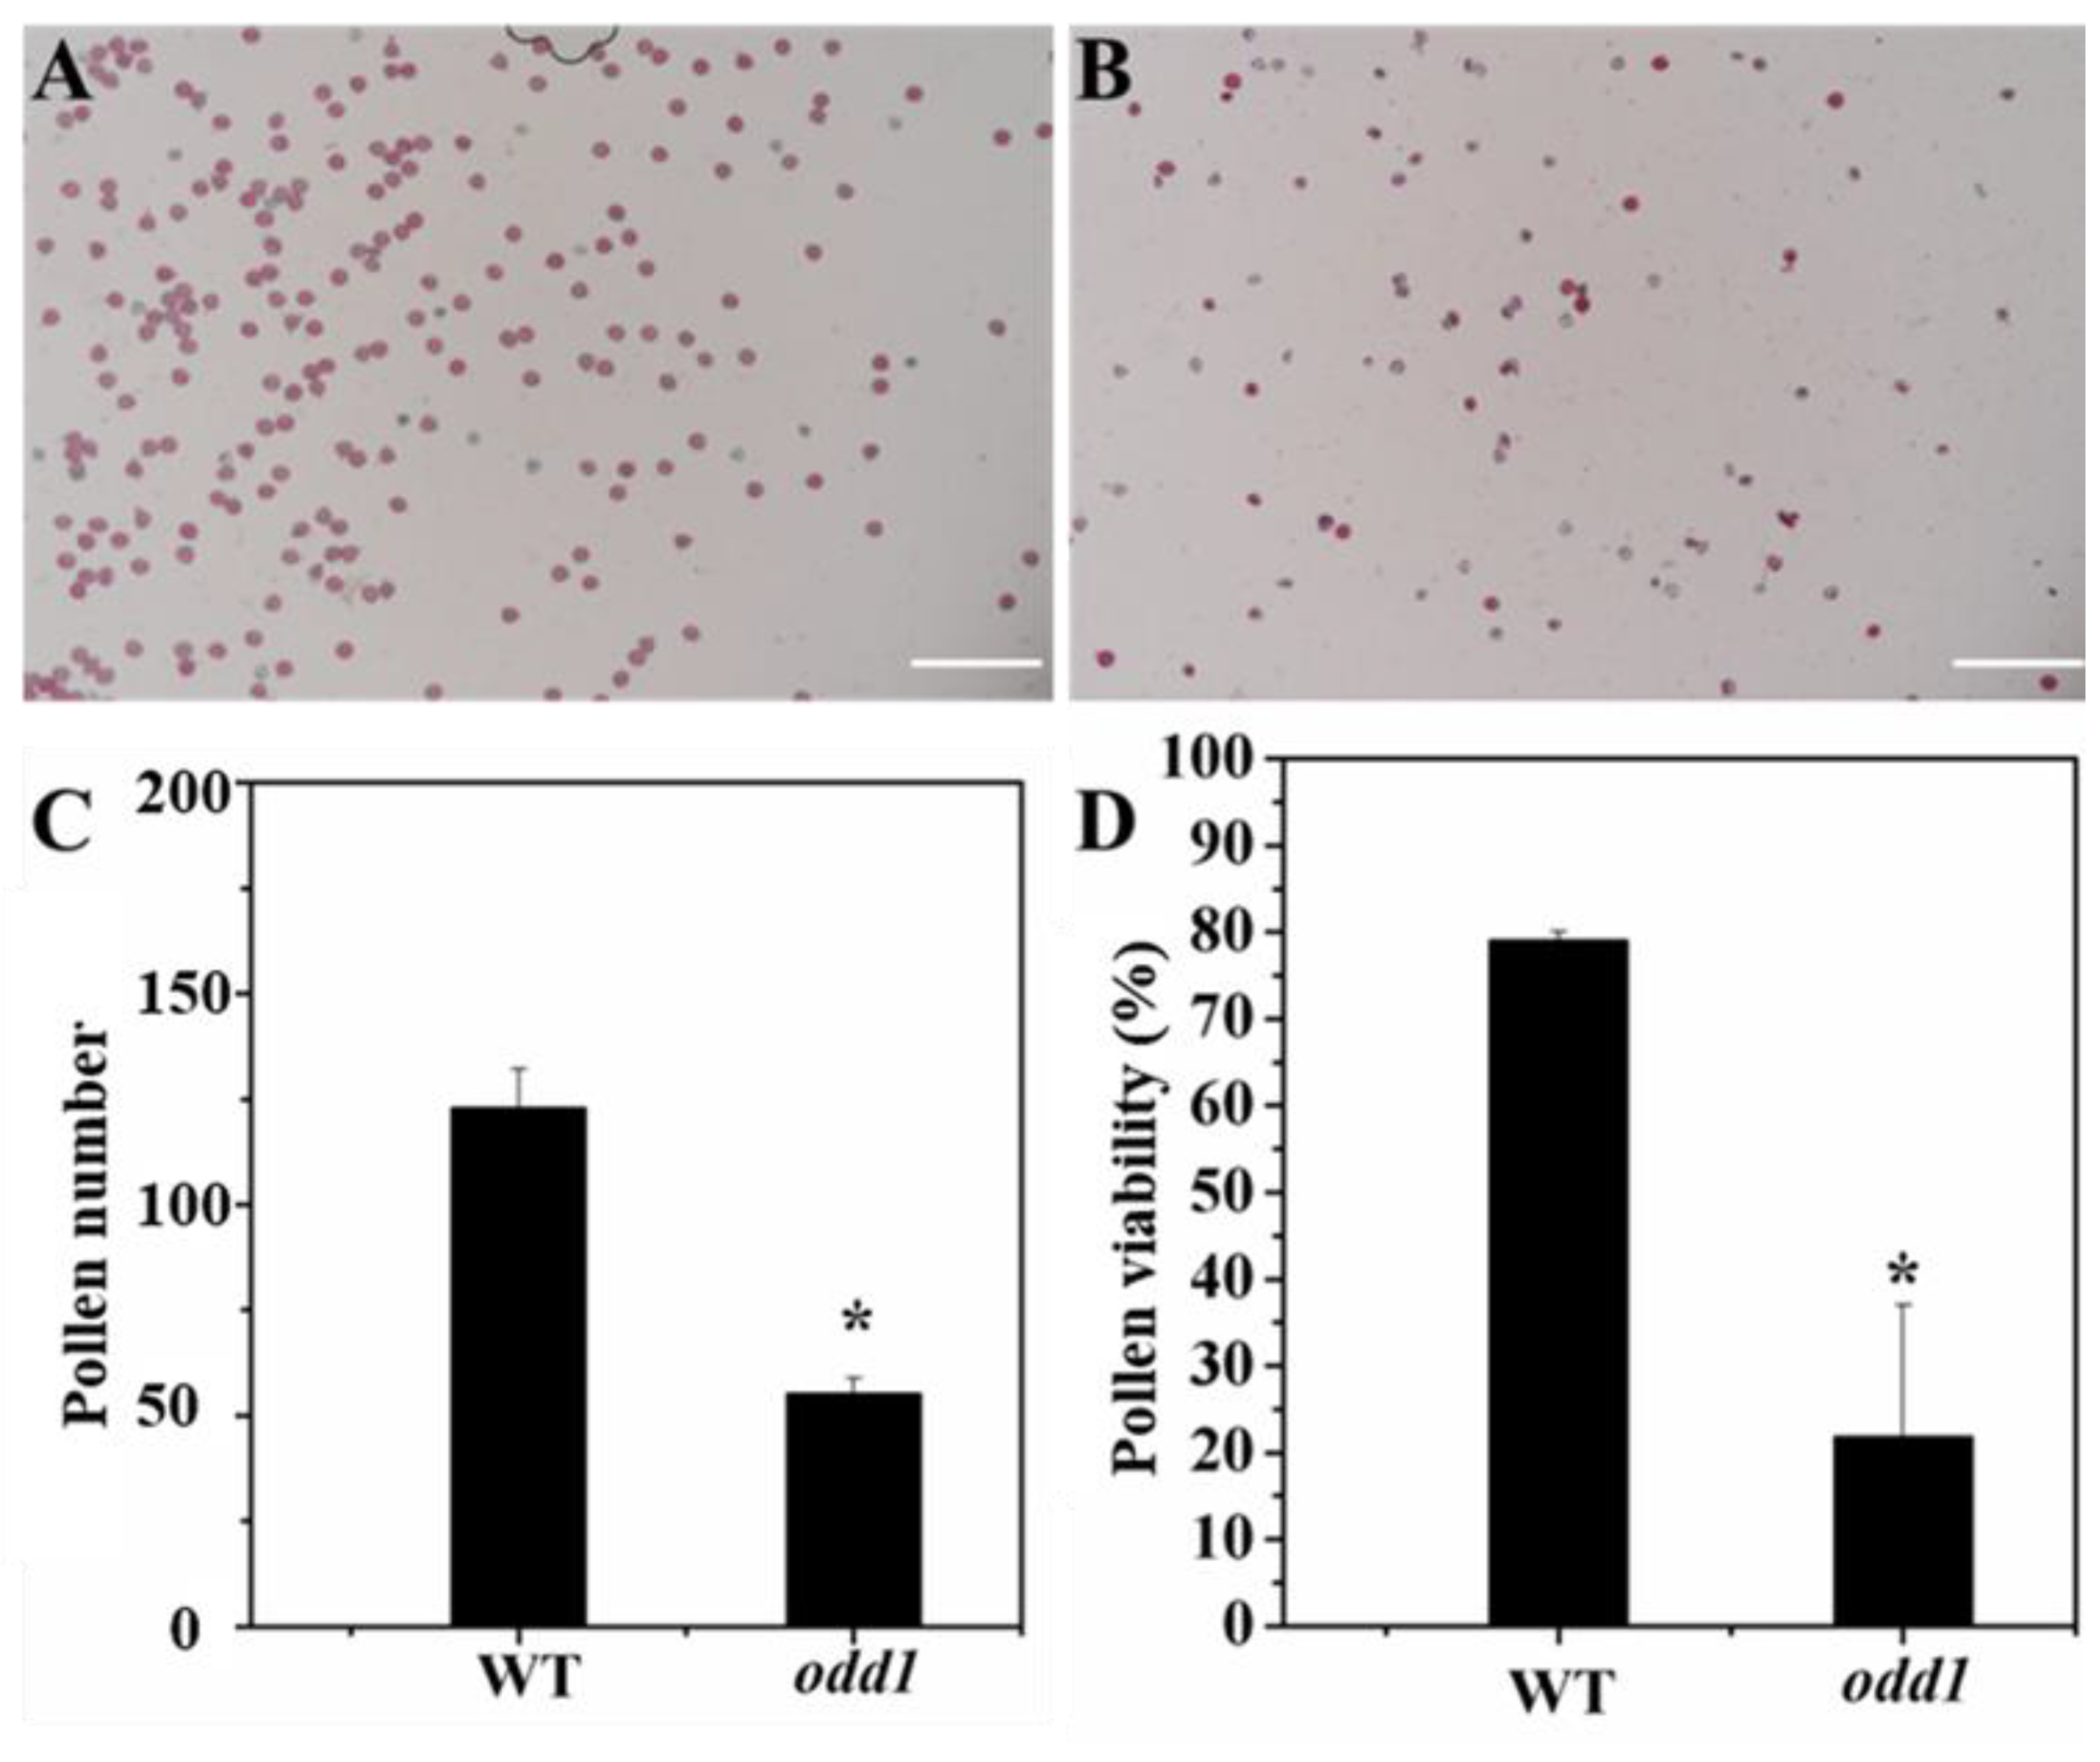
2.1. Phenotypic and Physiological Characterization of odd1 Mutant

A spontaneous mutant was isolated from a North China type cucumber inbred line 09-1 (WT). Compared with WT, the mutant was found to have a much smaller plant stature (Figure 1A). At the adult stage, the average plant height of the WT was 286.67 cm, which was significantly higher than that of the mutant (97.83 cm) (Figure 1B). The internode length and the stem diameter of the mutant were drastically decreased (Figure 1C,D). The mutant true leaf was noticeably smaller than that of the WT (Figure 1A,E and Figure 3B). Observation of the entire growth cycle phenotype showed that compared with the WT, odd1 significantly increased the node positions of the first female and male flowers. That is to say, flowering was delayed in odd1 (Figure 2A,B). Interestingly, during the same growth period, odd1 had more leaves than WT (Figure 2C).
Further observation revealed that the mutant had dark green and curled-edge cotyledons (Figure 3A). Its true leaves with abnormal veins were wrinkled and dark green. Not only was the leaf size smaller, but also the leaf shape became like a ginkgo leaf (Figure 3B). The petiole of odd1 was cylindrical (Figure 3B). The petals of male and female flowers of the mutant were deeply split and simultaneously smaller (Figure 3C,D). The stem of odd1 was solid and cylindrical (Figure 4A). The mutant male flowers could produce normal pollen, but the female flowers were sterile, and only one fruit was observed on all the odd1 mutant plants during the more than ten years of greenhouse and field cultivations, yet the fruit had no seeds and was significantly smaller and shorter than that of the WT (Figure 4B). We recorded the fruit growth curves of WT and odd1 from 6 days before anthesis to 22 days after anthesis (Figure 4C). The average fruit length of odd1 was 5.07 cm at 6 days before anthesis. On the 4th day after anthesis, the fruit of odd1 grew to a maximum length of 12.91 cm. From the 5th day after anthesis to the 8th day after anthesis, the fruit of odd1 began to shrink from 12.55 cm to 11.94 cm. The mutant fruit became withered from the 8th day after anthesis. The odd1 mutant could clearly not set fruit (Figure 4C). Therefore, the odd1 mutant is an ideal material to study the mechanism of fruit setting of cucumber. However, the root system of odd1 was significantly longer (39 cm) than that of the WT (30 cm) at 21 days after germination (Figure 5).
Because the leaves of odd1 seemed dark green, we wanted to know whether its chlorophyll content was higher. Then, we measured chlorophyll content and several photosynthetic parameters in WT and odd1 and found that the chlorophyll and carotenoid contents were lower in the leaves of odd1 than in those of WT (Table 1), suggesting that the dark green leaf color of odd1 was not associated with higher chlorophyll content. In addition, the net photosynthetic rate (Pn), stomatal conductance (gs), and intercellular CO2 concentration (Ci) significantly decreased in odd1, but there was no significant difference in the transpiration rate (Tr) between WT and odd1 (Table 1). The total chlorophyll content was significantly decreased in the odd1 mutant and the transpiration rate (Tr) was similar between the WT and odd1 mutant, which may suggest that the decreased photosynthesis in odd1 is mainly related to the chlorophyll and/or light absorption capacity.

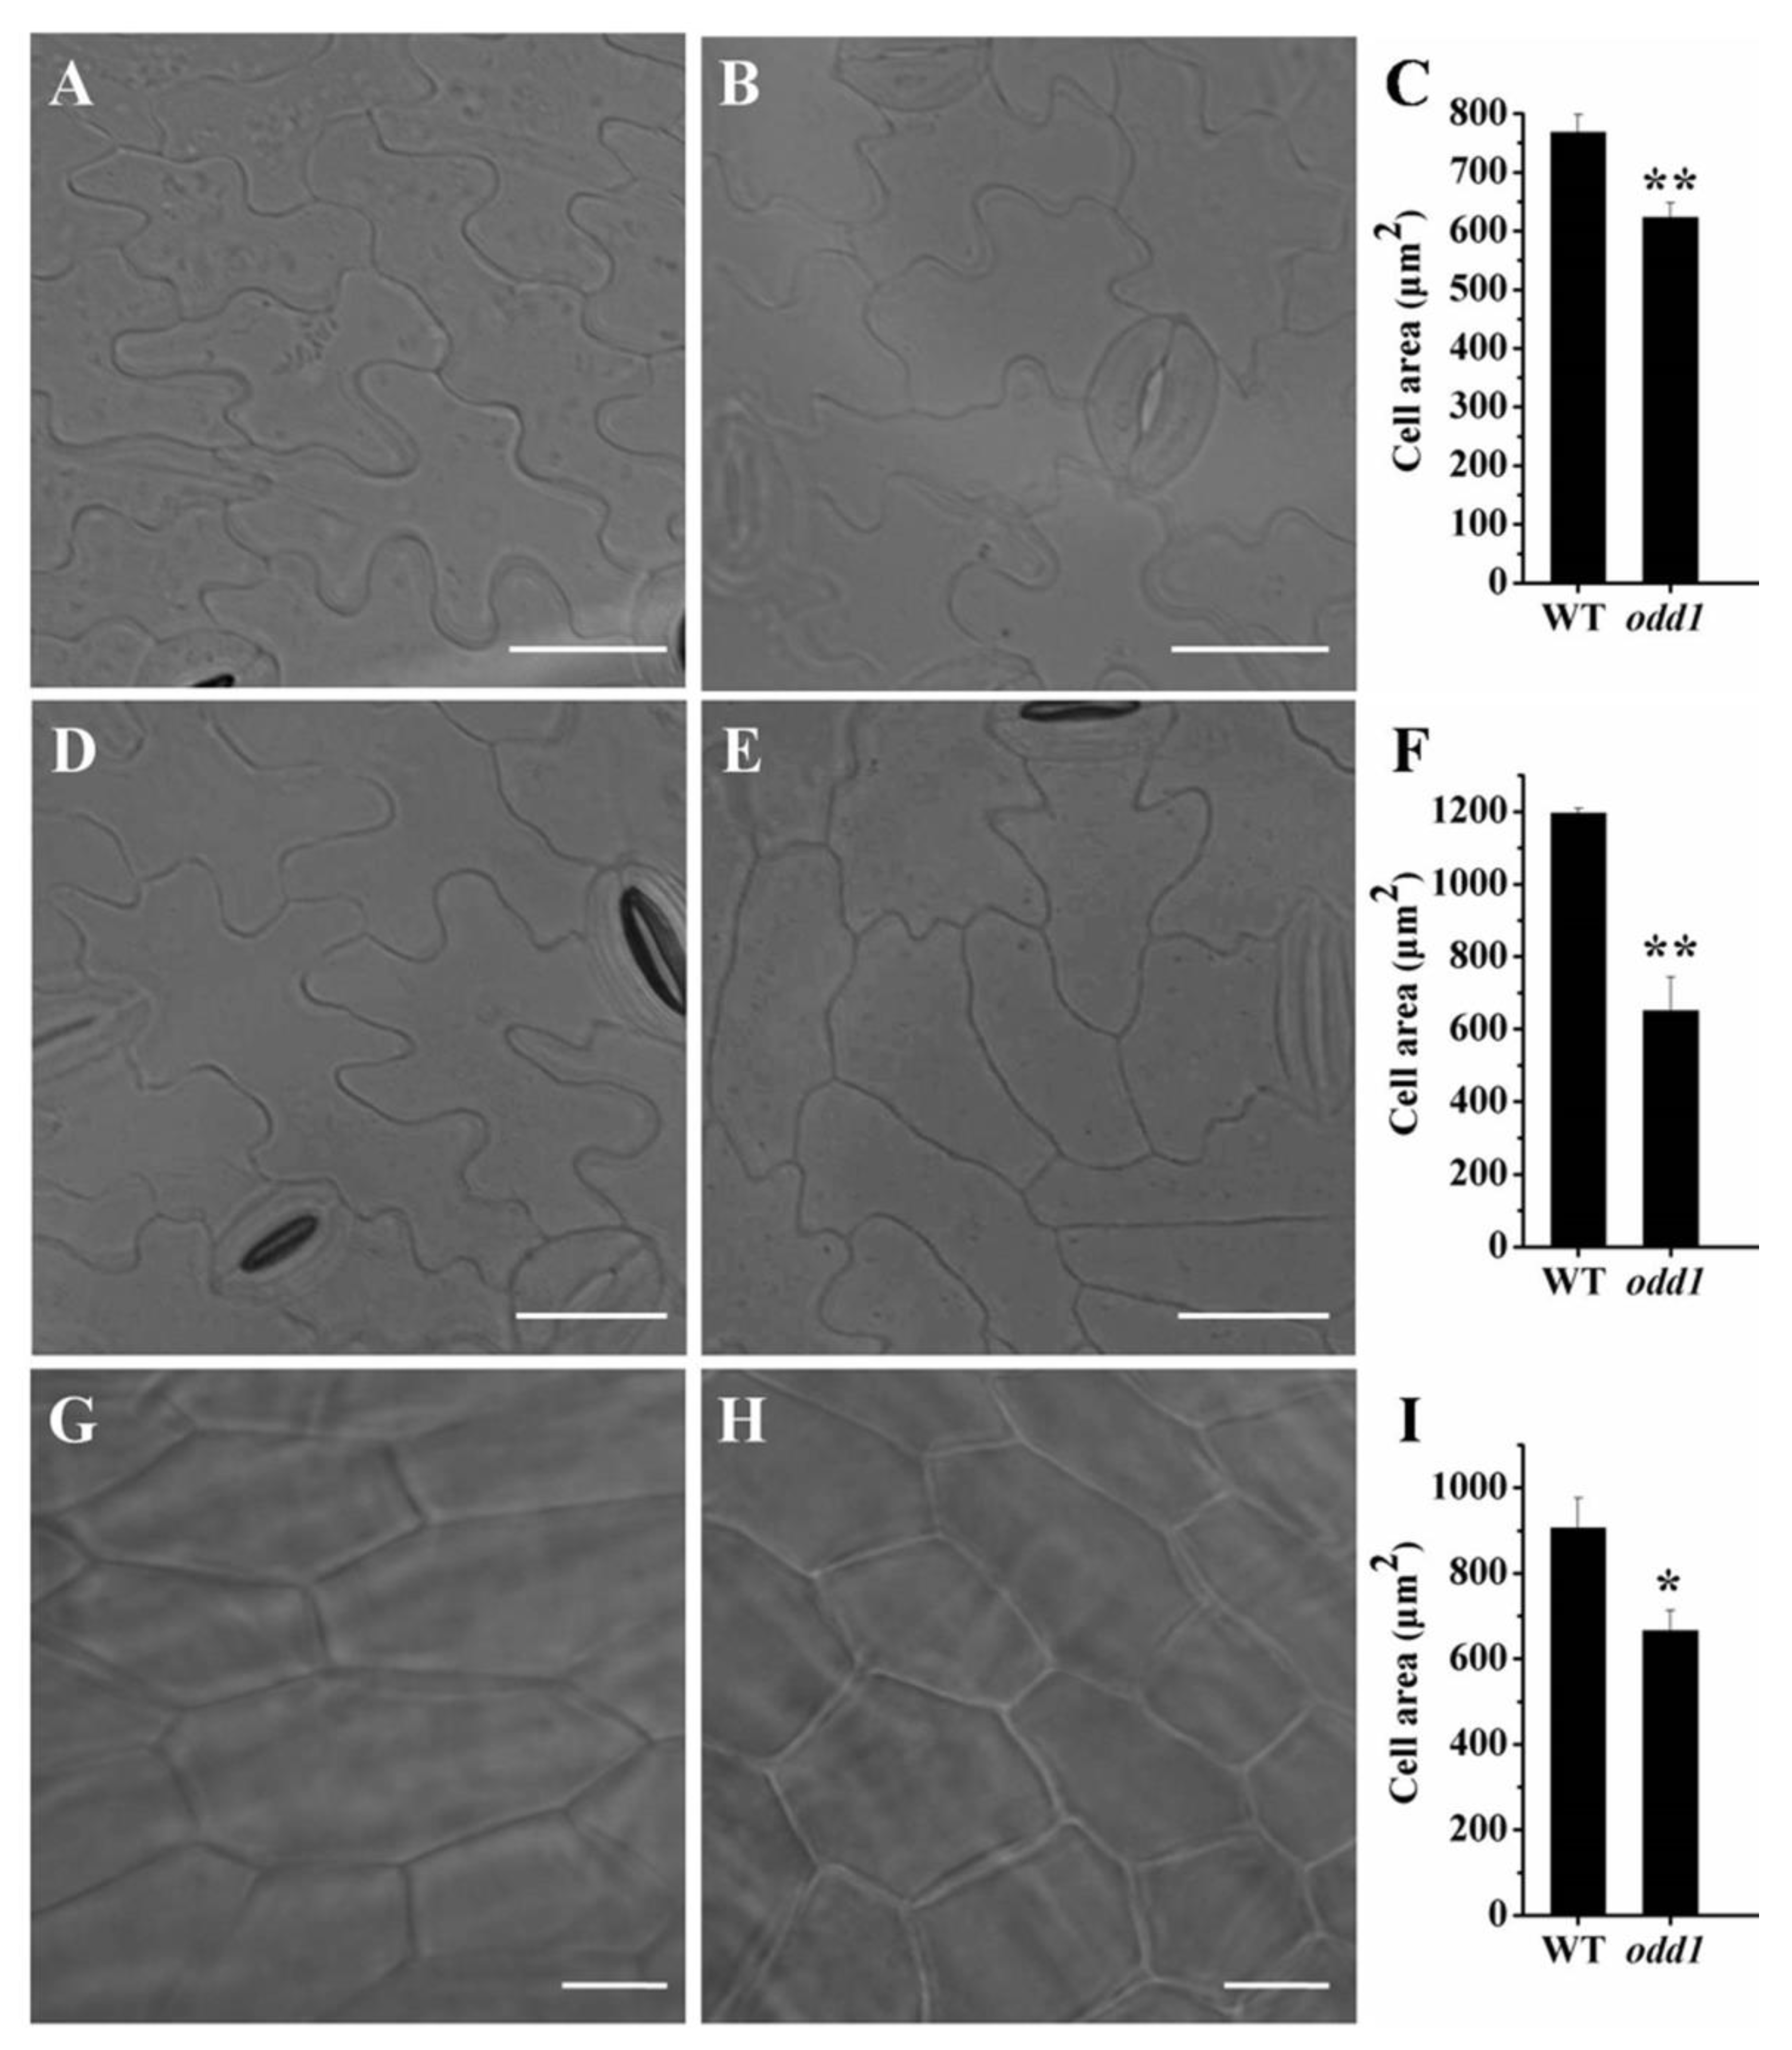
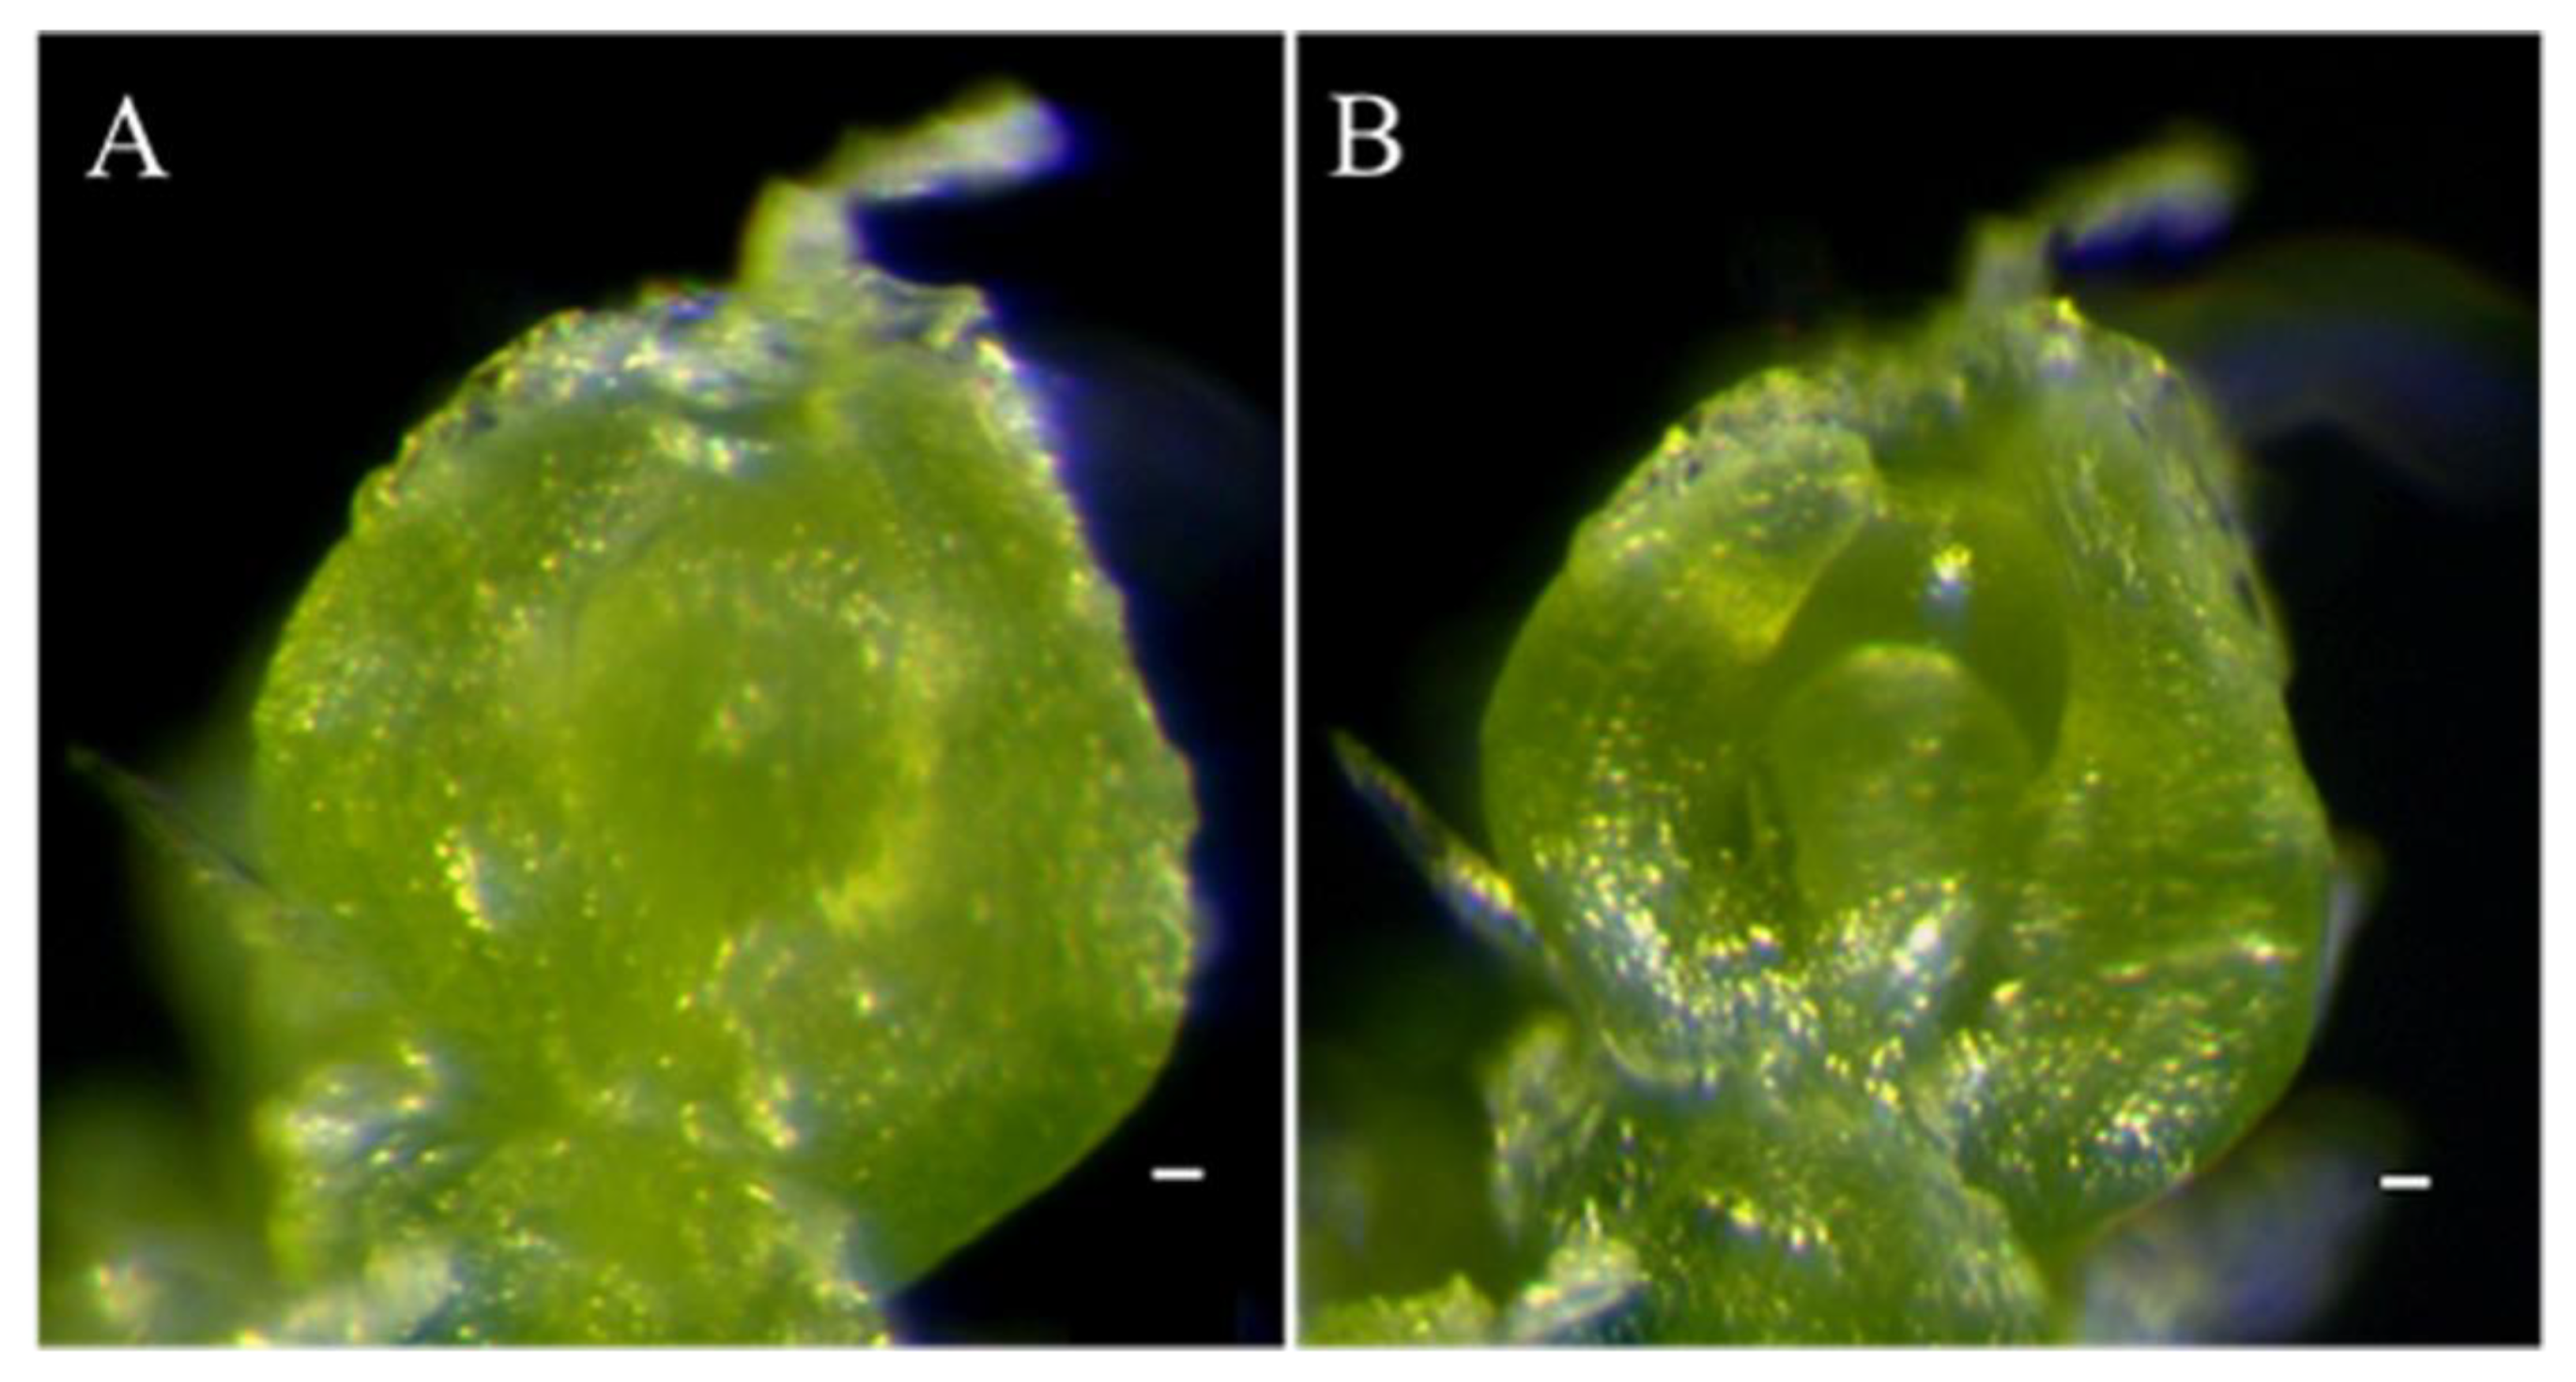
2.2. Histological and Anatomical Features of odd1 Mutant

To ascertain the cellular base of the organ size in odd1, we compared the epidermal cell size of the cotyledon, functional leaf, and petal in WT (Figure 6A,D,G) and odd1 (Figure 6B,E,H). The cell size of the cotyledon in odd1 was significantly smaller than that in WT (Figure 6C), and similar differences in functional leaf and petal were observed between WT and odd1 (Figure 6F,I). The epidermal cell shape of the cotyledon and functional leaf were irregular in WT (Figure 6A,D), but the irregularities of the epidermal cells were significantly decreased in odd1 (Figure 6B,E). The cell sizes of the cotyledon, functional leaf, and petal of odd1 were 81.12%, 54.46%, and 73.42% of those of WT, respectively (Figure 6C,F,I); however, the areas (fifteen biological replicates) of the cotyledon, functional leaf, and petal of odd1 were only 41.75% (278.63 mm2/667.38 mm2), 17.24% (55.43 cm2/321.56 cm2), and 16.27% (272.16 mm2/1672.77 mm2) of those of WT, respectively (Figure 1E and Figure 3). Therefore, the organ size decrease of odd1 was due to the decrease of cell size and cell number.
SAM is the fundamental source of all aboveground organs including stem, leaf, flower, and fruit. To investigate the SAM of odd1, we compared the morphology of the SAM of odd1 and WT using the 25-day-old seedlings. Compared with WT, odd1 had a smaller SAM (Figure 7). Thus, the smaller aboveground organs of odd1 might also be related to its smaller SAM.

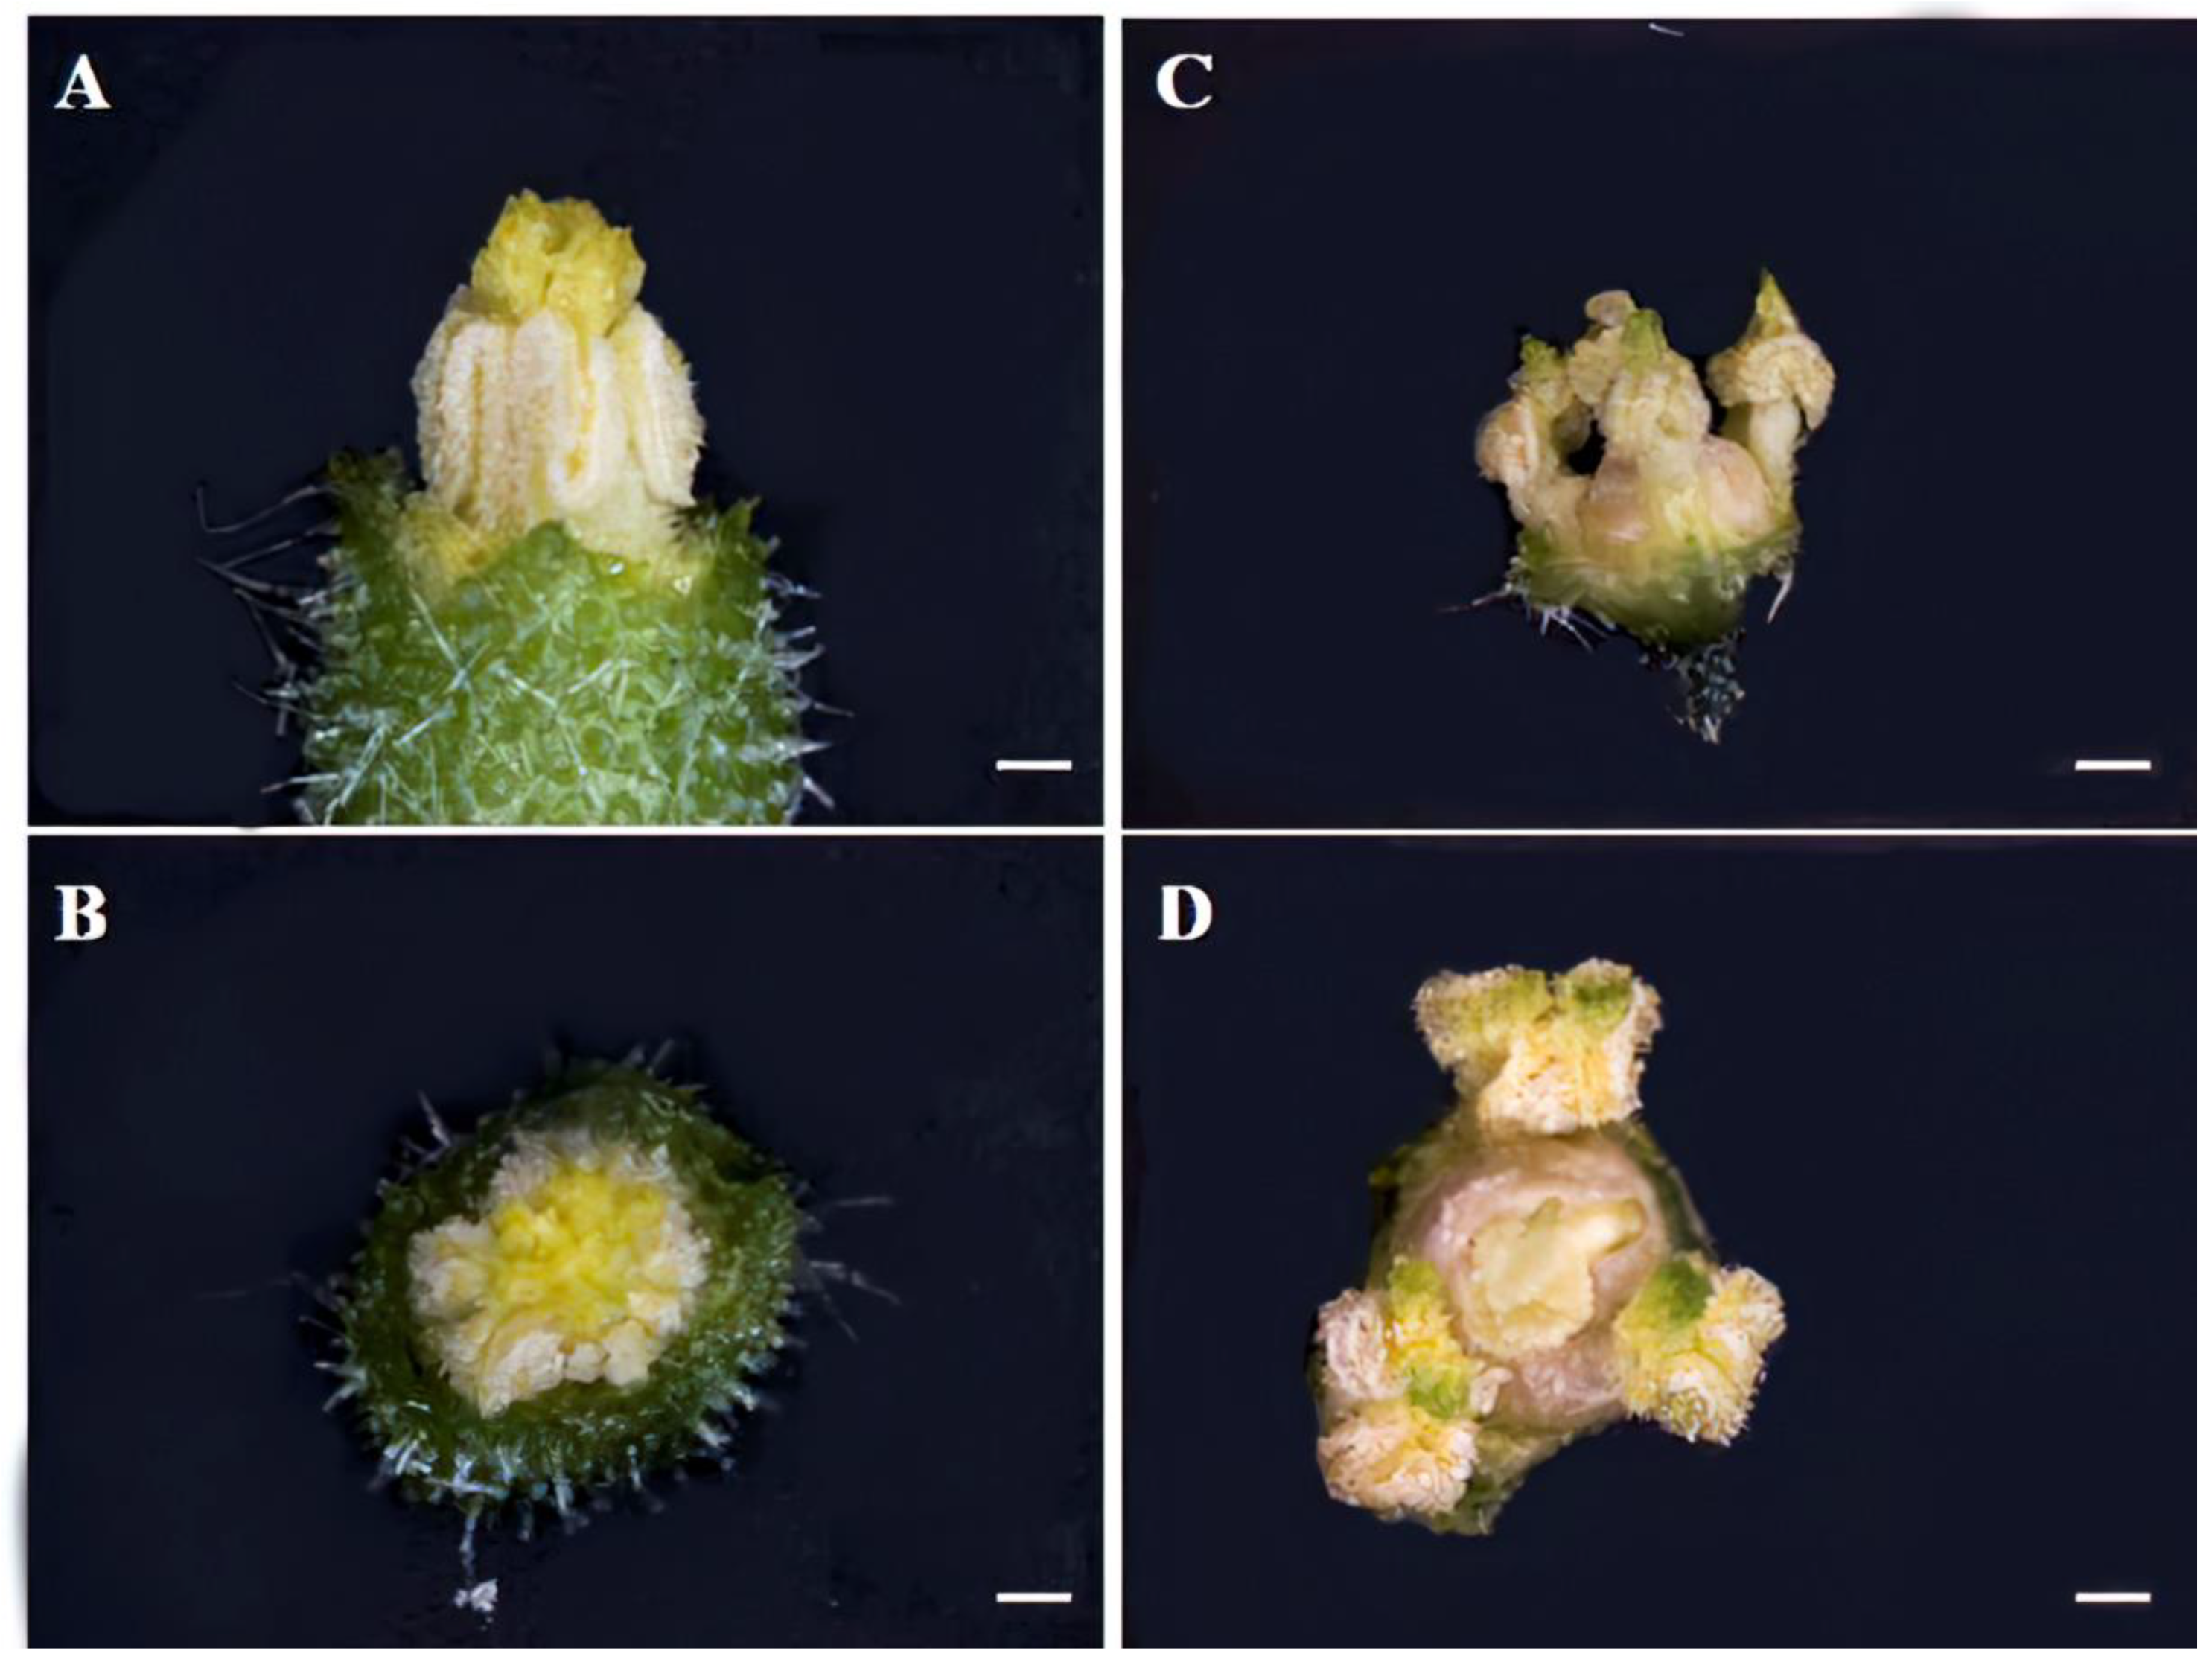
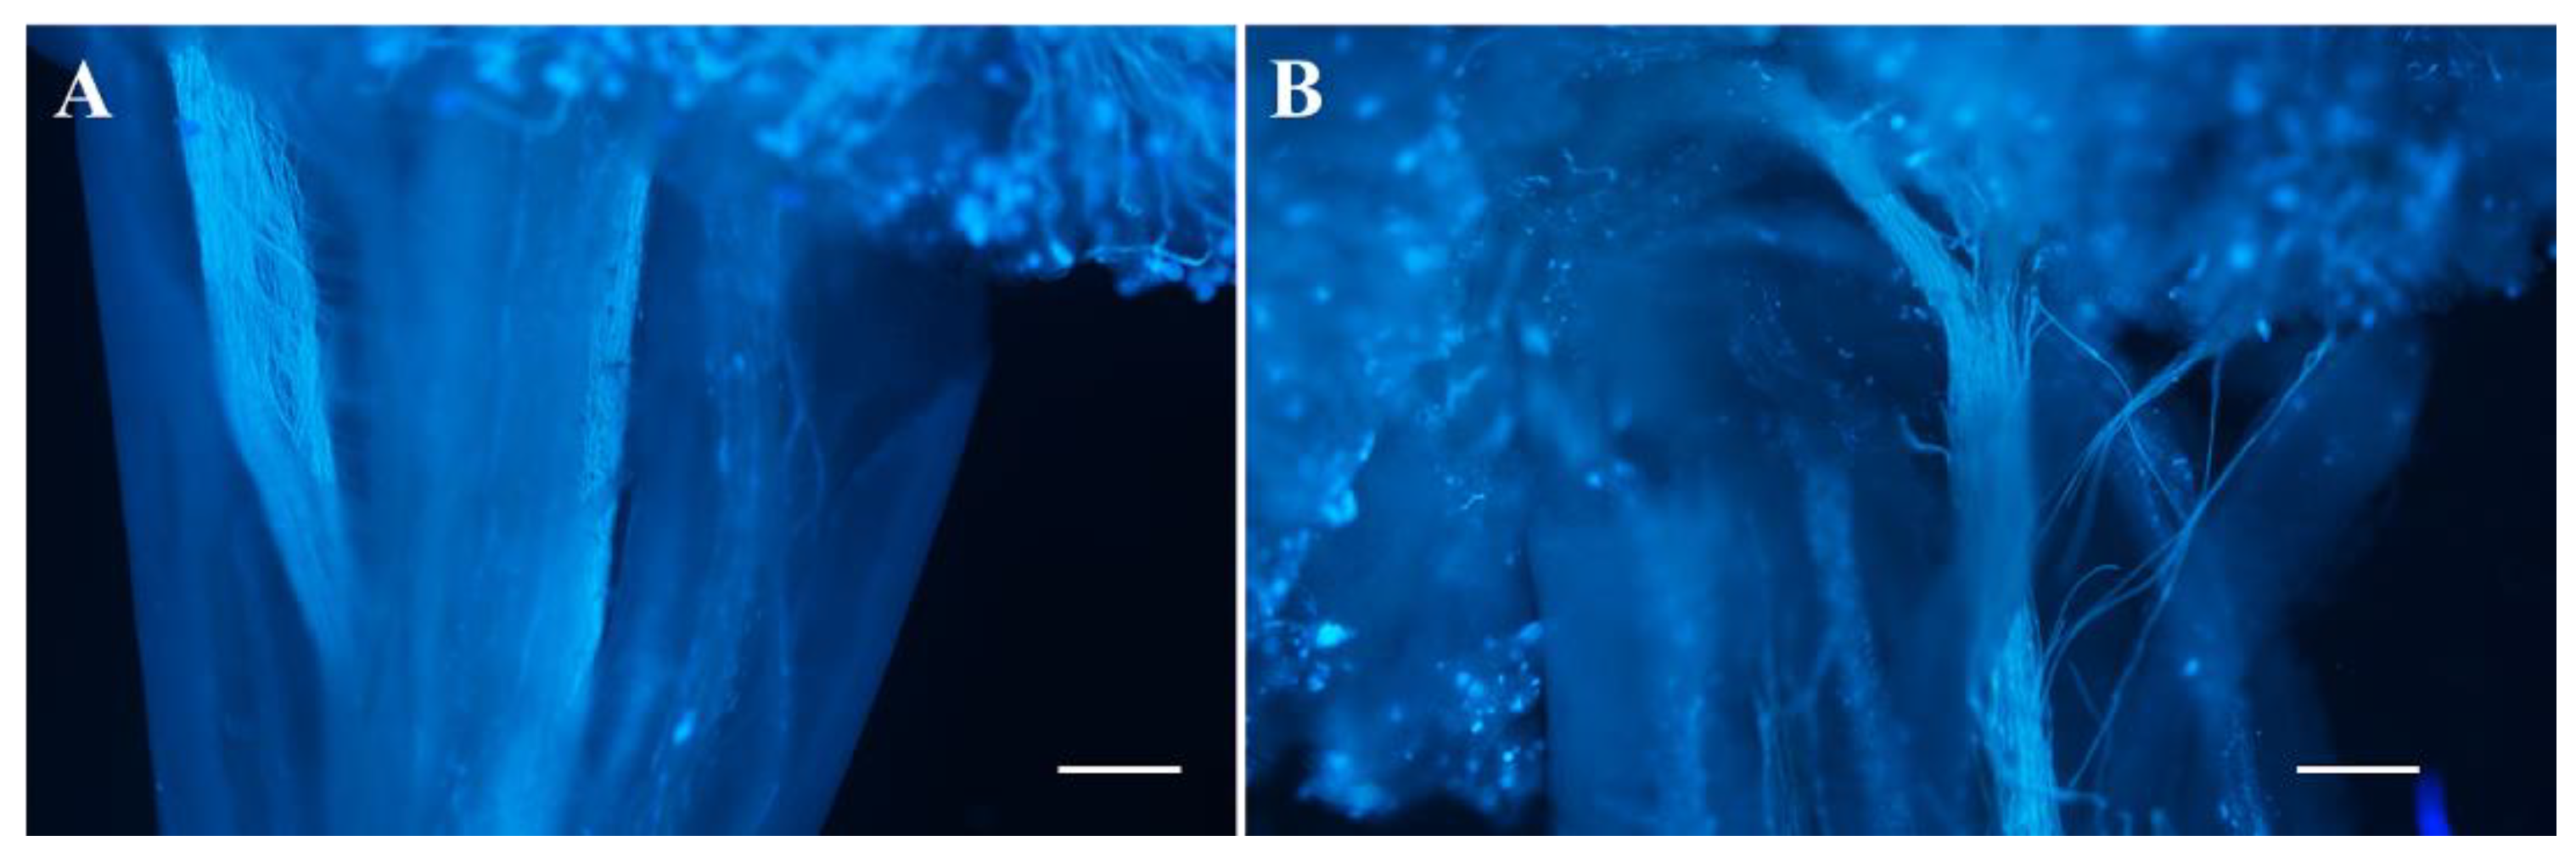
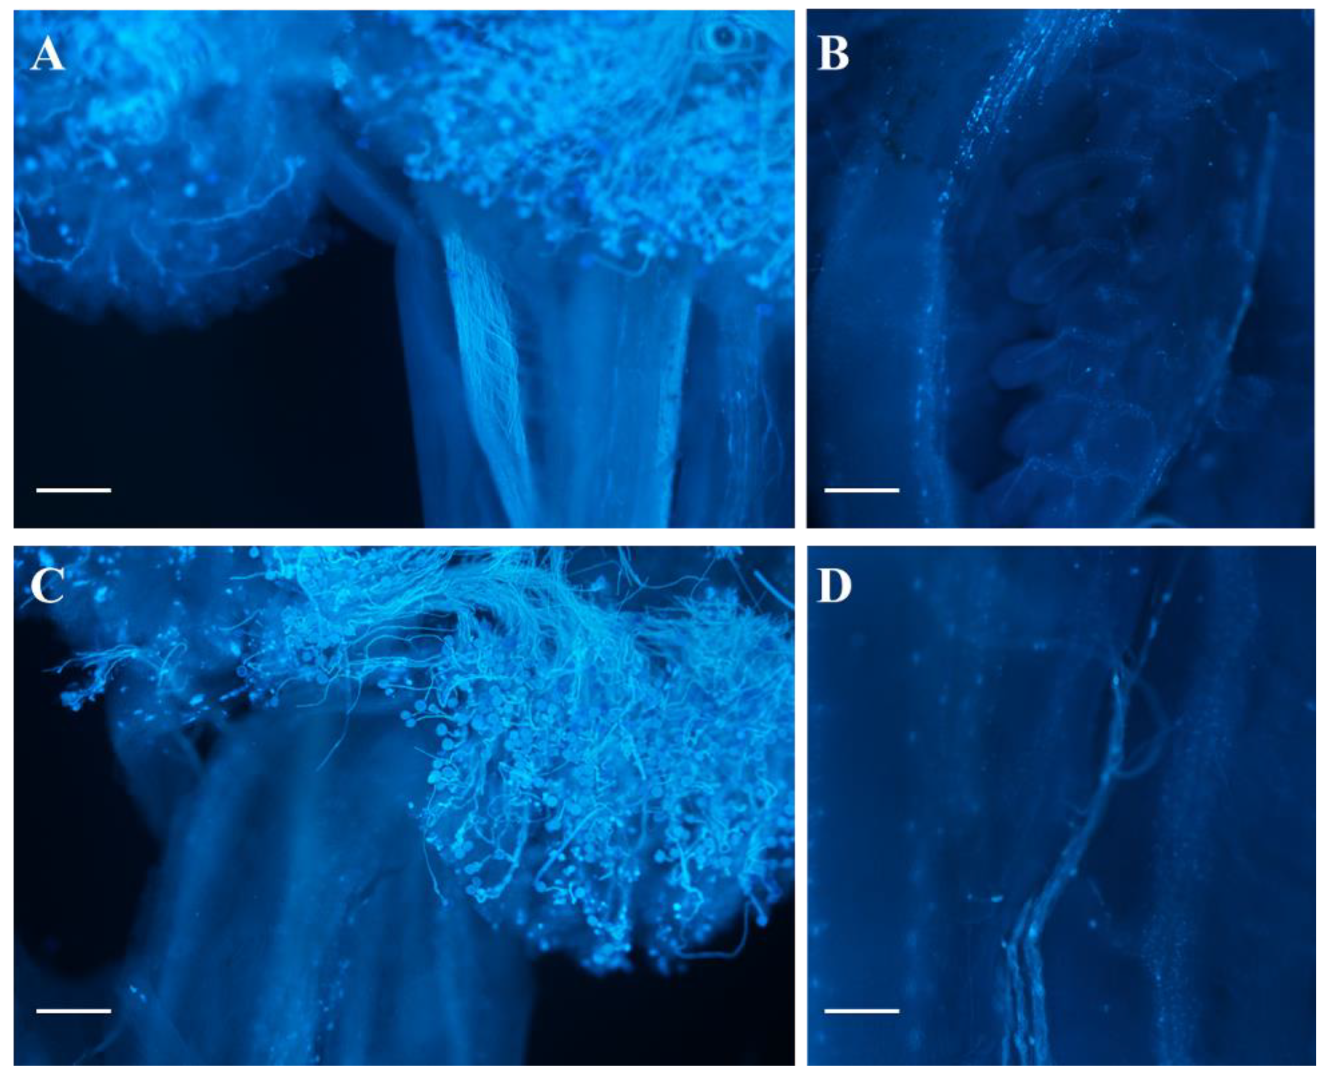
2.3. The Female Sterility of odd1

Because the odd1 mutant could not set fruit (Figure 4C), we observed carefully the female and male flowers of WT and odd1 under a stereomicroscope. The stamen was split into three independent anthers in odd1 compared to WT (Figure 8). Not only did the stigma became larger and valgus, but also the shape became cauliflower-like, and the style became thicker in odd1 (Figure 9).
In addition to the morphologies of the stamen and pistil of odd1, we examined their fertilities. All fresh pollen grains of each flower were stained with Alexander solution, and the number and viability of pollen grains were observed and counted. The number of pollen grains of odd1 was significantly less than that of WT (Figure 10A–C). After staining, the pollen grains with high vitality were purple or red, while those with no vitality were blue or withered. It can be seen from Figure 10A,B,D that odd1 could produce normal and vital pollens, but its vital pollen percent was significantly lower than that of the WT. The pollens of WT and odd1 were pollinated on the stigma of WT, respectively, to test pollen viability. Furthermore, the materials were stained with aniline blue 24 h after pollination. The pollen germination and pollen tube elongation were observed with a fluorescence microscope. The pollen grains of both WT and odd1 could germinate normally and pass through papilla cells to form pollen tubes, which further indicated that the pollen of odd1 was fertile (Figure 11). By reciprocal cross test and self-pollination, the WT plants could produce fruits with normal seeds (Table 2), while the odd1 plants could not produce fruit (Figure 4C and Table 2). When WT was used as the female parent, seeds were normally produced in the fruit (Table 2), but when odd1 was used as the female parent, seeds were not successfully produced (Table 2). Therefore, it was concluded that the odd1 mutant was a female sterile mutant.
When pollens of WT were pollinated on the stigmas of odd1 and WT, respectively, most pollen grains could germinate normally and pass through papilla cells to form pollen tubes, and the pollen tubes could enter the ovary through the stigma and style (Figure 12A,C). We further observed the pollen tubes in the ovary and failed to find ovules in the ovary of odd1 (Figure 12B,D). To sum up, the reason for female infertility of odd1 may be due to the absence of ovules in the mutant.

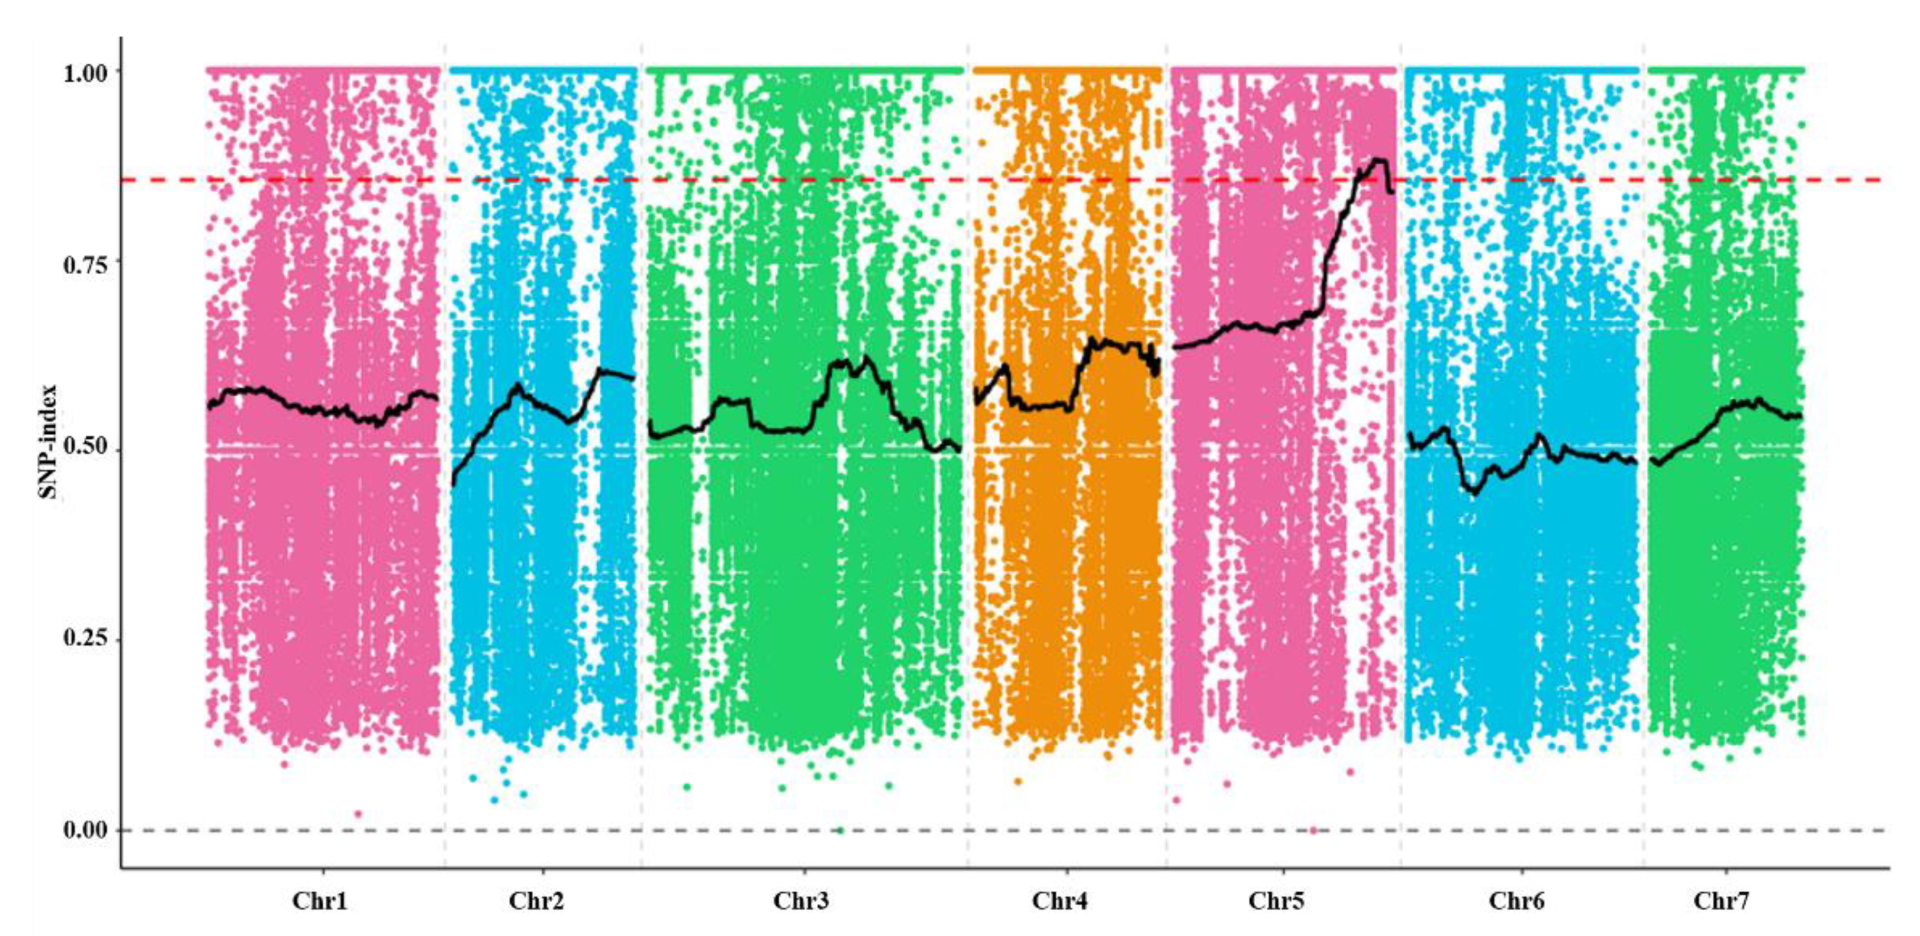
2.4. Genetic Characteristic and Mapping of odd1 Mutant

Three populations were developed for investigating the law of inheritance and mapping and cloning of odd1 (Table 3). First, odd1 was crossed with ‘Chinese long’ 9930 that has a similar phenotype with the WT to produce F1. All F1 progenies presented the WT phenotype. Then, an F2 population was obtained by F1 selfing. In the F2 segregating population, 57 of 200 exhibited the mutant phenotype (χ2 = 1.127 < χ2 0.05, 1 = 3.841; p > 0.05); in addition, a test cross (Ft, F1 was crossed with odd1 again) yielded 200 descendants comprising 97 WT and 103 mutant individuals (χ2 = 0.125 < χ2 0.05, 1 = 3.841; p > 0.05), which fit the segregation ratios of 3:1 and 1:1, respectively. These results demonstrate that the phenotype of odd1 mutant is controlled by a single recessive nuclear gene. Using the MutMap strategy, the odd1 pool in the F2 population was directly subjected to genome resequencing, and then the genomic resequencing data were compared with the genome sequence of ‘Chinese long’ 9930 (Table S1). After filtering, 179,050 SNPs were used for association analysis. SNP-index correlation analysis was performed, and the odd1 gene was successfully located on chromosome 5 with a physical distance of about 4.05 Mb (23.27–27.32 Mb) (Figure 13). Furthermore, the odd1 gene is currently being fine-mapped.

2.5. The Transcriptomic and Proteomic Profiles of odd1 Mutant

To explore the molecular mechanism underlying the abnormal growth and development of organs in odd1, we performed transcriptomic and proteomic analysis using apical buds with growth points and apical leaves of 23-day-old seedlings from mutant and WT groups.
High-throughput RNA sequencing (RNA-seq) generated 42.78 to 63.66 million single-ended reads for each sample, and three biological replicates were performed for each group (Table S2). After low quality regions and adapter sequences being removed, 38.55–59.12 (93.72–94.49%) million clean reads were mapped to the cucumber genome (http://cucurbitgenomics.org/, accessed on 20 December 2021) and combined with known gene annotations (http://cucurbitgenomics.org/organism/2, accessed on 20 December 2021) using Hisat2 (v2.0.4) (Table S2). Furthermore, 93.1–94.2% of clean reads were mapped to the annotated genes in the reference genome (Table S3). We summarized the expression level of each gene with HTSeq (v0.9.1); 24,118 genes were obtained from the six samples. Pearson correlation analysis showed high repeatability and reliability (R2 > 0.945) among three replicates (Figure S1A). Furthermore, principal component analysis displayed clear separation between WT and odd1 mutant groups (Figure S2A). Genes with adjusted p-values < 0.05 found by the DESeq R package (1.18.0) were assigned as differentially expressed genes (DEGs) between WT and mutant groups. We found 565 DEGs, in which 314 genes were significantly up-regulated, and 251 genes were significantly down-regulated in the mutant group compared to WT (Table 4). In order to validate the RNA-seq data, the expression levels of some DEGs were evaluated by qRT-PCR (quantitative RT-PCR) (Figure S3).
To examine the proteins altered by odd1, proteomic profiles were analyzed between mutant and WT groups with three biological replicates for each group. In total, 33,749 peptides, 31,738 unique peptides, and 6283 protein groups were identified, among which 5456 proteins were quantified (Table 4). Pearson correlation analysis showed high repeatability and reliability (R2 > 0.95) among three biological replicates (Figure S1B). Furthermore, principal component analysis displayed clear separation between the WT and odd1 mutant (Figure S2B). A total of 356 differentially expressed proteins (DEPs) was observed, of which 176 proteins were up-regulated, and 180 proteins were down-regulated in the mutant group compared to the WT group with a threshold of 1.2-fold and a p-value < 0.05 (Table 4).

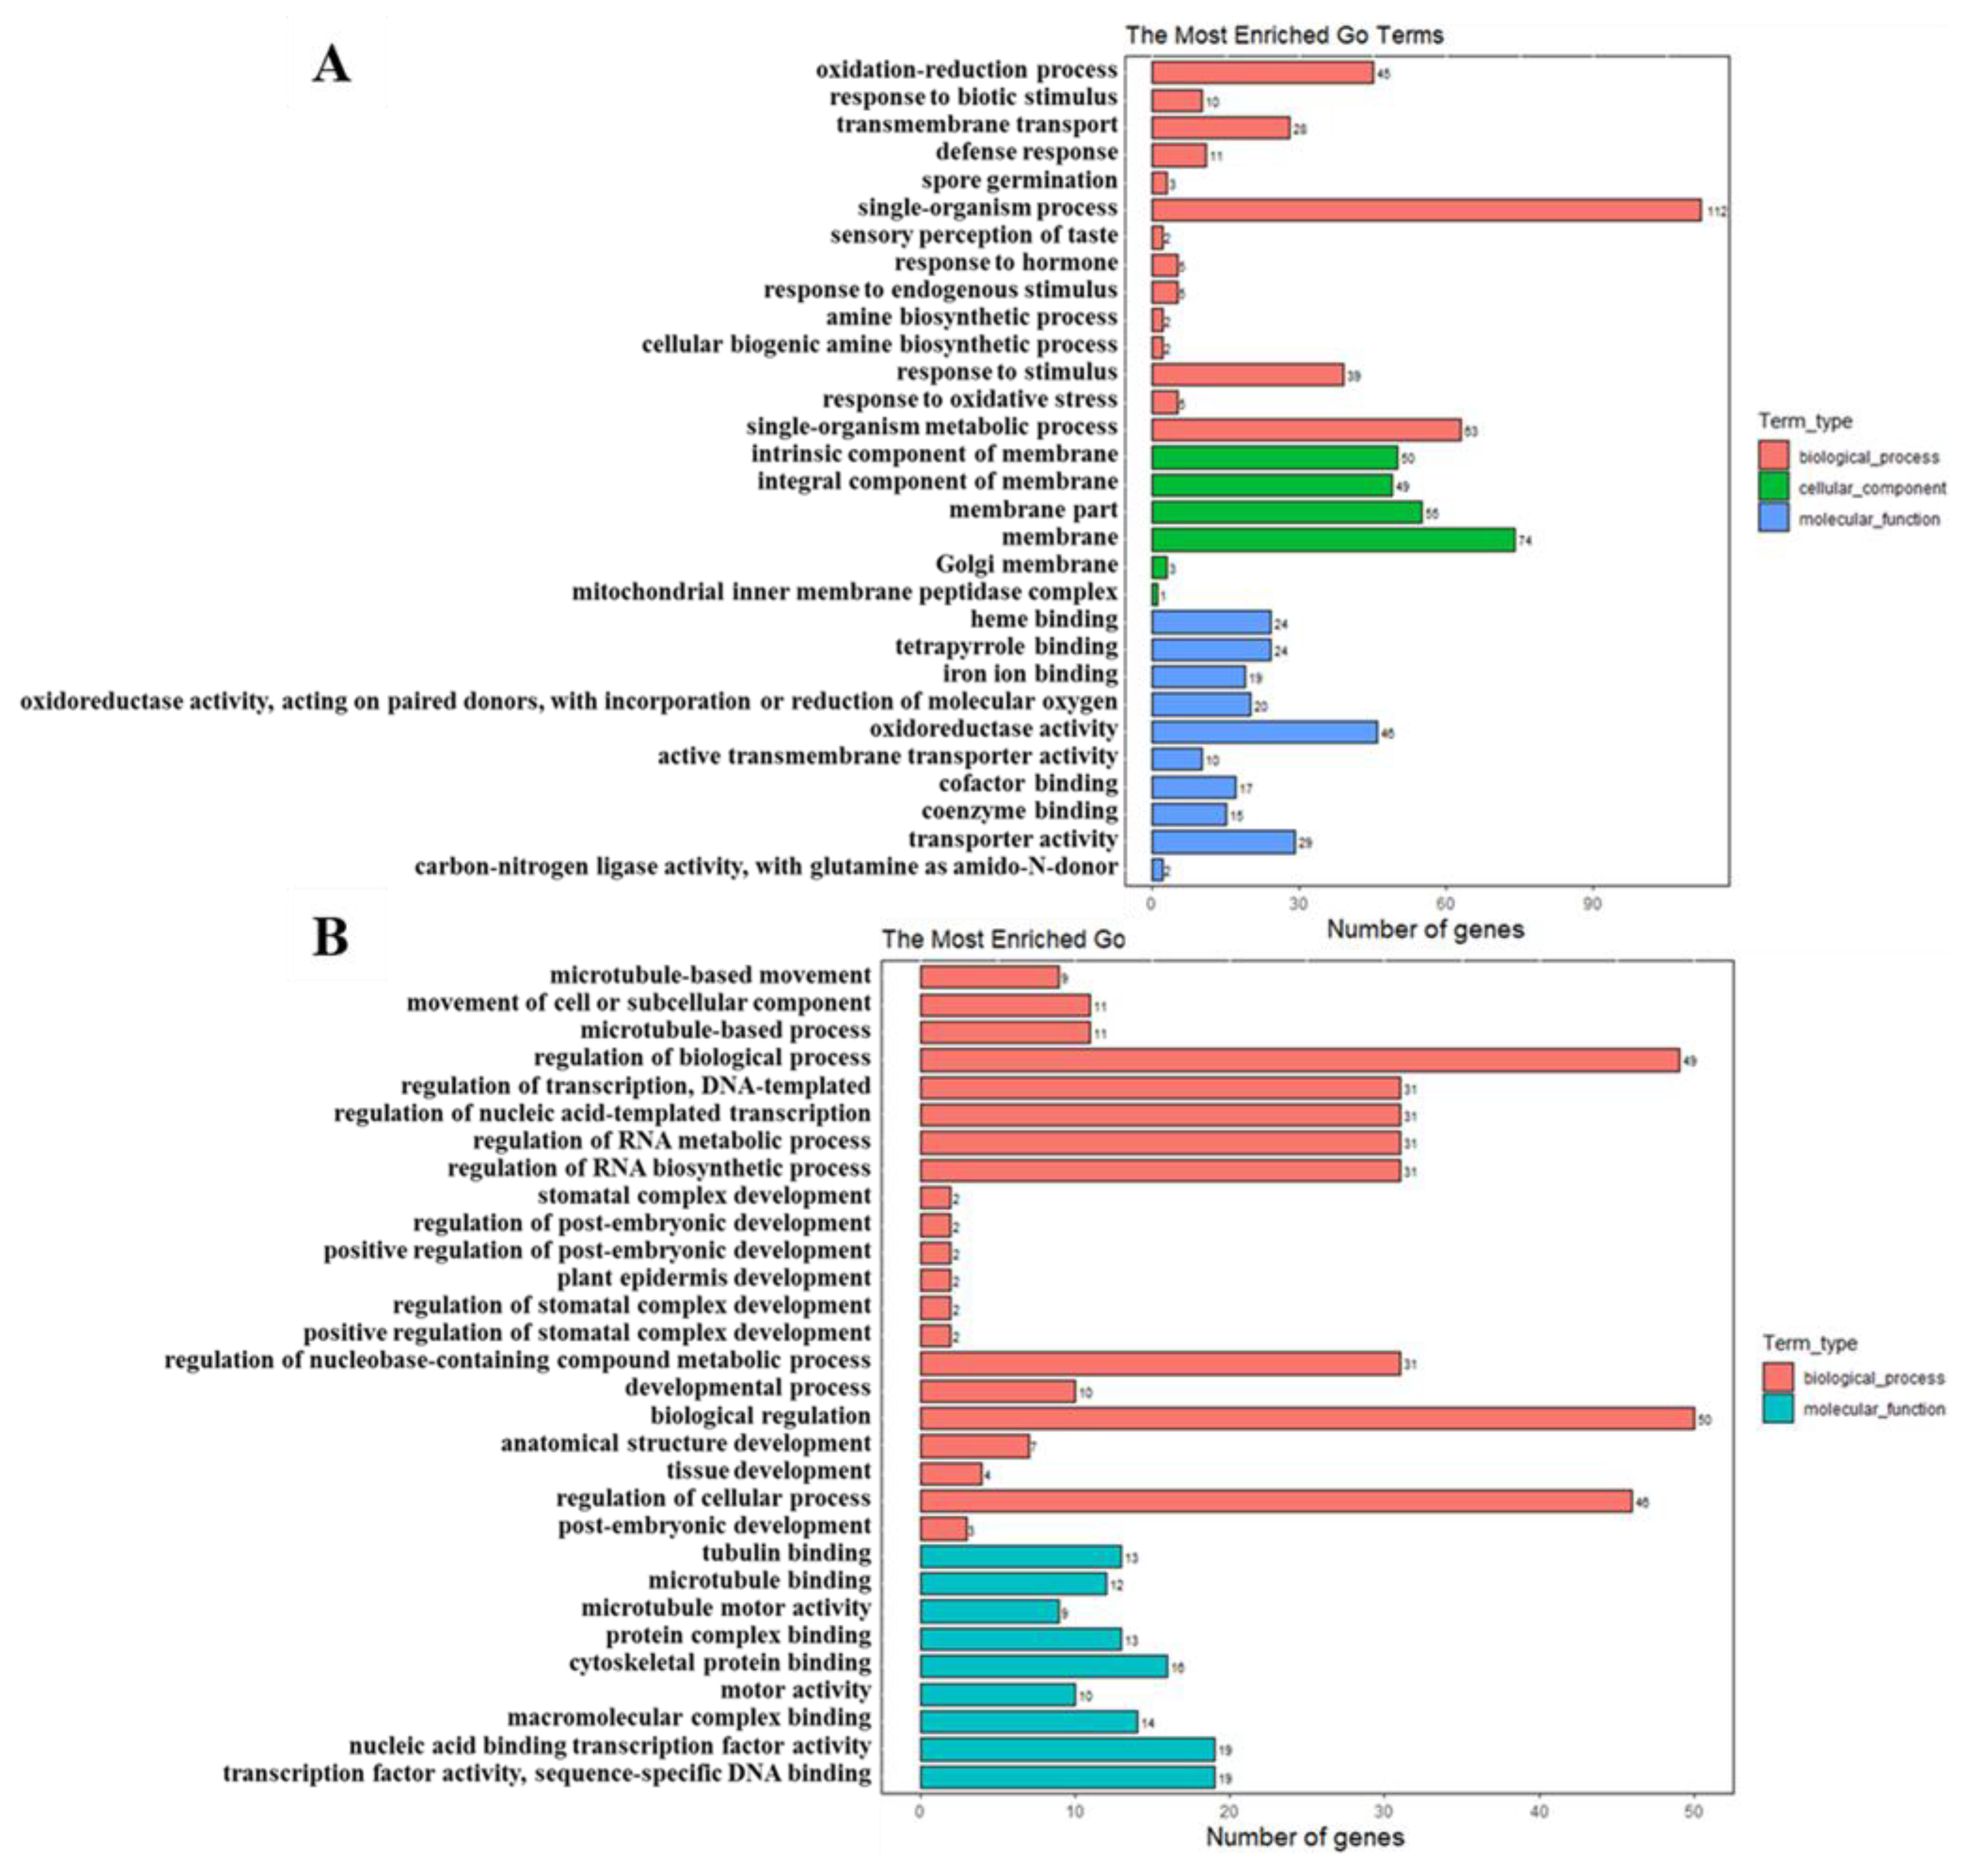
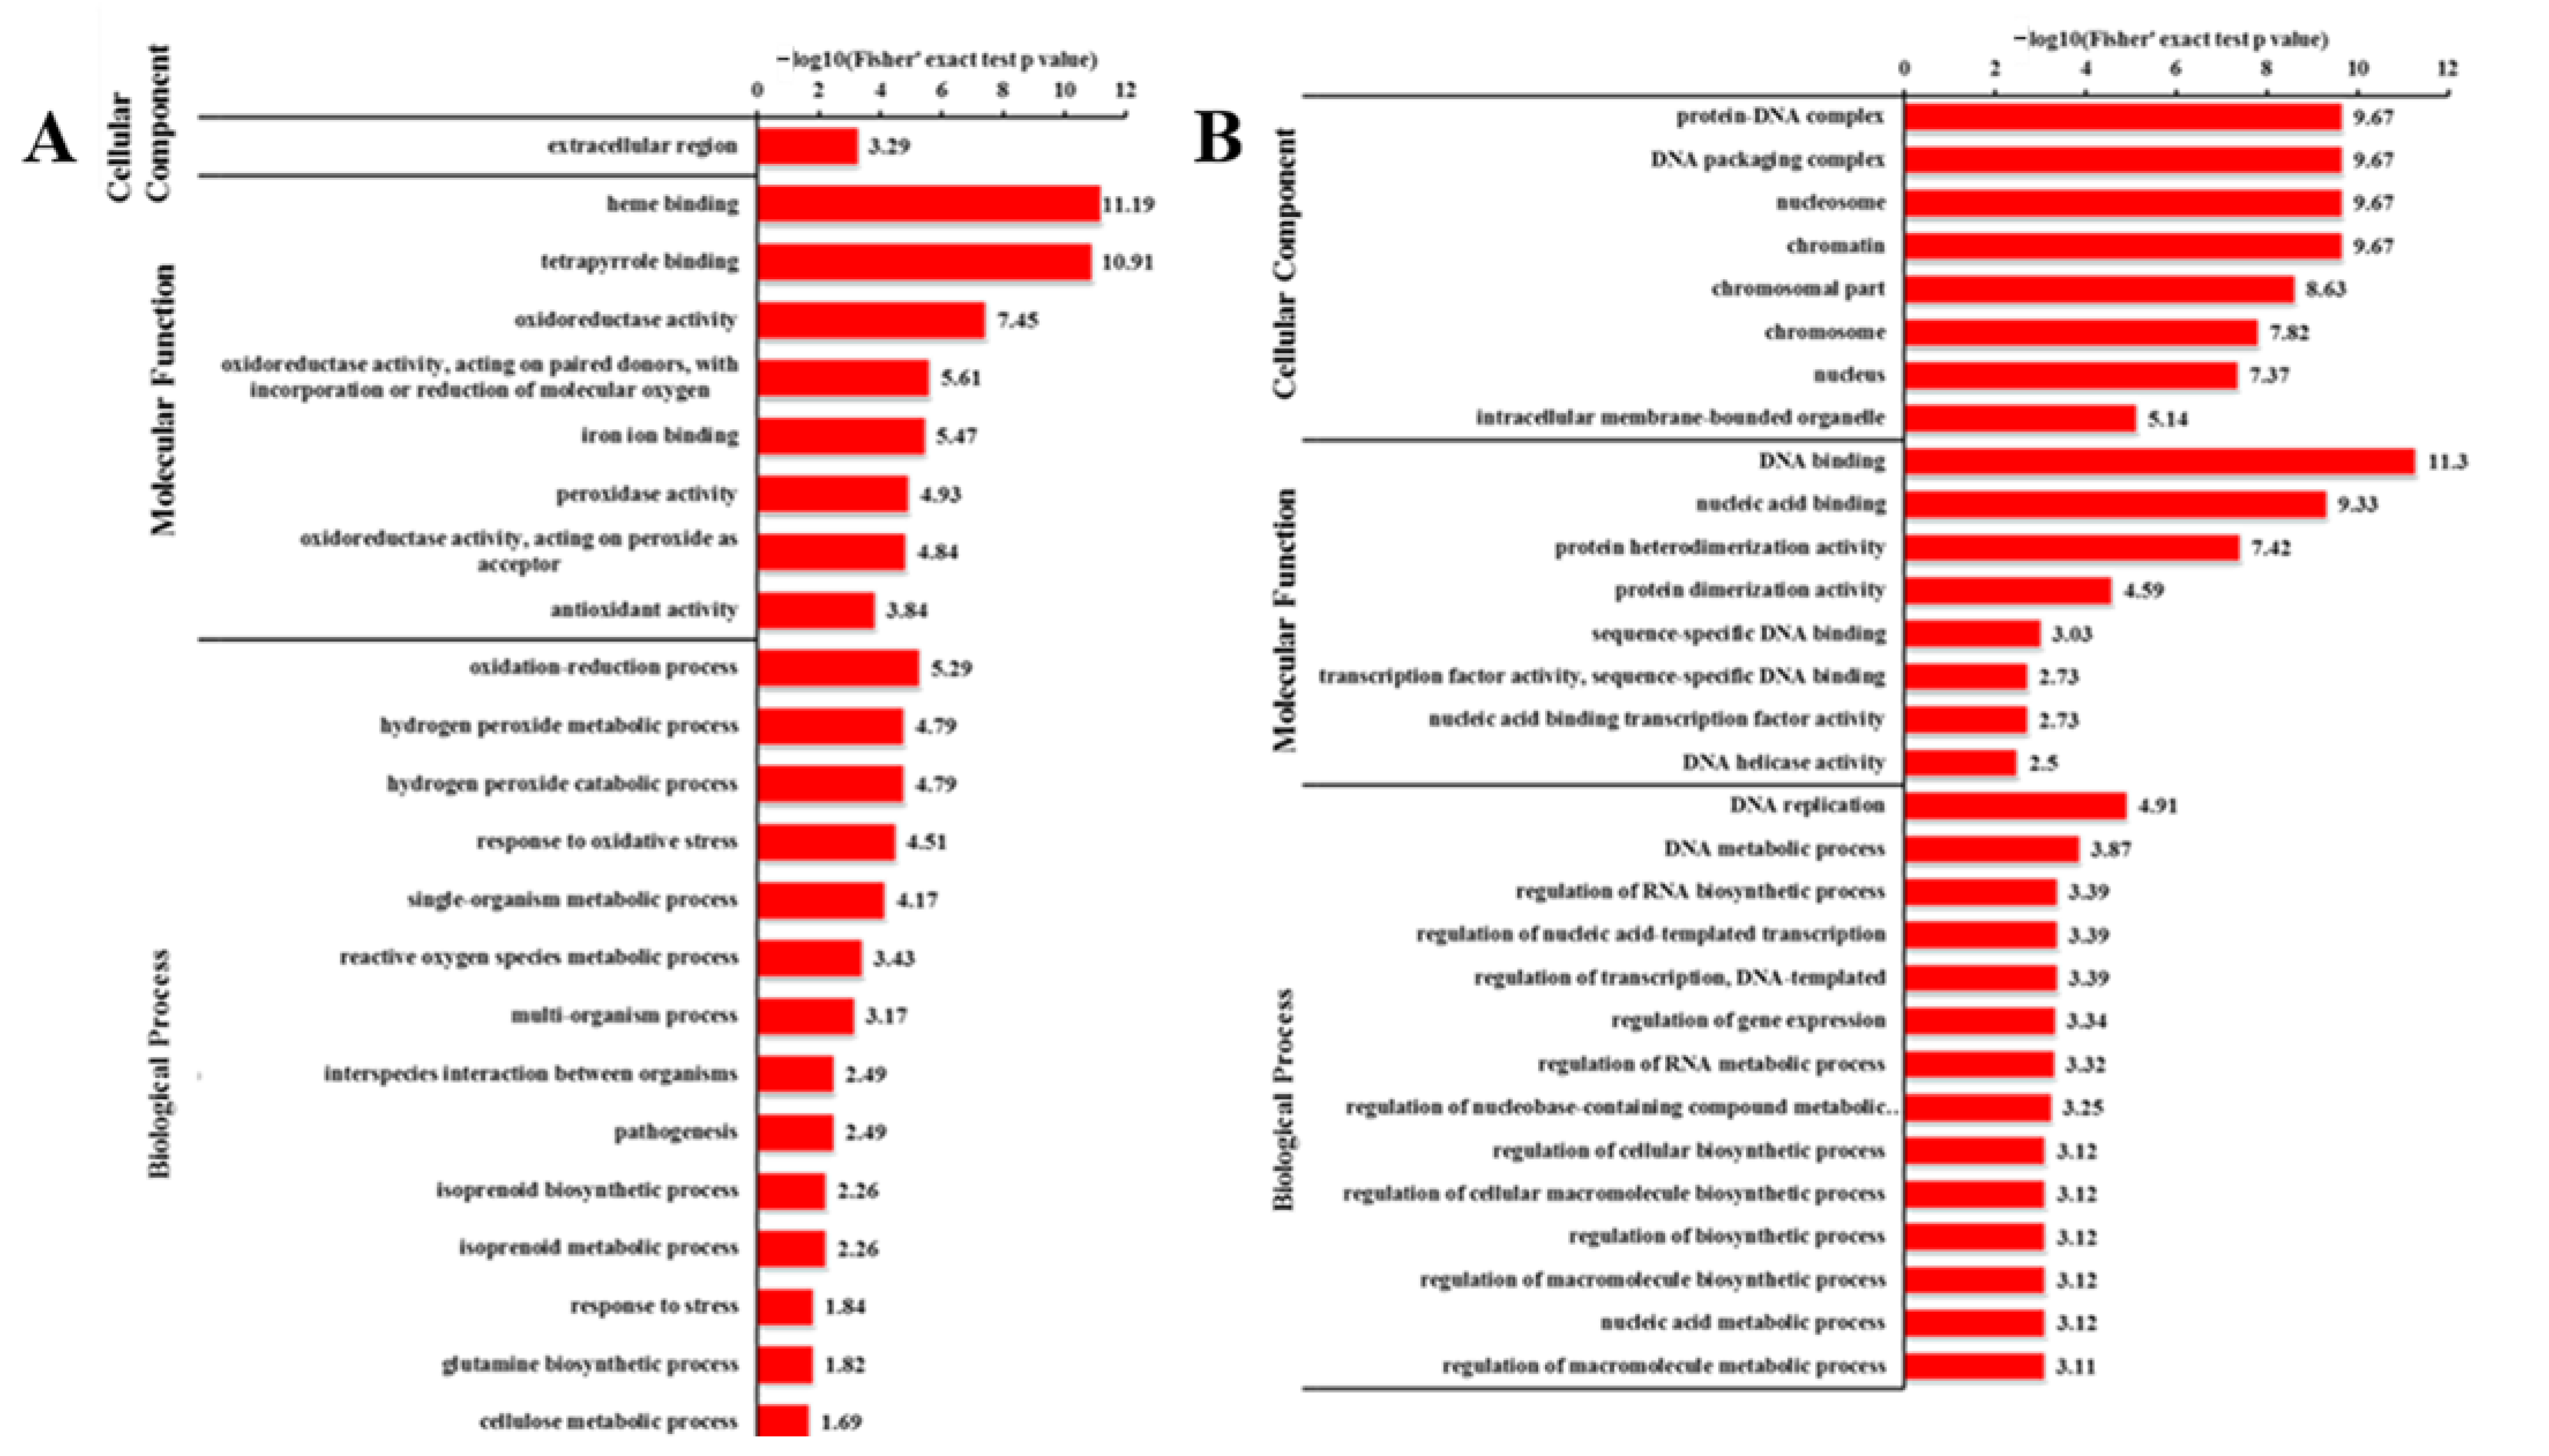
2.6. GO Analysis of DEGs and DEPs

The goal of the GO (Gene Ontology) consortium is to produce a dynamic, controlled vocabulary that can be applied to all eukaryotes, even as knowledge of gene and protein roles in cells is accumulating and changing. To further determine the function of these DEGs, GO term enrichment analysis was performed with an adjusted p-value < 0.05, and the top 30 GO terms with the most significant enrichment are shown in Figure 14A,B. The results covered a wide range of biological processes, cellular components, and molecular functions (Figure 14A,B). For the up-regulated genes in odd1, the term with the most DEGs was the ‘single-organism process’ (112 genes) in the biological process group (red in Figure 14A). Notably, a large portion of resistance-related terms including ‘oxidation–reduction process’, ‘response to biotic stimulus’, ‘defense response’, ‘response to endogenous stimulus’, ‘response to stimulus’, and ‘response to oxidative stress’ were also significantly enriched in the biological process group (red in Figure 14A). Interestingly, the significantly enriched GO terms in the cellular component group were all related to membrane, such as ‘membrane’, ‘membrane part’, and ‘integral component of membrane’ (green in Figure 14A). ‘Oxidoreductase activity’ was the category with the most DEGs in the molecular function group (blue in Figure 14A). For the genes that were down-regulated in odd1, the analysis of the biological process showed that ‘regulation of biological process’ (49 genes) was the top DEGs term (red in Figure 14B). Moreover, many development-related DEGs were significantly enriched in the biological process as follows: ‘stomatal complex development’, ‘regulation of post-embryonic development’, ‘positive regulation of post-embryonic development’, ‘plant epidermis development’, ‘regulation of stomatal complex development’, ‘positive regulation of stomatal complex development’, ‘developmental process’, ‘anatomical structure development’, ‘tissue development’, and ‘post-embryonic development’ (red in Figure 14B). In terms of molecular function, the top two DEGs terms were ‘transcription factor activity, sequence-specific DNA binding’ and ‘nucleic acid binding transcription factor activity’ (blue in Figure 14B). In addition, many of microtubule-related DEGs were highly enriched in the biological process or molecular function for the following: ‘microtubule-based movement’, ‘microtubule−based process’, ‘tubulin binding’, ‘microtubule motor activity and microtubule binding’ (Figure 14B). In the top 30 GO terms, no significantly enriched DEGs were detected in the molecular function group. These results suggest that odd1 likely promotes many resistance-related processes while inhibiting development-related and transcription factor activity processes.
To elucidate the functional differences between the down-regulated and up-regulated proteins, the quantified proteins were analyzed for GO enrichment with an adjusted p-value < 0.05 (Figure 15A,B). In the cellular component category, the up-regulated proteins were enriched in the ‘extracellular region’ (4 proteins) (Figure 15A). In the molecular function category, most of the up-regulated proteins were involved in ‘oxidoreductase activity’ (38 proteins), ‘heme binding’ (19 proteins), and ‘tetrapyrrole binding’ (19 proteins) (Figure 15A). The analysis of biological processes showed that ‘single-organism metabolic process’ (51 proteins), ‘oxidation–reduction process’ (34 proteins), ‘response to oxidative stress’ (8 proteins), ‘hydrogen peroxide metabolic process’ (6 proteins), ‘hydrogen peroxide catabolic process’ (6 proteins), and ‘reactive oxygen species metabolic process’ (6 proteins) occupied a large proportion of the up-regulated proteins (Figure 15A). In terms of down-regulated proteins, the top two DEPs terms were ‘intracellular membrane-bounded organelle’ (19 proteins) and ‘nucleus’ (17 proteins) in the cellular component (Figure 15B). The most significantly enriched GO terms were ‘DNA binding’ (26 proteins) and ‘nucleic acid binding’ (42 proteins) in the molecular function group (Figure 15B). In the biological process category, ‘nucleic acid metabolic process’ (14 proteins) was the top DEPs term (Figure 15B). These results imply that nucleic acid processing might be suppressed by the mutation of odd1, and these terms may play important roles for growth and development regulation in cucumber.

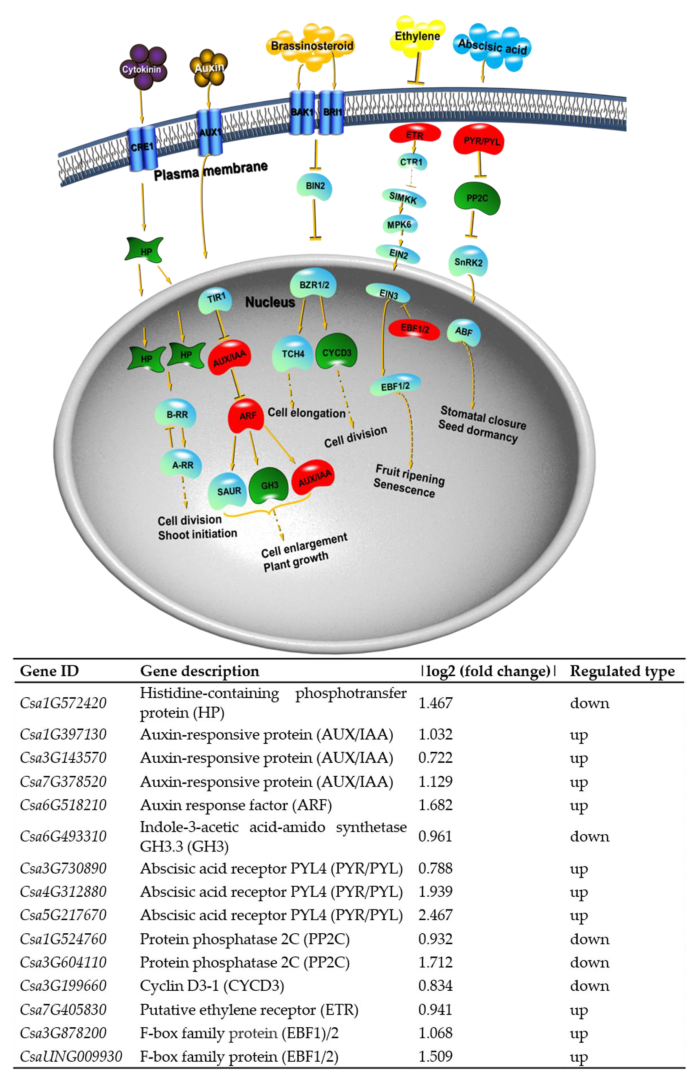
2.7. Transcription Factors Are Involved in Cucumber Growth and Development and Resistance Control

For odd1-changed transcription factor activity processes (blue in Figure 14B), we further analyzed the significantly differentially expressed transcription factors in the odd1 mutant. A total of 31 transcription factors was found to be repressed in the apical bud with the growth point and apical leaf of odd1, and they were distributed in different gene families (Table S4). These 31 genes could be subdivided into nine groups, namely AP2-EREBP, C2H2, HSF, HB, WRKY, bHLH, GRAS, and MYB, and other transcription factor genes, which displayed lower expression in the odd1 mutant with defects of growth and development, implying that these transcription factors may function as positive regulators in cucumber growth and development. By contrast, the expression of 37 transcription factors belonging to the following gene families was up-regulated in the odd1 mutant: bHLH, bZIP, HB, MYB, ARF, WRKY, NAC, C2H2, LOB, TCP, AUX/IAA, and others (Table S5). Notably, Csa1G042780, the homologous gene of WOX1 (WUSCHEL-related homeobox 1), which plays a positive role in lateral organ formation in Arabidopsis [45] and petunia [46], showed a 2.25-fold reduction in the odd1 mutant (red in Table S4). In petunia, the mutation of the WOX1 homologous gene lead to the abnormal development of pistils and longer and narrower petals and leaves [47]. CsWOX1 regulates leaf vein patterning and the development of leaf by CsPID-mediated auxin transport [15], and CsWOX1 is very important for anther and pollen development of male flowers in cucumber [48]. It is speculated that odd1 regulates the growth and development of organs by inhibiting the expression of CsWOX1 in cucumber. Moreover, many of these transcription factor-encoding genes are known to function in plant growth and development, such as Csa3G354520, a homologous gene of the bHLH domain-containing transcription factor that is involved in the regulation of cell elongation in response to BRs, GA, temperature, light, and developmental stages [36,37]; Csa6G495010 and Csa3G405510 and Csa6G040600, the homologous genes of GRAS transcription factors that exert important roles in signal transduction, meristem maintenance, and development in Arabidopsis [49]; Csa3G141860 and Csa7G071440 and Csa7G428260 and Csa1G043020 and Csa5G092930, the homologous genes of C2H2 proteins which could be involved during all the stages of reproductive development from panicle initiation till seed maturation in indica rice [50] and that control carpel numbers and ovule development in Arabidopsis [51]; Csa6G291920 and Csa6G518210 and Csa6G524670, the homologous genes of ARF transcription factors which play important roles in auxin responsive transcription [52]; Csa7G378520 and Csa1G397130 and Csa3G143570, the homologous genes of AUX/IAA transcription factors which are necessary for auxin signal transduction [53,54]; Csa4G629480 and Csa1G038340 and Csa3G824990, the homologous genes of NAC transcription factors exert important roles in secondary cell wall biosynthesis [55], leaf senescence [56,57], and lateral root development [58,59]; Csa1G020890 and Csa1G033030, the homologous genes of TCP transcription factors which participate in multiple growth processes including embryonic growth, leaf development, floral morphogenesis, cell cycle regulation, and hormone signal transduction [60]; six genes (Csa3G826690, Csa1G033200, Csa1G042350, Csa7G413890, Csa6G040640, and Csa2G100550), the homologous genes of MYB transcription factors which are involved in axillary meristem regulation, lateral organ formation, and shoot branch regulation in Arabidopsis [61]; and Csa3G751470, a homologous gene of GRF transcription factor that mainly acts as a positive regulator of cell proliferation involved in the regulation of stem and leaf development (Tables S4 and S5) [62]. These results suggest that these transcription factors might play critical roles in regulating cucumber growth and development.
Intriguingly, many resistance-related transcription factors were found significantly differentially expressed in odd1 mutant including AP2-EREBP [63], C2H2 [64], HSF [65], WRKY [66], bHLH [67], MYB [68], bZIP [69], and NAC [70]. For example, Csa7G428890, a homologous gene of the bHLH122 transcription factor that is important for drought and osmotic stress resistance in Arabidopsis [71]; Csa2G416070 and Csa5G642710, the homologous genes of bZIP transcription factors that usually play positive roles in many abiotic and biotic stress responses such as hypersensitive response (HR), salicylic acid (SA), ethylene (ET), pathogen defense, and oxidative stress [69], showed 2.4- or 1.2-fold increases in the odd1 mutant (Table S5); Csa3G141860 and Csa7G071440 and Csa7G428260 and Csa1G043020 and Csa5G092930, the homologous genes of C2H2 proteins which could be involved in different abiotic stress conditions such as low temperature, salt, drought, osmotic stress, oxidative stress, and the biotic stress signaling pathway [64]; and six genes (Csa5G155570, Csa1G075060, Csa4G630010, Csa7G447150, Csa5G612310, Csa3G357110, and Csa6G091830), the homologous genes of AP2/ERF transcription factors which are important regulators of drought, high salt, and low temperature stresses [72,73] (Tables S4 and S5). These results imply that odd1 likely promotes many resistance-related processes by regulating the expression levels of these resistance-related transcription factors.

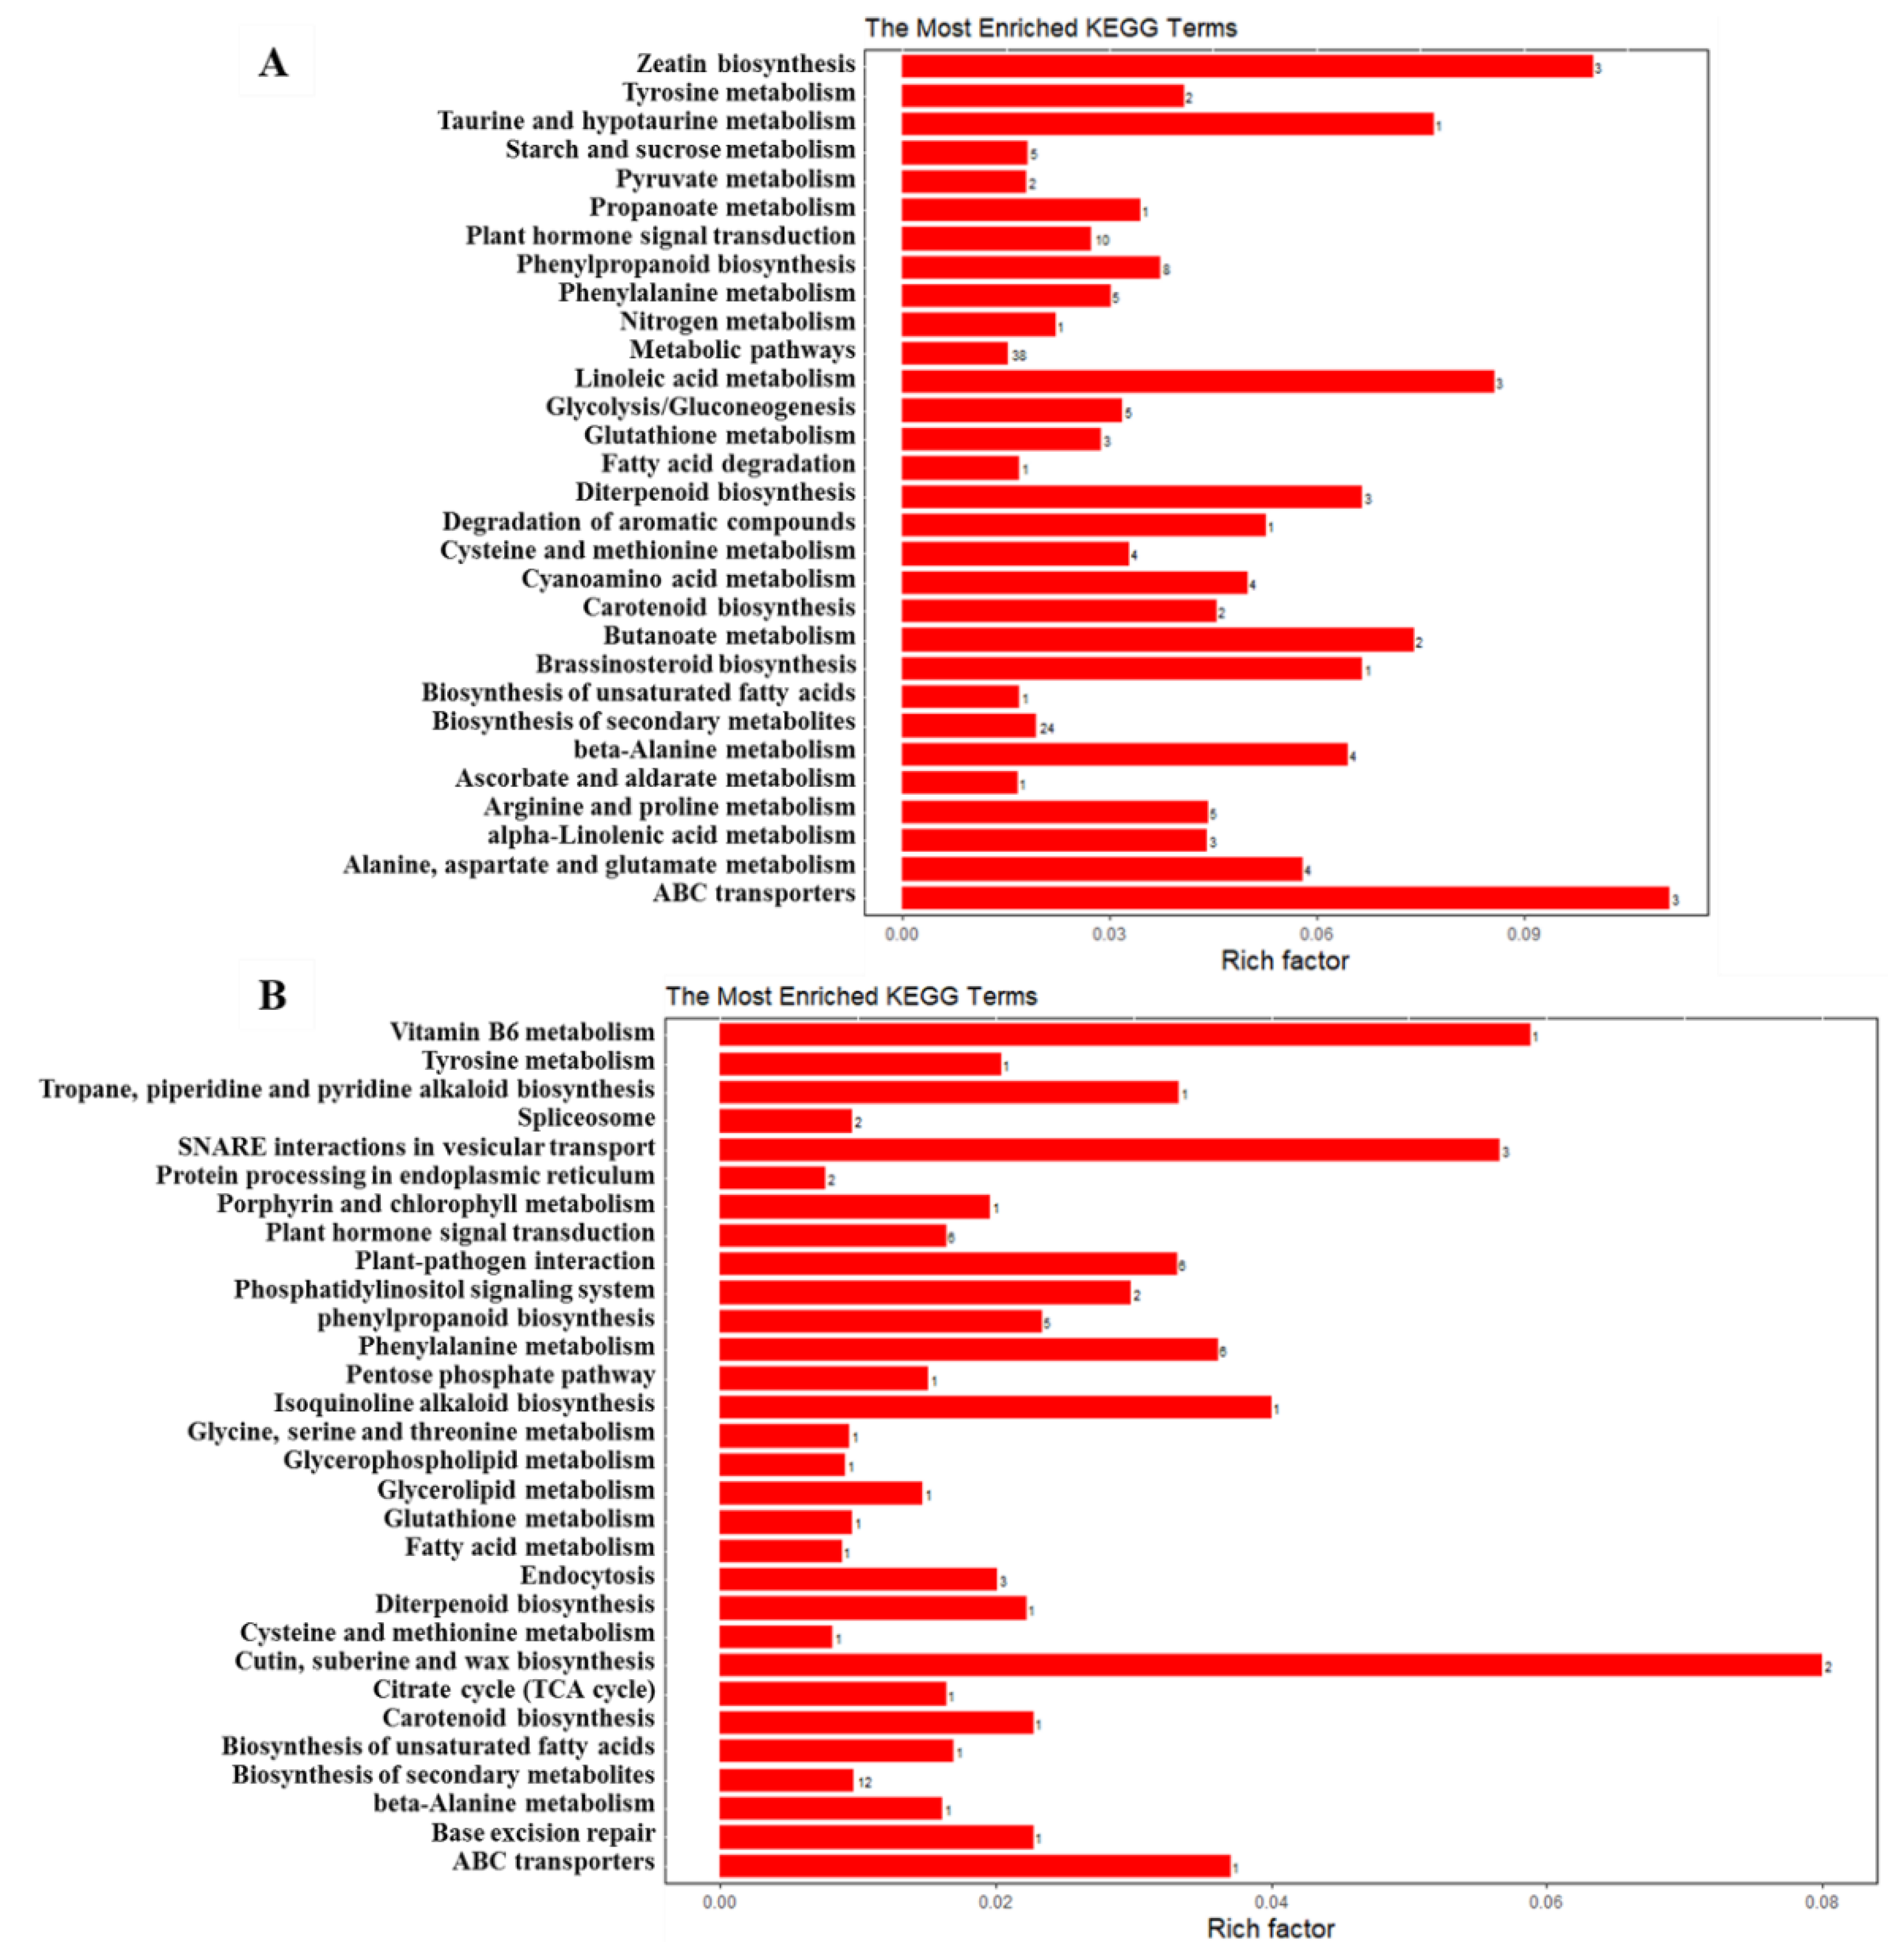
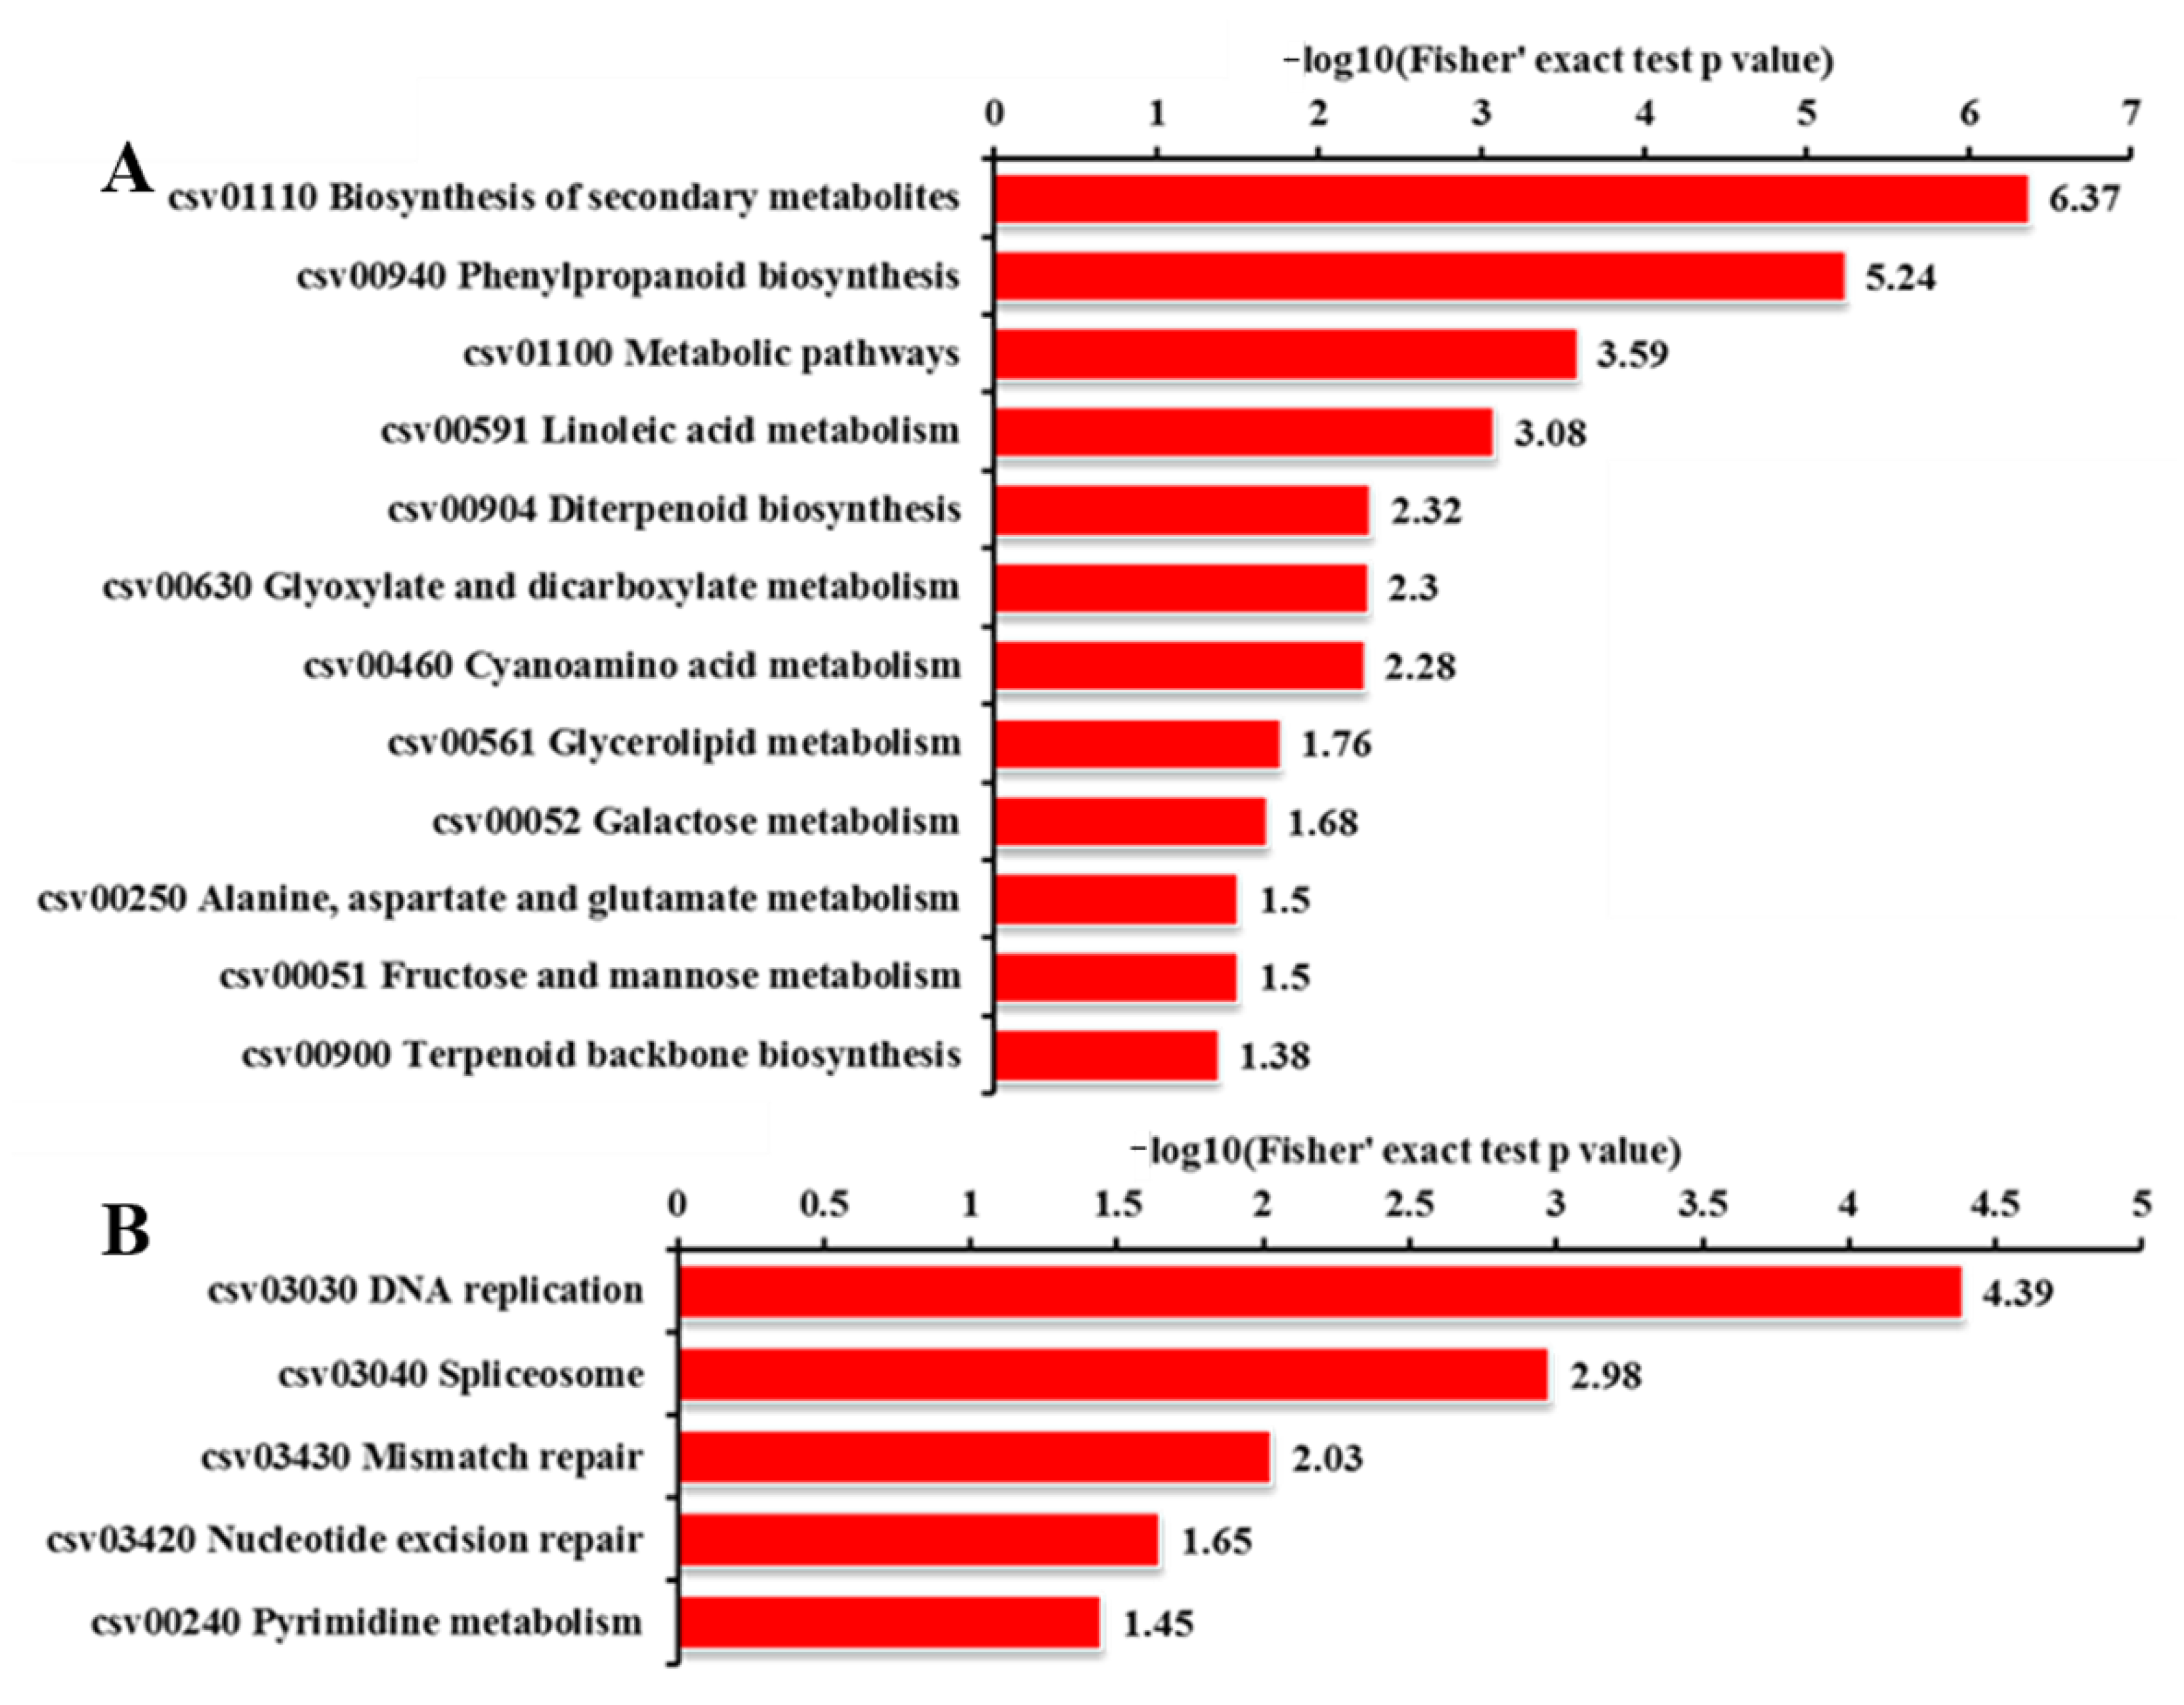
2.8. KEGG Pathway Analysis for DEGs and DEPs

We also performed KEGG (Kyoto Encyclopedia of Genes and Genomes) enrichment analysis for DEGs and DEPs with an adjusted p-value < 0.05 to reveal whether the growth and development-related genes were involved in specific pathways. The 565 DEGs were mapped to 60 KEGG pathways, and the top 20 KEGG terms with the most significant enrichment are shown in Figure 16. Among the up-regulated genes, the most enriched category was ‘ABC transporters’, followed by ‘zeatin biosynthesis’ and ‘linoleic acid metabolism’ categories (Figure 16A). Among the down-regulated DEGs, ‘cutin, suberine, and wax biosynthesis’, ‘vitamin B6 metabolism’, and ‘SNARE interactions in vesicular transport’ were significantly enriched. ‘Porphyrin and chlorophyll metabolism’, ‘carotenoid biosynthesis’, and ‘biosynthesis of unsaturated fatty acids’ were also highly enriched (Figure 16B). The pathway ‘plant hormone signal transduction’ was observed to occur among both up-regulated and down-regulated genes (Figure 16), suggesting the important role of odd1 on hormone signal transduction in cucumber. The significantly influenced genes included HP, which is involved in cytokinin signaling (Figure 17); AUX/IAA, ARF, and GH3, which are involved in auxin signaling (Figure 17); CYCD3, which is involved in brassinosteroid signaling (Figure 17); ETR and EBF1/2, which are involved in ethylene signaling (Figure 17); and PYR/PYL and PP2C, which are involved in abscisic acid signaling (Figure 17). Among the up-regulated proteins, the top three enriched pathways were ‘biosynthesis of secondary metabolites’, ‘phenylpropanoid biosynthesis’, and ‘metabolic pathways’ (Figure 18A). Moreover, the down-regulated DEPs were involved in ‘DNA replication’, ‘spliceosome’, ‘mismatch repair’, ‘nucleotide excision repair’, and ‘pyrimidine metabolism’ (Figure 18B). These results indicate that odd1 likely impacts many secondary metabolism processes. Consistent with GO analysis, nucleic acid processing was also suppressed in odd1.

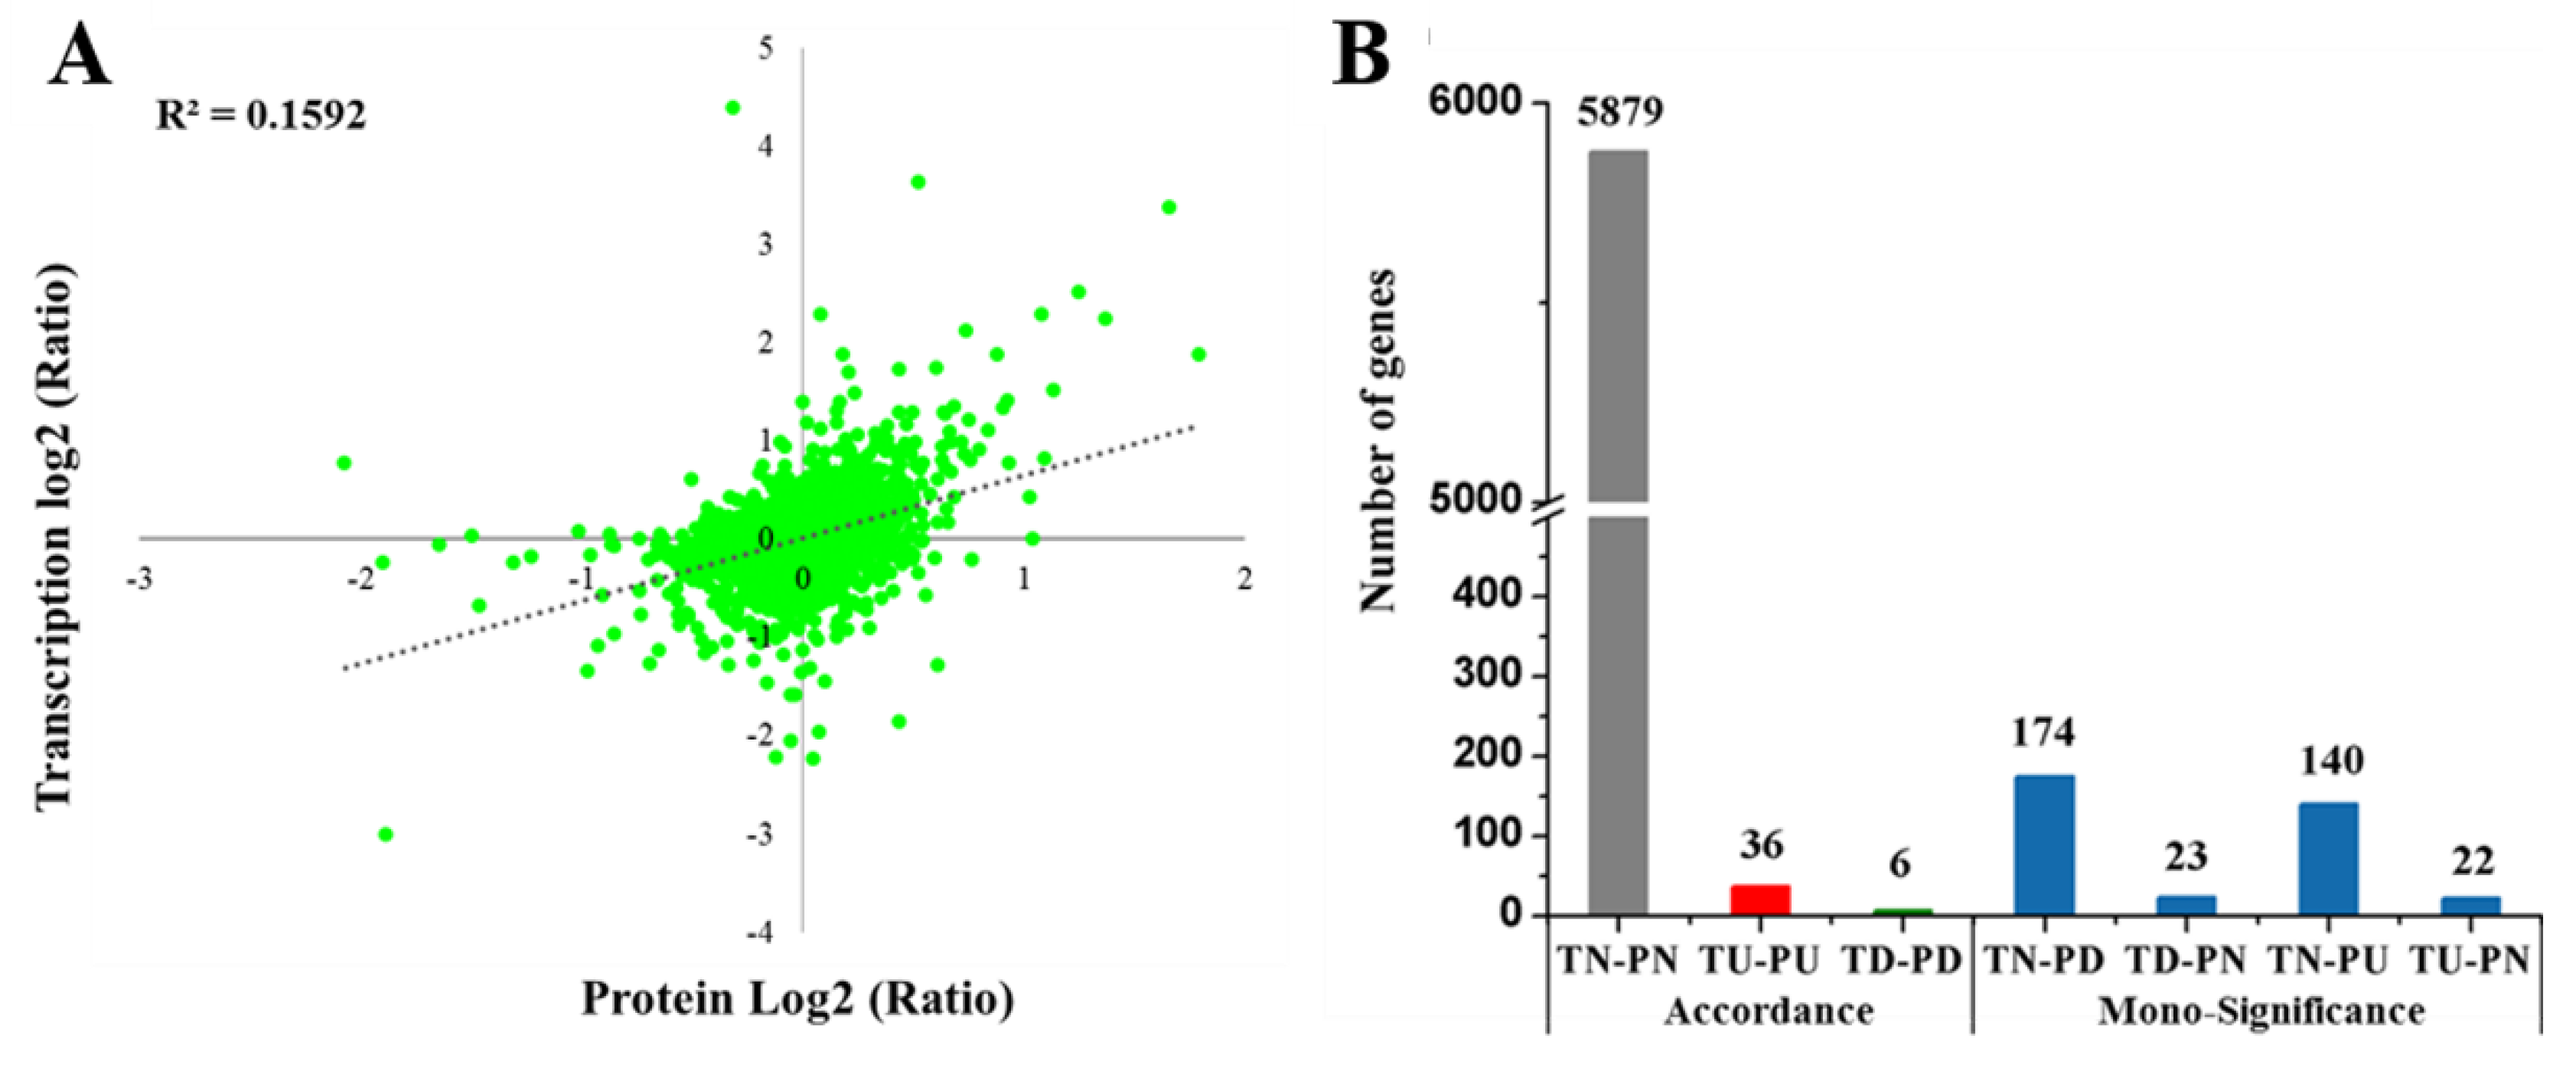
2.9. Comparison of Transcriptome and Proteome Data

We conducted a correlation analysis between the quantitative transcriptomic and proteomic data. A positive correlation of R2 = 0.1592 (R represents the Pearson correlation coefficient) was observed (Figure 19). Comparing proteomic and transcriptomic datasets, 6280 peptides or transcripts were identified both in the proteome and transcriptome (Figure S4). In more detail, 5921 members showed a consistent changing trend between the transcriptome and proteome, and 359 members showed mono-significant differences between the transcriptome and proteome. No member had opposite changing trends between the transcriptome and proteome (Figure 19B). The 87 of 565 DEGs from transcriptomic analysis had quantitative information for their respective proteins in the proteome. Forty-two genes (named as cor-DEG-DEP genes) were regulated at both the transcriptional (>1.5-fold and p < 0.05) and translational (>1.2-fold and p < 0.05) levels (Table 5). The 42 cor-DEG-DEP genes showed similar expression trends at the two levels (Figure 19B), and 36 of them were both significantly up-regulated genes (named as PU-TU genes), while another six genes were both significantly down-regulated (named as PD-TD genes) at two levels in the odd1 mutant compared to WT.

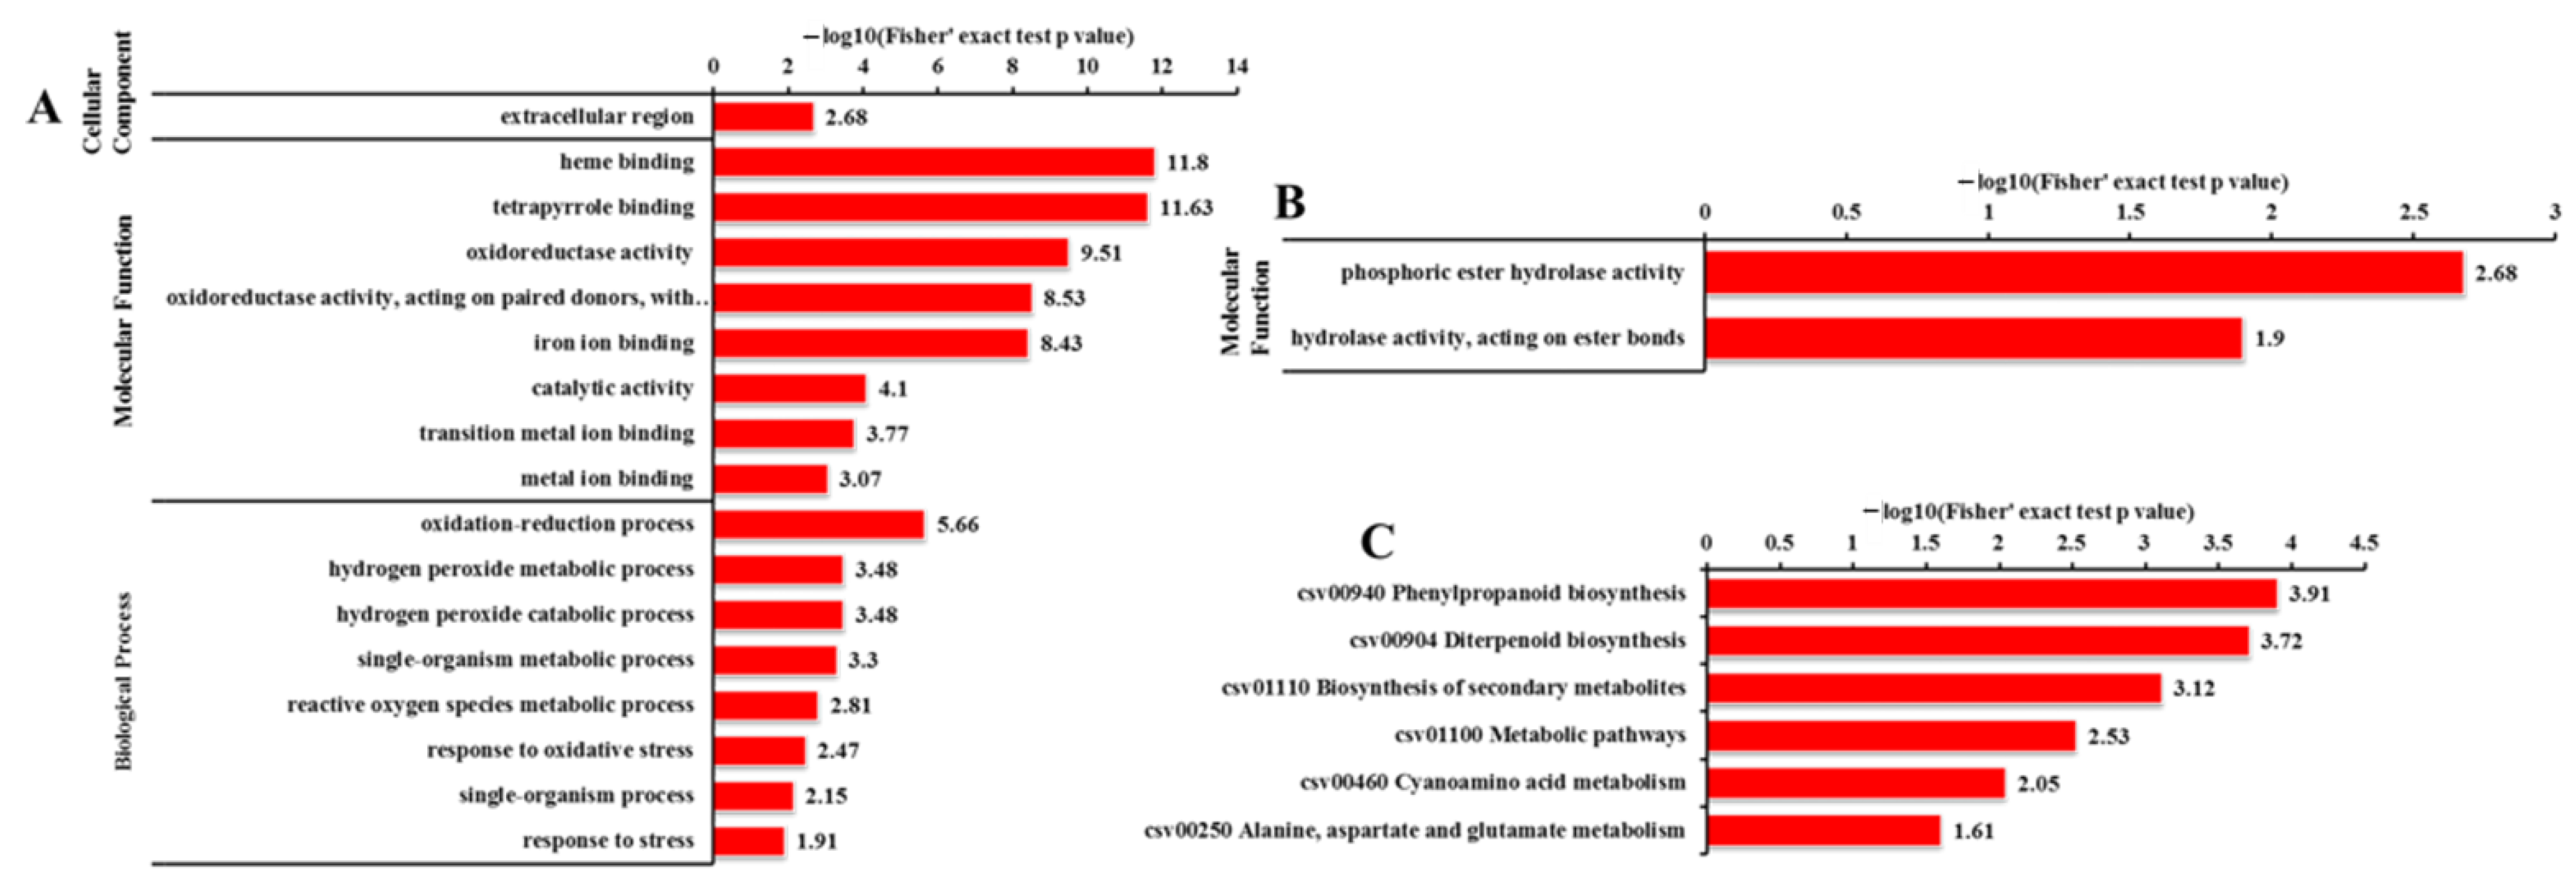
2.10. Analysis of the 42 Cor-DEG-DEP Genes

We performed GO term and KEGG enrichment analysis for the 42 cor-DEG-DEP genes (adjusted p-value < 0.05). For the PU-TU genes in odd1, ‘extracellular region’ was the only significantly enriched GO term in the cellular component group (Figure 20A). In the molecular function category, the up-regulated proteins were enriched in ‘heme binding’, ‘tetrapyrrole binding’, ‘oxidoreductase activity’, ‘oxidoreductase activity, acting on paired donors, with incorporation or reduction of molecular oxygen’, ‘iron ion binding’, ‘catalytic activity’, ‘transition metal ion binding’, and ‘metal ion binding’. ‘Oxidation–reduction process’, ‘hydrogen peroxide metabolic process’, ‘hydrogen peroxide catabolic process’, ‘single-organism metabolic process’, ‘reactive oxygen species metabolic process’, ‘response to oxidative stress’, ‘single-organism process’, and ‘response to stress’ were the highly enriched terms in biological process (Figure 20A). These genes were enriched in ‘phenylpropanoid biosynthesis’, ‘diterpenoid biosynthesis’, ‘biosynthesis of secondary metabolites’, ‘metabolic pathways’, ‘cyanoamino acid metabolism’, and ‘alanine, aspartate, and glutamate metabolism’ pathways (Figure 20B). Two PD-TD genes were enriched both in ‘phosphoric ester hydrolase activity’ and ‘hydrolase activity, acting on ester bonds’ in the molecular function (Figure 20C). Interestingly, among the PU-TU genes, a GA-regulated gene (Csa3G872170) showed a 2.4-fold change, a gene (Csa5G576590) was related to auxin efflux, and eight genes were related to cytochrome P450s (CYPs) (Table 5). We suggest that these genes and related pathways might play important roles in cucumber growth and development.

3. Discussion

Developmental mutants are ideal materials in the study of cucumber growth and development. Although several types of developmental mutants have been described in cucumber, most mutations only affect a single phenotype or organ. For example, mutation of the CsDET2 gene leads to the dwarf phenotype in cucumber [12]. The shortened fruit of sf2 is caused by the mutation of Histone Deacetylase Complex 1, which directly regulates hormone synthesis and signal transduction-related genes [18]. In this study, odd1 is a spontaneous cucumber mutant caused by a single recessive mutation, which largely affects the growth and development of the whole plant. The odd1 mutant has a much smaller plant stature, longer root system, decreased internode length and stem diameter, solid stem, smaller dark green and curled-edge cotyledons, smaller wrinkled and simultaneously ginkgo leaf-like true leaves, smaller and split petals of male and female flowers, split anthers, larger valgus and simultaneously cauliflower-like stigma, thicker style, delayed flowering, more leaves, as well as disappeared ovules (Figure 1, Figure 2, Figure 3, Figure 4, Figure 5, Figure 6, Figure 7, Figure 8, Figure 9, Figure 10, Figure 11 and Figure 12). All the above data indicate that the function of odd1 is very powerful in cucumber growth and development. Therefore, odd1 is an ideal material for studying the regulatory mechanisms of growth and development in cucumber, even in Cucurbitaceae.
The ability to regulate growth and development is important for improving planting density and productivity in cucumber breeding. We combined phenotypic and anatomical observations, physiological and cytological analyses, and an integrated profiling of the transcriptome and proteome in order to explore the possible regulation mechanisms underlying the mutant phenotype of odd1. Our results demonstrated that the decrease of cell size and cell number, and the shorter and narrower SAM in odd1 compared with the WT, could be the direct cause of the size decrease and the abnormal growth and development of organs in odd1 (Figure 6 and Figure 7). Through a series of comprehensive analyses, such as anatomical observation, pollen vigor identification, cross test, and observation of pollen germination in vivo, it was found that the pollen grains in odd1 plants was fertile, and the pollen quantity and viability decreased, but the female flowers were sterile. Further studies have shown that the main reason for female sterility of odd1 may be due to the absence of ovules in the mutant (Figure 8, Figure 9, Figure 10, Figure 11 and Figure 12).
Cucumber is an allogamous plant that can display heterosis. When crossed with female lines, the use of female sterile lines may be a very efficient way to produce hybrid seeds, since there is no need to manually isolate the flowers, which reduces the cost and improves the rate of hybrid seed production. Therefore, odd1 may be a useful female sterile line for heterosis breeding in the future. The development of male and female organs is closely related to sex differentiation and fruiting. The female sterile mutants reported so far mainly include partially female sterile [74] and male and female sterile [75,76,77,78]; odd1 can produce normal pollen, but female flowers are sterile, which is different from the above mutants. Most pollen grains of odd1 can germinate normally and pass through papilla cells to form pollen tubes, and the pollen tubes can enter the ovary through the stigma and style (Figure 11), but we failed to find ovules in the ovary, and fertilization cannot be completed (Figure 12). This is different from the previous common causes of female sterility, such as abnormal structure of female flowers [79], absence of a normal embryo sac, or abnormal endosperm [80]. More evidence is needed to better understand the reason and the regulation mechanism of female sterility in odd1.
In a deeper sense, a model that explores the molecular mechanisms underlying the abnormal growth and development of organs in the SAM of odd1 was presented (Figure 21). It has been well demonstrated that WOX family members play positive roles in key developmental processes in plants, such as embryonic patterning, stem cell maintenance, and organ formation by promoting cell division activity and preventing premature cell differentiation [31,32]. CsWOX1 showed a 2.25-fold reduction in the odd1 mutant (red in Table S4). The significantly decreased expression of WOX1 provides a possible molecular explanation for the dramatic reduction in cell size and number, some of the main reasons for the defects of growth and development in odd1. In cucumber, CsWOX1 regulates leaf vein patterning and the development of leaf by CsPID-mediated auxin transport [15], and CsWOX1 is very important for anther and pollen development of male flowers [48]. In Arabidopsis, WOX1 plays a positive role in lateral organ formation [45]. In petunia, the mutation of the WOX1 homologous gene lead to the abnormal development of pistils and longer and narrower petals and leaves [47]. It is speculated that the repression of CsWOX1 expression might be the reason for the growth and development defects in odd1. Moreover, the hormone-related genes were differentially expressed between odd1 and WT, including HP involved in CK signaling; CYCD3 involved in BR signaling; and AUX/IAA, ARF, and GH3 involved in auxin signaling, which play critical roles in regulating cell elongation and division [24]. In particular, HP (Csa1G572420), a cucumber orthologue of Arabidopsis histidine phospho transfer proteins (AHPs), which are a critical component of plant CK signaling [19], was significantly repressed in the odd1 mutant (Figure 17). A previous study suggested that AHPs function positively in CK signaling except AHP428 [81]. Mutations in these positive AHPs can result in developmental defects [82]. Moreover, CYCD3 (Csa3G199660), a D-type plant cyclin gene through which CK activates cell division [58], was significantly repressed in the odd1 mutant. In Arabidopsis, the promotion effect of BRs on cell division involves a distinct CYCD3-induction pathway [58]. In addition, BRs are steroid hormones that play essential roles in cell elongation, male fertility, senescence, and xylem differentiation [83,84]. Therefore, the significantly decreased expression of HP and CYCD3 in odd1 may serve as another main reason for the defects of growth and development in odd1. At the same time, many other TFs such as bHLH [36,37], C2H2 [38,39,40], GRAS [36,37], MYB [68], ARF [35,36], AUX/IAA [24], NAC [24], TCP [85], and GRF [24] identified in this study were also reported to affect growth and development. However, the relationship between these TFs and defects of growth and development in cucumber needs further experimental validation. In addition, one GA-regulated gene (Csa3G872170), one auxin efflux-related gene (Csa5G576590), and eight CYP450-related genes (Csa3G903550, Csa6G088160, Csa3G698490, Csa5G224130, Csa3G903540, Csa6G088710, Csa1G044890, and Csa6G088170), which were altered at both the transcriptional and translational levels (Table 5), were reported to participate in the regulation of growth and development [11,24]. In conclusion, the significantly decreased expression of CsWOX1, CsHP, and CsCYCD3, and the altered expression of other genes and hormones and TFs and proteins related to development might be the main reasons for the abnormal growth and development of organs in odd1 (Figure 21).
Plant defenses to biotic and abiotic stresses are costly and often accompanied by significant growth inhibition. Increasing evidence demonstrates the potential trade-off involved in resistance and growth [86,87]. In this study, an integrated profiling of the transcriptome and proteome revealed that odd1 likely promotes many resistance-related processes while inhibiting development-related processes because of many genes and proteins related to stresses altered in odd1 (Figure 14, Figure 15, Figure 16, Figure 18 and Figure 20 and Table S5). Our preliminary observation showed that the waterlogging tolerance of odd1 is enhanced. Further studies of waterlogging tolerance in odd1 are ongoing. At the same time, the defects of growth and development were also observed in odd1. These results suggest that odd1 might play a key regulatory role in balancing growth and development and resistance in cucumber.
In summary, the results of the present study demonstrated that the odd1 gene is a pleiotropic effector of growth and development and might be a regulator in stress responses in cucumber. Future studies, such as cloning and functional analysis of odd1, are needed to better understand the molecular mechanisms involved in the regulation of cucumber stress resistance and growth and development.

4. Materials and Methods

4.1. Plant Materials and Growth Conditions

Cucumber (Cucumis sativus L., 2n = 14) North China inbred line 09-1 (WT), ‘Chinese long’ 9930, and the odd1 mutant were used. Plants were grown with appropriate management for two generations each year from 2013 to 2022 in the standard greenhouse of the experimental field at Shandong Agricultural University. Eight to ten apical buds with growth points and apical leaves of 23-day-old seedlings from different plants were pooled together as one biological sample for the WT or mutant group for transcriptomic and proteomic analyses. Samples were immediately frozen in liquid nitrogen and stored at −80 °C until further use. All experiments were conducted at least three times with independently collected and extracted tissues unless noted otherwise.

4.2. Phenotypic Characterization and Photosynthesis-Related Parameters in the WT and odd1 Mutant

Thirty mutant and WT plants were grown in the greenhouse. At the fruit setting stage (seventy-day-old), the vine length, width of the stem, number of nodes and internode length, and leaf area (the fourth functional leaf from the top) were measured. Each parameter was determined from 15 biological repeats. Phenotypes of the cucumber plants were recorded using an optical camera (D7100, Nikon, Japan).
We measured chlorophyll content and several photosynthetic parameters in mutant and WT plants. Leaf gas exchange was measured with a Ciras-3 Portable Photosynthesis System (PP-Systems company, Amesbury, MA, USA) on the fourth functional leaves from the top at the fruit setting stage under 1000 μmol·m−2·s−1 PPFD at a controlled CO2 supply (400 mmol CO2 mol−1 air). Parameters measured included: net photosynthetic rate (Pn), stomatal conductance (gs), intercellular CO2 concentration (Ci), and transpiration rate (Tr). These leaf samples were also used for chlorophyll measurement using a mixed extracting solution (acetone:alcohol:distilled water = 4.5:4.5:1) at room temperature for 24 h and then measured with a Bio-Rad SmartSpec Plus spectrophotometer at 663 nm, 645 nm, and 470 nm, respectively, following Tang et al. [88]. Each parameter was determined from 5 biological repeats.

4.3. Cell Investigation of odd1 Mutant

We examined the cells of cotyledon epidermis, functional leaf epidermis, and petal in both genotypes with a differential interference contrast (DIC) microscope using an improved method on the basis of Han et al. [89]. The samples were discolored in a mixture containing 84% (v/v) ethanol and 14% (v/v) acetic acid at 20 °C for 12 h and subsequently dehydrated through two volume concentrations of ethanol (70% and 100%) three times. After soaking in chloral hydrate (200 g chloral hydrate, 20 g glycerol, 50 mL ddH2O) for 30 min, the samples were viewed under a DIC (Imager.Z2, ZEISS, Oberkochen, Germany). Cell area was then calculated using Image J software (v 2.1.4.7, NIH, New York, NY, USA).

4.4. Observation of SAM

We took the SAM with hypocotyl or growth points. We used pointed tweezers or surgical blades to peel off the leaves and sundries visible and retained a part of the hypocotyl or stem for easy movement. A stereoscopic microscope (ZEISS V20, Oberkochen, Germany) was used for the observations of SAM.

4.5. Pollen Quantity and Vigor Identification

The male flowers were picked on the flowering day. All fresh pollen grains of each flower were stained with Alexander solution, and the number and viability of pollen grains were observed and counted. The pollen quantity per flower was determined by the average of nine selected fields of view. Each parameter was determined from 6 biological repeats. The Alexander storage solution formula (100 mL) was as follows: 20 mL 95% ethanol, 10 mL 1% alcohol-soluble malachite green, 10 g phenol, 10 mL 1% water-soluble acid fuchsin, 1 mL 1% water-soluble orange yellow G, 4 mL glacial acetic acid, 50 mL glycerol, and added water to make up to 100 mL.

4.6. Observation of Pollen Germination In Vivo

The pollen of WT and odd1 were pollinated on the stigma of WT, respectively, and the materials were fixed with FAA fixative for 1 h, rinsed with ddH2O 3–4 times, then softened with 8 M NaOH overnight, rinsed with ddH2O 3–4 times the next day, then stained with aniline blue for 3 h in the dark. The pollen germination and pollen tube elongation were observed with a fluorescence microscope (Imager.Z2, ZEISS, Oberkochen, Germany).

4.7. Gene Preliminary Mapping

The odd1 mutant was crossed with ‘Chinese long’ 9930 to produce F2 for mapping odd1. The MutMap method was used for mapping of the odd1 gene. Thirty mutant plants from the F2 population were mixed into a sample pool to extract genomic DNA, construct a sequencing library, and subject it to genome resequencing, and then the genomic resequencing data were compared with the genome sequence of ‘Chinese Long’ 9930. After removing the low-quality SNPs, SNP-index correlation analysis was performed. The closer the SNP-index is to 1, the stronger linkage between the marker and the target gene [90].

4.8. RNA Extraction, Library Construction, and Sequencing

Total ribonucleic acid (RNA) of each sample was extracted using the Trizol kit (Ambion®, Austin, TX, USA) according to the manufacturer’s instructions. Then, total RNA was purified using RNase-free DNase I (Ambion®, Austin, TX, USA). RNA quality was verified using the RNA Nano 6000 Assay Kit of the Bioanalyzer 2100 system (Agilent Technologies, Santa Clara, CA, USA) and was also monitored on 1% RNase-free agarose gel electrophoresis. Next, mRNA was purified from total RNA using poly-T oligo-attached magnetic beads. Fragmentation was carried out using divalent cations under elevated temperature in NEBNext First Strand Synthesis Reaction Buffer (5×). First strand complementary deoxyribonucleic acid (cDNA) was synthesized using random hexamer-primed reverse transcription followed by the synthesis of the second-strand cDNA using RNase H and DNA polymerase I. After adenylation of 3′ ends of DNA fragments, NEB Next Adaptor with hairpin loop structure was ligated to prepare for hybridization. In order to select cDNA fragments of preferentially 250–300 bp in length, the library fragments were purified with an AMPure XP system (Beckman Coulter, Beverly, CA, USA). Adaptor-ligated cDNA fragments were selectively enriched using the NEB Phusion High-Fidelity DNA polymerase, Universal PCR primers, and Index (X) Primer. Products were purified with an AMPure XP system, and library quality was assessed on an Agilent Bioanalyzer 2100 system. The clustering of the index-coded samples was performed on a cBot Cluster Generation System using TruSeq PE Cluster Kit v3-cBot-HS (Illumia) according to the manufacturer’s instructions. The library preparations were sequenced on an Illumina Hiseq platform at Novogene (Tianjin, China), and 125 bp/150 bp paired-end reads were generated.

4.9. Bioinformatics Analysis of RNA-Seq Data

Clean data (clean reads) were obtained by removing reads containing adapter, reads containing ploy-N, and low-quality reads from raw data. At the same time, Q20, Q30, and GC content were calculated. All the downstream analyses were based on the clean data with high quality. Clean reads were mapped to the cucumber genome sequence (http://cucurbitgenomics.org/, (accessed on 20 December 2021) v2i) using Hisat2 v2.0.4 (Novogene, Tianjin, China). HTSeq v0.9.1 (Novogene, Tianjin, China) was used to count the read numbers mapped to each gene. Furthermore, the FPKM (fragments per kilobase of transcript sequence per million) of each gene was then calculated based on the length of the gene and reads count mapped to this gene. Genes with low expressions were removed, and only genes with an expression level of at least 1 FRPM in at least two samples were kept for further analysis. Differential expression analysis of two groups was performed using the DESeq R package (1.18.0, Novogene, Tianjin, China). The resulting p-values were adjusted using Benjamini and Hochberg’s approach for controlling the false discovery rate. GO enrichment analysis of DEGs was implemented by the GO seq R package. KOBAS software was used to test the statistical enrichment of DEGs in KEGG pathways.

4.10. Quantitative Real-Time PCR

To validate the DEGs identified by RNA-seq, we performed qRT-PCR assays using the same samples as those used in transcriptome analysis. The primers used for qRT-PCR are listed in Table S6. qRT-PCR analyses were performed using SYBR Premix Ex Taq (Mei5bio, Beijing, China) with an ABI 7500 Real-Time PCR System (Applied Biosystems, Waltham, MA, USA).

4.11. Protein Extraction

The cucumber sample (500 mg per sample) was ground in liquid nitrogen into cell powder and then transferred to a 5 mL centrifuge tube and sonicated by ultrasonic probe for 3 min three times on ice using a high-intensity ultrasonic processor (Scientz, Ningbo, China) in lysis buffer (8 M urea, 1% Triton-100, 10 mM dithiothreitol, and 1% protease inhibitor cocktail (Calbiochem, San Diego, CA, USA)). The remaining debris was removed by centrifugation at 20,000× g at 4 °C for 10 min. Finally, the protein was precipitated with cold 200 μL 20% TCA (1/4 volume of the protein solution system) for 2 h at −20 °C. After centrifugation at 12,000× g at 4 °C for 10 min, the supernatant was discarded. The remaining precipitate was washed with 1 mL cold acetone three times. The protein was redissolved in 400 μL 8 M urea, and the protein concentration was determined with a BCA kit (Beyotime, Shanghai, China) according to the manufacturer’s instructions. Three biological replicates were performed.

4.12. Trypsin Digestion

For digestion, the protein solution was reduced with 5 mM dithiothreitol for 30 min at 56 °C and alkylated with 11 mM iodoacetamide for 15 min at room temperature in darkness. The protein sample was then diluted by adding 100 mM TEAB (tetraethylammonium bromide) to a urea concentration of less than 2 M. Finally, trypsin (Promega, porcine) was added at a 1:50 trypsin-to-protein mass ratio for the first digestion overnight at 37 °C and a 1:100 trypsin-to-protein mass ratio for a second 4 h-digestion at 37 °C.

4.13. Tandem Mass Tag Labeling

After trypsin digestion, the peptide was desalted by a Strata X C18 SPE column (Phenomenex) and vacuum-dried. The peptide was reconstituted in 0.5 M TEAB and processed according to the manufacturer’s protocol for TMT kit. Briefly, 1 unit of TMT reagent were thawed and reconstituted in acetonitrile. The peptide mixtures were then incubated for 2 h at room temperature and pooled, desalted, and dried by vacuum centrifugation.

4.14. HPLC Fractionation

The tryptic peptides were then fractionated into fractions by high pH reverse-phase HPLC (mobile phase composition: buffer A contains 2% acetonitrile, buffer B contains 98% acetonitrile, pH 9.0; flow rate: 1 mL/min; Agilent Technologies 1260 Infinity) using an Agilent 300 Extend C18 column (5 μm particles, 4.6 mm ID, 250 mm length). Briefly, peptides were first separated with a gradient of 8% to 32% acetonitrile (pH 9.0) over 60 min into 60 fractions. Then, the peptides were combined into 18 fractions and dried by vacuum centrifugation. Each tube had 1 mL of elution buffer. The chromatographic peak of the peptides began from 11 min and ended at 64 min.

4.15. LC-MS/MS Analysis

The tryptic peptides were dissolved in 0.1% formic acid (solvent A) and loaded directly onto a home-made reversed-phase analytical column (15-cm length, 75 μmi.d.). The gradient was comprised of an increase from 6% to 23% solvent B (0.1% formic acid in 98% acetonitrile) over 26 min, 23% to 35% in 8 min and climbing to 80% in 3 min, and then holding at 80% for the last 3 min, all at a constant flow rate of 400 nL/min on an EASY-nLC 1000 UPLC (ultra-performance liquid chromatography) system. The peptides were subjected to an NSI (nanospray ionization) source followed by tandem mass spectrometry (MS/MS) in Q ExactiveTM Plus (Thermo, Shanghai, China) coupled online to the UPLC. The electrospray voltage applied was 2.0 kV. The m/z scan range was 350 to 1800 for a full scan, and intact peptides were detected in the Orbitrap at a resolution of 70,000. Peptides were then selected for MS/MS using an NCE setting of 28, and the fragments were detected in the Orbitrap at a resolution of 17,500. A data-dependent procedure that alternated between one MS (mass spectrometry) scan followed by 20 MS/MS scans with 15.0 s dynamic exclusion was conducted. Automatic gain control (AGC) was set at 5E4. Fixed first mass was set as 100 m/z. The above operations were completed in Jingjie PTM Biolab (Hangzhou, China).

4.16. Database Search

The resulting MS/MS data were processed using the Maxquant search engine (v.1.5.2.8, Jingjie PTM Biolab, Hangzhou, China). Tandem mass spectra were searched against a database (http://cucurbitgenomics.org/, accessed on 20 December 2021) made from RNA sequencing of cucumber in this study. Trypsin/P was specified as cleavage enzyme allowing up to 2 missing cleavages. The mass tolerance for precursor ions was set as 20 ppm in the first search and 5 ppm in the main search, and the mass tolerance for fragment ions was set as 0.02 Da. Carbamidomethyl on Cys was specified as fixed modification, and oxidation on Met was specified as variable modifications. FDR (false discovery rate) was adjusted to less than 1%, and minimum score for peptides was set to greater than 40.

4.17. Bioinformatic Analysis

Bioinformatic analysis was performed according to previously described protocols [43]. The GO annotation proteome was derived from the UniProt-GOA database (http://www.ebi.ac.uk/GOA/, accessed on 20 December 2021). Proteins were classified by GO annotation into three categories: biological process, cellular compartment, and molecular function. For each category, a two-tailed Fisher’s exact test was employed to test the enrichment of the differentially expressed protein against all identified proteins. The KEGG database was used to annotate the protein pathway [91]. Firstly, the KEGG online service tool KAAS was used to annotated proteins’ KEGG database descriptions. Then the annotation results were mapped on the KEGG pathway database using the KEGG online service tool KEGG mapper. These pathways were classified into hierarchical categories according to the KEGG website. For each category, a two-tailed Fisher’s exact test was used to test the enrichment of the differentially expressed protein against all identified proteins.

5. Conclusions

In this study, we characterized a spontaneous mutant odd1, which is controlled by a single recessive Mendelian factor that affects almost all the organs of cucumber. Therefore, odd1 is an ideal material for studying the regulatory mechanisms of growth and development in cucumber. The phenotypic, anatomical, physiological, and cytological analyses demonstrated that the decrease of cell size and cell number, and the shorter and narrower SAM in odd1 compared with the WT, were the main causes of the size decrease and the abnormal growth and development of organs in odd1. Through anatomical observation, pollen vigor identification, cross testing, and observation of pollen germination in vivo, it was found that the main reason for female sterility of odd1 may be due to the absence of ovules in the mutant. Using the MutMap strategy, the odd1 gene was successfully located on chromosome 5. Integrated profiling of the transcriptome and proteome further proved that the significantly decreased expression of CsWOX1, CsHP, and CsCYCD3, and the differences in the expression of other genes, hormones, transcription factors, and proteins related to growth and development should be the main reasons for the abnormal growth and development of organs in odd1. The model which displays the gene and protein networks in the SAM of odd1 was presented. Our study not only expanded and deepened the insight into the molecular regulation of organ growth and development in cucumber, but also provided important clues for further studies.

Supplementary Materials

The following supporting information can be downloaded at: https://www.mdpi.com/article/10.3390/ijms23105843/s1. Figure S1. Pearson correlation analysis of transcriptomic and proteomic data between all samples, respectively. Figure S2. Principal component analysis of transcriptomic and proteomic data between all samples, respectively. Figure S3. qRT-PCR validation of DEGs identified by RNA-seq. Figure S4. Transcriptomics and proteomics identified compared venn diagram. Table S1. The quality of re-sequencing data. Table S2. Summary of transcriptome sequencing data. Table S3. Mapped regions distribution in the reference genome. Table S4. List of transcription factors that were down-regulated in odd1 mutant. Table S5. List of transcription factors that were up-regulated in odd1 mutant. Table S6. Primers for qRT-PCR.

Author Contributions

Conceptualization, Z.R., L.W. and C.C. (Chunhua Chen); methodology, J.H.; software, J.H.; validation, J.H. and C.C. (Chenxing Cao); data analysis, J.H., Z.M., Z.W., C.W. and L.C.; investigation, J.H.; resources, C.C. (Chenxing Cao); data curation, J.H.; writing—original draft preparation, J.H.; writing—review and editing, Z.R.; supervision, Z.R.; project administration, Z.R., L.W. and C.C. (Chunhua Chen); funding acquisition, Z.R. All authors have read and agreed to the published version of the manuscript.

Funding

This research was funded by the National Natural Science Foundation of China (32172605 and 31872950), the Shandong ‘Double Tops’ Program (SYL2017YSTD06), and the ‘Taishan Scholar’ Foundation of the People’s Government of Shandong Province (ts20130932).

Institutional Review Board Statement

Not applicable.

Informed Consent Statement

Not applicable.

Data Availability Statement

The data presented in this study are available in this article and the Supplementary Materials.

Acknowledgments

We extend our appreciation to the anonymous reviewers for their valuable suggestions to help improve this article.

Conflicts of Interest

The authors declare no conflict of interest. The funders had no role in the design of the study; in the collection, analyses, or interpretation of data; in the writing of the manuscript, or in the decision to publish the results.

References

  1. Chen, H.; Tian, Y.; Lu, X.; Liu, X. The inheritance of two novel subgynoecious genes in cucumber (Cucumis sativus L.). Sci. Hortic. 2011, 127, 464–467. [Google Scholar] [CrossRef]
  2. Huang, S.; Li, R.; Zhang, Z.; Li, L.; Gu, X.; Fan, W.; Lucas, W.J.; Wang, X.; Xie, B.; Ni, P.; et al. The genome of the cucumber, Cucumis sativus L. Nat. Genet. 2009, 41, 1275–1281. [Google Scholar] [CrossRef] [PubMed] [Green Version]
  3. Liu, X.; Chen, J.; Zhang, X. Genetic regulation of shoot architecture in cucumber. Hortic. Res. 2021, 8, 143. [Google Scholar] [CrossRef]
  4. Gou, C.; Zhu, P.; Meng, Y.; Yang, F.; Xu, Y.; Xia, P.; Chen, J.; Li, J. Evaluation and Genetic Analysis of Parthenocarpic Germplasms in Cucumber. Genes 2022, 13, 225. [Google Scholar] [CrossRef] [PubMed]
  5. Qi, J.; Liu, X.; Shen, D.; Miao, H.; Xie, B.; Li, X.; Zeng, P.; Wang, S.; Shang, Y.; Gu, X.; et al. A genomic variation map provides insights into the genetic basis of cucumber domestication and diversity. Nat. Genet. 2013, 45, 1510–1515. [Google Scholar] [CrossRef] [PubMed]
  6. Leonard, E.R. Inter-Relations of vegetative and reproductive growth, with special reference to indeterminate plants. Bot. Rev. 1962, 28, 353–410. [Google Scholar] [CrossRef]
  7. Weng, Y.; Johnson, S.; Staub, J.E.; Huang, S. An Extended Intervarietal Microsatellite Linkage Map of Cucumber, Cucumis sativus L. HortScience 2010, 45, 882–886. [Google Scholar] [CrossRef] [Green Version]
  8. Zhao, W.S.; Chen, Z.J.; Liu, X.F.; Che, G.; Gu, R.; Zhao, J.Y.; Wang, Z.Y.; Hou, Y.; Zhang, X.L. CsLFY is required for shoot meristem maintenance via interaction with WUSCHEL in cucumber (Cucumis sativus). New Phytol. 2018, 218, 344–356. [Google Scholar] [CrossRef] [Green Version]
  9. Li, Y.; Yang, L.; Pathak, M.; Li, D.; He, X.; Weng, Y. Fine genetic mapping of cp: A recessive gene for compact (dwarf) plant architecture in cucumber, Cucumis sativus L. Theor. Appl. Genet. 2011, 123, 973–983. [Google Scholar] [CrossRef]
  10. Kubicki, B.; Soltysiak, U.; Korzeniewska, A. Induced mutation in cucumber (Cucumis sativus L.) V. Compact type of growth. Genet. Pol. 1986, 27, 289–298. [Google Scholar] [CrossRef] [Green Version]
  11. Wang, H.; Li, W.; Qin, Y.; Pan, Y.; Wang, X.; Weng, Y.; Chen, P.; Li, Y. The Cytochrome P450 Gene CsCYP85A1 Is a Putative Candidate for Super Compact-1 (Scp-1) Plant Architecture Mutation in Cucumber (Cucumis sativus L.). Front. Plant Sci. 2017, 8, 266. [Google Scholar] [CrossRef] [PubMed] [Green Version]
  12. Hou, S.; Niu, H.; Tao, Q.; Wang, S.; Gong, Z.; Li, S.; Weng, Y.; Li, Z. A mutant in the CsDET2 gene leads to a systemic brassinosteriod deficiency and super compact phenotype in cucumber (Cucumis sativus L.). Theor. Appl. Genet. 2017, 130, 1693–1703. [Google Scholar] [CrossRef] [PubMed]
  13. Zhang, C.; Chen, F.; Zhao, Z.; Hu, L.; Liu, H.; Cheng, Z.; Weng, Y.; Chen, P.; Li, Y. Mutations in CsPID encoding a Ser/Thr protein kinase are responsible for round leaf shape in cucumber (Cucumis sativus L.). Theor. Appl. Genet. 2018, 131, 1379–1389. [Google Scholar] [CrossRef] [PubMed]
  14. Yang, L.; Liu, H.; Zhao, J.; Pan, Y.; Cheng, S.; Lietzow, C.D.; Wen, C.; Zhang, X.; Weng, Y. Littleleaf (LL) encodes a WD40 repeat domain-containing protein associated with organ size variation in cucumber. Plant J. 2018, 95, 834–847. [Google Scholar] [CrossRef] [PubMed] [Green Version]
  15. Wang, H.; Niu, H.; Li, C.; Shen, G.; Liu, X.; Weng, Y.; Wu, T.; Li, Z. WUSCHEL-related homeobox1 (WOX1) regulates vein patterning and leaf size in Cucumis sativus. Hortic. Res. 2020, 7, 182. [Google Scholar] [CrossRef]
  16. Wen, C.; Zhao, W.; Liu, W.; Yang, L.; Wang, Y.; Liu, X.; Xu, Y.; Ren, H.; Guo, Y.; Li, C.; et al. CsTFL1 inhibits determinate growth and terminal flower formation through interaction with CsNOT2a in cucumber (Cucumis sativus L.). Development 2019, 146, dev180166. [Google Scholar] [CrossRef] [Green Version]
  17. Xin, T.; Zhang, Z.; Li, S.; Zhang, S.; Li, Q.; Zhang, Z.-H.; Huang, S.; Yang, X. Genetic Regulation of Ethylene Dosage for Cucumber Fruit Elongation. Plant Cell 2019, 31, 1063–1076. [Google Scholar] [CrossRef] [Green Version]
  18. Zhang, Z.; Wang, B.; Wang, S.; Lin, T.; Yang, L.; Zhao, Z.; Zhang, Z.; Huang, S.; Yang, X. Genome-wide Target Mapping Shows Histone Deacetylase Complex1 Regulates Cell Proliferation in Cucumber Fruit. Plant Physiol. 2019, 182, 167–184. [Google Scholar] [CrossRef] [Green Version]
  19. Wang, L.; Cao, C.; Zheng, S.; Zhang, H.; Liu, P.; Ge, Q.; Li, J.; Ren, Z. Transcriptomic analysis of short-fruit 1 (sf1) reveals new insights into the variation of fruit-related traits in Cucumis sativus. Sci. Rep. 2017, 7, 2950. [Google Scholar] [CrossRef]
  20. Chen, F.; Fu, B.; Pan, Y.; Zhang, C.; Wen, H.; Weng, Y.; Chen, P.; Li, Y. Fine mapping identifies CsGCN5 encoding a histone acetyltransferase as putative candidate gene for tendril-less1 mutation (td-1) in cucumber. Theor. Appl. Genet. 2017, 130, 1549–1558. [Google Scholar] [CrossRef]
  21. Rong, F.; Chen, F.; Huang, L.; Zhang, J.; Zhang, C.; Hou, D.; Cheng, Z.; Weng, Y.; Chen, P.; Li, Y. A mutation in class III homeodomain-leucine zipper (HD-ZIP III) transcription factor results in curly leaf (cul) in cucumber (Cucumis sativus L.). Theor. Appl. Genet. 2019, 132, 113–123. [Google Scholar] [CrossRef] [PubMed]
  22. Meng, W.J.; Cheng, Z.J.; Sang, Y.L.; Zhang, M.M.; Rong, X.F.; Wang, Z.W.; Tang, Y.Y.; Zhang, X.S. Type-B ARABIDOPSIS RESPONSE REGULATORs Specify the Shoot Stem Cell Niche by Dual Regulation of Wuschel. Plant Cell 2017, 29, 1357–1372. [Google Scholar] [CrossRef] [PubMed] [Green Version]
  23. Mayer, K.F.X.; Schoof, H.; Haecker, A.; Lenhard, M.; Jürgens, G.; Laux, T. Role of WUSCHEL in Regulating Stem Cell Fate in the Arabidopsis Shoot Meristem. Cell 1998, 95, 805–815. [Google Scholar] [CrossRef] [Green Version]
  24. Wang, B.; Smith, S.M.; Li, J. Genetic Regulation of Shoot Architecture. Annu. Rev. Plant Biol. 2018, 69, 437–468. [Google Scholar] [CrossRef]
  25. Yadav, R.K.; Perales, M.; Gruel, J.; Girke, T.; Jönsson, H.; Reddy, G.V. WUSCHEL protein movement mediates stem cell homeostasis in the Arabidopsis shoot apex. Genes Dev. 2011, 25, 2025–2030. [Google Scholar] [CrossRef] [Green Version]
  26. Brand, U.; Fletcher, J.C.; Hobe, M.; Meyerowitz, E.M.; Simon, R. Dependence of Stem Cell Fate in Arabidopsis on a Feedback Loop Regulated by CLV3 Activity. Science 2000, 289, 617–619. [Google Scholar] [CrossRef]
  27. Schoof, H.; Lenhard, M.; Haecker, A.; Mayer, K.; Jürgens, G.; Laux, T. The Stem Cell Population of Arabidopsis Shoot Meristems Is Maintained by a Regulatory Loop between the CLAVATA and WUSCHEL Genes. Cell 2000, 100, 635–644. [Google Scholar] [CrossRef] [Green Version]
  28. Perales, M.; Reddy, G.V. Stem cell maintenance in shoot apical meristems. Curr. Opin. Plant Biol. 2011, 15, 10–16. [Google Scholar] [CrossRef]
  29. Somssich, M.; Je, B.I.; Simon, R.; Jackson, D. CLAVATA-WUSCHEL signaling in the shoot meristem. Development 2016, 143, 3238–3248. [Google Scholar] [CrossRef] [Green Version]
  30. Pautler, M.; Tanaka, W.; Hirano, H.-Y.; Jackson, D. Grass Meristems I: Shoot Apical Meristem Maintenance, Axillary Meristem Determinacy and the Floral Transition. Plant Cell Physiol. 2013, 54, 302–312. [Google Scholar] [CrossRef]
  31. van der Graaff, E.; Laux, T.; Rensing, S.A. The WUS homeobox-containing (WOX) protein family. Genome Biol. 2009, 10, 248. [Google Scholar] [CrossRef] [PubMed]
  32. Ohmori, Y.; Tanaka, W.; Kojima, M.; Sakakibara, H.; Hirano, H.-Y. WUSCHEL-RELATED HOMEOBOX4 Is Involved in Meristem Maintenance and Is Negatively Regulated by the CLE Gene FCP1 in Rice. Plant Cell 2013, 25, 229–241. [Google Scholar] [CrossRef] [PubMed] [Green Version]
  33. Peng, J.; Richards, D.E.; Hartley, N.M.; Murphy, G.P.; Devos, K.M.; Flintham, J.E.; Beales, J.; Fish, L.J.; Worland, A.J.; Pelica, F.; et al. ‘Green revolution’ genes encode mutant gibberellin response modulators. Nature 1999, 400, 256–261. [Google Scholar] [CrossRef] [PubMed]
  34. Guo, H.; Li, L.; Aluru, M.; Aluru, S.; Yin, Y. Mechanisms and networks for brassinosteroid regulated gene expression. Curr. Opin. Plant Biol. 2013, 16, 545–553. [Google Scholar] [CrossRef]
  35. Wang, Z.-Y.; Bai, M.-Y.; Oh, E.; Zhu, J.-Y. Brassinosteroid Signaling Network and Regulation of Photomorphogenesis. Annu. Rev. Genet. 2012, 46, 701–724. [Google Scholar] [CrossRef] [PubMed]
  36. Bai, M.-Y.; Fan, M.; Oh, E.; Wang, Z.-Y. A Triple Helix-Loop-Helix/Basic Helix-Loop-Helix Cascade Controls Cell Elongation Downstream of Multiple Hormonal and Environmental Signaling Pathways in Arabidopsis. Plant Cell 2012, 24, 4917–4929. [Google Scholar] [CrossRef] [Green Version]
  37. Ikeda, M.; Fujiwara, S.; Mitsuda, N.; Ohme-Takagi, M. A Triantagonistic Basic Helix-Loop-Helix System Regulates Cell Elongation in Arabidopsis. Plant Cell 2012, 24, 4483–4497. [Google Scholar] [CrossRef] [Green Version]
  38. Dinneny, J.R.; Yadegari, R.; Fischer, R.L.; Yanofsky, M.F.; Weigel, D. The role of JAGGED in shaping lateral organs. Development 2004, 131, 1101–1110. [Google Scholar] [CrossRef] [Green Version]
  39. Ohno, C.K.; Reddy, G.V.; Heisler, M.G.B.; Meyerowitz, E.M. The Arabidopsis JAGGED gene encodes a zinc finger protein that promotes leaf tissue development. Development 2004, 131, 1111–1122. [Google Scholar] [CrossRef] [Green Version]
  40. Dinneny, J.R.; Weigel, D.; Yanofsky, M.F. NUBBIN and JAGGED define stamen and carpel shape in Arabidopsis. Development 2006, 133, 1645–1655. [Google Scholar] [CrossRef] [Green Version]
  41. Ji, J.; Yang, L.; Fang, Z.; Zhuang, M.; Zhang, Y.; Lv, H.; Liu, Y.; Li, Z. Complementary transcriptome and proteome profiling in cabbage buds of a recessive male sterile mutant provides new insights into male reproductive development. J. Proteom. 2018, 179, 80–91. [Google Scholar] [CrossRef] [PubMed]
  42. Li, J.; Ren, L.; Gao, Z.; Jiang, M.; Liu, Y.; Zhou, L.; He, Y.; Chen, H. Combined transcriptomic and proteomic analysis constructs a new model for light-induced anthocyanin biosynthesis in eggplant (Solanum melongena L.). Plant Cell Environ. 2017, 40, 3069–3087. [Google Scholar] [CrossRef] [PubMed]
  43. Guo, J.; Liu, J.; Wei, Q.; Wang, R.; Yang, W.; Ma, Y.; Chen, G.; Yu, Y. Proteomes and Ubiquitylomes Analysis Reveals the Involvement of Ubiquitination in Protein Degradation in Petunias. Plant Physiol. 2017, 173, 668–687. [Google Scholar] [CrossRef] [PubMed]
  44. Han, L.; Jiang, C.; Zhang, W.; Wang, H.; Li, K.; Liu, X.; Liu, Z.; Wu, Y.; Huang, C.; Hu, X. Morphological Characterization and Transcriptome Analysis of New Dwarf and Narrow-Leaf (dnl2) Mutant in Maize. Int. J. Mol. Sci. 2022, 23, 795. [Google Scholar] [CrossRef]
  45. Haecker, A.; Groß-Hardt, R.; Geiges, B.; Sarkar, A.; Breuninger, H.; Herrmann, M.; Laux, T. Expression dynamics of WOX genes mark cell fate decisions during early embryonic patterning in Arabidopsis thaliana. Development 2004, 131, 657–668. [Google Scholar] [CrossRef] [Green Version]
  46. Vandenbussche, M.; Horstman, A.; Zethof, J.; Koes, R.; Rijpkema, A.S.; Gerats, T. Differential recruitment of WOX transcription factors for lateral development and organ fusion in Petunia and Arabidopsis. Plant Cell 2009, 21, 2269–2283. [Google Scholar] [CrossRef] [Green Version]
  47. Lin, H.; Niu, L.; McHale, N.A.; Ohme-Takagi, M.; Mysore, K.S.; Tadege, M. Evolutionarily conserved repressive activity of WOX proteins mediates leaf blade outgrowth and floral organ development in plants. Proc. Natl. Acad. Sci. USA 2012, 110, 366–371. [Google Scholar] [CrossRef] [Green Version]
  48. Niu, H.; Liu, X.; Tong, C.; Wang, H.; Li, S.; Lu, L.; Pan, Y.; Zhang, X.; Weng, Y.; Li, Z. The WUSCHEL-related homeobox1 gene of cucumber regulates reproductive organ development. J. Exp. Bot. 2018, 69, 5373–5387. [Google Scholar] [CrossRef]
  49. Bolle, C. The role of GRAS proteins in plant signal transduction and development. Planta 2004, 218, 683–692. [Google Scholar] [CrossRef]
  50. Agarwal, P.; Arora, R.; Ray, S.; Singh, A.K.; Singh, V.P.; Takatsuji, H.; Kapoor, S.; Tyagi, A.K. Genome-wide identification of C2H2 zinc-finger gene family in rice and their phylogeny and expression analysis. Plant Mol. Biol. 2007, 65, 467–485. [Google Scholar] [CrossRef]
  51. Gaiser, J.C.; Robinson-Beers, K.; Gasser, C.S. The Arabidopsis SUPERMAN Gene Mediates Asymmetric Growth of the Outer Integument of Ovules. Plant Cell 1995, 7, 333–345. [Google Scholar] [CrossRef] [PubMed]
  52. Tiwari, S.B.; Hagen, G.; Guilfoyle, T. The Roles of Auxin Response Factor Domains in Auxin-Responsive Transcription. Plant Cell 2003, 15, 533–543. [Google Scholar] [CrossRef] [PubMed] [Green Version]
  53. Woodward, A.W.; Bartel, B. A receptor for auxin. Plant Cell 2005, 17, 2425–2429. [Google Scholar] [CrossRef] [Green Version]
  54. Quint, M.; Gray, W.M. Auxin signaling. Curr. Opin. Plant Biol. 2006, 9, 448–453. [Google Scholar] [CrossRef] [PubMed]
  55. Wang, H.-Z.; Dixon, R.A. On–Off Switches for Secondary Cell Wall Biosynthesis. Mol. Plant 2012, 5, 297–303. [Google Scholar] [CrossRef] [Green Version]
  56. Balazadeh, S.; Siddiqui, H.; Allu, A.D.; Matallana-Ramirez, L.P.; Caldana, C.; Mehrnia, M.; Zanor, M.I.; Kohler, B.; Mueller-Roeber, B. A gene regulatory network controlled by the NAC transcription factor ANAC092/AtNAC2/ORE1 during salt-promoted senescence. Plant J. 2010, 62, 250–264. [Google Scholar] [CrossRef]
  57. Guo, Y.; Gan, S. AtNAP, a NAC family transcription factor, has an important role in leaf senescence. Plant J. 2006, 46, 601–612. [Google Scholar] [CrossRef]
  58. Xie, Q.; Frugis, G.; Colgan, D.; Chua, N.-H. Arabidopsis NAC1 transduces auxin signal downstream of TIR1 to promote lateral root development. Genes Dev. 2000, 14, 3024–3036. [Google Scholar] [CrossRef] [Green Version]
  59. He, X.J.; Mu, R.L.; Cao, W.H.; Zhang, Z.G.; Zhang, J.S.; Chen, S.Y. AtNAC2, a transcription factor downstream of ethylene and auxin signaling pathways, is involved in salt stress response and lateral root development. Plant J. 2010, 44, 903–916. [Google Scholar] [CrossRef]
  60. Martín-Trillo, M.; Cubas, P. TCP genes: A family snapshot ten years later. Trends Plant Sci. 2010, 15, 31–39. [Google Scholar] [CrossRef]
  61. Lee, D.-K.; Geisler, M.; Springer, P.S. Lateral Organ Fusion1 and Lateral Organ Fusion2 function in lateral organ separation and axillary meristem formation in Arabidopsis. Development 2009, 136, 2423–2432. [Google Scholar] [CrossRef] [PubMed] [Green Version]
  62. Zhang, D.; Sun, W.; Singh, R.; Zheng, Y.; Cao, Z.; Li, M.; Lunde, C.; Hake, S.; Zhang, Z. GRF-interacting factor1 Regulates Shoot Architecture and Meristem Determinacy in Maize. Plant Cell 2018, 30, 360–374. [Google Scholar] [CrossRef] [PubMed] [Green Version]
  63. Mizoi, J.; Shinozaki, K.; Yamaguchi-Shinozaki, K. AP2/ERF family transcription factors in plant abiotic stress responses. Biochim. Biophys. Acta (BBA) Gene Regul. Mech. 2012, 1819, 86–96. [Google Scholar] [CrossRef]
  64. Kiełbowicz-Matuk, A. Involvement of plant C2H2-type zinc finger transcription factors in stress responses. Plant Sci. 2012, 185-186, 78–85. [Google Scholar] [CrossRef] [PubMed]
  65. Zhang, Q.; Geng, J.; Du, Y.; Zhao, Q.; Zhang, W.; Fang, Q.; Yin, Z.; Li, J.; Yuan, X.; Fan, Y.; et al. Heat shock transcription factor (Hsf) gene family in common bean (Phaseolus vulgaris): Genome-wide identification, phylogeny, evolutionary expansion and expression analyses at the sprout stage under abiotic stress. BMC Plant Biol. 2022, 22, 33. [Google Scholar] [CrossRef] [PubMed]
  66. Bakshi, M.; Oelmuller, R. WRKY transcription factors: Jack of many trades in plants. Plant Signal. Behav. 2014, 9, e27700. [Google Scholar] [CrossRef] [Green Version]
  67. Castilhos, G.; Lazzarotto, F.; Spagnolo-Fonini, L.; Bodanese-Zanettini, M.H.; Margis-Pinheiro, M. Possible roles of basic helix-loop-helix transcription factors in adaptation to drought. Plant Sci. 2014, 223, 1–7. [Google Scholar] [CrossRef]
  68. Ambawat, S.; Sharma, P.; Yadav, N.R.; Yadav, R.C. MYB transcription factor genes as regulators for plant responses: An overview. Physiol. Mol. Biol. Plants 2013, 19, 307–321. [Google Scholar] [CrossRef] [Green Version]
  69. Alves, M.S.; Dadalto, S.P.; Gonçalves, A.B.; De Souza, G.B.; Barros, V.A.; Fietto, L.G. Plant bZIP Transcription Factors Responsive to Pathogens: A Review. Int. J. Mol. Sci. 2013, 14, 7815–7828. [Google Scholar] [CrossRef] [Green Version]
  70. Nakashima, K.; Takasaki, H.; Mizoi, J.; Shinozaki, K.; Yamaguchi-Shinozaki, K. NAC transcription factors in plant abiotic stress responses. Biochim. Biophys. Acta Gene Regul. Mech. 2012, 1819, 97–103. [Google Scholar] [CrossRef]
  71. Liu, W.; Tai, H.; Li, S.; Gao, W.; Zhao, M.; Xie, C.; Li, W.X. bHLH122 is important for drought and osmotic stress resistance in Arabidopsis and in the repression of ABA catabolism. New Phytol. 2014, 201, 1192–1204. [Google Scholar] [CrossRef] [PubMed]
  72. Xu, Z.S.; Chen, M.; Li, L.C.; Ma, Y.Z. Functions and Application of the AP2/ERF Transcription Factor Family in Crop Improvement. J. Integr. Plant Biol. 2011, 53, 570–585. [Google Scholar] [CrossRef] [PubMed]
  73. Shen, Y.-G.; Zhang, W.-K.; He, S.-J.; Zhang, J.-S.; Liu, Q.; Chen, S.-Y. An EREBP/AP2-type protein in Triticum aestivum was a DRE-binding transcription factor induced by cold, dehydration and ABA stress. Theor. Appl. Genet. 2003, 106, 923–930. [Google Scholar] [CrossRef] [PubMed]
  74. Kato, K.K.; Palmer, R.G. Molecular mapping of four ovule lethal mutants in soybean. Theor. Appl. Genet. 2004, 108, 577–585. [Google Scholar] [CrossRef]
  75. Palmer, R.G.; Sandhu, D.; Curran, K.; Bhattacharyya, M.K. Molecular mapping of 36 soybean male-sterile, female-sterile mutants. Theor. Appl. Genet. 2008, 117, 711–719. [Google Scholar] [CrossRef]
  76. Raval, J.; Baumbach, J.; Ollhoff, A.R.; Pudake, R.N.; Palmer, R.G.; Bhattacharyya, M.K.; Sandhu, D. A candidate male-fertility female-fertility gene tagged by the soybean endogenous transposon, Tgm9. Funct. Integr. Genom. 2013, 13, 67–73. [Google Scholar] [CrossRef]
  77. Baumbach, J.; Rogers, J.P.; Slattery, R.A.; Narayanan, N.N.; Xu, M.; Palmer, R.G.; Bhattacharyya, M.K.; Sandhu, D. Segregation distortion in a region containing a male-sterility, female-sterility locus in soybean. Plant Sci. 2012, 195, 151–156. [Google Scholar] [CrossRef]
  78. Teng, C.; Du, D.; Xiao, L.; Yu, Q.; Shang, G.; Zhao, Z. Mapping and Identifying a Candidate Gene (Bnmfs) for Female-Male Sterility through Whole-Genome Resequencing and RNA-Seq in Rapeseed (Brassica napus L.). Front. Plant Sci. 2017, 8, 2086. [Google Scholar] [CrossRef]
  79. Ling, D.H.; Ma, Z.R.; Cheng, M.F. Female sterility in indica rice produced by somatic culture. Acta Genet. Sin. 1991, 18, 446–451. [Google Scholar]
  80. Awasthi, A.; Paul, P.; Kumar, S.; Verma, S.K.; Prasad, R.; Dhaliwal, H. Abnormal endosperm development causes female sterility in rice insertional mutant OsAPC6. Plant Sci. 2012, 183, 167–174. [Google Scholar] [CrossRef]
  81. Nishiyama, R.; Watanabe, Y.; Leyva-Gonzalez, M.A.; Van Ha, C.; Fujita, Y.; Tanaka, M.; Seki, M.; Yamaguchi-Shinozaki, K.; Shinozaki, K.; Herrera-Estrella, L.; et al. Arabidopsis AHP2, AHP3, and AHP5 histidine phosphotransfer proteins function as redundant negative regulators of drought stress response. Proc. Natl. Acad. Sci. USA 2013, 110, 4840–4845. [Google Scholar] [CrossRef] [PubMed] [Green Version]
  82. Hutchison, C.E.; Li, J.; Argueso, C.; Gonzalez, M.; Lee, E.; Lewis, M.W.; Maxwell, B.B.; Perdue, T.D.; Schaller, G.E.; Alonso, J.M.; et al. The Arabidopsis Histidine Phosphotransfer Proteins Are Redundant Positive Regulators of Cytokinin Signaling. Plant Cell 2006, 18, 3073–3087. [Google Scholar] [CrossRef] [PubMed] [Green Version]
  83. Altmann, T. Recent advances in brassinosteroid molecular genetics. Curr. Opin. Plant Biol. 1998, 1, 378–383. [Google Scholar] [CrossRef]
  84. Clouse, S.D.; Sasse, J.M. BRASSINOSTEROIDS: Essential Regulators of Plant Growth and Development. Annu. Rev. Plant Biol. 1998, 49, 427–451. [Google Scholar] [CrossRef] [Green Version]
  85. Davière, J.-M.; Wild, M.; Regnault, T.; Baumberger, N.; Eisler, H.; Genschik, P.; Achard, P. Class I TCP-DELLA Interactions in Inflorescence Shoot Apex Determine Plant Height. Curr. Biol. 2014, 24, 1923–1928. [Google Scholar] [CrossRef] [Green Version]
  86. Yang, D.-L.; Yao, J.; Mei, C.-S.; Tong, X.-H.; Zeng, L.-J.; Li, Q.; Xiao, L.-T.; Sun, T.-P.; Li, J.; Deng, X.-W.; et al. Plant hormone jasmonate prioritizes defense over growth by interfering with gibberellin signaling cascade. Proc. Natl. Acad. Sci. USA 2012, 109, E1192–E1200. [Google Scholar] [CrossRef] [Green Version]
  87. Li, W.; Zhu, Z.; Chern, M.; Yin, J.; Yang, C.; Ran, L.; Cheng, M.; He, M.; Wang, K.; Wang, J.; et al. A Natural Allele of a Transcription Factor in Rice Confers Broad-Spectrum Blast Resistance. Cell 2017, 170, 114–126. [Google Scholar] [CrossRef] [Green Version]
  88. Wang, Y.L.; Huang, J.F.; Wang, R.C. Change Law of Hyperspectral Data in Related with Chlorophyll and Carotenoid in Rice at Different Developmental Stages. Rice Sci. 2004, 11, 274–282. [Google Scholar] [CrossRef]
  89. Han, X.; Hu, Y.; Zhang, G.; Jiang, Y.; Chen, X.; Yu, D. Jasmonate Negatively Regulates Stomatal Development in Arabidopsis Cotyledons. Plant Physiol. 2018, 176, 2871–2885. [Google Scholar] [CrossRef] [Green Version]
  90. Abe, A.; Kosugi, S.; Yoshida, K.; Natsume, S.; Takagi, H.; Kanzaki, H.; Matsumura, H.; Yoshida, K.; Mitsuoka, C.; Tamiru, M.; et al. Genome sequencing reveals agronomically important loci in rice using MutMap. Nat. Biotechnol. 2012, 30, 174–178. [Google Scholar] [CrossRef] [Green Version]
  91. Kanehisa, M.; Goto, S. KEGG: Kyoto Encyclopedia of Genes and Genomes. Nucleic Acids Res. 2000, 28, 27–30. [Google Scholar] [CrossRef] [PubMed]
Figure 1. Phenotypic comparison between the WT and odd1 mutant. (A) Adult plants of WT (left) and odd1 (right), respectively. (B) Plant height. (C) Internode length. (D) Stem diameter. (E) Leaf area of WT and odd1 at fruit setting stage. Scale bar represents 10 cm. ‘**’ indicates very significant differences at p = 0.01 level. Vertical bars represent standard deviation (n = 15).
Ijms 23 05843 g001
Figure 2. The comparison of first female and male flower position and leaf number between the WT and odd1 mutant. (A) First female flower node of odd1 and WT. (B) First male flower node of odd1 and WT. (C) The leaf number at different developmental stages of odd1 and WT. Different letters indicate very significant differences at p = 0.01 level. Vertical bars represent standard deviation (n = 15).
Ijms 23 05843 g002
Figure 3. Phenotypic features of odd1. (A,B) The contrast of cotyledon and true leaf between WT (left) and odd1 (right) at same developmental stage. (C) The male flower and (D) female flower at anthesis (left: WT; right: odd1). Scale bars represent 1 cm.
Ijms 23 05843 g003
Figure 4. Phenotypic features of stem and fruit of odd1. (A) The contrast of stems and their transverse sections between WT (left) and odd1 (right) at same developmental stage. (B) The mature fruits of WT (left) and odd1 (right), respectively. (C) Fruit growth curves of odd1 and WT. DBA. Days before anthesis. DAA. Days after anthesis. Scale bars represent 1 cm.
Ijms 23 05843 g004
Figure 5. Phenotypic features of the root of odd1. (A) The contrast of roots between WT (left) and odd1 (right) at 21 days after germination. (B) The quantification of root length in (A). Scale bars represent 1 cm. ‘*’ indicates very significant differences at p = 0.05 level. Vertical bars represent standard deviation (n = 10).
Ijms 23 05843 g005
Figure 6. Comparison of the cell morphology between WT and odd1. (AC) The cell shape and size of the cotyledon between WT (A) and odd1 (B), and the corresponding quantifications of cell size (C). (DF) The cell phenotype of the fourth functional leaf counting from the plant apex of WT (D) and odd1 (E), and the respective quantifications of cell size (F). (GI) Petal cells at anthesis of WT (G) and odd1 (H), and the respective quantifications of cell size (I). Asterisk indicates that the cell size in WT is significantly larger than that in odd1 (single asterisk, p = 0.05; two asterisks, p = 0.01). The bars in (C,F,I) represent the standard deviation (n = 6). Scale bars represent 20 μm.
Ijms 23 05843 g006
Figure 7. The SAM of WT and odd1. (A) WT. (B) odd1. Scale bars represent 10 μm.
Ijms 23 05843 g007
Figure 8. Anatomical observations of the stamen of odd1. (A,B) The stamen of WT at anthesis. (C,D) The stamen of odd1 at anthesis. Scale bars represent 5 mm.
Ijms 23 05843 g008
Figure 9. Anatomical observations of stigma of odd1. (A,B) The stigma of WT at anthesis. (C,D) The stigma of odd1 at anthesis. Scale bars represent 5 mm.
Ijms 23 05843 g009
Figure 10. Pollen quantity and vitality of WT and odd1. (A,B) Pollen viability of WT and odd1. (C) The respective quantifications of pollen number in a single field of view. (D) The respective quantifications of vital pollen grains. Asterisk indicates significant differences (single asterisk, p = 0.05). The bars in C and D represent the standard deviation (n = 6). Scale bars represent 200 μm.
Ijms 23 05843 g010
Figure 11. Fluorescence microscopic observation of pollen germination and pollen tube growth after pollination. (A) WT. (B) odd1. Scale bars represent 200 μm.
Ijms 23 05843 g011
Figure 12. Fluorescence microscopic observation of pollen germination and pollen tube growth after pollination. (A,B) WT. (C,D) odd1. Scale bars represent 200 μm.
Ijms 23 05843 g012
Figure 13. The association analysis of the SNP-index.
Ijms 23 05843 g013
Figure 14. GO enrichment analysis of DEGs. (A) GO enrichment analysis of significantly up-regulated genes. (B) GO enrichment analysis of significantly down-regulated genes.
Ijms 23 05843 g014
Figure 15. GO enrichment analysis of DEPs. (A) GO enrichment analysis of significantly up-regulated proteins. (B) GO enrichment analysis of significantly down-regulated proteins.
Ijms 23 05843 g015
Figure 16. KEGG pathway analysis of DEGs. (A) KEGG pathway analysis of significantly up-regulated genes. (B) KEGG pathway analysis of significantly down-regulated genes.
Ijms 23 05843 g016
Figure 17. Schematic representation of significantly enriched pathways of plant hormone signal transduction in odd1 vs. WT. Red shapes indicate up-regulation in odd1 vs. WT; green shapes indicate down-regulation in odd1 vs. WT; and blue shapes indicate no significant changes in odd1 vs. WT.
Ijms 23 05843 g017
Figure 18. KEGG pathway analysis of DEPs. (A) KEGG pathway analysis of significantly up-regulated proteins. (B) KEGG pathway analysis of significantly down-regulated proteins.
Ijms 23 05843 g018
Figure 19. Combined transcriptome and proteome analysis of odd1. (A) The correlation analysis of abundance changes from transcriptome to proteome. (B) Comparison of significant differences between the transcriptome and proteome. T: transcript; P: protein species; N: no change; U: up-accumulation; D: down-accumulation.
Ijms 23 05843 g019
Figure 20. GO and KEGG analyses of the 42 cor-DEG-DEP genes. (A) GO enrichment analysis of PU-TU genes. (B) KEGG pathway analysis of PU-TU genes. (C) KEGG pathway analysis of PD-TD genes. T: transcript; P: protein species; N: no change; U: up-accumulation; D: down-accumulation.
Ijms 23 05843 g020
Figure 21. Model diagram of expression changes of growth and developmental regulatory genes and proteins in odd1 vs. WT. Red indicates up-regulation in odd1 vs. WT; green indicates down-regulation in odd1 vs. WT; and purple indicates both up-regulated and down-regulated genes in odd1 vs. WT.
Ijms 23 05843 g021
Table 1. Photosynthetic parameters of WT and odd1 mutant at the fruit-setting stage.
GenotypeChlorophyll a (mg/g FW)Chlorophyll b (mg/g FW)Carotenoid
(mg/g FW)
Pn
(μmol·m−2·s−1)
Gs
(mmol·m−2·s−1)
Ci
(μmol·mol−1)
Tr
(mmol·m−2·s−1)
WT9.34 ± 0.39 a2.95 ± 0.15 a1.94 ± 0.09 a26.51 ± 1.25 a817.24 ± 109.69 a242.60 ± 6.27 a6.11 ± 0.46 a
odd16.99 ± 0.63 b2.51 ± 0.23 b1.52 ± 0.18 b21.30 ± 1.81 b465.6 ± 94.81 b221.00 ± 13.77 b5.51 ± 0.46 a
Table 2. Seed setting by selfing and hybridization.
TypesSeeds
odd1 (selfing)no
WT (selfing)yes
odd1♀ × WT♂no
WT♀ × odd1yes
Table 3. Segregation of the odd1 phenotype in the F1, F2, and Ft populations in cucumber.
Populations# of Plants Observed# WT# odd1Expected WT
to odd1 Ratio
χ2 Valuep Value
(Chinese long 9930×odd1) F1161601:0//
(F1 selfing) F2200143573:11.1270.289
(F1×odd1) Ft200971031:10.1250.724
Table 4. Summary of the number of proteins and mRNA detected in WT and odd1 mutant.
CategoryProteinsmRNAs
Unique protein/gene detected628324,118
Significantly changed proteins/genes356565
Up-regulated176314
Down-regulated180251
Table 5. List of the 42 cor-DEG-DEP genes that were regulated at both transcriptional and translational levels.
Gene IDGene DescriptionFold Change (odd1/WT)p ValueRegulated Type
Csa2G238880Non-symbiotic hemoglobin 10.2710.000162Down
Csa3G872170Gibberellin-regulated protein2.3820.000364Up
Csa6G085120Hfr-2-like protein3.1540.000364Up
Csa1G187170Unknown protein2.1410.000456Up
Csa2G055560Choline dehydrogenase2.1130.000776Up
Csa6G085110Hfr-2-like protein3.4620.000864Up
Csa6G109750UDP-glucosyltransferase, putative1.4230.000962Up
Csa2G023940Lipoxygenase2.1980.000978Up
Csa7G073410Leucine-rich repeat receptor-likeserine/threonine-protein kinase1.5880.000979Up
Csa5G410730Glutamine synthetase1.8750.00112Up
Csa1G188680Xyloglucan endotransglucosylase/hydrolase1.560.00136Up
Csa3G903550Putative cytochrome P450superfamily protein1.7420.00164Up
Csa2G009470Betaine aldehyde dehydrogenase0.7780.00184Down
Csa1G151000Stress responsive A/B barrel domainfamily protein1.3860.00268Up
Csa6G088160Cytochrome P450, putative1.6860.00274Up
Csa6G522760Ycf23 protein0.7010.00274Down
Csa3G698490Cytochrome P4501.3460.00338Up
Csa7G414480Short-chain dehydrogenase/reductasefamily protein1.3620.00356Up
Csa5G224130Cytochrome P4501.3070.0037Up
Csa1G541390Phosphatidylinositol transfer protein sfh50.720.00418Down
Csa7G447020Probable peptide/nitrate transporter1.4580.00504Up
Csa3G903540Putative cytochrome P450superfamily protein1.7950.00516Up
Csa6G490110Methylesterase1.5850.0062Up
Csa3G778270Short-chain dehydrogenase/reductase 21.3080.00648Up
Csa3G778280Short-chain dehydrogenase/reductase 21.440.00694Up
Csa6G088710Cytochrome P4501.5470.00728Up
Csa6G088700Anthranilate N-benzoyltransferaseprotein, putative1.6470.00966Up
Csa7G451920Putative phosphatase0.5260.00994Down
Csa1G044890Cytochrome P4501.9070.014Up
Csa4G285730Peroxidase1.6680.0154Up
Csa6G183190Asparagine synthetase1.520.0162Up
Csa1G611290Beta-glucosidase D71.5660.0171Up
Csa4G285740Peroxidase1.6630.0172Up
Csa3G556210Glycerophosphodiesterphosphodiesterase0.510.0204Down
Csa4G288610Lipoxygenase1.4250.0216Up
Csa1G044880Short-chain dehydrogenase/reductase 11.3630.0232Up
Csa4G285760Peroxidase1.3520.0237Up
Csa6G088170Cytochrome P4501.3040.0253Up
Csa5G576590Auxin efflux carrier1.2790.0255Up
Csa5G636450Lipid A export ATP-binding/permeaseprotein MsbA1.2690.0269Up
Csa3G172370MLP1.3330.035Up
Csa3G435030Profilin1.4010.0496Up
Publisher’s Note: MDPI stays neutral with regard to jurisdictional claims in published maps and institutional affiliations.

