
Meta-Analysis and Bioinformatics Detection of Susceptibility Genes in Diabetic Nephropathy


Abstract
:1. Introduction
2. Results
2.1. GO Analysis and over Representation Test
2.1.1. GO Analysis Results
2.1.2. Over Representation Test Results
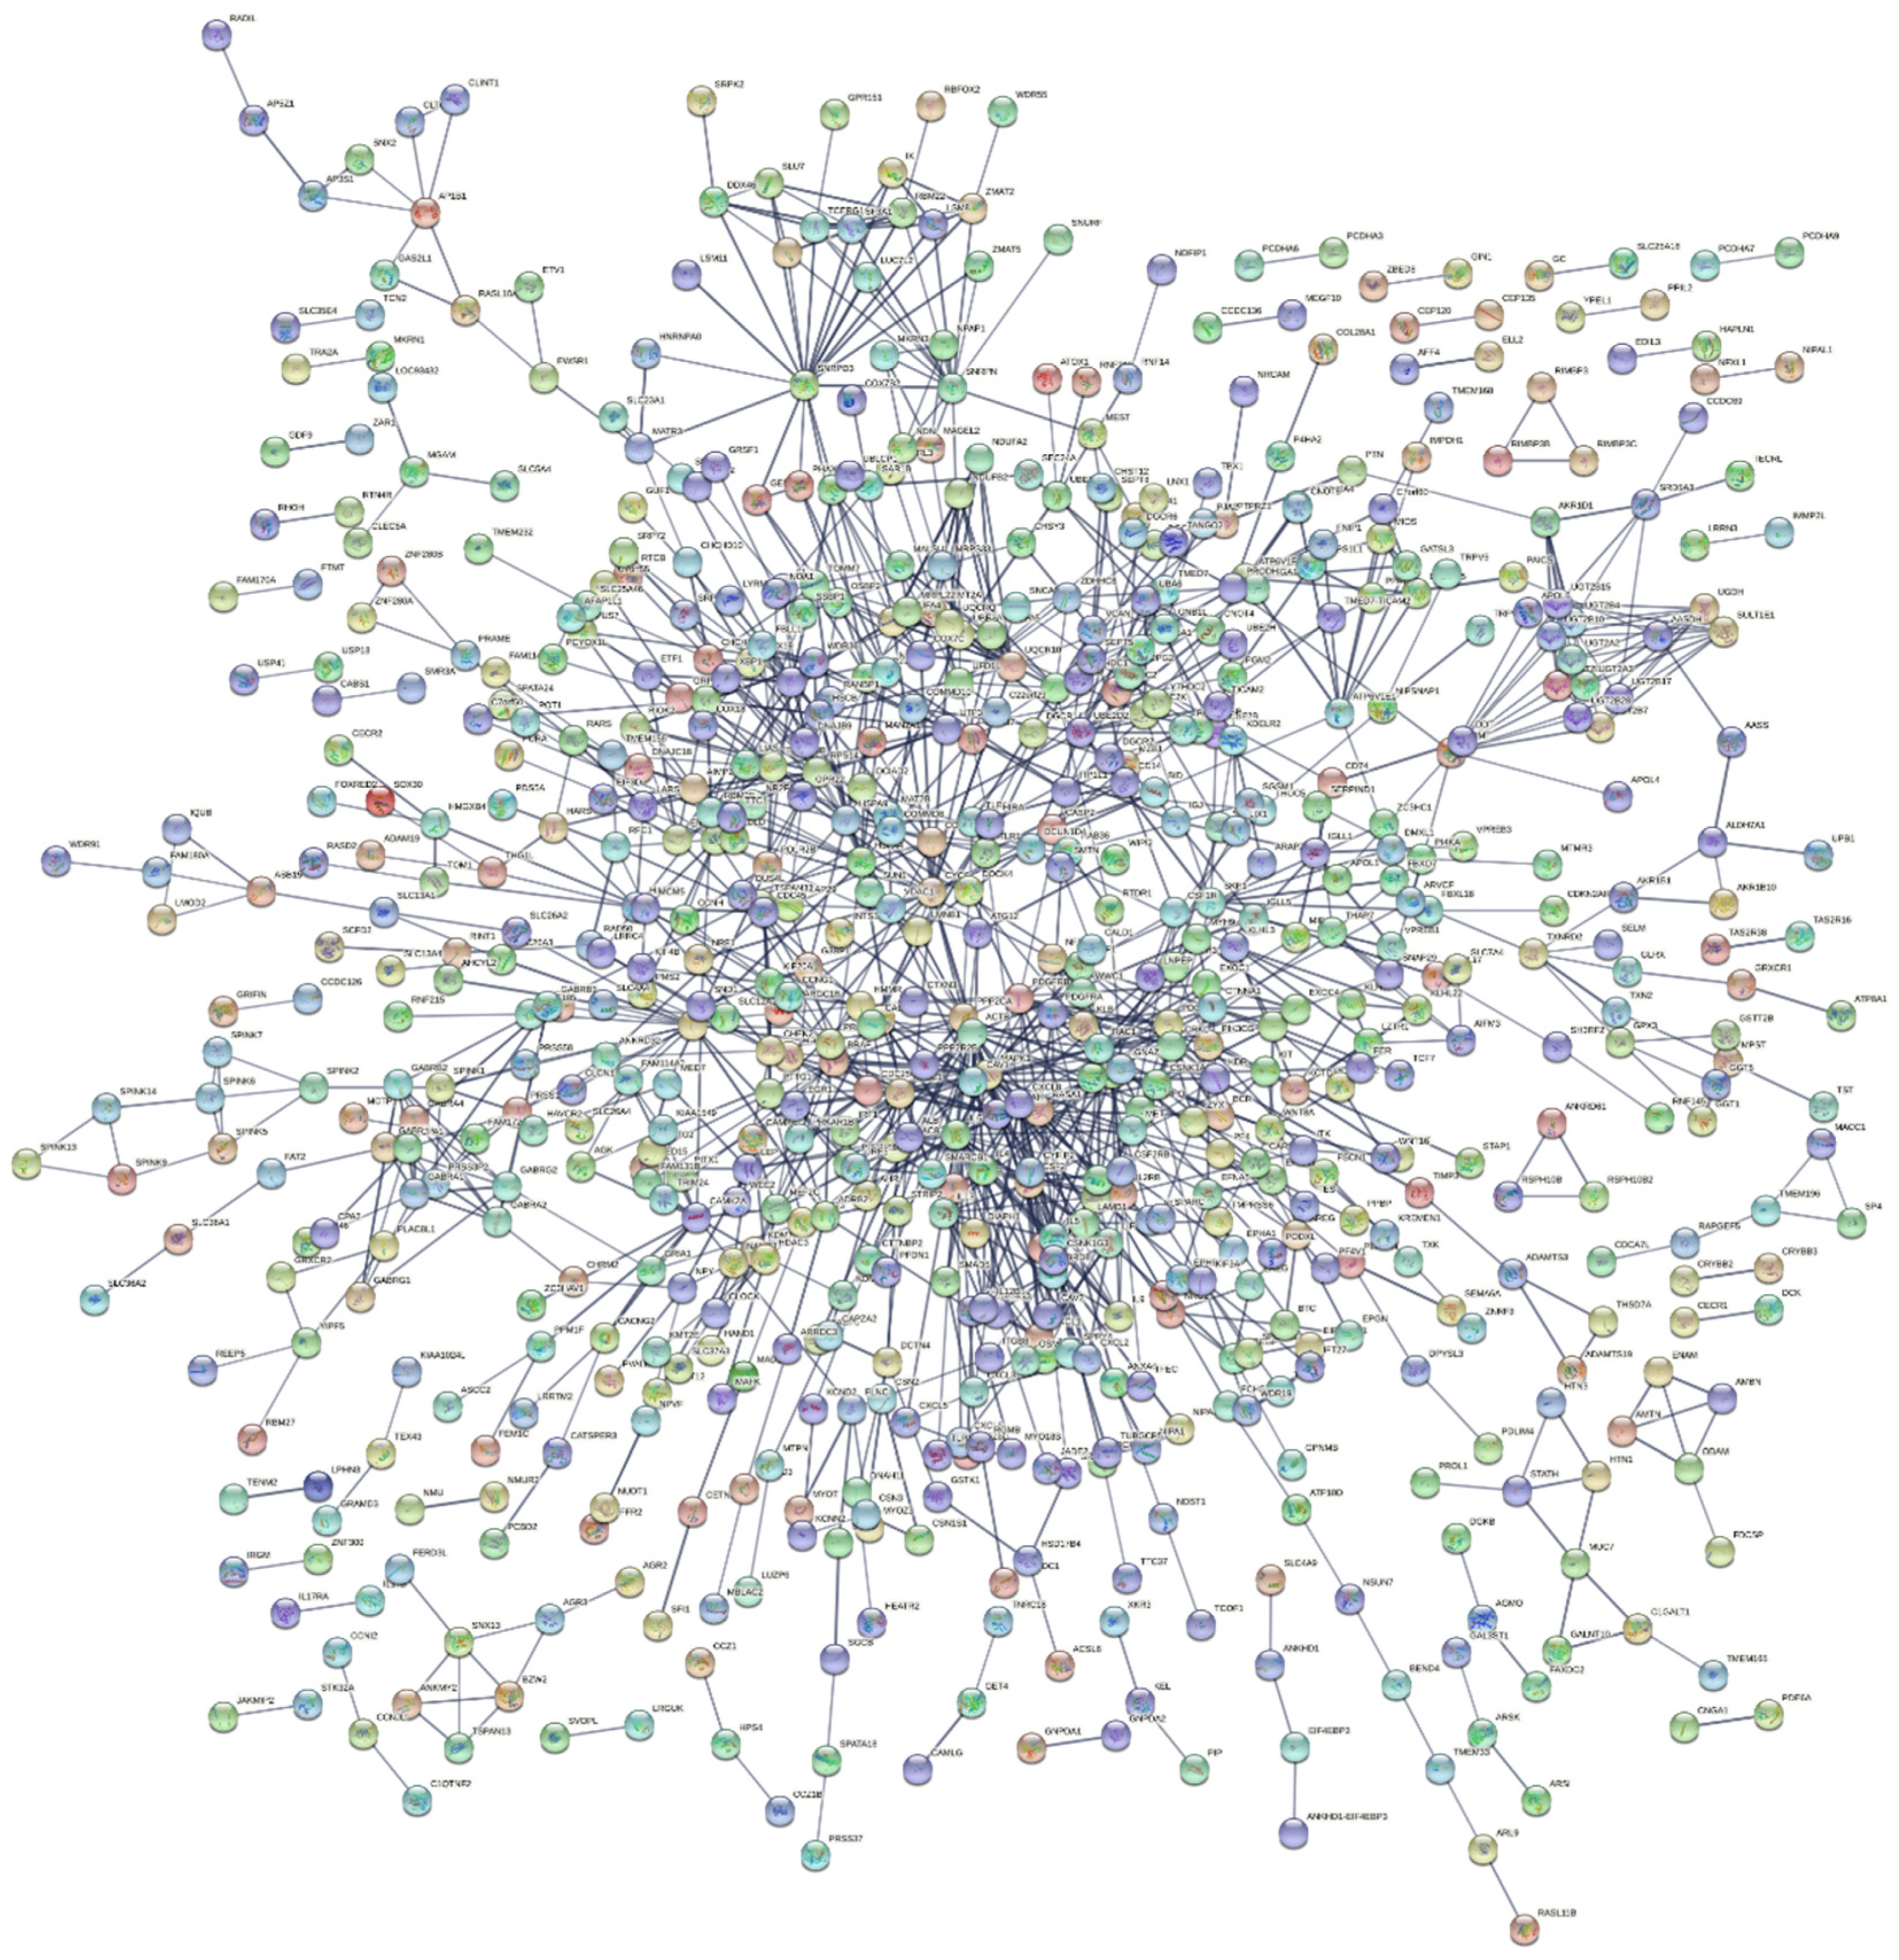
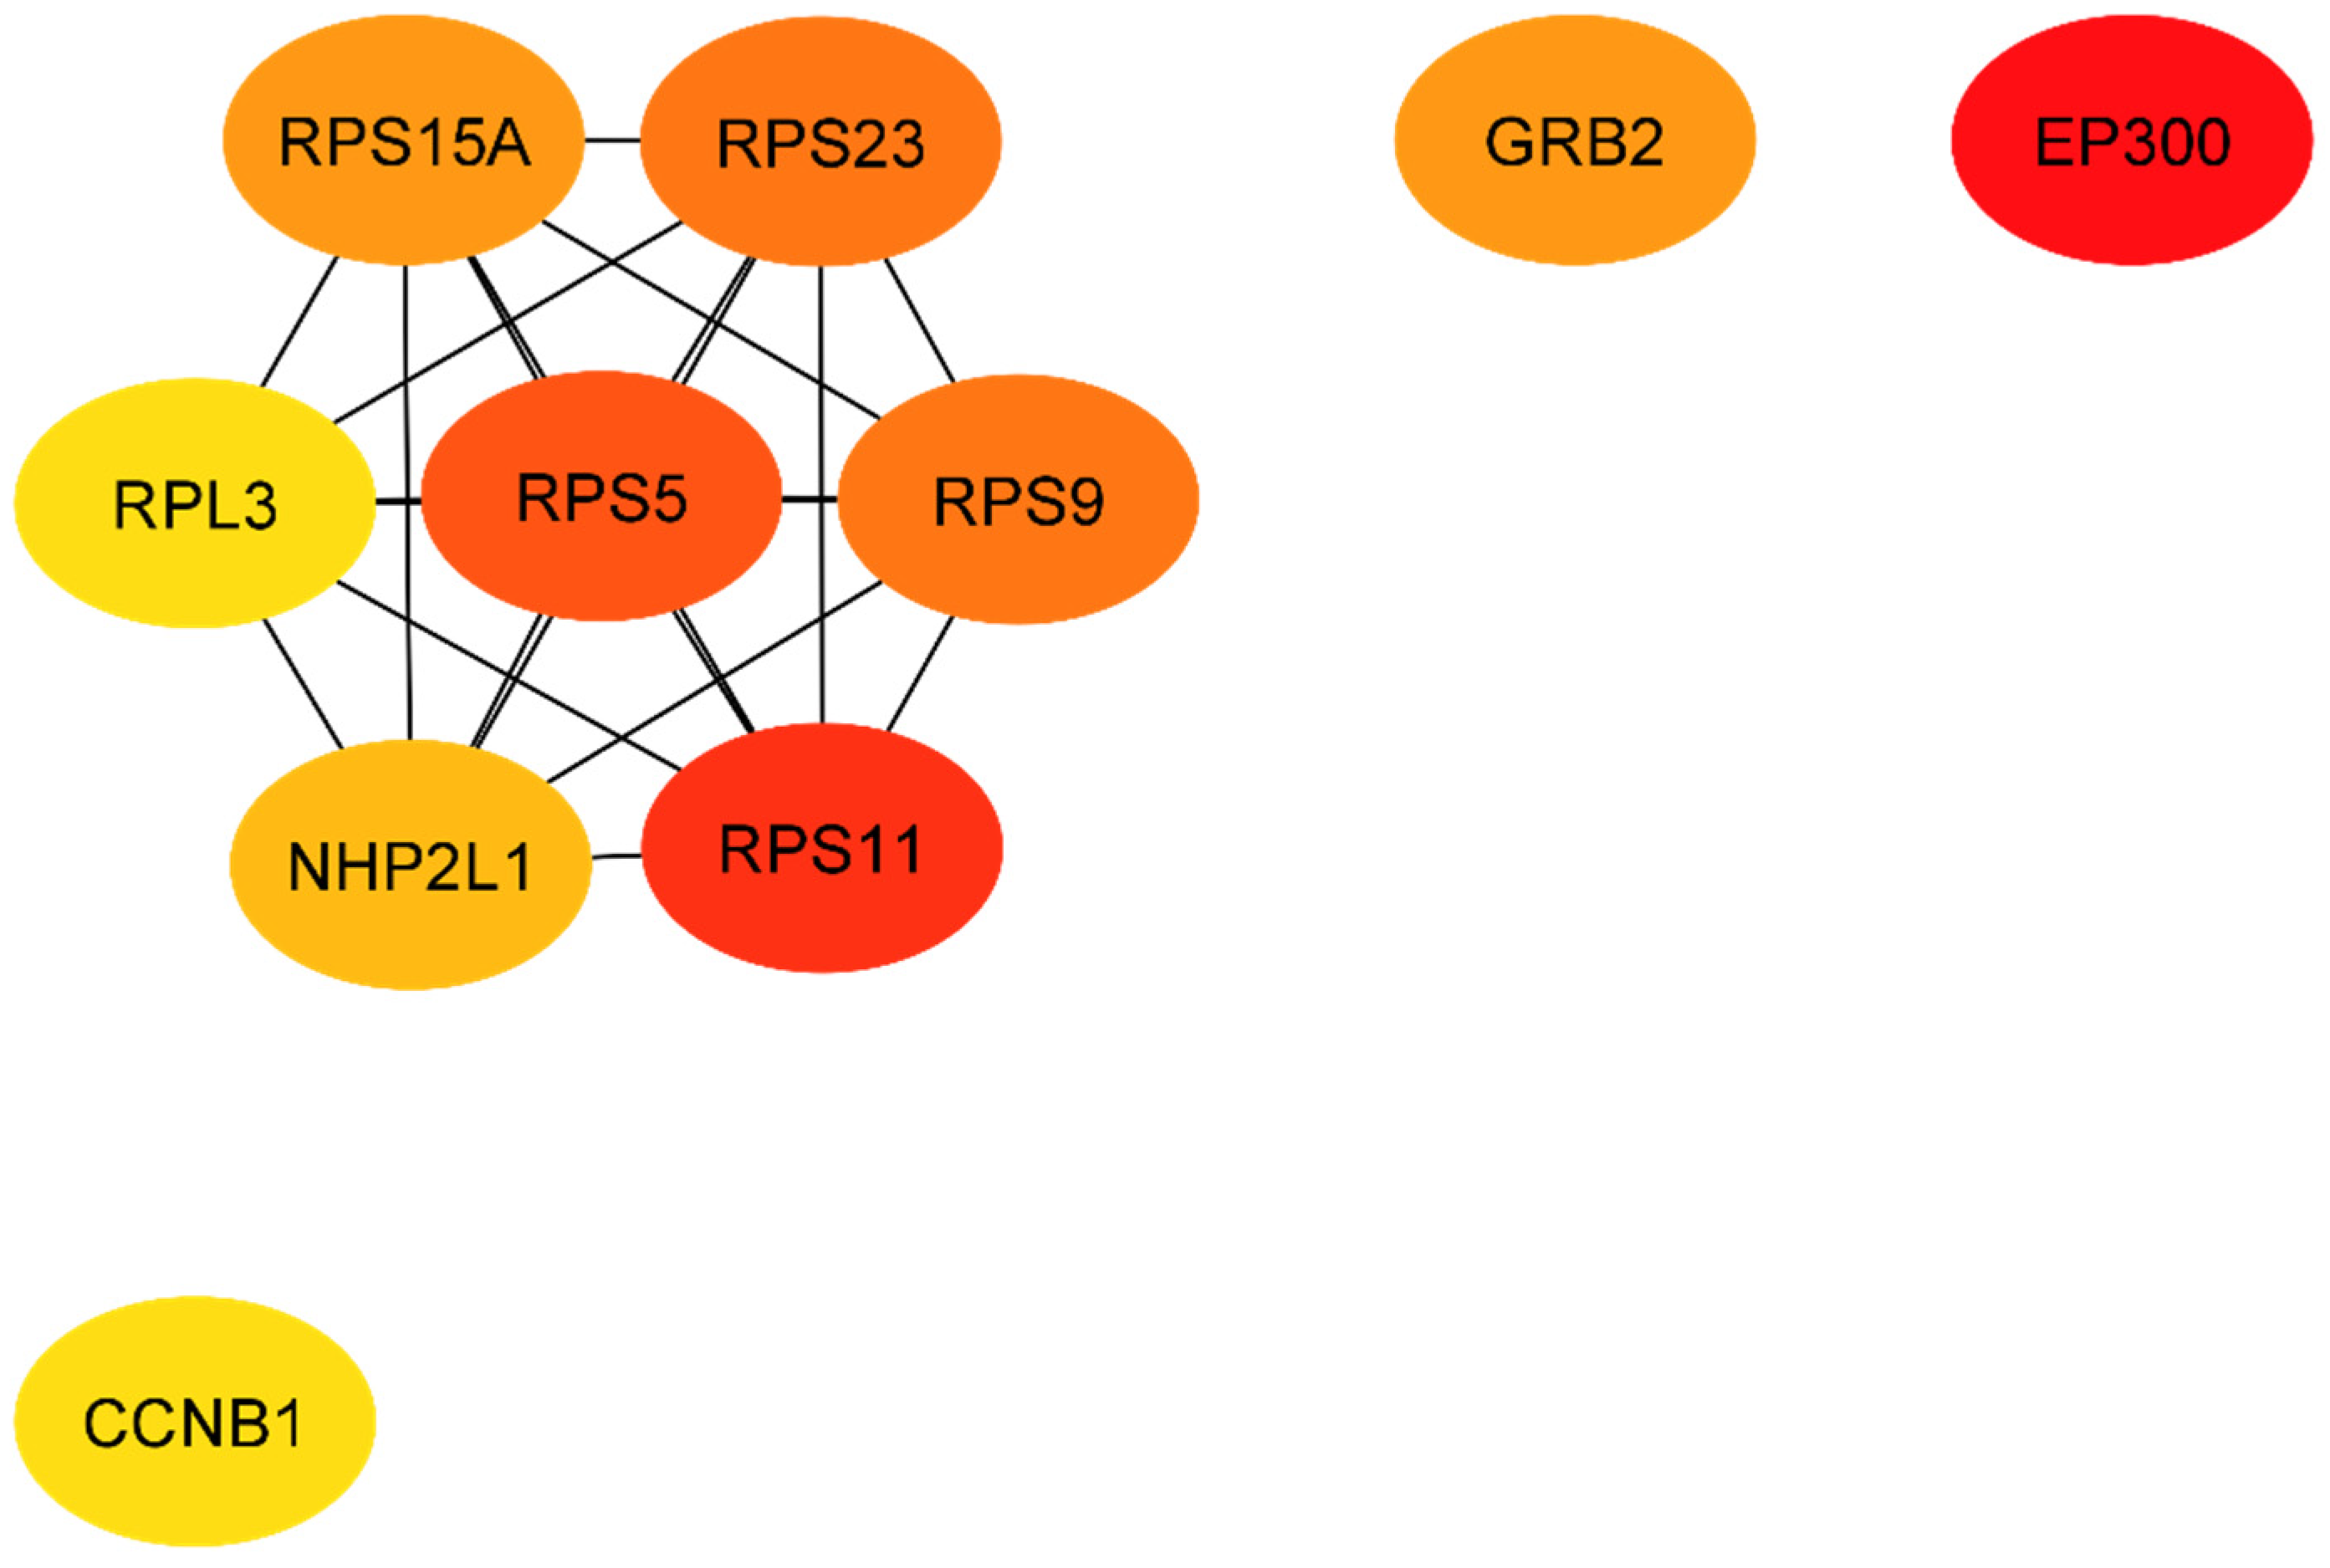
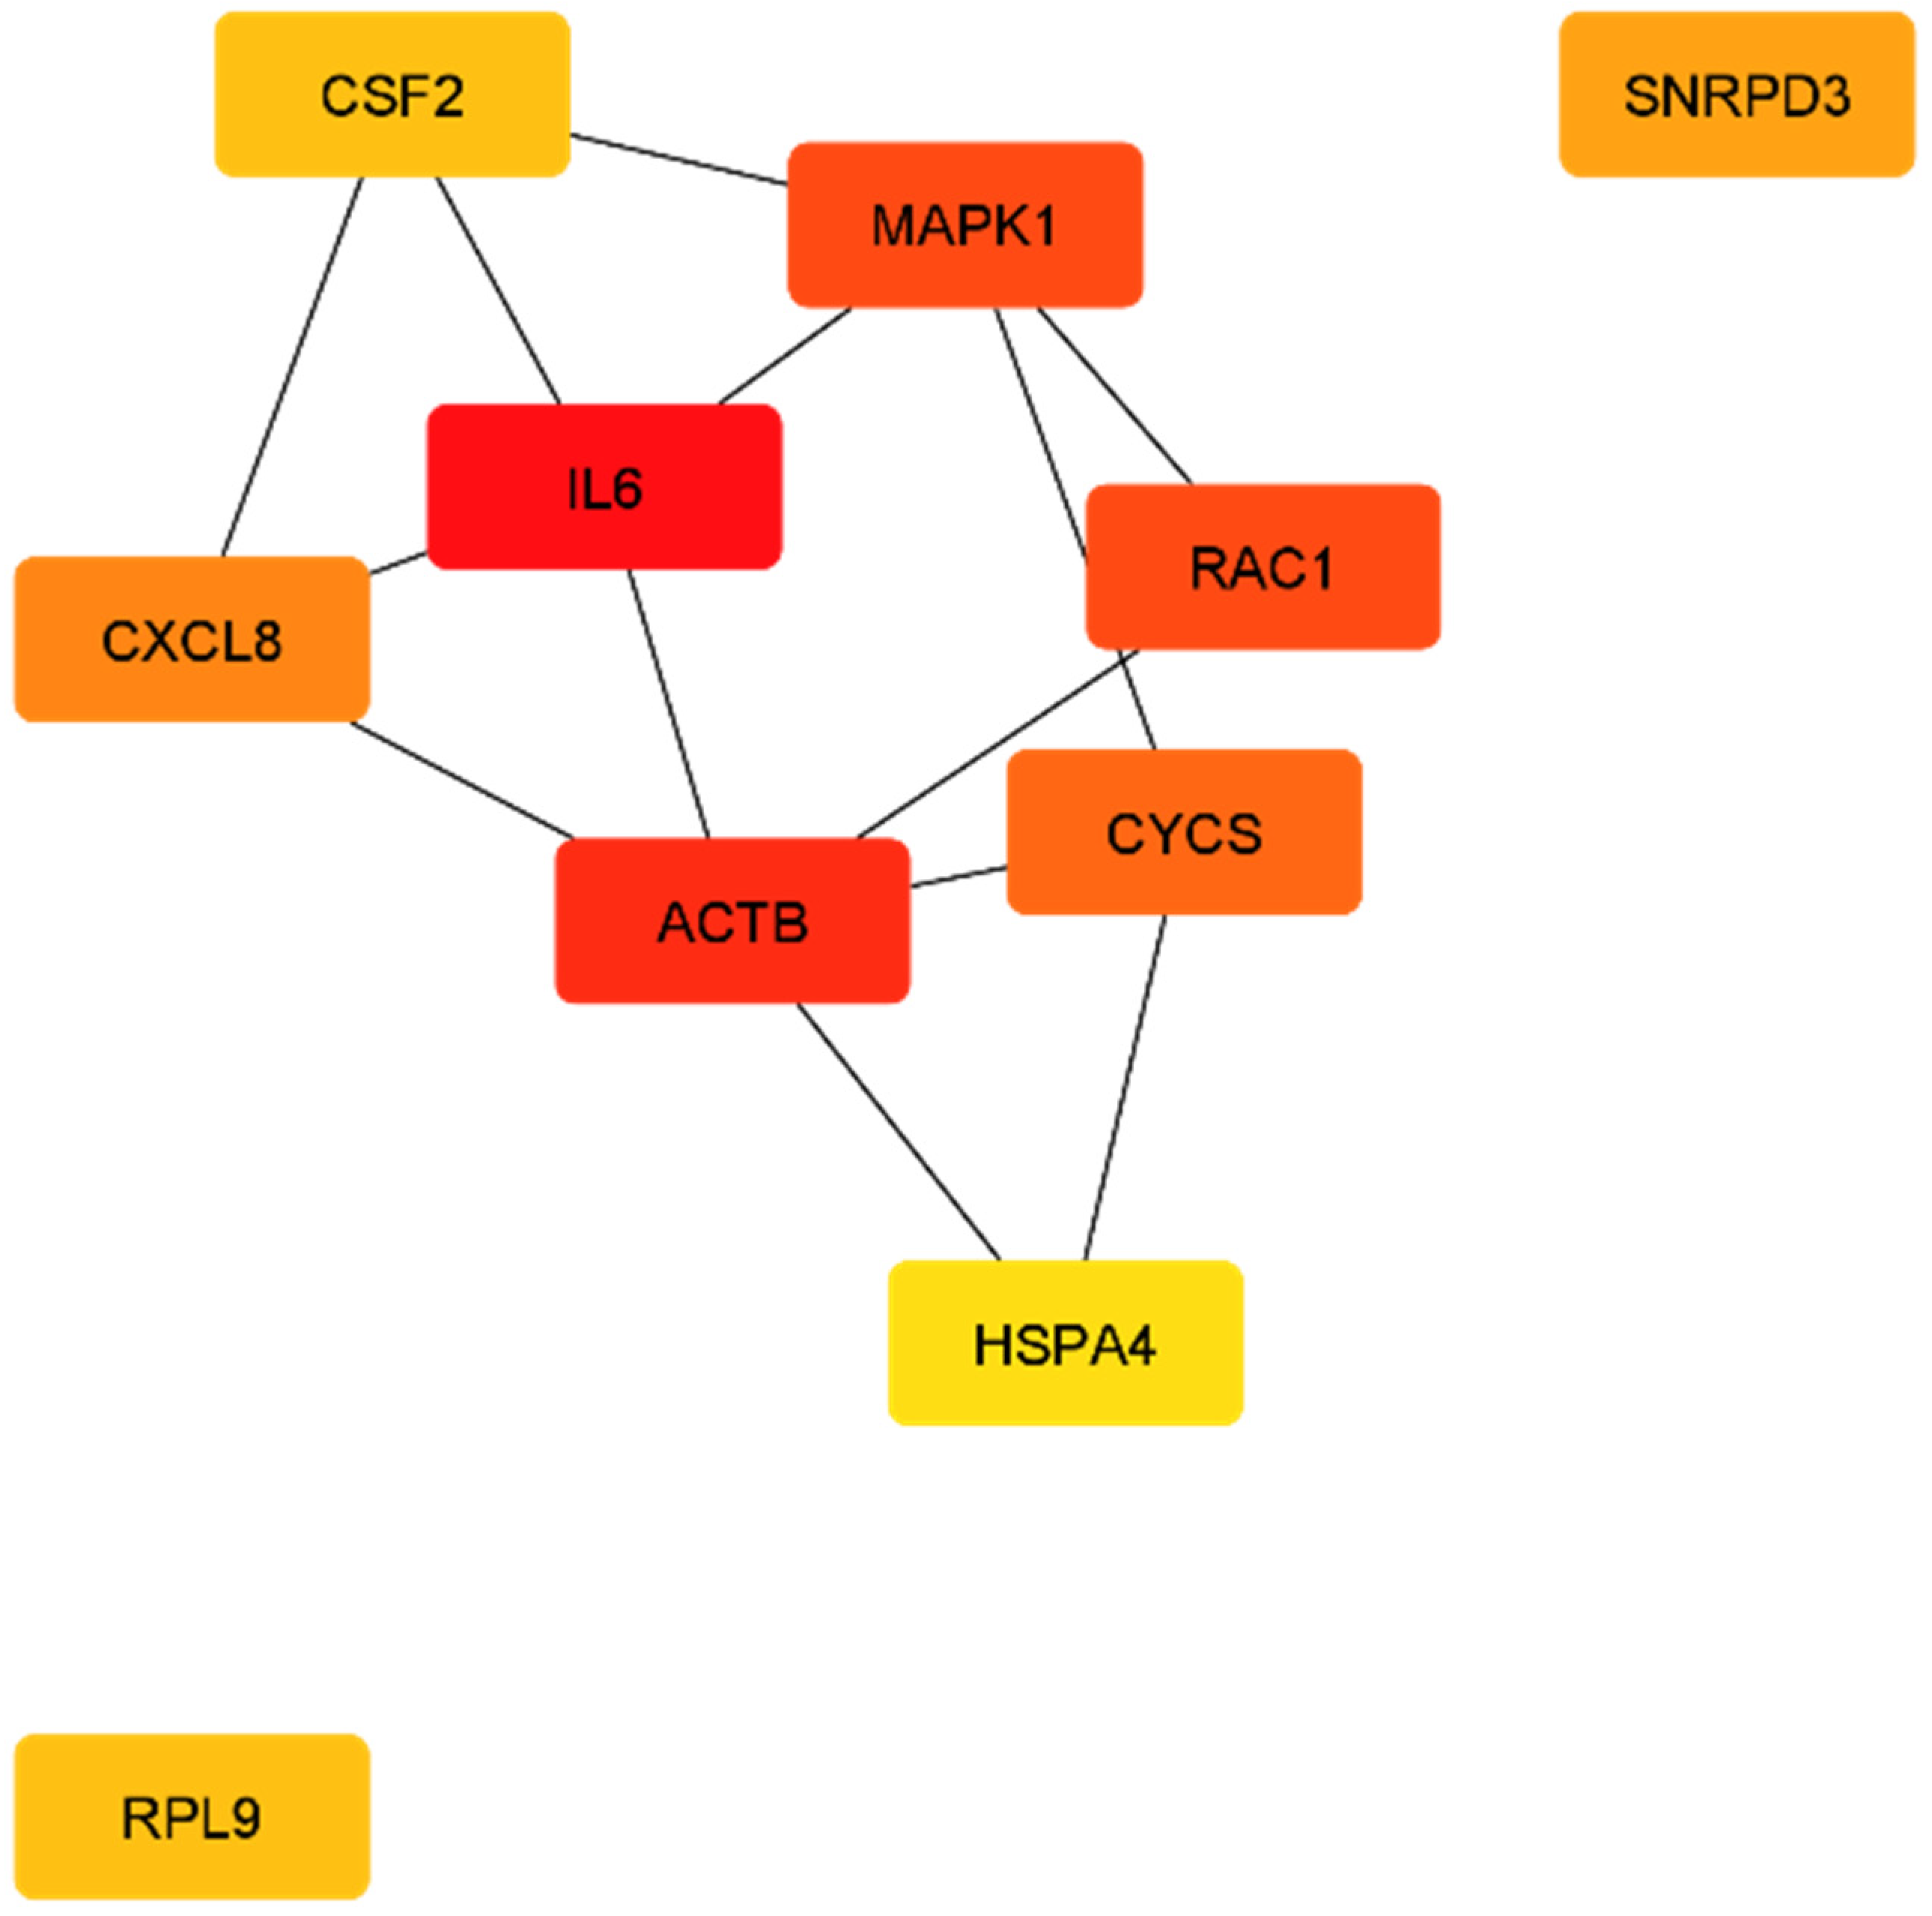
2.2. Protein Network Analysis
3. Discussion
4. Materials and Methods
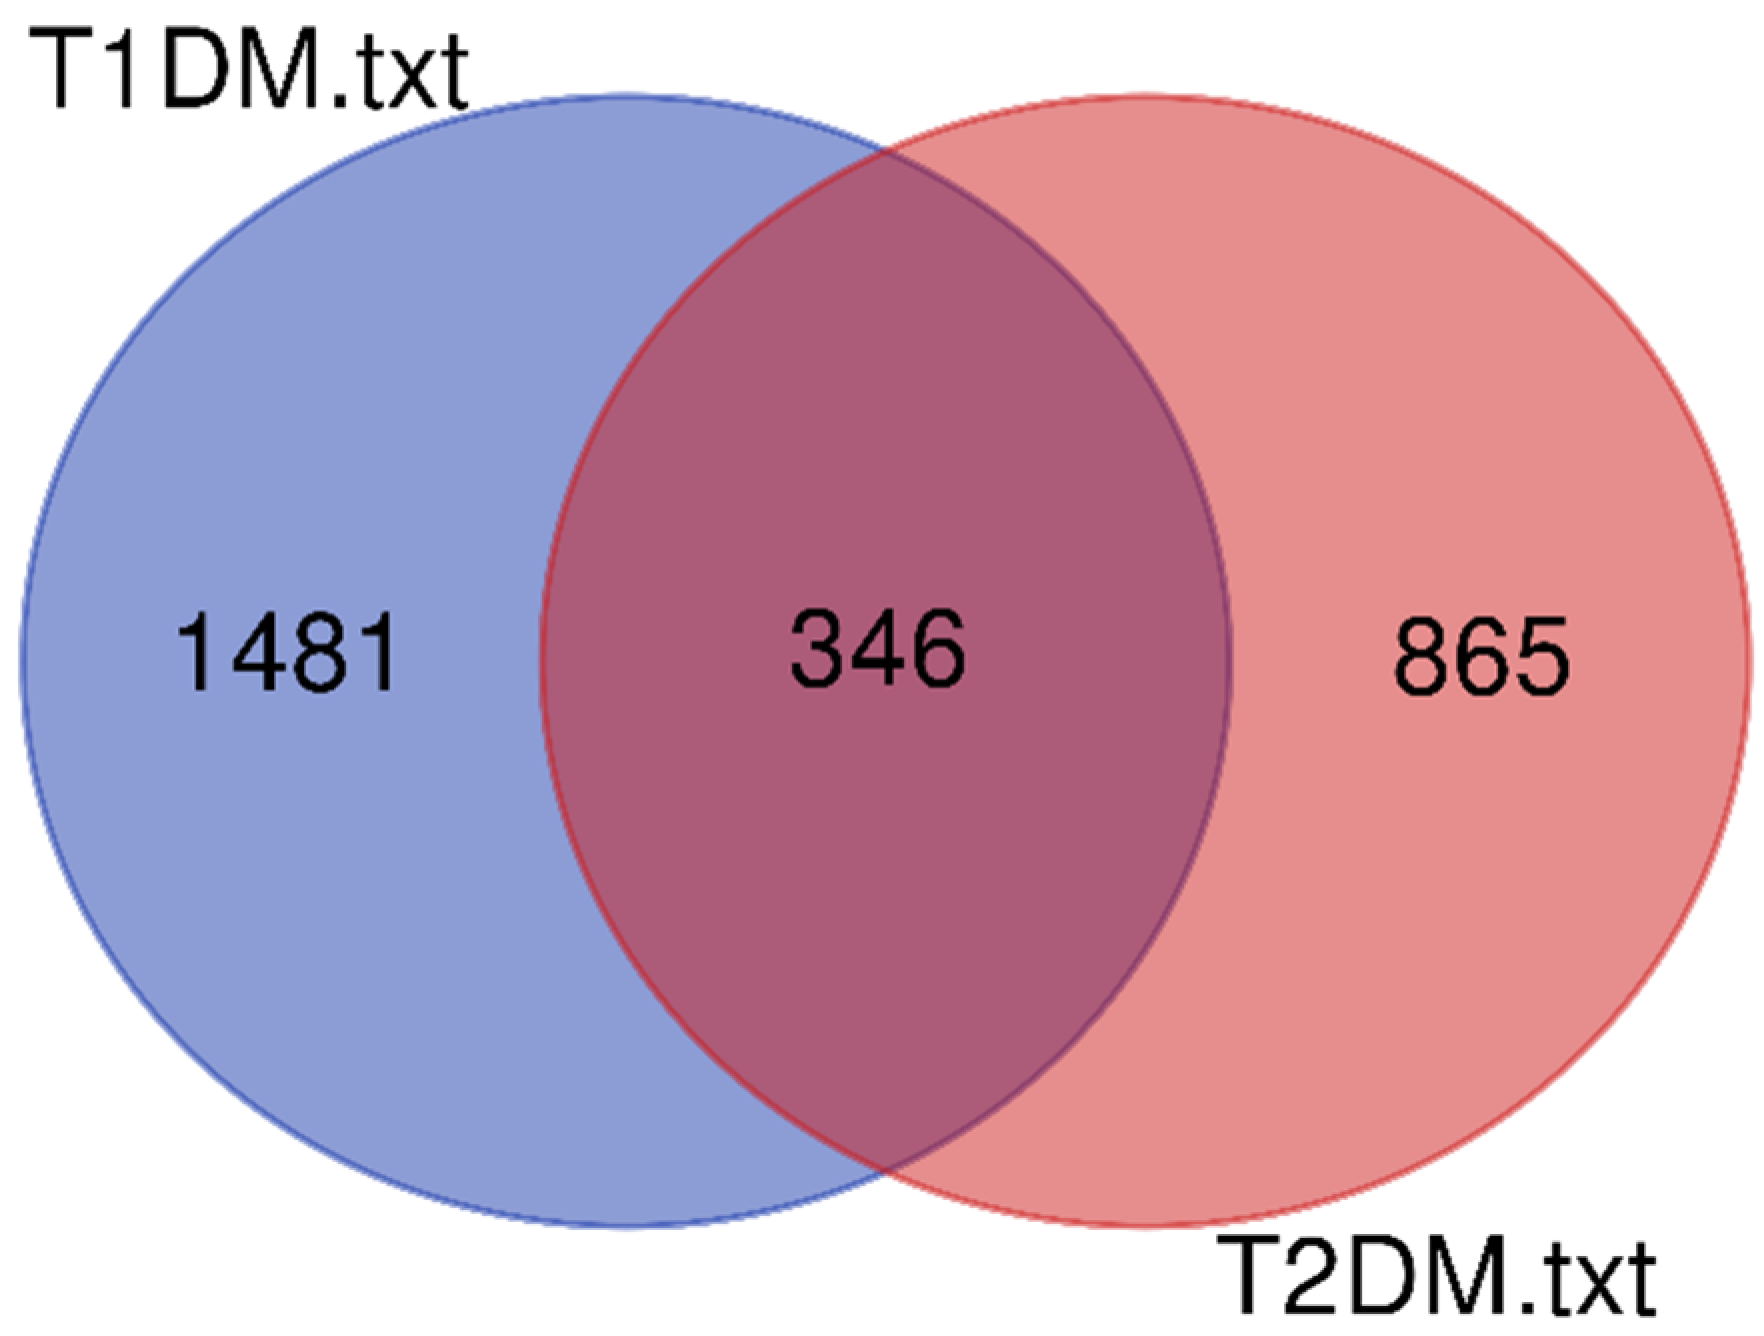
4.1. Data Sources
4.2. GO Analysis and Statistical Significance
4.3. PPI Network Construction and Selection of Hub Genes
5. Conclusions
Supplementary Materials
Author Contributions
Funding

Institutional Review Board Statement
Informed Consent Statement
Conflicts of Interest
References
- Seaquist, E.R.; Goetz, F.C.; Rich, S.; Barbosa, J. Familial Clustering of Diabetic Kidney Disease. Evidence for genetic susceptibility to diabetic nephropathy. N. Engl. J. Med. 1989, 320, 1161–1165. [Google Scholar] [CrossRef]
- Borch-Johnsen, K.; Nørgaard, K.; Hommel, E.; Mathiesen, E.R.; Jensen, J.S.; Deckert, T.; Parving, H.-H. Is diabetic nephropathy an inherited complication? Kidney Int. 1992, 41, 719–722. [Google Scholar] [CrossRef] [Green Version]
- Quinn, M.; Angelico, M.C.; Warram, J.H.; Krolewski, A.S. Familial factors determine the development of diabetic nephropathy in patients with IDDM. Diabetologia 1996, 39, 940–945. [Google Scholar] [CrossRef]
- Freedman, B.I.; Bostrom, M.; Daeihagh, P.; Bowden, D.W. Genetic Factors in Diabetic Nephropathy. Clin. J. Am. Soc. Nephrol. 2007, 2, 1306–1316. [Google Scholar] [CrossRef] [Green Version]
- Tziastoudi, M.; Stefanidis, I.; Hadjigeorgiou, G.M.; Stravodimos, K.; Zintzaras, E. A systematic review and meta-analysis of genetic association studies for the role of inflammation and the immune system in diabetic nephropathy. Clin. Kidney J. 2017, 10, 293–300. [Google Scholar] [CrossRef] [Green Version]
- Tziastoudi, M.; Stefanidis, I.; Zintzaras, E. The genetic map of diabetic nephropathy: Evidence from a systematic review and meta-analysis of genetic association studies. Clin. Kidney J. 2020, 13, 768–781. [Google Scholar] [CrossRef] [PubMed]
- Cordell, H.J.; Clayton, D.G. Genetic association studies. Lancet 2005, 366, 1121–1131. [Google Scholar] [CrossRef]
- Lander, E.S.; Kruglyak, L. Genetic dissection of complex traits: Guidelines for interpreting and reporting linkage results. Nat. Genet. 1995, 11, 241–247. [Google Scholar] [CrossRef]
- Wessman, M.; Forsblom, C.; Kaunisto, M.A.; Söderlund, J.; Ilonen, J.; Sallinen, R.; Hiekkalinna, T.; Parkkonen, M.; Maxwell, A.P.; Tarnow, L.; et al. Novel Susceptibility Locus at 22q11 for Diabetic Nephropathy in Type 1 Diabetes. PLoS ONE 2011, 6, e24053. [Google Scholar] [CrossRef] [PubMed] [Green Version]
- Osterholm, A.-M.; He, B.; Pitkaniemi, J.; Albinsson, L.; Berg, T.; Sarti, C.; Tuomilehto, J.; Tryggvason, K. Genome-wide scan for type 1 diabetic nephropathy in the Finnish population reveals suggestive linkage to a single locus on chromosome 3q. Kidney Int. 2007, 71, 140–145. [Google Scholar] [CrossRef] [Green Version]
- Rogus, J.J.; Poznik, G.D.; Pezzolesi, M.G.; Smiles, A.M.; Dunn, J.; Walker, W.; Wanic, K.; Moczulski, D.; Canani, L.; Araki, S.; et al. High-Density Single Nucleotide Polymorphism Genome-Wide Linkage Scan for Susceptibility Genes for Diabetic Nephropathy in Type 1 Diabetes: Discordant Sibpair Approach. Diabetes 2008, 57, 2519–2526. [Google Scholar] [CrossRef] [Green Version]
- Igo, R.P.; Iyengar, S.K.; Nicholas, S.B.; Goddard, K.A.; Langefeld, C.D.; Hanson, R.L.; Duggirala, R.; Divers, J.; Abboud, H.; Adler, S.G.; et al. Genomewide Linkage Scan for Diabetic Renal Failure and Albuminuria: The FIND Study. Am. J. Nephrol. 2011, 33, 381–389. [Google Scholar] [CrossRef] [Green Version]
- Bowden, D.W.; Colicigno, C.J.; Langefeld, C.D.; Sale, M.M.; Williams, A.; Anderson, P.J.; Rich, S.S.; Freedman, B.I. A genome scan for diabetic nephropathy in African Americans. Kidney Int. 2004, 66, 1517–1526. [Google Scholar] [CrossRef] [PubMed] [Green Version]
- Imperatore, G.; Hanson, R.; Pettitt, D.J.; Kobes, S.; Bennett, P.H.; Knowler, W.C. Sib-pair linkage analysis for susceptibility genes for microvascular complications among Pima Indians with type 2 diabetes. Pima Diabetes Genes Group. Diabetes 1998, 47, 821–830. [Google Scholar] [CrossRef] [PubMed]
- Tziastoudi, M.; Stefanidis, I.; Stravodimos, K.; Zintzaras, E. Identification of Chromosomal Regions Linked to Diabetic Nephropathy: A Meta-Analysis of Genome-Wide Linkage Scans. Genet. Test. Mol. Biomarkers 2019, 23, 105–117. [Google Scholar] [CrossRef] [PubMed]
- Moreau, Y.; Tranchevent, L.-C. Computational tools for prioritizing candidate genes: Boosting disease gene discovery. Nat. Rev. Genet. 2012, 13, 523–536. [Google Scholar] [CrossRef]
- Mlecnik, B.; Galon, J.; Bindea, G. Comprehensive functional analysis of large lists of genes and proteins. J. Proteom. 2018, 171, 2–10. [Google Scholar] [CrossRef] [PubMed] [Green Version]
- Szklarczyk, D.; Gable, A.L.; Lyon, D.; Junge, A.; Wyder, S.; Huerta-Cepas, J.; Simonovic, M.; Doncheva, N.T.; Morris, J.H.; Bork, P.; et al. STRING v11: Protein–protein association networks with increased coverage, supporting functional discovery in genome-wide experimental datasets. Nucleic Acids Res. 2019, 47, D607–D613. [Google Scholar] [CrossRef] [Green Version]
- Kanehisa, M.; Araki, M.; Goto, S.; Hattori, M.; Hirakawa, M.; Itoh, M.; Katayama, T.; Kawashima, S.; Okuda, S.; Tokimatsu, T.; et al. KEGG for linking genomes to life and the environment. Nucleic Acids Res. 2007, 36, D480–D484. [Google Scholar] [CrossRef] [PubMed]
- Croft, D.; O’Kelly, G.; Wu, G.; Haw, R.; Gillespie, M.; Matthews, L.; Caudy, M.; Garapati, P.; Gopinath, G.; Jassal, B.; et al. Reactome: A database of reactions, pathways and biological processes. Nucleic Acids Res. 2010, 39, D691–D697. [Google Scholar] [CrossRef] [PubMed]
- Tang, X.; Li, H.; Li, L.; Zhang, J.; Xu, H.; Liu, F. The Clinical Impact of Glomerular Immunoglobulin M Deposition in Patients with Type 2 Diabetic Nephropathy. Am. J. Med. Sci. 2018, 356, 365–373. [Google Scholar] [CrossRef]
- Duan, S.; Sun, L.; Nie, G.; Chen, J.; Zhang, C.; Zhu, H.; Huang, Z.; Qian, J.; Zhao, X.; Xing, C.; et al. Association of Glomerular Complement C4c Deposition With the Progression of Diabetic Kidney Disease in Patients With Type 2 Diabetes. Front. Immunol. 2020, 11. [Google Scholar] [CrossRef]
- Navarro-González, J.F.; Mora-Fernández, C.; De Fuentes, M.M.; García-Pérez, J. Inflammatory molecules and pathways in the pathogenesis of diabetic nephropathy. Nat. Rev. Nephrol. 2011, 7, 327–340. [Google Scholar] [CrossRef]
- Nakamura, A.; Shikata, K.; Hiramatsu, M.; Nakatou, T.; Kitamura, T.; Wada, J.; Itoshima, T.; Makino, H. Serum Interleukin-18 Levels Are Associated With Nephropathy and Atherosclerosis in Japanese Patients With Type 2 Diabetes. Diabetes Care 2005, 28, 2890–2895. [Google Scholar] [CrossRef] [Green Version]
- Sekizuka, K.; Tomino, Y.; Sei, C.; Kurusu, A.; Tashiro, K.; Yamaguchi, Y.; Kodera, S.; Hishiki, T.; Shirato, I.; Koide, H. Detection of Serum IL-6 in Patients with Diabetic Nephropathy. Nephron 1994, 68, 284–285. [Google Scholar] [CrossRef] [PubMed]
- Kanesaki, Y.; Suzuki, D.; Uehara, G.; Toyoda, M.; Katoh, T.; Sakai, H.; Watanabe, T. Vascular endothelial growth factor gene expression is correlated with glomerular neovascularization in human diabetic nephropathy. Am. J. Kidney Dis. 2005, 45, 288–294. [Google Scholar] [CrossRef] [PubMed]
- Schrijvers, B.F.; Flyvbjerg, A.; De Vriese, A.S. The role of vascular endothelial growth factor (VEGF) in renal pathophysiology. Kidney Int. 2004, 65, 2003–2017. [Google Scholar] [CrossRef] [Green Version]
- Nikzamir, A.; Esteghamati, A.; Hammedian, A.A.; Mahmoudi, T. The role of vascular endothelial growth factor +405 G/C polymorphism and albuminuria in patients with type 2 diabetes mellitus. Mol. Biol. Rep. 2011, 39, 881–886. [Google Scholar] [CrossRef] [PubMed]
- Flyvbjerg, A.; Dagnaes-Hansen, F.; De Vriese, A.S.; Schrijvers, B.F.; Tilton, R.G.; Rasch, R. Amelioration of Long-Term Renal Changes in Obese Type 2 Diabetic Mice by a Neutralizing Vascular Endothelial Growth Factor Antibody. Diabetes 2002, 51, 3090–3094. [Google Scholar] [CrossRef] [PubMed] [Green Version]
- McKnight, A.-J.; Maxwell, A.P.; Patterson, C.C.; Brady, H.R.; Savage, D.A. Association of VEGF-1499C→T polymorphism with diabetic nephropathy in type 1 diabetes mellitus. J. Diabetes its Complicat. 2007, 21, 242–245. [Google Scholar] [CrossRef]
- Amle, D.; Mir, R.; Khaneja, A.; Agarwal, S.; Ahlawat, R.; Ray, P.C.; Saxena, A. Association of 18bp insertion/deletion polymorphism, at −2549 position of VEGF gene, with diabetic nephropathy in type 2 diabetes mellitus patients of North Indian population. J. Diabetes Metab. Disord. 2015, 14, 1–6. [Google Scholar] [CrossRef] [PubMed] [Green Version]
- Tiwari, A.K.; Prasad, P.; Thelma, B.K.; Kumar, K.P.; Ammini, A.; Gupta, A.; Gupta, R. Oxidative stress pathway genes and chronic renal insufficiency in Asian Indians with Type 2 diabetes. J. Diabetes its Complicat. 2009, 23, 102–111. [Google Scholar] [CrossRef] [PubMed]
- Dabhi, B.; Mistry, K.N.; Patel, H.; Lal, S. Vascular endothelial growth factor insertion/deletion gene polymorphism in West Indian patients of type 2 diabetes and diabetic nephropathy. Indian J. Biochem. Biophys. 2015, 52, 209–212. [Google Scholar]
- Buraczynska, M.; Ksiazek, P.; Baranowicz-Gaszczyk, I.; Jozwiak, L. Association of the VEGF gene polymorphism with diabetic retinopathy in type 2 diabetes patients. Nephrol. Dial. Transplant. 2007, 22, 827–832. [Google Scholar] [CrossRef] [Green Version]
- Yang, B.; Cross, D.F.; Ollerenshaw, M.; Millward, B.A.; Demaine, A.G. Polymorphisms of the vascular en-dothelial growth factor and susceptibility to diabetic microvascular complications in patients with type 1 diabetes mellitus. J. Diabetes Its Complicat. 2003, 17, 1–6. [Google Scholar] [CrossRef]
- Zhang, A.; Fang, H.; Chen, J.; He, L.; Chen, Y. Role of VEGF-A and LRG1 in Abnormal Angiogenesis Associated With Diabetic Nephropathy. Front. Physiol. 2020, 11. [Google Scholar] [CrossRef]
- Tanabe, K.; Wada, J.; Sato, Y. Targeting angiogenesis and lymphangiogenesis in kidney disease. Nat. Rev. Nephrol. 2020, 16, 289–303. [Google Scholar] [CrossRef] [PubMed]
- Tziastoudi, M.; Tsezou, A.; Stefanidis, I. Cadherin and Wnt signaling pathways as key regulators in diabetic nephropathy. PLoS ONE 2021, 16, e0255728. [Google Scholar] [CrossRef] [PubMed]
- El-Dawla, N.M.Q.; Sallam, A.-A.M.; El-Hefnawy, M.H.; El-Mesallamy, H.O. E-cadherin and periostin in early detection and progression of diabetic nephropathy: Epithelial-to-mesenchymal transition. Clin. Exp. Nephrol. 2019, 23, 1050–1057. [Google Scholar] [CrossRef]
- Jiang, H.; Guan, G.; Zhang, R.; Liu, G.; Cheng, J.; Hou, X.; Cui, Y. Identification of urinary soluble E-cadherin as a novel biomarker for diabetic nephropathy. Diabetes/Metabolism Res. Rev. 2009, 25, 232–241. [Google Scholar] [CrossRef]
- Loeffler, I.; Wolf, G. Epithelial-to-Mesenchymal Transition in Diabetic Nephropathy: Fact or Fiction? Cells 2015, 4, 631–652. [Google Scholar] [CrossRef]
- Nelson, W.J.; Nusse, R. Convergence of Wnt, ß-Catenin, and Cadherin Pathways. Science 2004, 303, 1483–1487. [Google Scholar] [CrossRef] [Green Version]
- He, W.; Kang, Y.S.; Dai, C.; Liu, Y. Blockade of Wnt/β-Catenin Signaling by Paricalcitol Ameliorates Proteinuria and Kidney Injury. J. Am. Soc. Nephrol. 2010, 22, 90–103. [Google Scholar] [CrossRef]
- Dai, C.; Stolz, D.B.; Kiss, L.P.; Monga, S.P.; Holzman, L.B.; Liu, Y. Wnt/β-Catenin Signaling Promotes Podocyte Dysfunction and Albuminuria. J. Am. Soc. Nephrol. 2009, 20, 1997–2008. [Google Scholar] [CrossRef] [PubMed] [Green Version]
- Kato, H.; Gruenwald, A.; Suh, J.H.; Miner, J.H.; Barisoni-Thomas, L.; Taketo, M.M.; Faul, C.; Millar, S.E.; Holzman, L.B.; Susztak, K. Wnt/β-Catenin Pathway in Podocytes Integrates Cell Adhesion, Differentiation, and Survival. J. Biol. Chem. 2011, 286, 26003–26015. [Google Scholar] [CrossRef] [PubMed] [Green Version]
- Zhou, T.; He, X.; Cheng, R.; Zhang, B.; Zhang, R.R.; Chen, Y.; Takahashi, Y.; Murray, A.R.; Lee, K.; Gao, G.; et al. Implication of dysregulation of the canonical wingless-type MMTV integration site (WNT) pathway in diabetic nephropathy. Diabetologia 2012, 55, 255–266. [Google Scholar] [CrossRef] [PubMed] [Green Version]
- Yoshioka, K.; Takemura, T.; Murakami, K.; Akano, N.; Matsubara, K.; Aya, N.; Maki, S. Identification and localization of epidermal growth factor and its receptor in the human glomerulus. Lab. Investig. 1990, 63, 189–196. [Google Scholar] [PubMed]
- Jørgensen, P.E.; Rasmussen, T.N.; Olsen, P.S.; Raaberg, L.; Poulsen, S.S.; Nexø, E. Renal uptake and excretion of epidermal growth factor from plasma in the rat. Regul. Pept. 1990, 28, 273–280. [Google Scholar] [CrossRef]
- Perlman, A.S.; Chevalier, J.M.; Wilkinson, P.; Liu, H.; Parker, T.; Levine, D.M.; Sloan, B.J.; Gong, A.; Sherman, R.; Farrell, F.X. Serum Inflammatory and Immune Mediators Are Elevated in Early Stage Diabetic Nephropathy. Ann. Clin. Lab. Sci. 2015, 45, 256–263. [Google Scholar] [PubMed]
- Advani, A.; Wiggins, K.J.; Cox, A.J.; Zhang, Y.; Gilbert, R.E.; Kelly, D.J. Inhibition of the epidermal growth factor receptor preserves podocytes and attenuates albuminuria in experimental diabetic nephropathy. Nephrol. 2011, 16, 573–581. [Google Scholar] [CrossRef] [PubMed]
- Harskamp, L.R.; Gansevoort, R.T.; Van Goor, H.; Meijer, E. The epidermal growth factor receptor pathway in chronic kidney diseases. Nat. Rev. Nephrol. 2016, 12, 496–506. [Google Scholar] [CrossRef]
- Gong, P.; Wang, M.; Yang, W.; Chang, X.; Wang, L.; Chen, F. Integrated metabolomics coupled with pattern recognition and pathway analysis to reveal molecular mechanism of cadmium-induced diabetic nephropathy. Toxicol. Res. 2021, 10, 777–791. [Google Scholar] [CrossRef]
- Chin, C.-H.; Chen, S.-H.; Wu, H.-H.; Ho, C.-W.; Ko, M.-T.; Lin, C.-Y. cytoHubba: Identifying hub objects and sub-networks from complex interactome. BMC Syst. Biol. 2014, 8, S11. [Google Scholar] [CrossRef] [PubMed] [Green Version]
- Kent, W.J.; Sugnet, C.W.; Furey, T.S.; Roskin, K.M.; Pringle, T.H.; Zahler, A.M.; Haussler, A.D. The Human Genome Browser at UCSC. Genome Res. 2002, 12, 996–1006. [Google Scholar] [CrossRef] [PubMed] [Green Version]
- Mi, H.; Muruganujan, A.; Huang, J.X.; Ebert, D.; Mills, C.; Guo, X.; Thomas, P.D. Protocol Update for large-scale genome and gene function analysis with the PANTHER classification system (v.14.0). Nat. Protoc. 2019, 14, 703–721. [Google Scholar] [CrossRef] [PubMed]
- Mi, H.; Ebert, D.; Muruganujan, A.; Mills, C.; Albou, L.-P.; Mushayamaha, T.; Thomas, P.D. PANTHER version 16: A revised family classification, tree-based classification tool, enhancer regions and extensive API. Nucleic Acids Res. 2021, 49, D394–D403. [Google Scholar] [CrossRef] [PubMed]
- Shannon, P.; Markiel, A.; Ozier, O.; Baliga, N.S.; Wang, J.T.; Ramage, D.; Amin, N.; Schwikowski, B.; Ideker, T. Cytoscape: A Software Environment for Integrated Models of Biomolecular Interaction Networks. Genome Res. 2003, 13, 2498–2504. [Google Scholar] [CrossRef] [PubMed]


| Gene Type | T1DM (# Genes) | T2DM (# Genes) |
|---|---|---|
| protein coding | 1827 | 1211 |
| pseudo | 1004 | 818 |
| ncRNA | 584 | 363 |
| snRNA | 3 | 2 |
| snoRNA | 31 | 104 |
| rRNA | − | 1 |
| other | 51 | 120 |
| Total | 3500 | 2619 |
| GO Term | T1DM-DN | T2DM-DN | ||
|---|---|---|---|---|
| GO Term | Top 5 GO Terms | # of Genes | Top 5 GO Terms | # of Genes |
| Molecular Function | ||||
| binding (GO:0005488) | 592 | binding (GO:0005488) | 330 | |
| catalytic activity (GO:0003824) | 378 | catalytic activity (GO:0003824) | 242 | |
| molecular function regulator (GO:0098772) | 281 | molecular function regulator (GO:0098772) | 114 | |
| transporter activity (GO:0005215) | 79 | transporter activity (GO:0005215) | 65 | |
| molecular transducer activity (GO:0060089) | 54 | molecular transducer activity (GO:0060089) | 53 | |
| Biological Process | ||||
| cellular process (GO:0009987) | 938 | cellular process (GO:0009987) | 605 | |
| metabolic process (GO:0008152) | 621 | metabolic process (GO:0008152) | 343 | |
| biological regulation (GO:0065007) | 567 | biological regulation (GO:0065007) | 313 | |
| response to stimulus (GO:0050896) | 240 | response to stimulus (GO:0050896) | 169 | |
| localization (GO:0051179) | 212 | localization (GO:0051179) | 165 | |
| Cellular Component | ||||
| cellular anatomical entity (GO:0110165) | 1035 | cellular anatomical entity (GO:0110165) | 720 | |
| intracellular (GO:0005622) | 822 | intracellular (GO:0005622) | 484 | |
| protein-containing complex (GO:0032991) | 249 | protein-containing complex (GO:0032991) | 171 | |
| Protein Class | ||||
| metabolite interconversion enzyme (PC00262) | 197 | metabolite interconversion enzyme (PC00262) | 115 | |
| protein modifying enzyme (PC00260) | 134 | protein modifying enzyme (PC00260) | 83 | |
| gene-specific transcriptional regulator (PC00264) | 133 | transporter (PC00227) | 74 | |
| transmembrane signal receptor (PC00197) | 103 | cell adhesion molecule (PC00069) | 62 | |
| nucleic acid metabolism protein (PC00171) | 98 | gene-specific transcriptional regulator (PC00264) | 55 | |
| Pathway | ||||
| Angiogenesis (P00005) | 26 | Wnt signaling pathway (P00057) | 71 | |
| Integrin signalling pathway (P00034) | 24 | Cadherin signaling pathway (P00012) | 62 | |
| Inflammation mediated by chemokine and cytokine signaling pathway (P00031) | 24 | EGF receptor signaling pathway (P00018) | 15 | |
| Gonadotropin-releasing hormone receptor pathway (P06664) | 20 | Gonadotropin-releasing hormone receptor pathway (P06664) | 14 | |
| EGF receptor signaling pathway (P00018) | 20 | Angiogenesis (P00005) | 14 | |
| Homo Sapiens (REF) | Client Text Box Input (Hierarchy ) | ||||||
|---|---|---|---|---|---|---|---|
| PANTHER GO-Slim Biological Process | # | # | Expected | Fold Enrichment | +/− | Raw p Value | FDR |
| heterocycle biosynthetic process | 2322 | 277 | 208.24 | 1.33 | + | 3.52 × 10⁻⁶ | 1.10 × 10⁻³ |
| biosynthetic process | 3011 | 346 | 270.03 | 1.28 | + | 4.13 × 10⁻⁶ | 1.13 × 10⁻³ |
| aromatic compound biosynthetic process | 2323 | 276 | 208.33 | 1.32 | + | 5.06 × 10⁻⁶ | 1.23 × 10⁻³ |
| organic substance biosynthetic process | 3004 | 346 | 269.40 | 1.28 | + | 3.44 × 10⁻⁶ | 1.25 × 10⁻³ |
| transcription by RNA polymerase II | 1635 | 205 | 146.63 | 1.40 | + | 5.95 × 10⁻⁶ | 1.30 × 10⁻³ |
| PANTHER GO-Slim Molecular Function | # | # | Expected | Fold Enrichment | +/− | Raw p Value | FDR |
| RNA polymerase II cis-regulatory region sequence-specific DNA binding | 1054 | 162 | 94.52 | 1.71 | + | 7.14 × 10⁻¹⁰ | 3.96 × 1−7 |
| cis-regulatory region sequence-specific DNA binding | 1057 | 162 | 94.79 | 1.71 | + | 7.55 × 10⁻¹⁰ | 2.09 × 10⁻⁷ |
| transcription regulatory region sequence-specific DNA binding | 1377 | 188 | 123.49 | 1.52 | + | 8.28 × 10⁻⁸ | 5.11 × 10⁻⁶ |
| regulatory region nucleic acid binding | 1377 | 188 | 123.49 | 1.52 | + | 8.28 × 10⁻⁸ | 4.60 × 10⁻⁶ |
| nucleic acid binding | 2248 | 274 | 201.61 | 1.36 | + | 8.13 × 10⁻⁷ | 3.76 × 10⁻⁵ |
| PANTHER GO-Slim Cellular Component | # | # | Expected | Fold Enrichment | +/− | Raw p Value | FDR |
| secretory granule | 64 | 18 | 5.74 | 3.14 | + | 9.85 × 10⁻⁵ | 6.25 × 10⁻³ |
| secretory vesicle | 146 | 31 | 13.09 | 2.37 | + | 5.17 × 10⁻⁵ | 4.38 × 10⁻³ |
| membrane-bounded organelle | 5999 | 636 | 538.00 | 1.18 | + | 2.42 × 10⁻⁶ | 4.09 × 10⁻⁴ |
| organelle | 6781 | 714 | 608.13 | 1.17 | + | 7.48 × 10⁻⁷ | 3.80 × 10⁻⁴ |
| intracellular organelle | 6633 | 692 | 594.86 | 1.16 | + | 5.06 × 10⁻⁶ | 6.43 × 10⁻⁴ |
| PANTHER Protein Class | # | # | Expected | Fold Enrichment | +/− | Raw p Value | FDR |
| immunoglobulin superfamily cell adhesion molecule | 24 | 12 | 2.15 | 5.58 | + | 1.80 × 10⁻⁵ | 1.16 × 10⁻³ |
| immunoglobulin receptor superfamily | 191 | 36 | 17.13 | 2.10 | + | 1.34 × 10⁻⁴ | 6.44 × 10⁻³ |
| C2H2 zinc finger transcription factor | 460 | 84 | 41.25 | 2.04 | + | 2.04 × 10⁻⁸ | 3.94 × 10⁻⁶ |
| zinc finger transcription factor | 541 | 89 | 48.52 | 1.83 | + | 4.55 × 10⁻⁷ | 4.39 × 10⁻⁵ |
| serine protease | 198 | 33 | 17.76 | 1.86 | + | 1.65 × 10⁻³ | 4.55 × 10⁻² |
| PANTHER Pathways | # | # | Expected | Fold Enrichment | +/− | Raw p Value | FDR |
| VEGF signaling pathway | 68 | 14 | 6.10 | 2.30 | + | 7.61 × 10⁻³ | 1.00 |
| Cadherin signaling pathway | 164 | 5 | 14.71 | .34 | − | 1.04 × 10⁻² | 8.73 × 10⁻¹ |
| Angiogenesis | 175 | 26 | 15.69 | 1.66 | + | 1.98 × 10⁻² | 1.00 |
| p38 MAPK pathway | 41 | 8 | 3.68 | 2.18 | + | 6.01 × 10⁻² | 1.00 |
| EGF receptor signaling pathway | 141 | 20 | 12.65 | 1.58 | + | 6.02 × 10⁻² | 1.00 |
| Client Text Box Input (Hierarchy) | |||||||
|---|---|---|---|---|---|---|---|
| PANTHER GO-Slim Biological Process | # | # | Expected | Fold Enrichment | +/− | Raw p Value | FDR |
| biological adhesion | 366 | 75 | 21.82 | 3.44 | + | 5.83 × 10⁻¹ | 6.36 × 10⁻¹⁵ |
| cell adhesion | 366 | 75 | 21.82 | 3.44 | + | 5.83 × 10⁻¹⁸ | 1.27 × 10⁻¹⁴ |
| peptidyl-tyrosine modification | 53 | 13 | 3.16 | 4.11 | + | 6.68 × 10⁻⁵ | 2.08 × 10⁻² |
| cellular response to biotic stimulus | 41 | 12 | 2.44 | 4.91 | + | 2.97 × 10⁻⁵ | 2.16 × 10⁻² |
| response to molecule of bacterial origin | 45 | 12 | 2.68 | 4.47 | + | 6.39 × 10⁻⁵ | 2.32 × 10⁻² |
| PANTHER GO-Slim Molecular Function | # | # | Expected | Fold Enrichment | +/− | Raw p Value | FDR |
| chloride transmembrane transporter activity | 79 | 15 | 4.71 | 3.18 | + | 2.32 × 10⁻⁴ | 6.44 × 10⁻² |
| inorganic anion transmembrane transporter activity | 91 | 17 | 5.43 | 3.13 | + | 1.09 × 10⁻⁴ | 6.03 × 10⁻² |
| anion transmembrane transporter activity | 221 | 29 | 13.18 | 2.20 | + | 2.43 × 10⁻⁴ | 4.50 × 10⁻² |
| PANTHER GO-Slim Cellular Component | # | # | Expected | Fold Enrichment | +/− | Raw p Value | FDR |
| integral component of plasma membrane | 786 | 110 | 46.87 | 2.35 | + | 1.00 × 10⁻¹⁴ | 2.55 × 10⁻¹² |
| intrinsic component of plasma membrane | 798 | 111 | 47.58 | 2.33 | + | 8.84 × 10⁻¹⁵ | 4.49 × 10⁻¹² |
| membrane | 4165 | 304 | 248.34 | 1.22 | + | 1.76 × 10⁻⁴ | 1.78 × 10⁻² |
| intrinsic component of membrane | 1180 | 135 | 70.36 | 1.92 | + | 6.44 × 10⁻¹² | 8.18 × 10⁻¹⁰ |
| integral component of membrane | 1151 | 133 | 68.63 | 1.94 | + | 5.50 × 10⁻¹² | 9.32 × 10⁻¹⁰ |
| PANTHER Protein Class | # | # | Expected | Fold Enrichment | +/− | Raw p Value | FDR |
| cadherin | 113 | 57 | 6.74 | 8.46 | + | 2.88 × 10⁻²⁹ | 5.56 × 10⁻²⁷ |
| cell adhesion molecule | 203 | 62 | 12.10 | 5.12 | + | 2.86 × 10⁻²² | 2.76 × 10⁻²⁰ |
| chemokine | 24 | 11 | 1.43 | 7.69 | + | 2.04 × 10⁻⁶ | 1.31 × 10⁻⁴ |
| cytokine | 102 | 17 | 6.08 | 2.80 | + | 3.59 × 10⁻⁴ | 1.39 × 10⁻² |
| intercellular signal molecule | 377 | 39 | 22.48 | 1.73 | + | 1.72 × 10⁻³ | 4.75 × 10⁻² |
| PANTHER Pathways | # | # | Expected | Fold Enrichment | +/− | Raw p Value | FDR |
| Cadherin signaling pathway | 164 | 62 | 9.78 | 6.34 | + | 2.80 × 10⁻²⁶ | 4.67 × 10⁻²⁴ |
| Wnt signaling pathway | 317 | 71 | 18.90 | 3.76 | + | 7.53 × 10⁻¹⁹ | 6.29 × 10⁻¹⁷ |
| Official Gene Symbol | Official Full Name | Score | Cytogenetic Location |
|---|---|---|---|
| T1DM-DN | |||
| EP300 | E1A binding protein p300 | 43.0 | 22q13.2 |
| RPS11 | ribosomal protein S11 | 38.0 | 19q13.33 |
| RPS5 | ribosomal protein S5 | 37.0 | 19q13.43 |
| RPS23 | ribosomal protein S23 | 35.0 | 5q14.2 |
| RPS9 | ribosomal protein S9 | 35.0 | 19q13.42 |
| GRB2 | growth factor receptor bound protein 2 | 34.0 | 17q25.1 |
| RPS15A | ribosomal protein S15a | 34.0 | 16p12.3 |
| NHP2L1 (SNU13) | small nuclear ribonucleoprotein 13 | 31.0 | 22q13.2 |
| CCNB1 | cyclin B1 | 30.0 | 5q13.2 |
| RPL3 | ribosomal protein L3 | 30.0 | 22q13.1 |
| T2DM-DN | |||
| IL6 | interleukin 6 | 30.0 | 7p15.3 |
| ACTB | actin beta | 26.0 | 7p22.1 |
| MAPK1 | mitogen-activated protein kinase 1 | 25.0 | 22q11.22 |
| RAC1 | Rac family small GTPase 1 | 25.0 | 7p22.1 |
| CYCS | cytochrome c, somatic | 21.0 | 7p15.3 |
| CXCL8 (IL8) | C-X-C motif chemokine ligand 8 | 20.0 | 4q13.3 |
| SNRPD3 | small nuclear ribonucleoprotein D3 polypeptide | 19.0 | 22q11.23 |
| CSF2 | colony stimulating factor 2 | 17.0 | 5q31.1 |
| RPL9 | ribosomal protein L9 | 17.0 | 4p14 |
| HSPA4 | heat shock protein family A (Hsp70) member 4 | 16.0 | 5q31.1 |
Publisher’s Note: MDPI stays neutral with regard to jurisdictional claims in published maps and institutional affiliations. |
© 2021 by the authors. Licensee MDPI, Basel, Switzerland. This article is an open access article distributed under the terms and conditions of the Creative Commons Attribution (CC BY) license (https://creativecommons.org/licenses/by/4.0/).
Share and Cite
Tziastoudi, M.; Cholevas, C.; Theoharides, T.C.; Stefanidis, I. Meta-Analysis and Bioinformatics Detection of Susceptibility Genes in Diabetic Nephropathy. Int. J. Mol. Sci. 2022, 23, 20. https://doi.org/10.3390/ijms23010020
Tziastoudi M, Cholevas C, Theoharides TC, Stefanidis I. Meta-Analysis and Bioinformatics Detection of Susceptibility Genes in Diabetic Nephropathy. International Journal of Molecular Sciences. 2022; 23(1):20. https://doi.org/10.3390/ijms23010020
Chicago/Turabian StyleTziastoudi, Maria, Christos Cholevas, Theoharis C. Theoharides, and Ioannis Stefanidis. 2022. "Meta-Analysis and Bioinformatics Detection of Susceptibility Genes in Diabetic Nephropathy" International Journal of Molecular Sciences 23, no. 1: 20. https://doi.org/10.3390/ijms23010020