
Cysteine–Cysteine Motif Chemokine Receptor 5 Expression in Letrozole-Induced Polycystic Ovary Syndrome Mice


 , and
, and 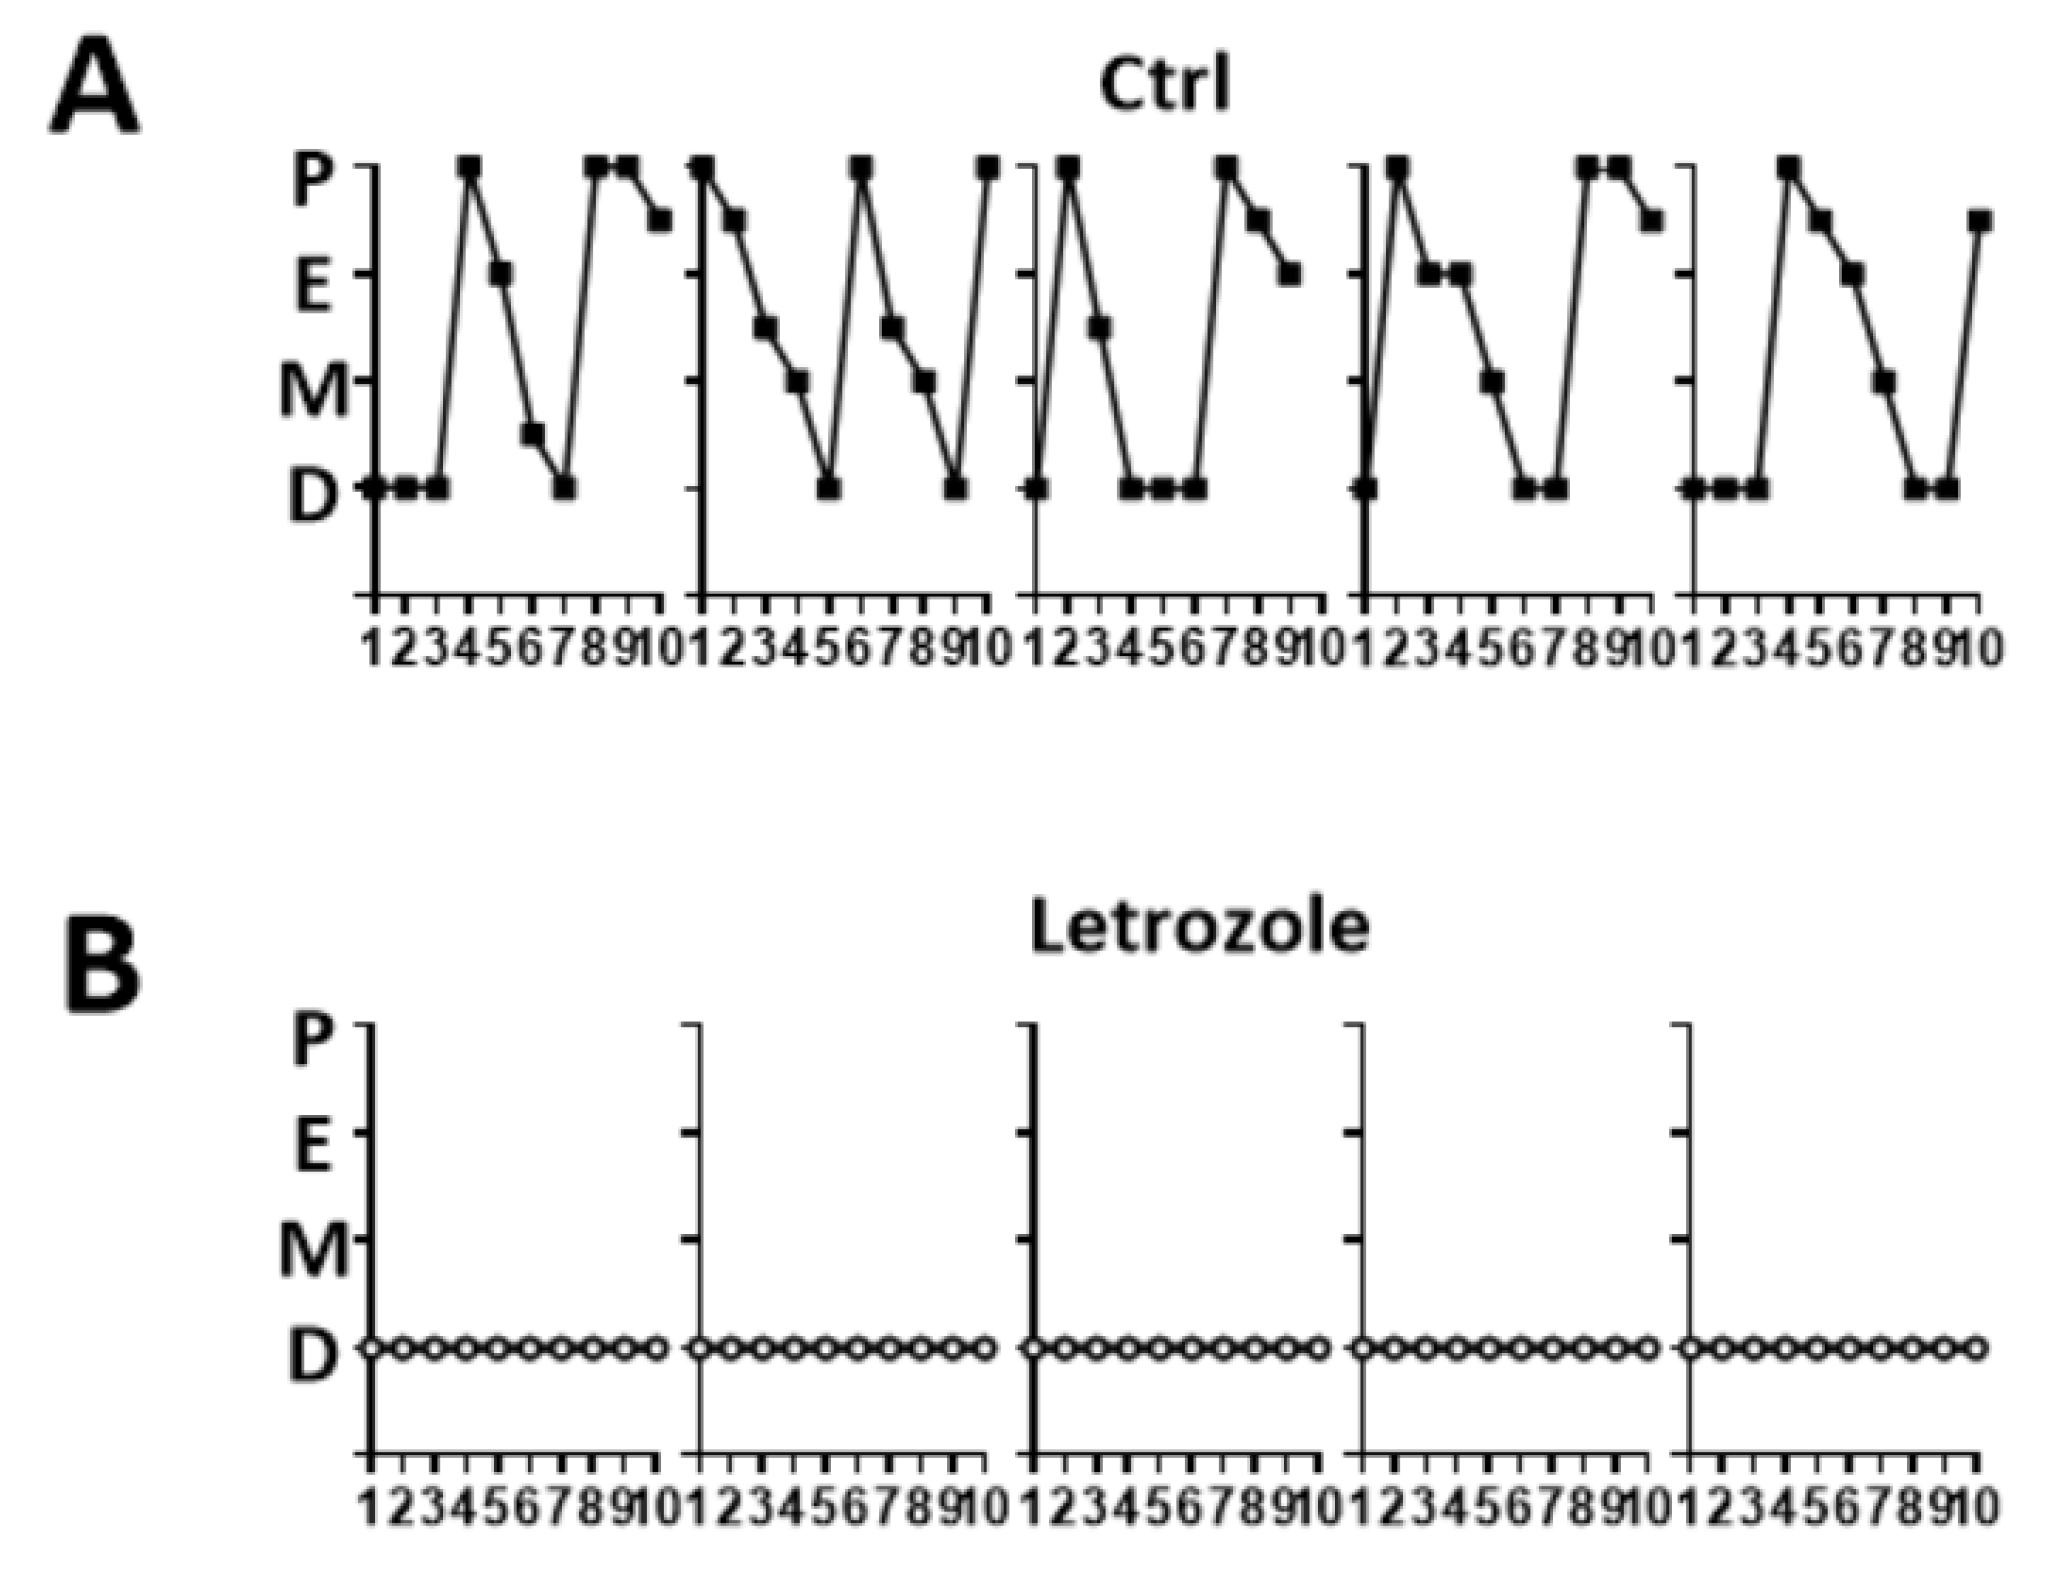
Abstract
:1. Introduction
2. Results
2.1. Abnormalities of the Estrous Cycle in the Letrozole-Treated Mice
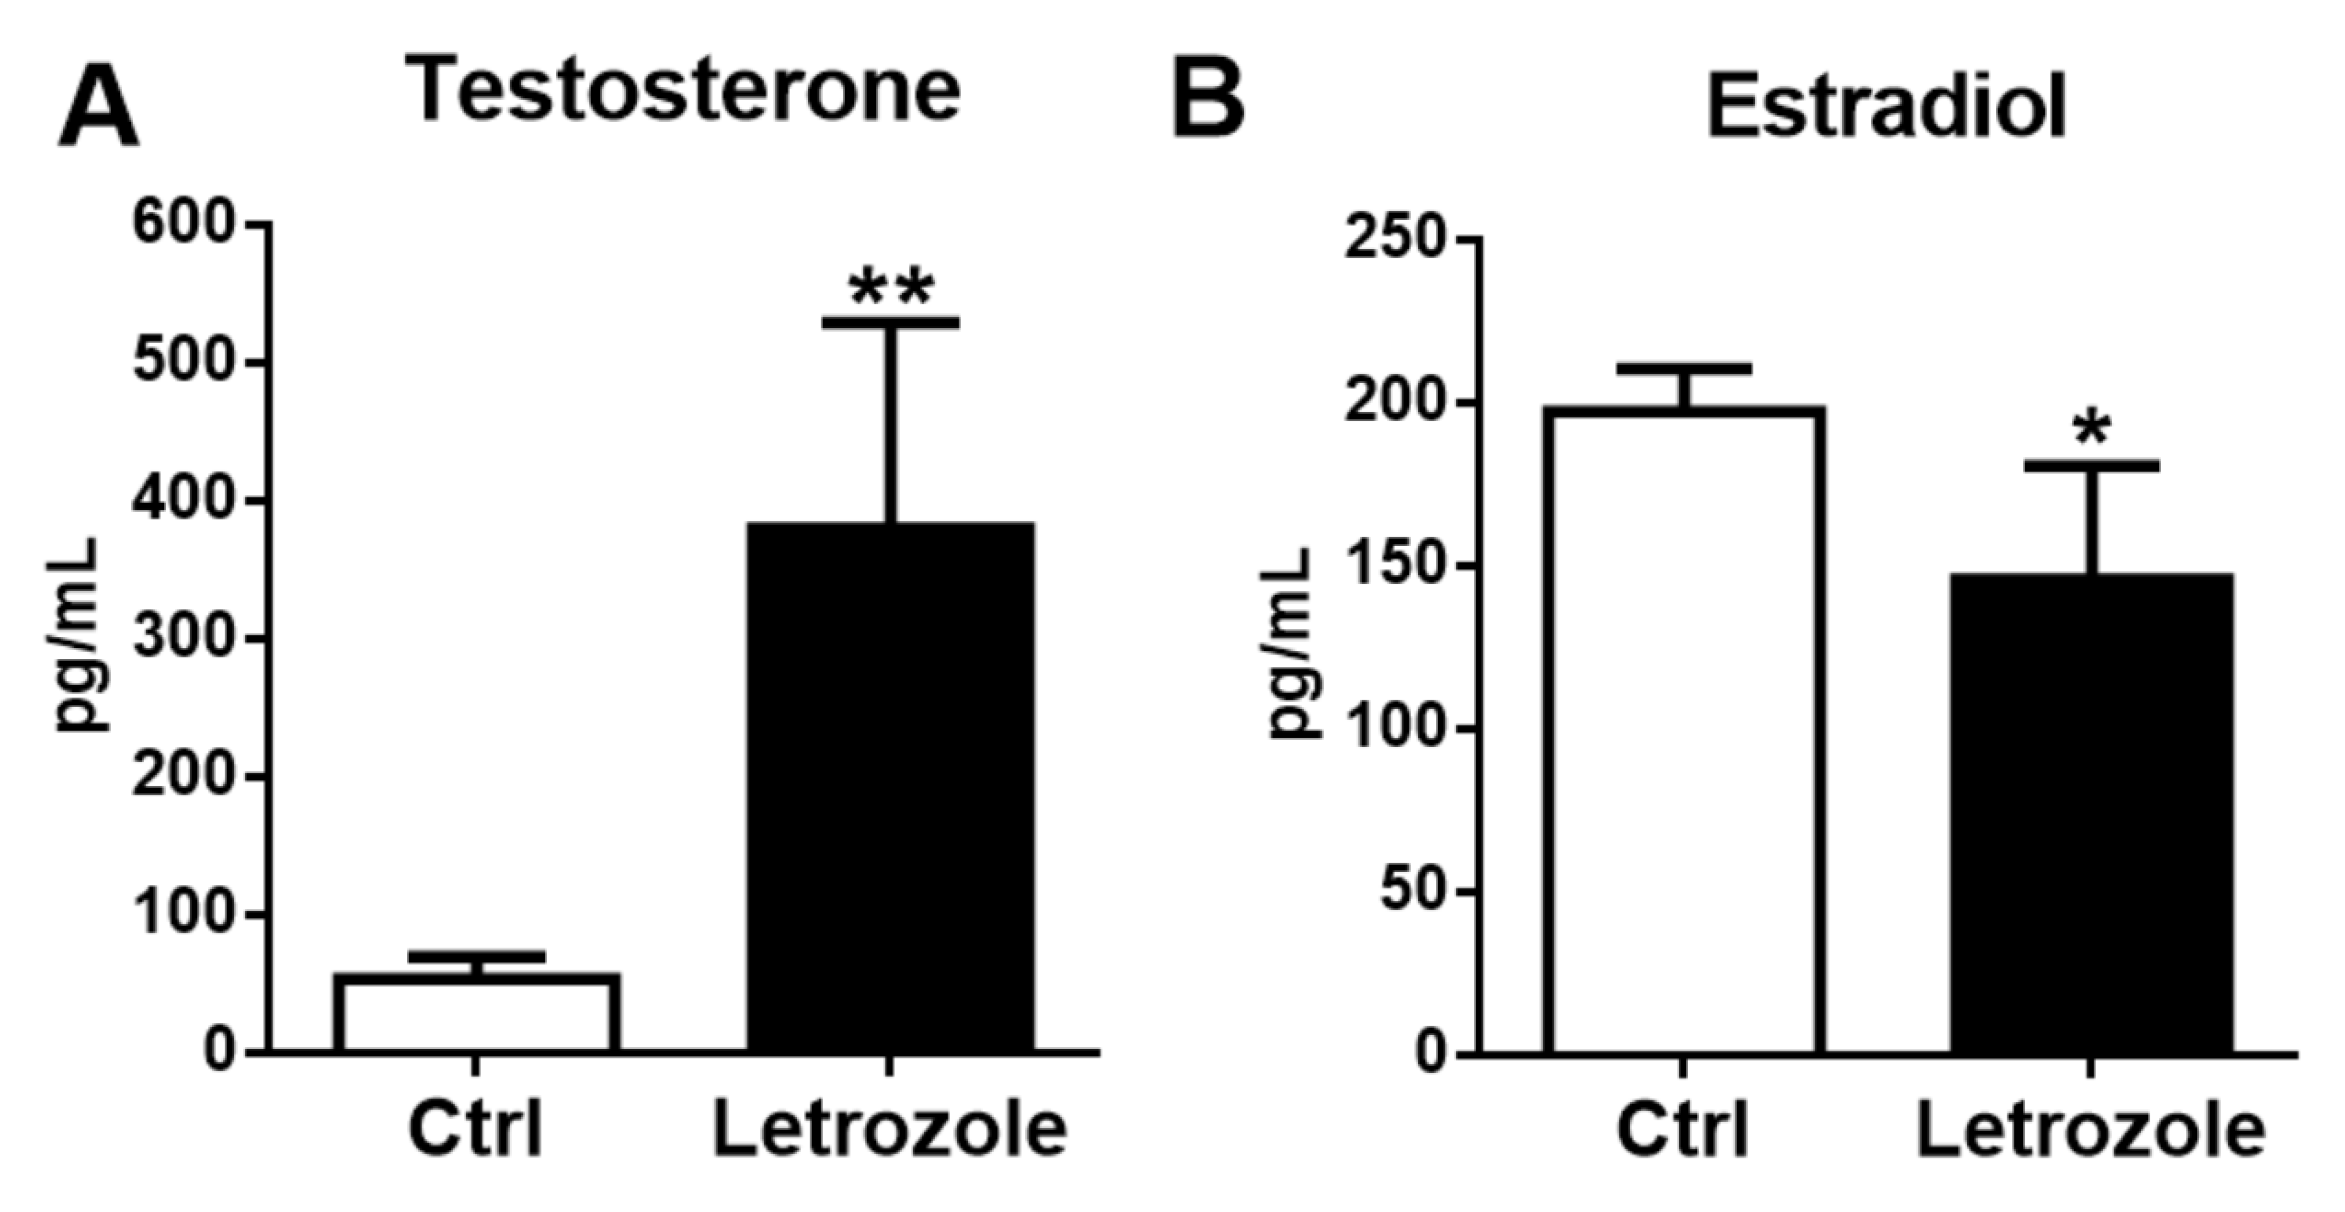
2.2. Plasma Sex Steroid Levels in the Letrozole-Treated Mice
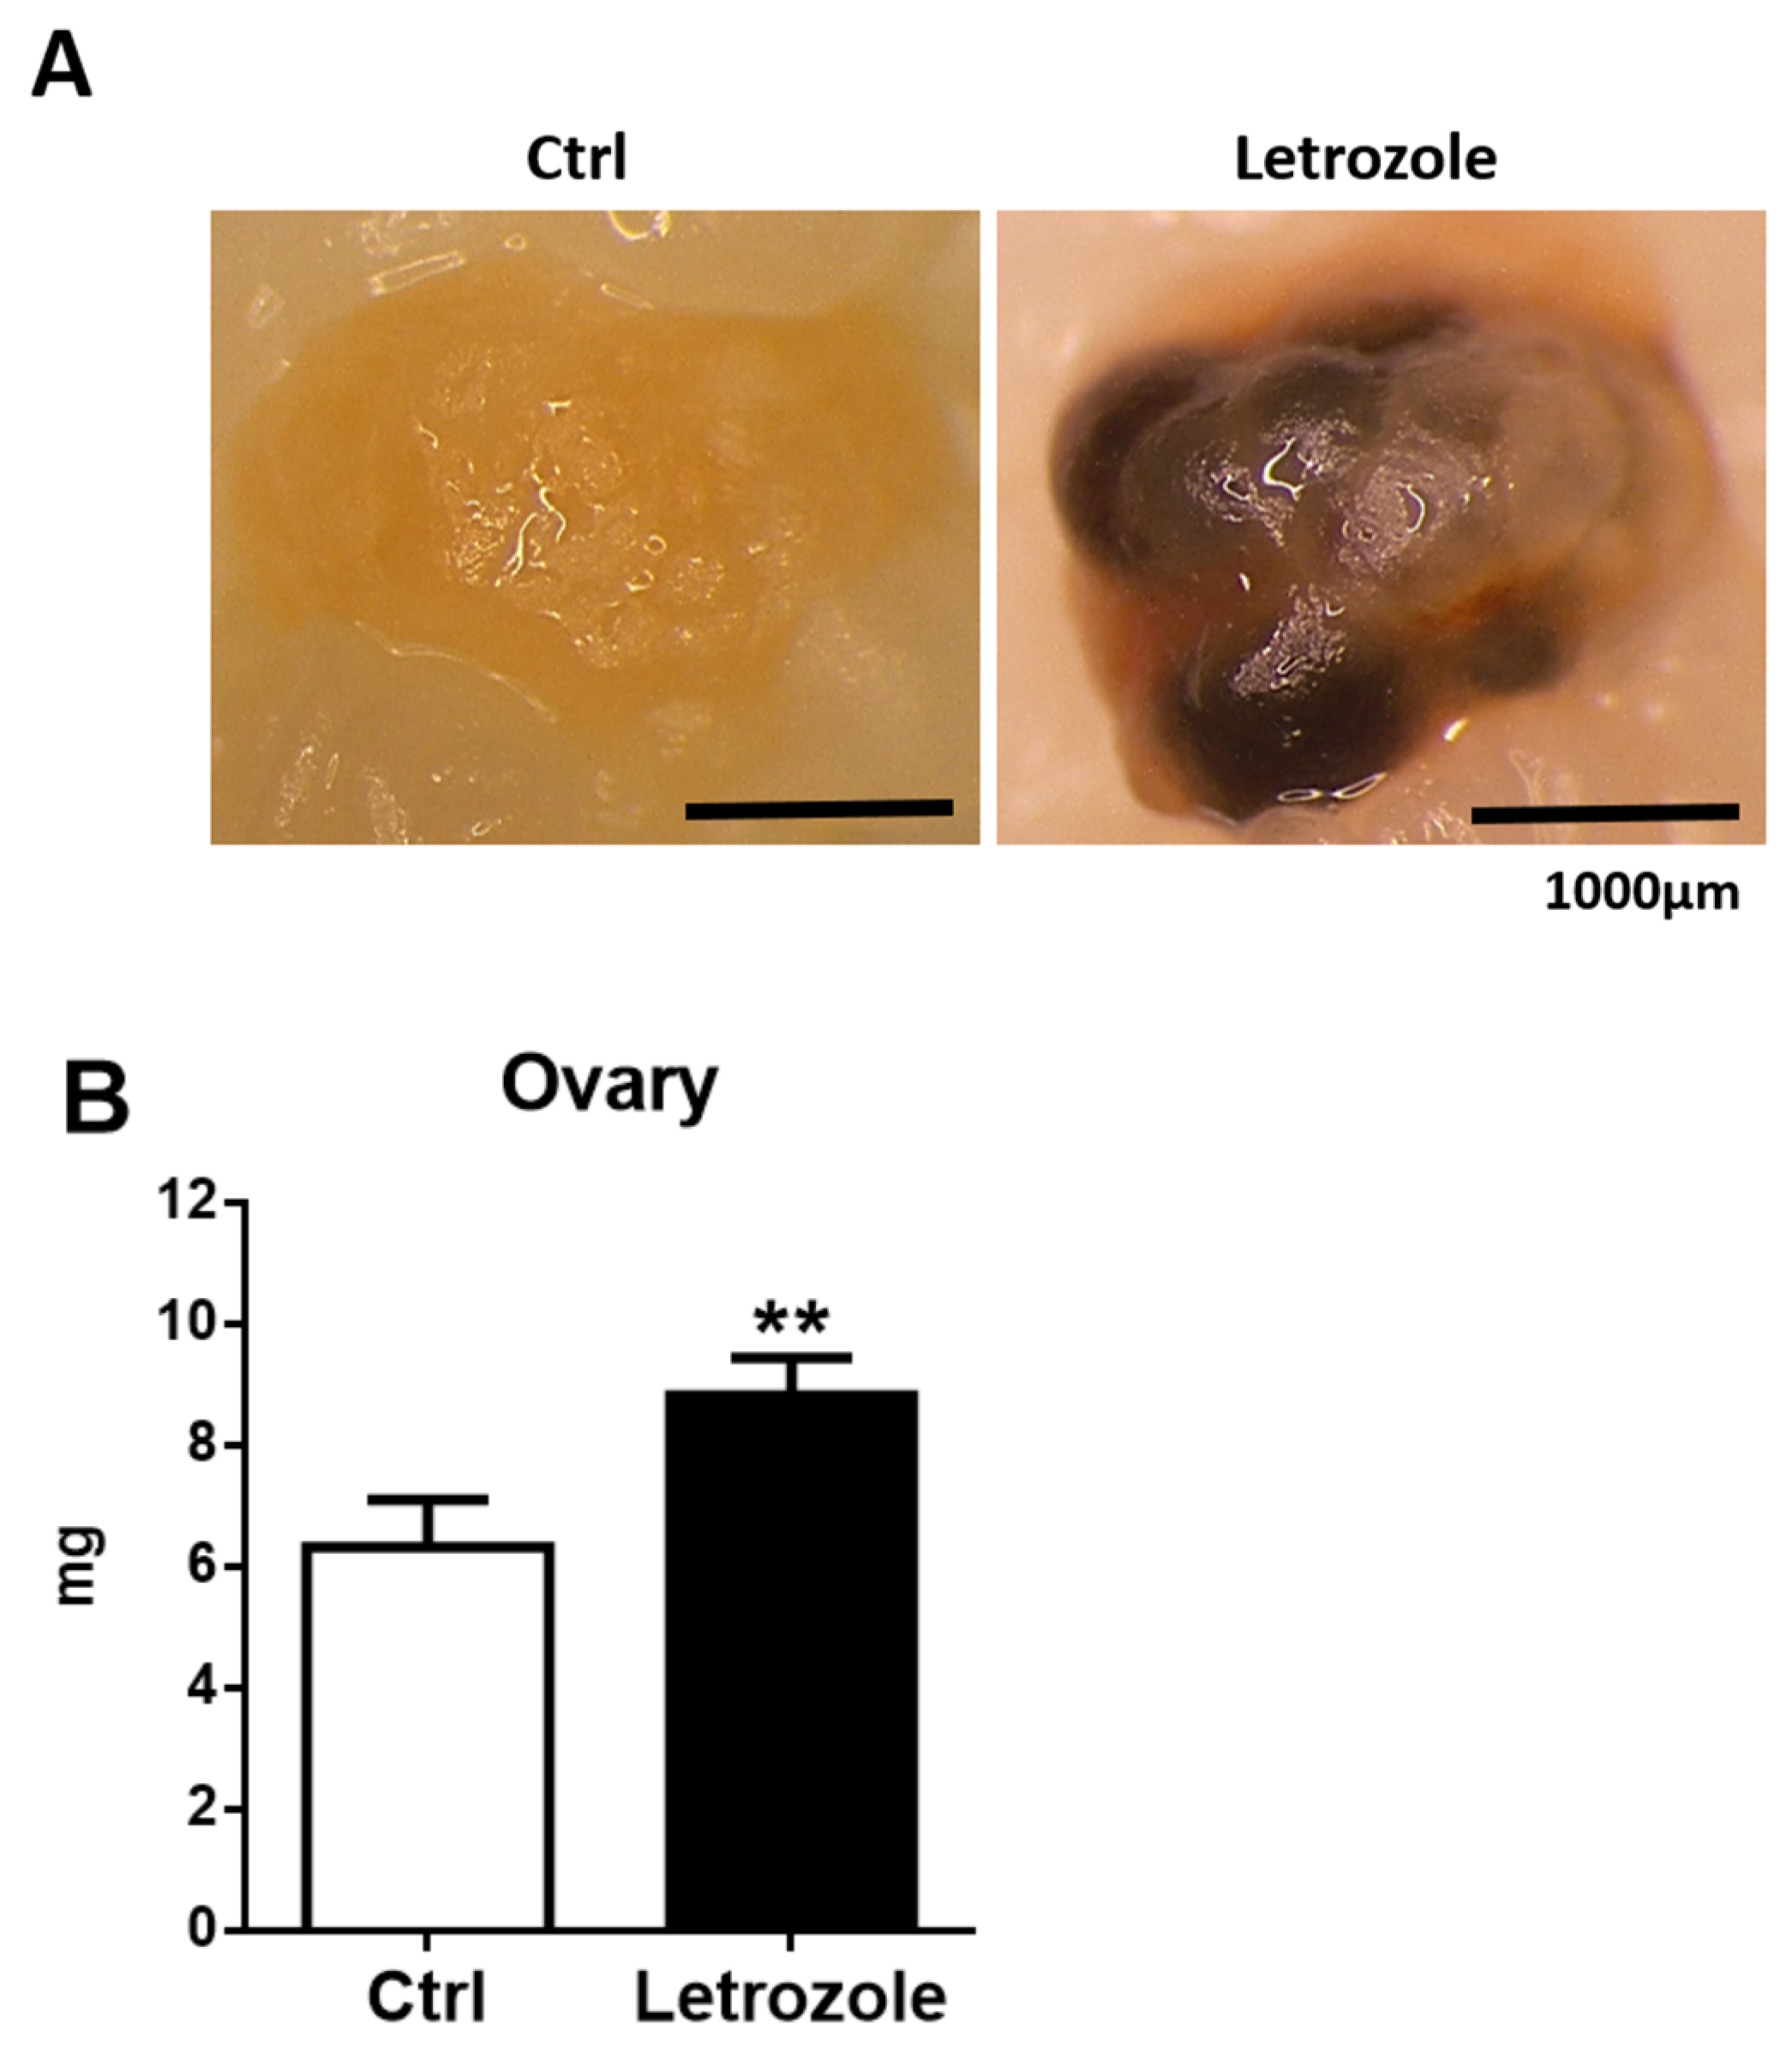
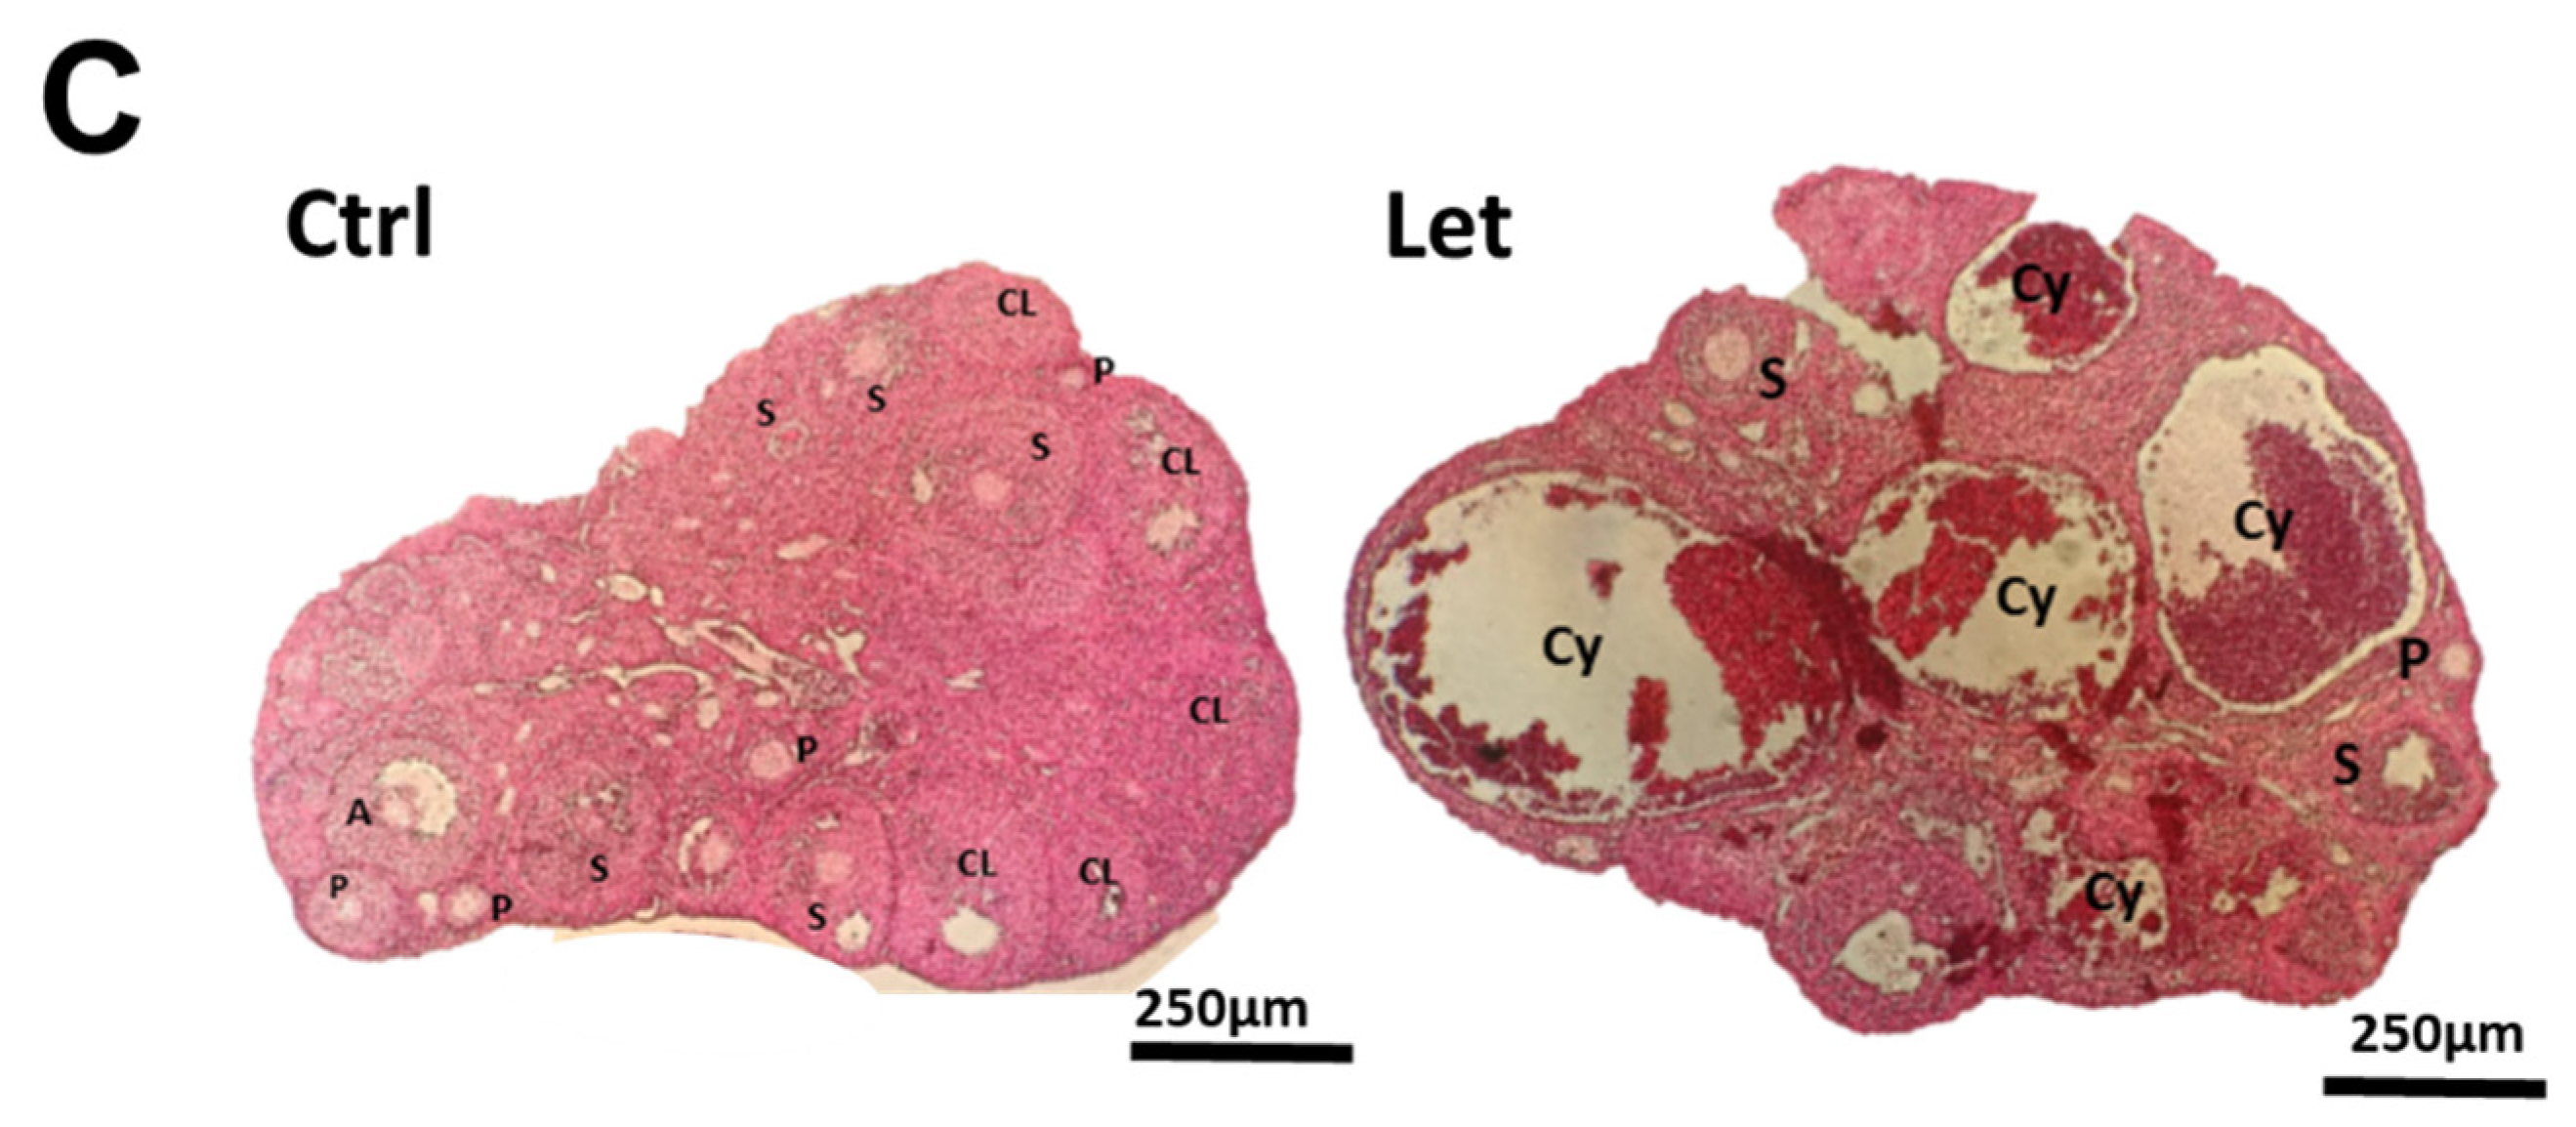
2.3. Ovarian Morphology and Weight in the Letrozole-Treated Mice
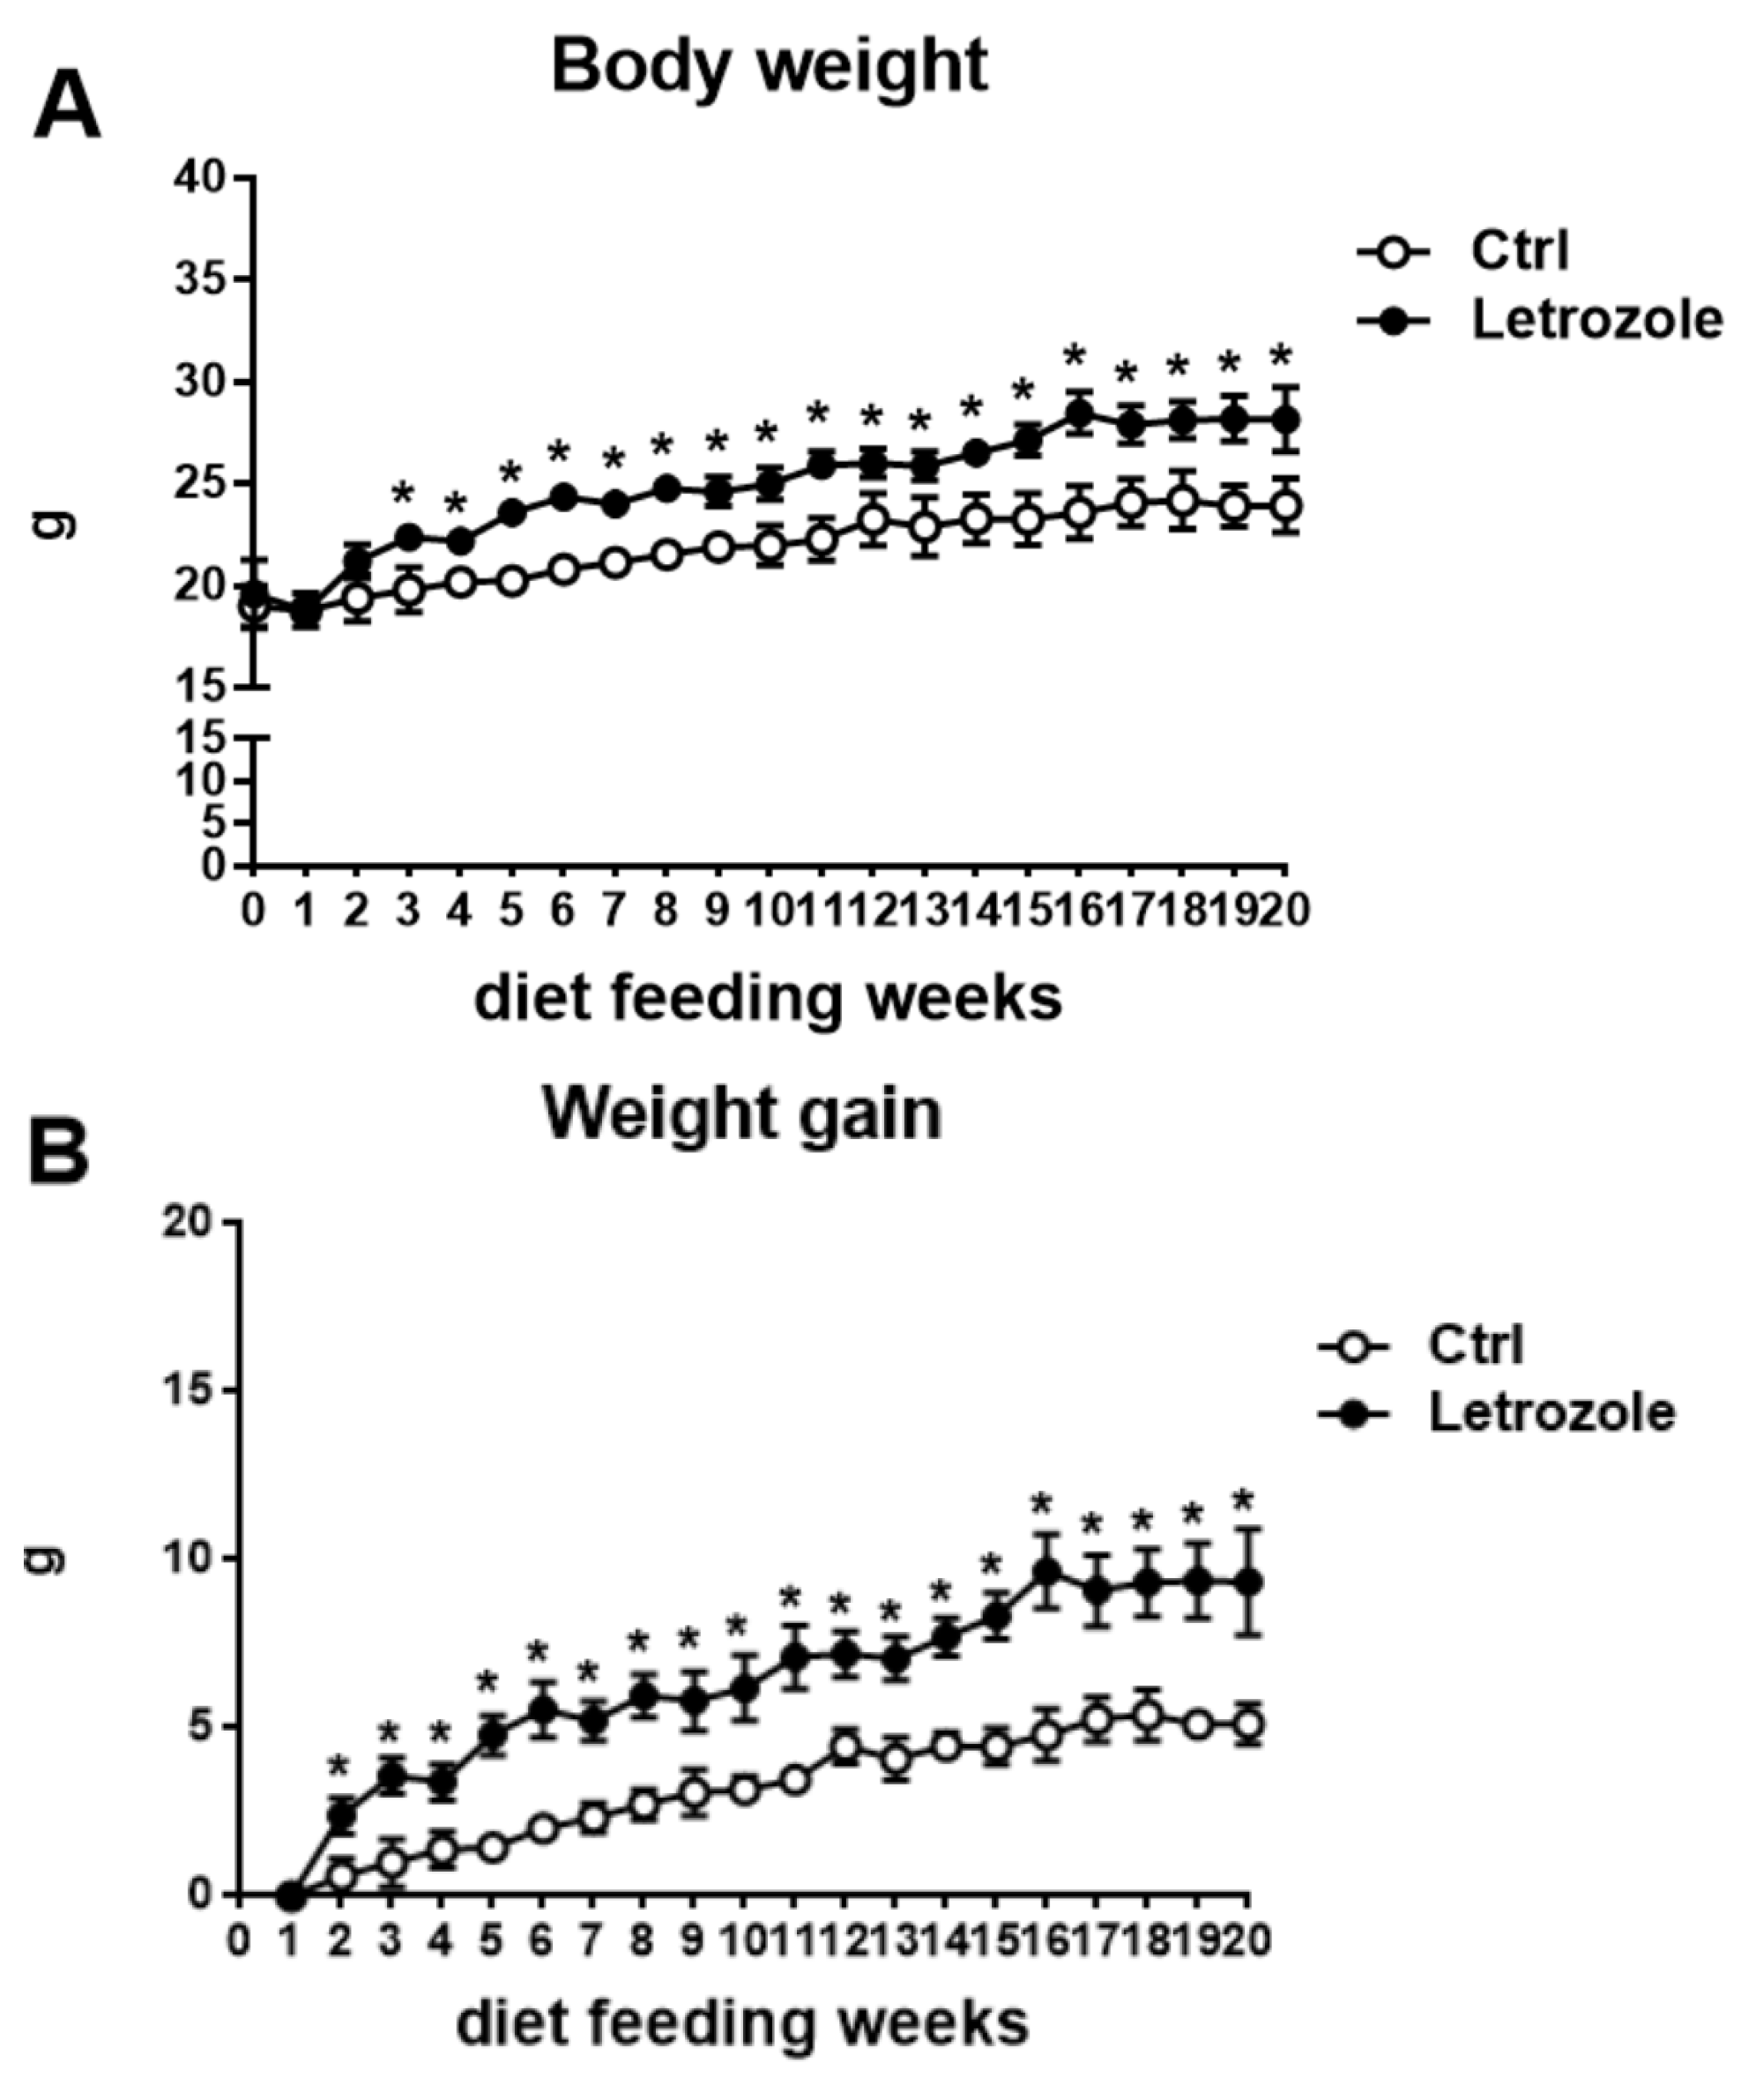
2.4. Body Weight in the Letrozole-Treated Mice
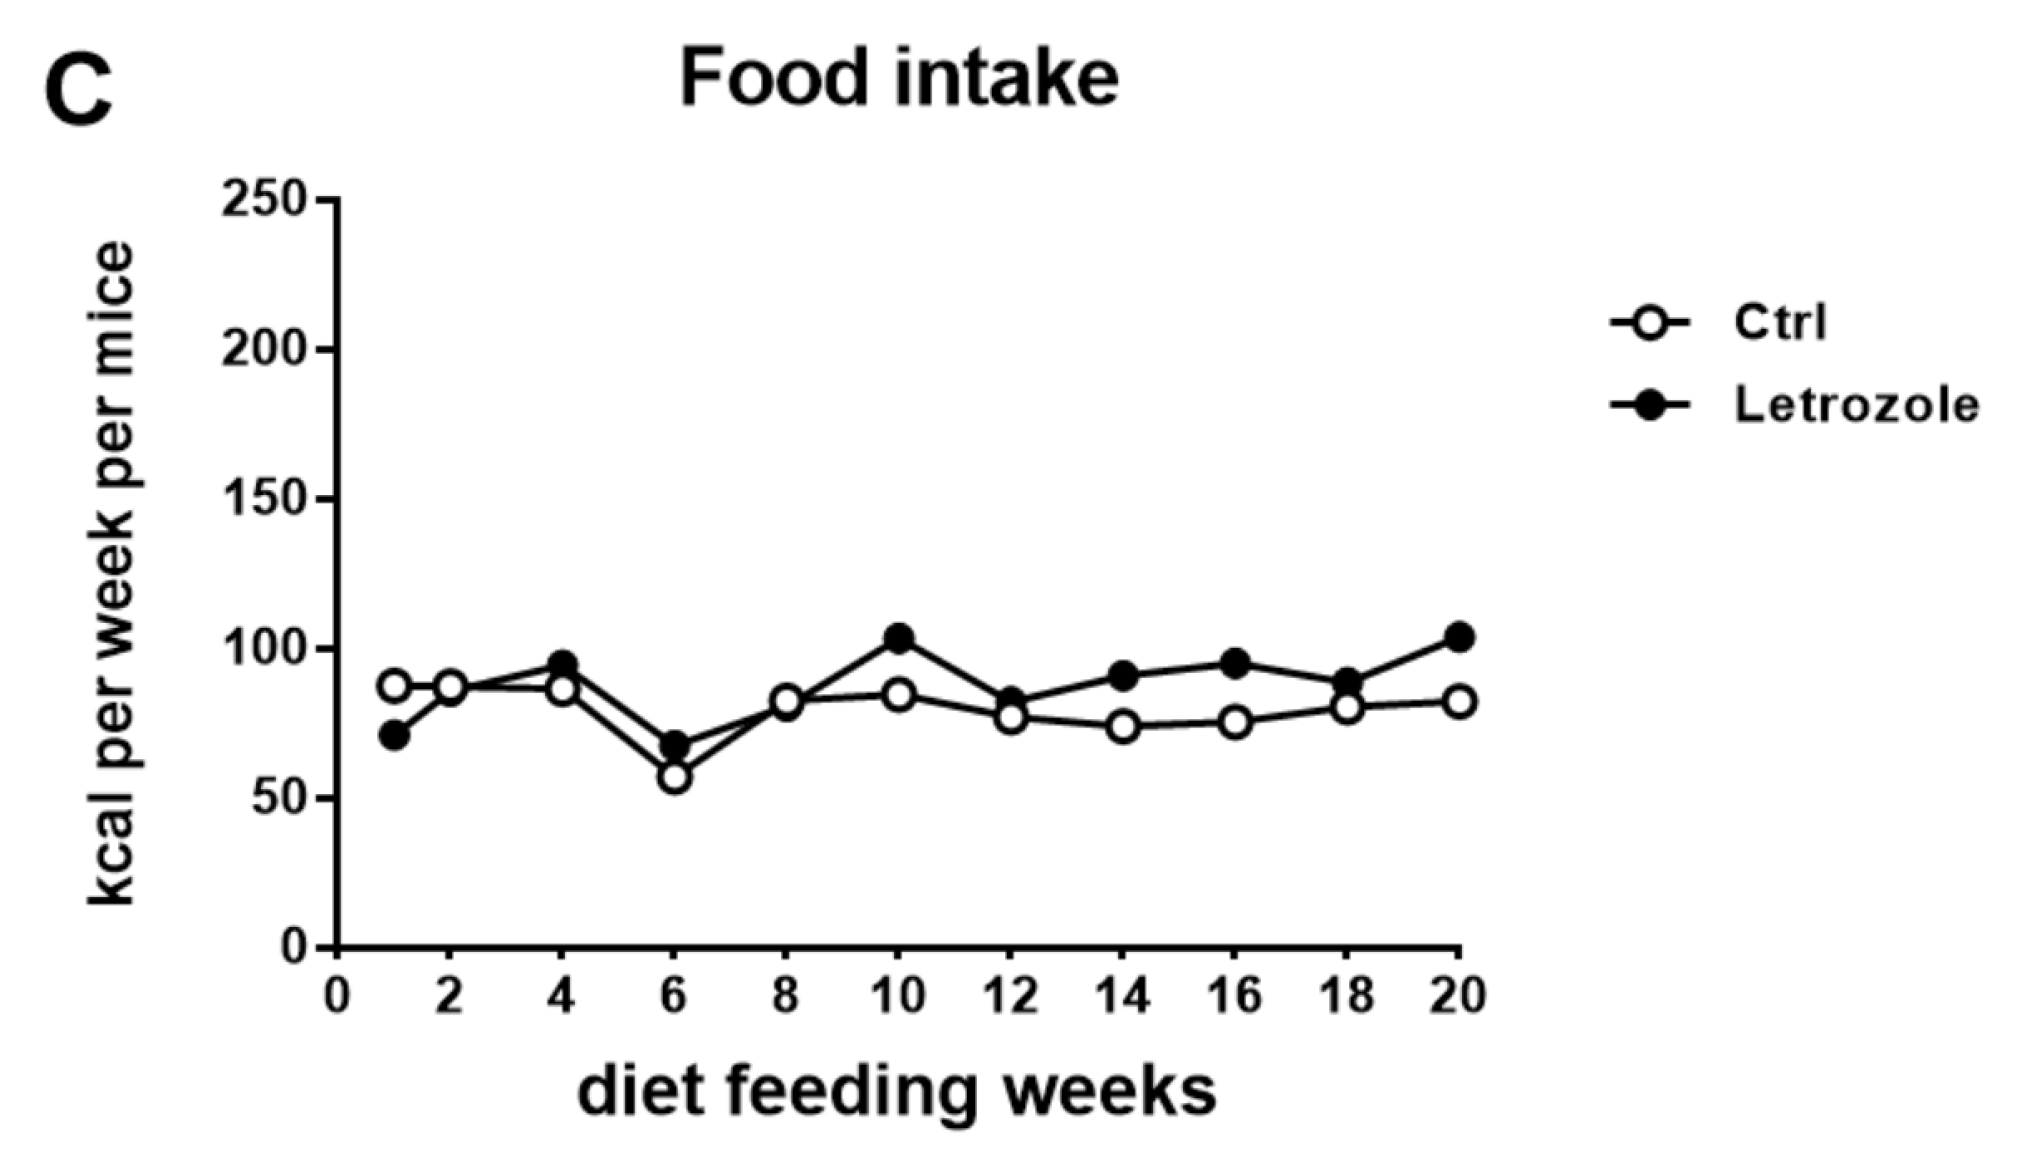
2.5. Adiposity in the Letrozole-Treated Mice
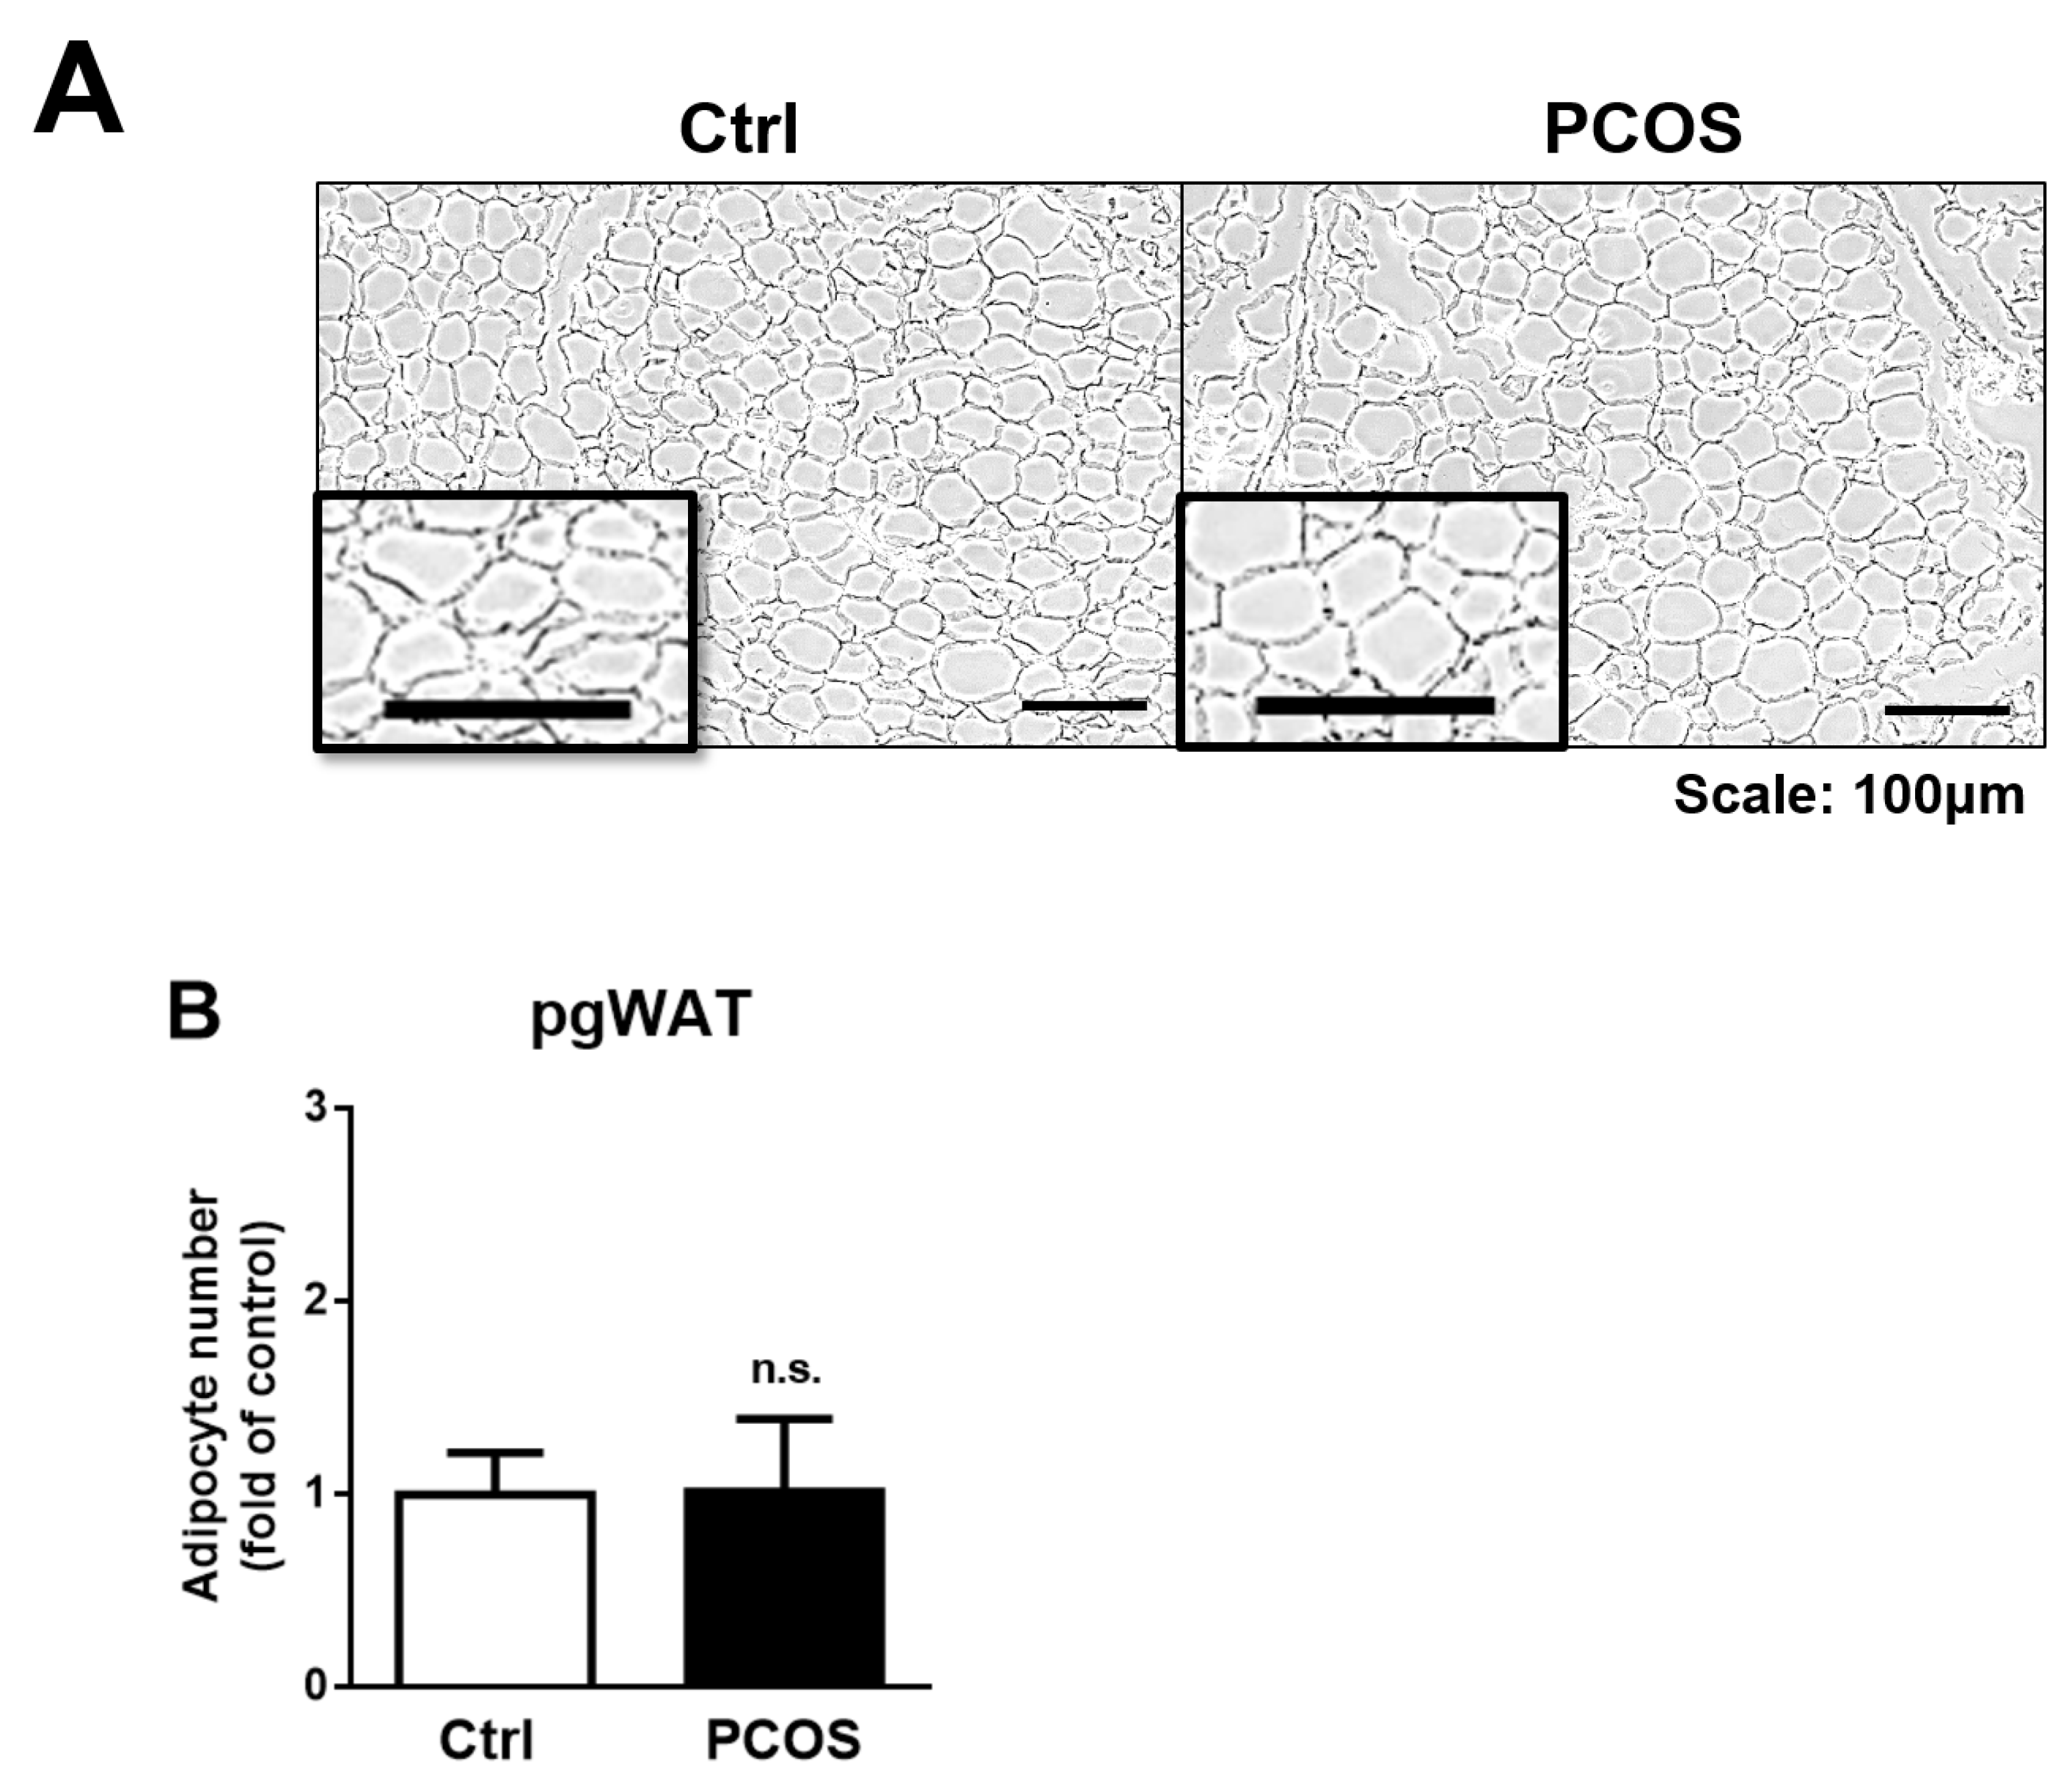
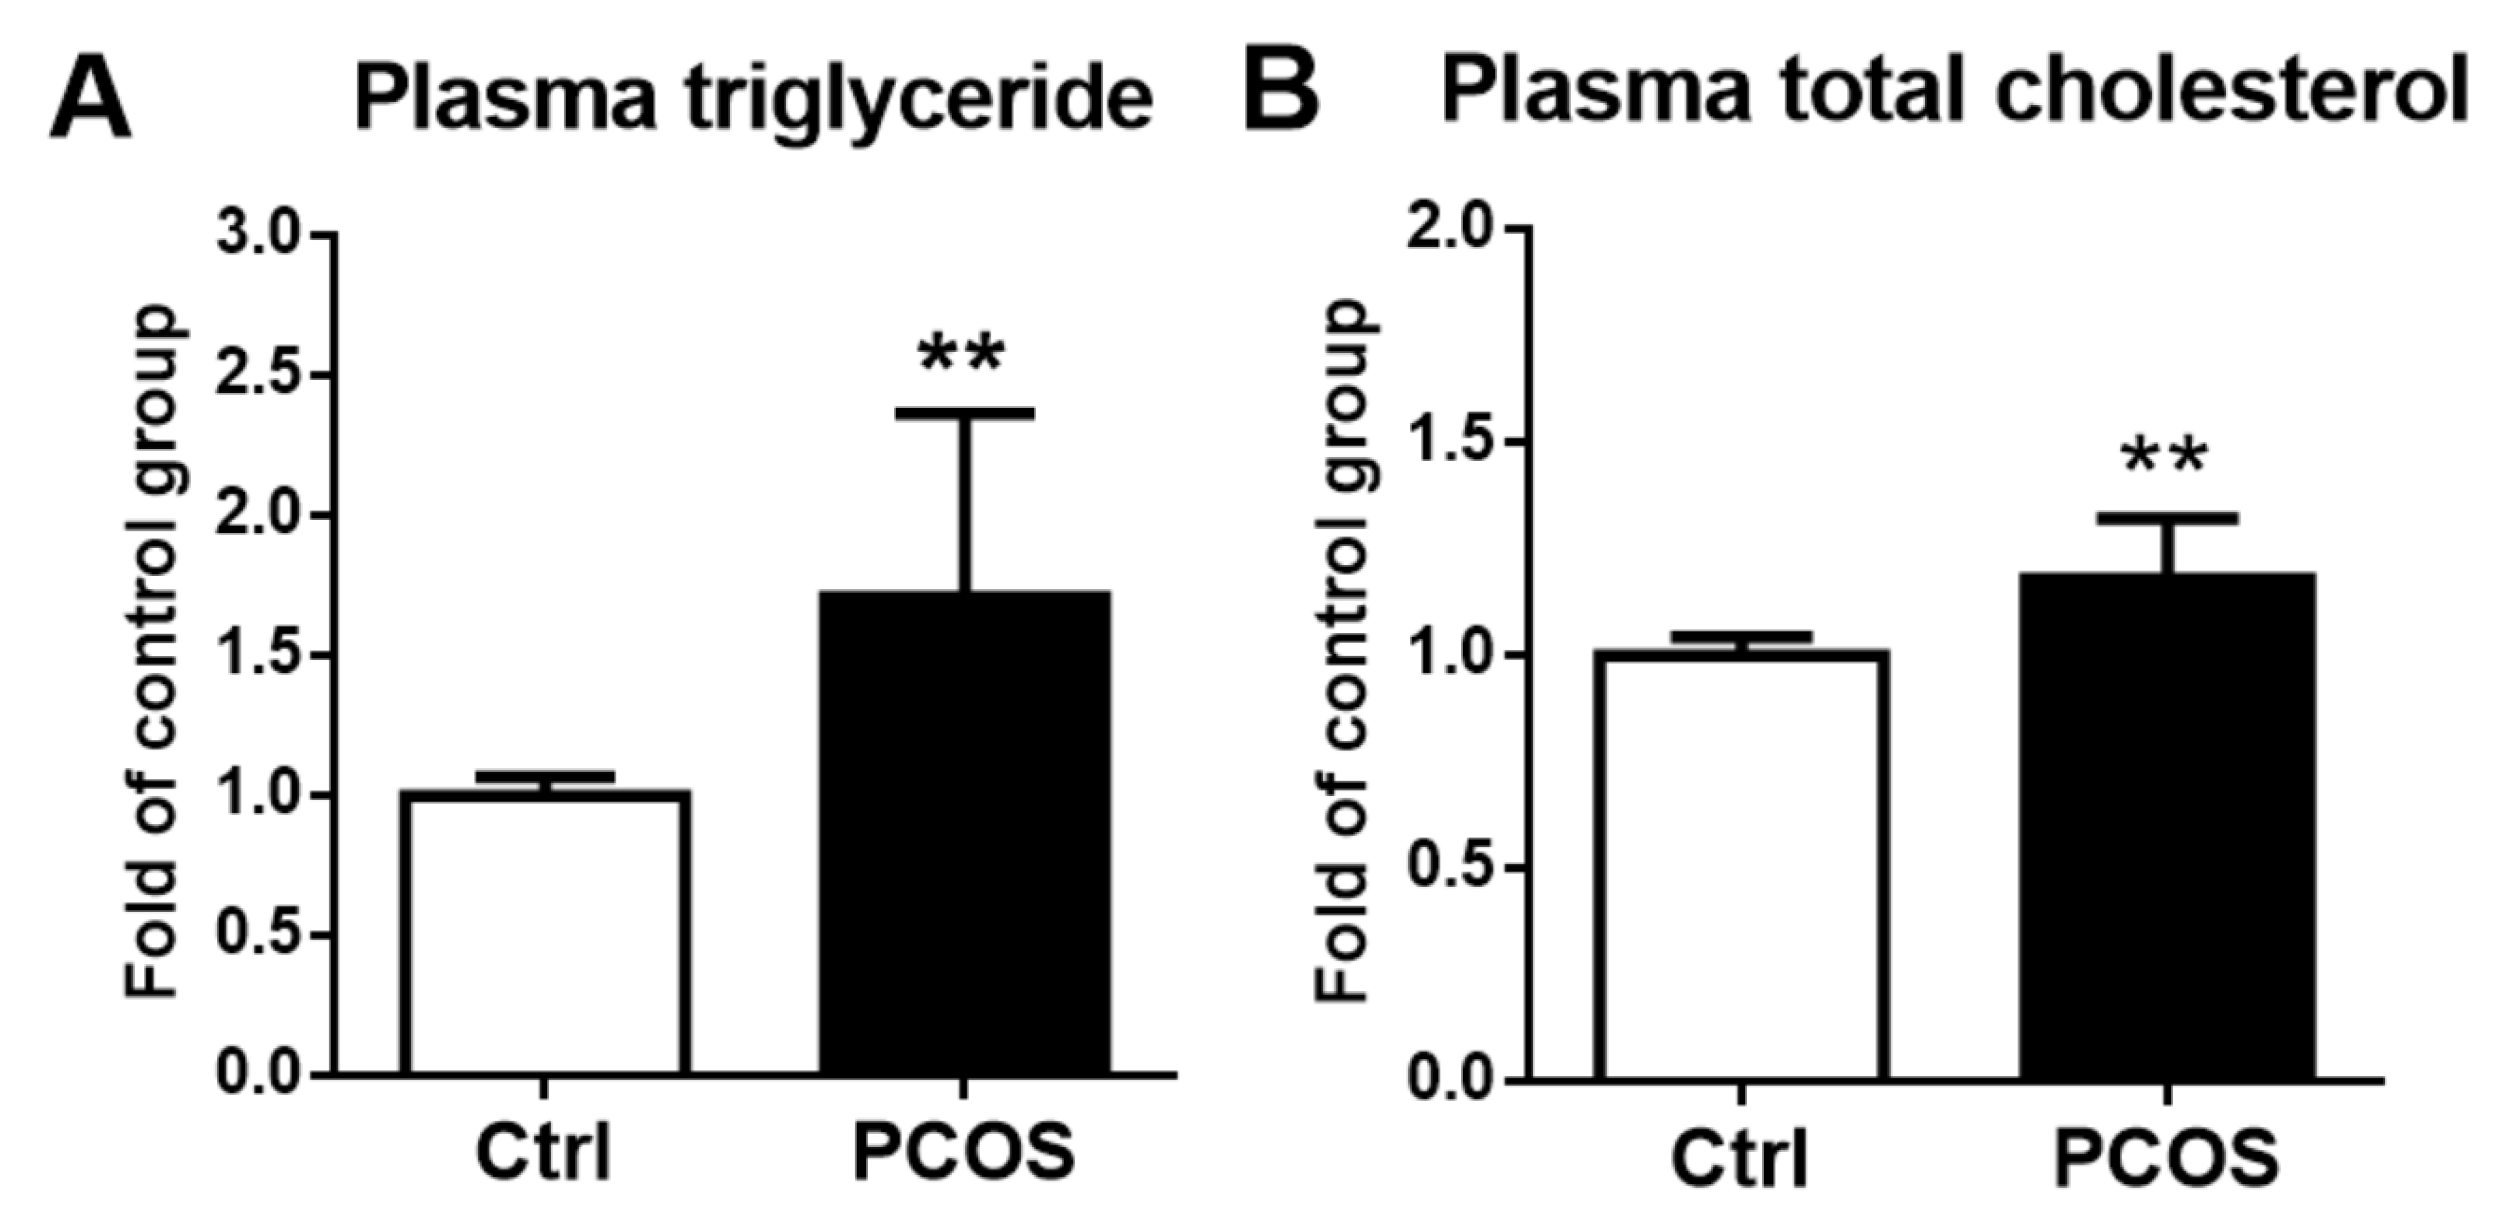
2.6. Plasma Lipid Profiles
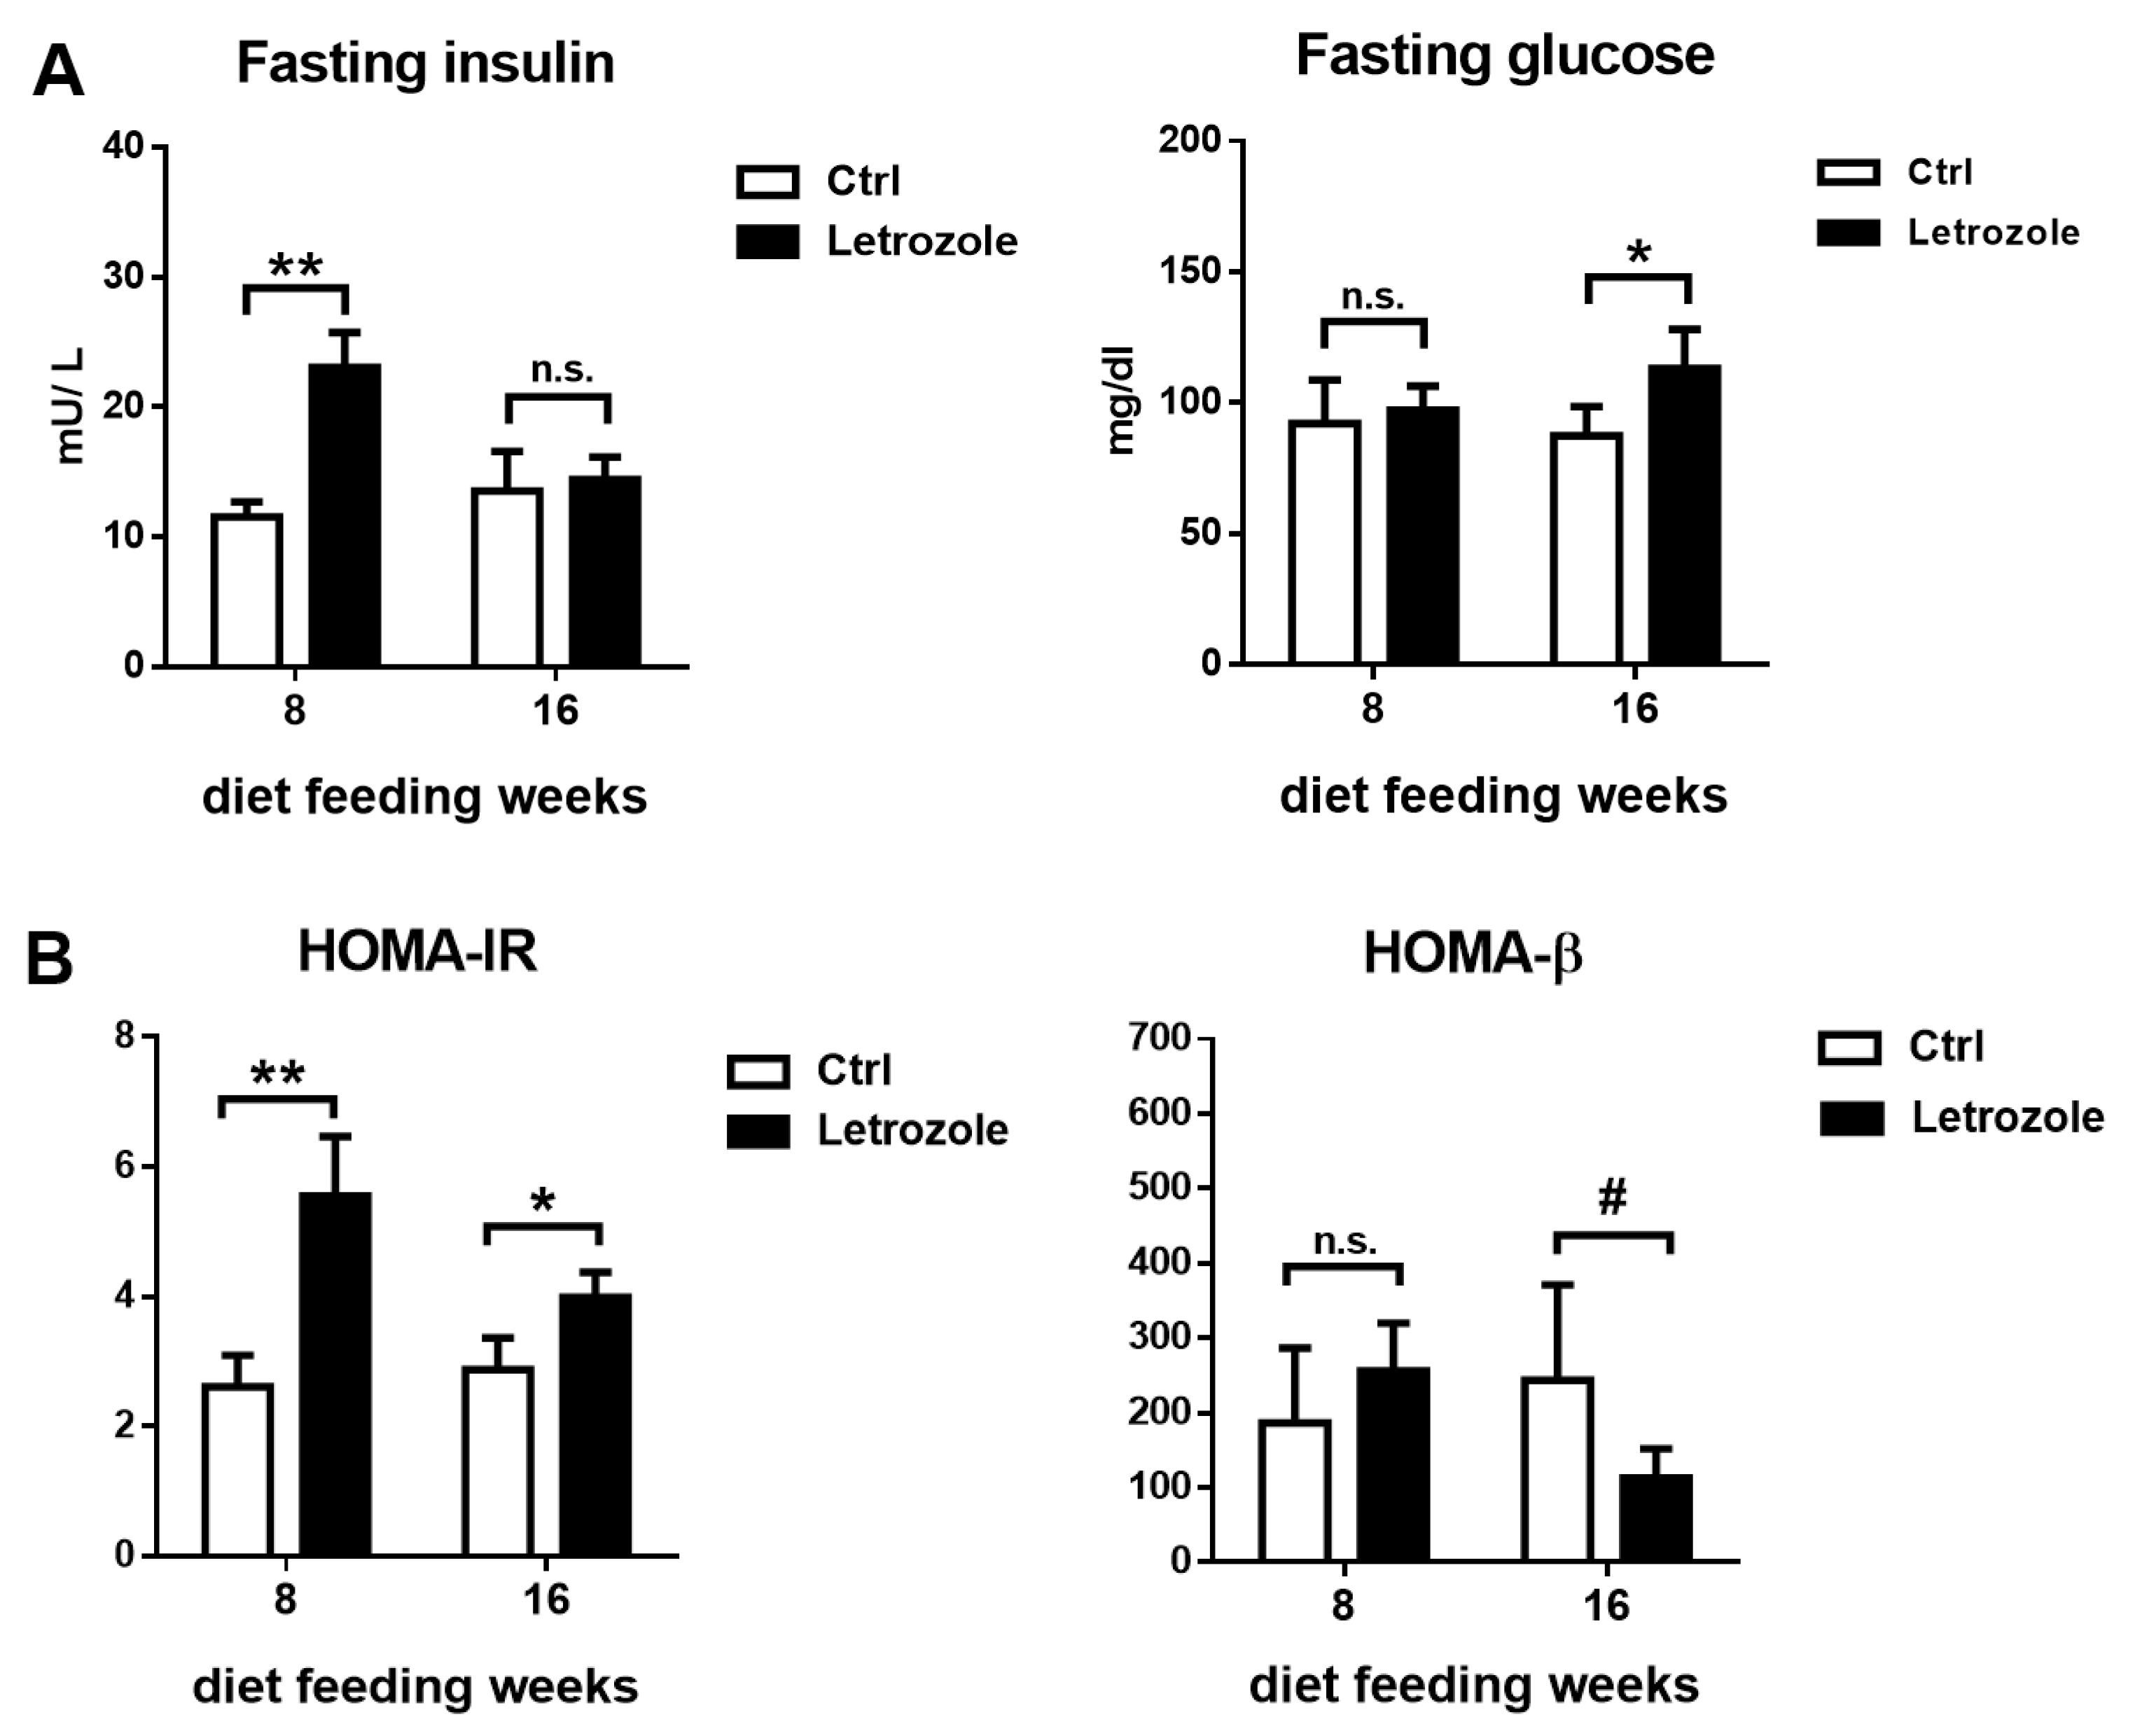
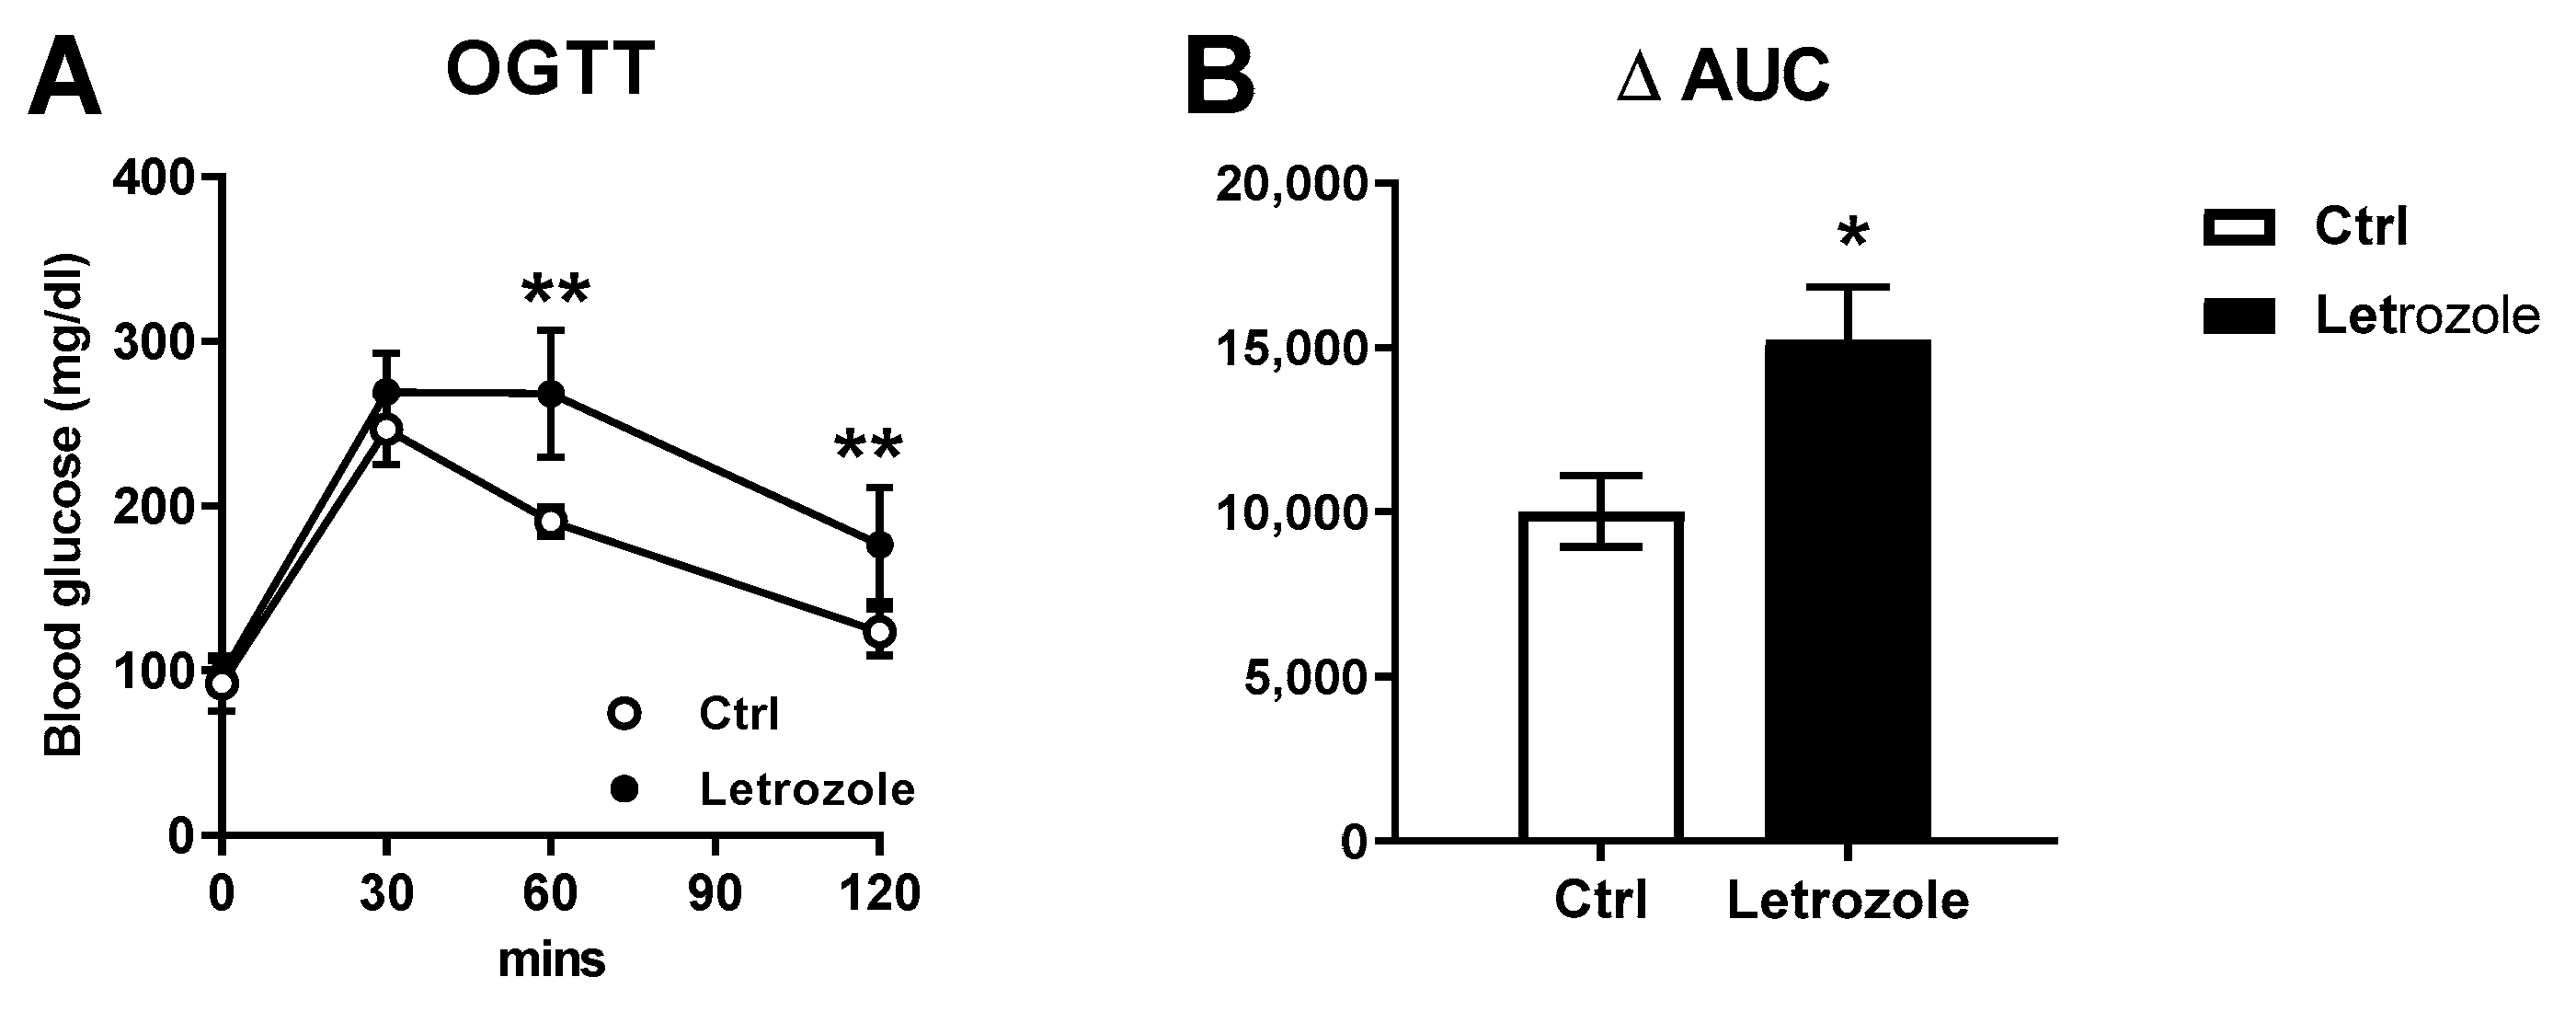
2.7. Glucose Homeostasis and Insulin Sensitivity Test
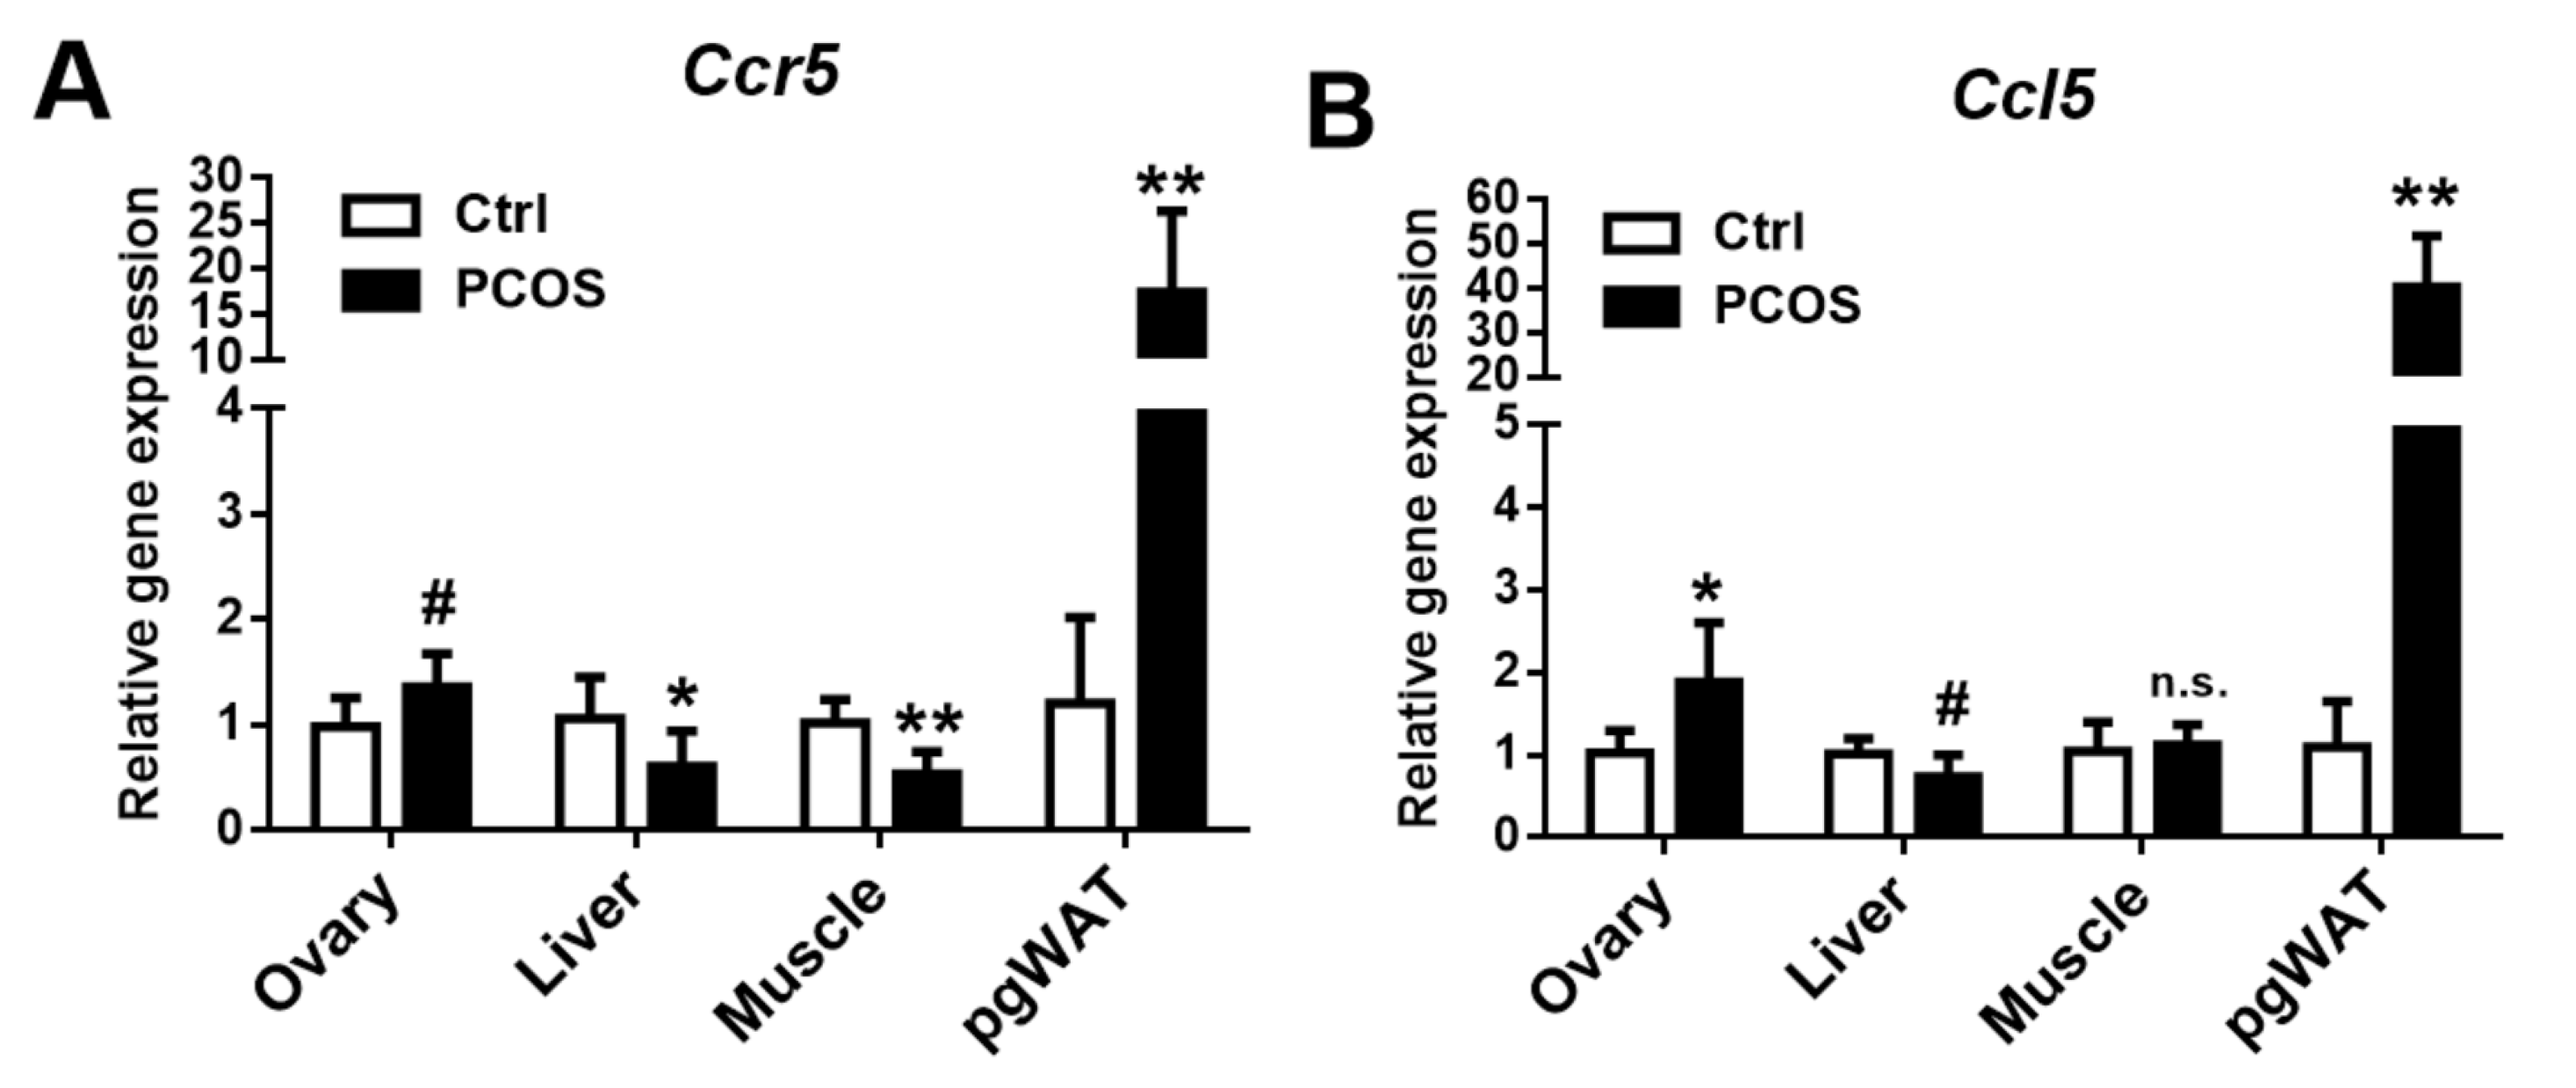
2.8. CCR5 and CCL5 Expression in the Letrozole-Treated Mice
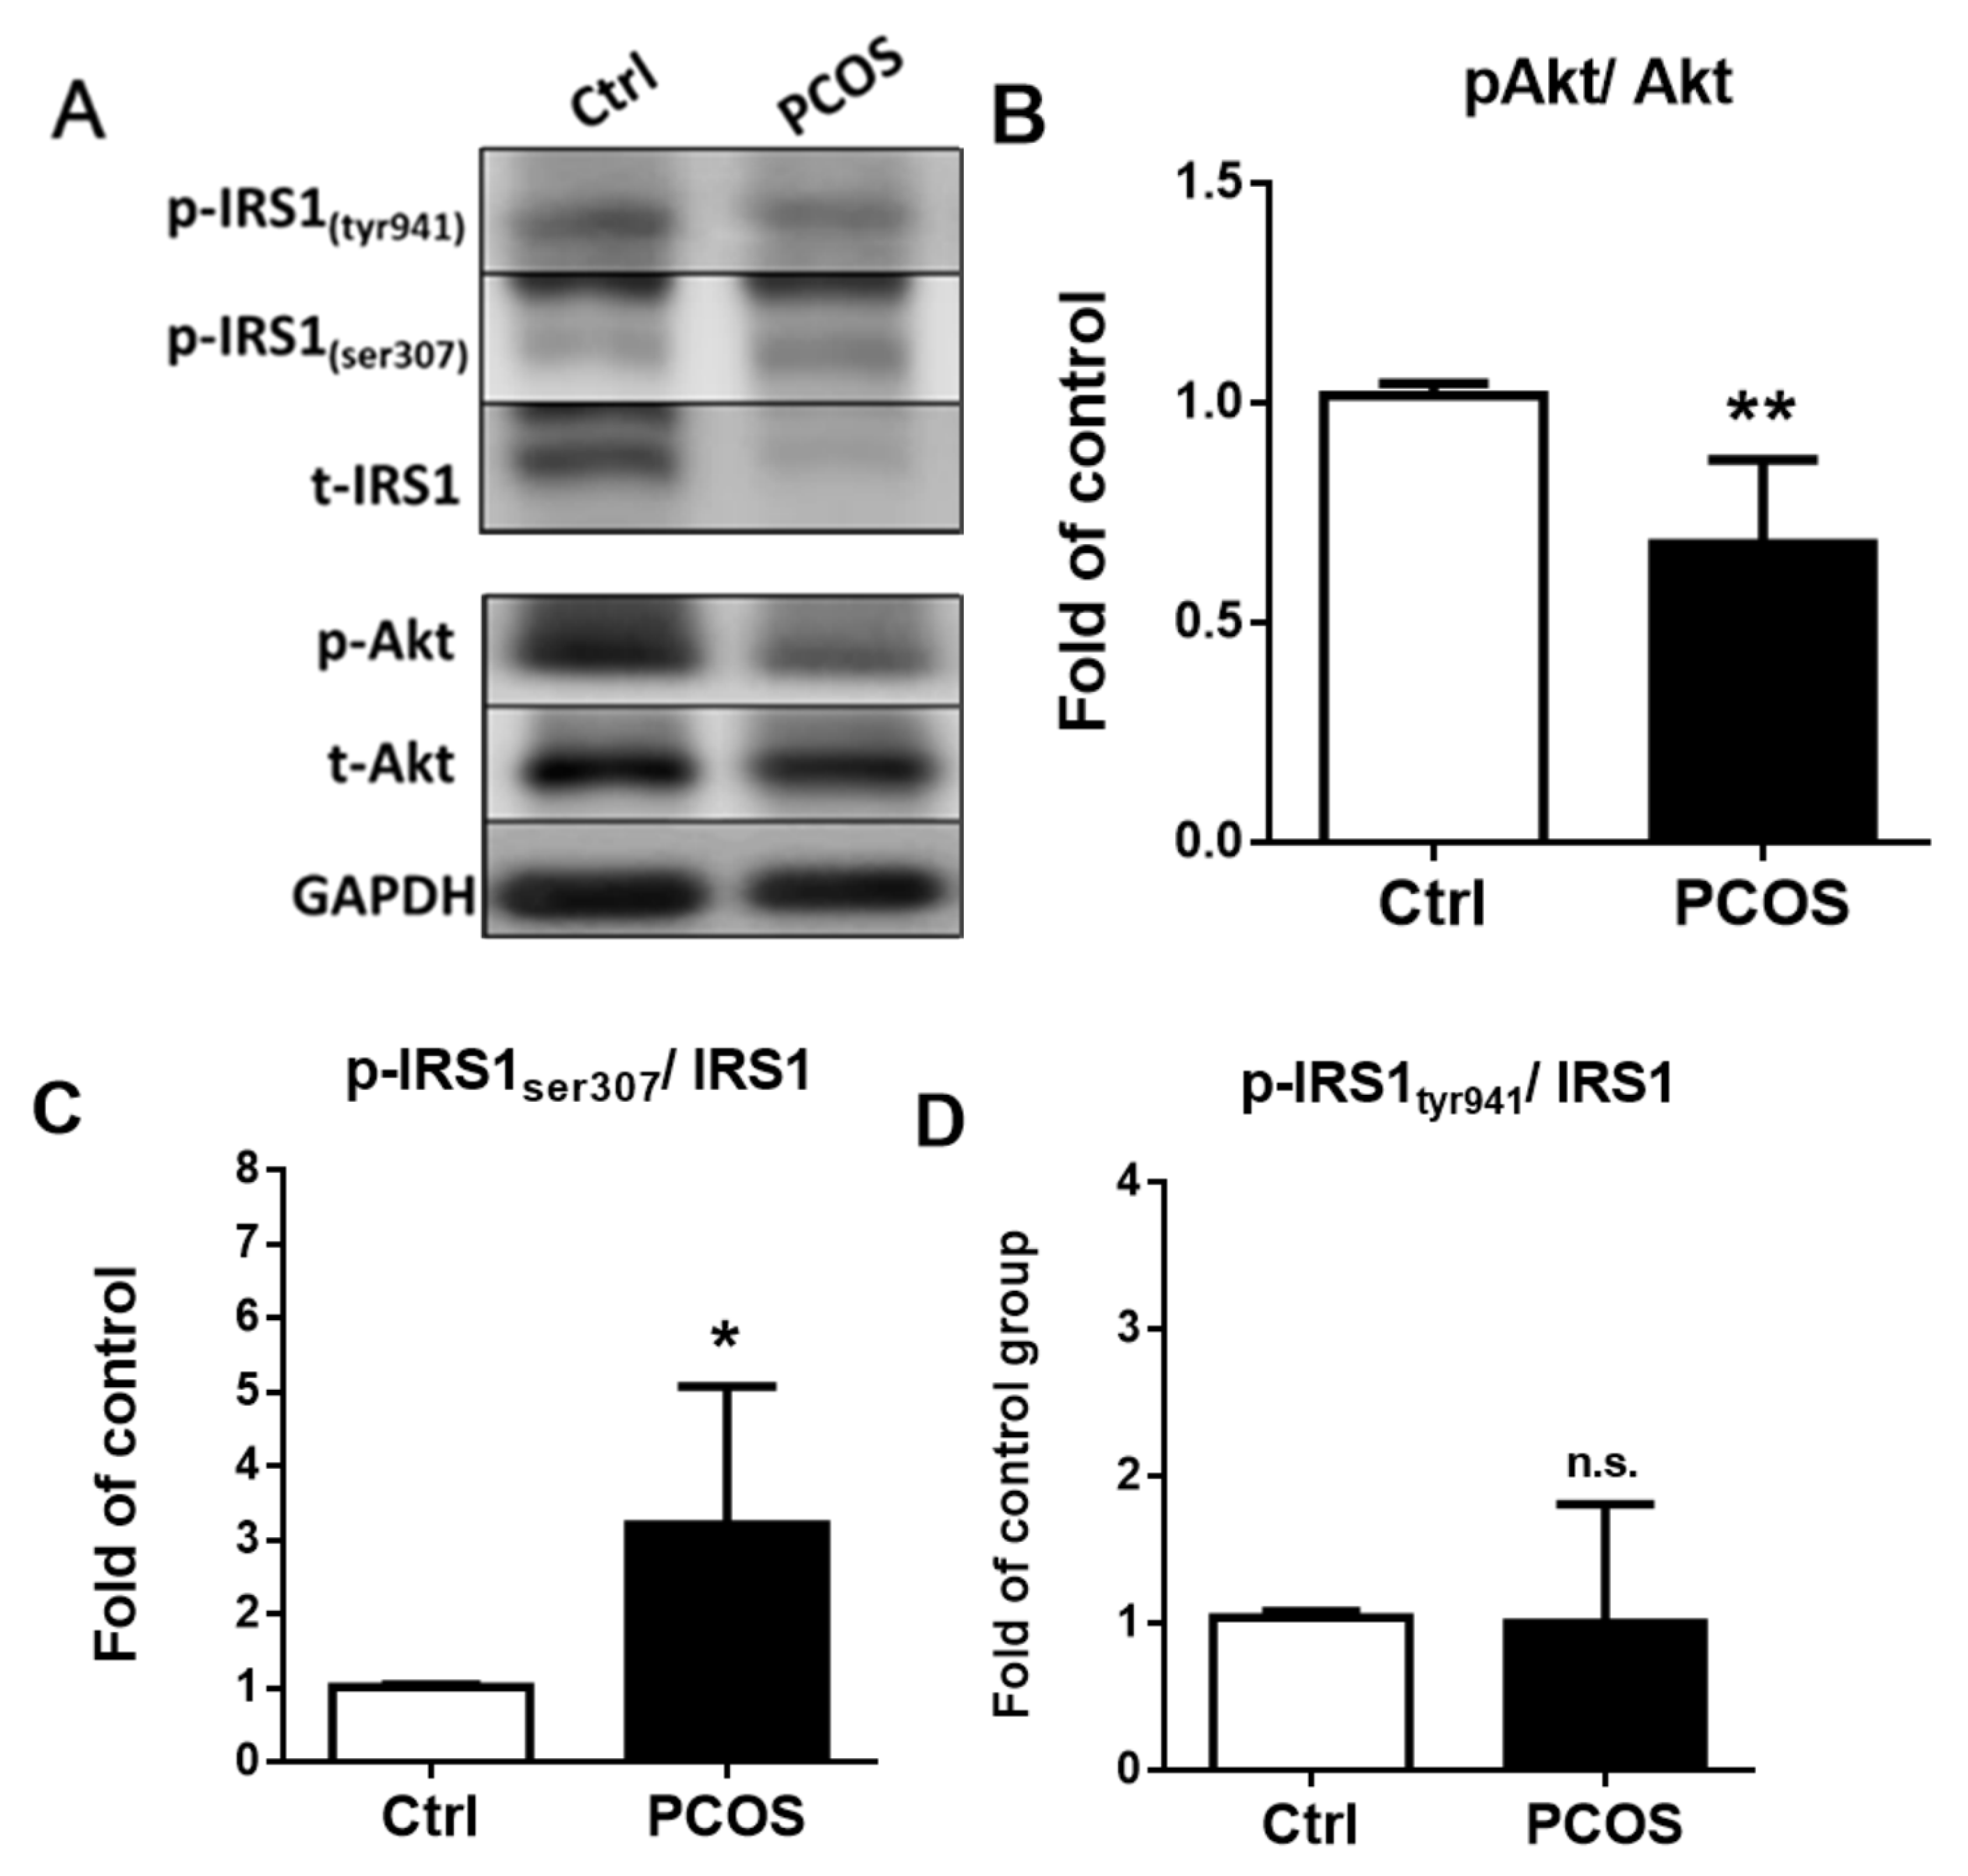
2.9. Insulin Signal Transduction Pathway in Letrozole-Treated Mice
2.10. CCR5 and CCL5 Correlation with Parameters
3. Discussion
4. Materials and Methods
4.1. Animal
4.2. Study Procedure
4.3. Vaginal Smear
4.4. Blood Sampling and Biochemical Analysis
4.5. Oral Glucose Tolerance Test (OGTT)
4.6. Insulin Tolerance Test (ITT)
4.7. Western Blotting
4.8. RNA Extraction
4.9. RT-PCR Analysis of mRNA Levels
4.10. Histological Analysis
4.11. Statistical Analysis
Author Contributions
Funding
Institutional Review Board Statement
Data Availability Statement
Conflicts of Interest
References
- Asuncion, M.; Calvo, R.M.; San Millan, J.L.; Sancho, J.; Avila, S.; Escobar-Morreale, H.F. A prospective study of the prevalence of the polycystic ovary syndrome in unselected Caucasian women from Spain. J. Clin. Endocrinol. Metab. 2000, 85, 2434–2438. [Google Scholar] [CrossRef] [PubMed] [Green Version]
- Diamanti-Kandarakis, E.; Kouli, C.R.; Bergiele, A.T.; Filandra, F.A.; Tsianateli, T.C.; Spina, G.G.; Zapanti, E.D.; Bartzis, M.I. A survey of the polycystic ovary syndrome in the Greek island of Lesbos: Hormonal and metabolic profile. J. Clin. Endocrinol. Metab. 1999, 84, 4006–4011. [Google Scholar] [CrossRef] [PubMed]
- Dunaif, A. Insulin resistance and the polycystic ovary syndrome: Mechanism and implications for pathogenesis. Endocr. Rev. 1997, 18, 774–800. [Google Scholar] [CrossRef] [PubMed] [Green Version]
- Franks, S. Polycystic ovary syndrome. N. Engl. J. Med. 1995, 333, 853–861. [Google Scholar] [CrossRef] [Green Version]
- Azziz, R.; Carmina, E.; Chen, Z.; Dunaif, A.; Laven, J.S.; Legro, R.S.; Lizneva, D.; Natterson-Horowtiz, B.; Teede, H.J.; Yildiz, B.O. Polycystic ovary syndrome. Nat. Rev. Dis. Primers 2016, 2, 16057. [Google Scholar] [CrossRef]
- Pradillo, J.M.; Hernandez-Jimenez, M.; Fernandez-Valle, M.E.; Medina, V.; Ortuno, J.E.; Allan, S.M.; Proctor, S.D.; Garcia-Segura, J.M.; Ledesma-Carbayo, M.J.; Santos, A.; et al. Influence of metabolic syndrome on post-stroke outcome, angiogenesis and vascular function in old rats determined by dynamic contrast enhanced MRI. J. Cereb. Blood Flow Metab. 2021, 41, 1692–1706. [Google Scholar] [CrossRef]
- Mahesh, V.B.; Mills, T.M.; Bagnell, C.A.; Conway, B.A. Animal models for study of polycystic ovaries and ovarian atresia. Adv. Exp. Med. Biol. 1987, 219, 237–257. [Google Scholar] [CrossRef] [PubMed]
- Walters, K.A.; Allan, C.M.; Handelsman, D.J. Rodent models for human polycystic ovary syndrome. Biol. Reprod. 2012, 86, 149. [Google Scholar] [CrossRef]
- Henmi, H.; Endo, T.; Nagasawa, K.; Hayashi, T.; Chida, M.; Akutagawa, N.; Iwasaki, M.; Kitajima, Y.; Kiya, T.; Nishikawa, A.; et al. Lysyl oxidase and MMP-2 expression in dehydroepiandrosterone-induced polycystic ovary in rats. Biol. Reprod. 2001, 64, 157–162. [Google Scholar] [CrossRef]
- Seow, K.M.; Ting, C.H.; Huang, S.W.; Ho, L.T.; Juan, C.C. The use of dehydroepiandrosterone-treated rats is not a good animal model for the study of metabolic abnormalities in polycystic ovary syndrome. Taiwan J. Obstet. Gynecol. 2018, 57, 696–704. [Google Scholar] [CrossRef]
- Dikmen, A.; Ergenoglu, A.M.; Yeniel, A.O.; Dilsiz, O.Y.; Ercan, G.; Yilmaz, H. Evaluation of glycemic and oxidative/antioxidative status in the estradiol valerate-induced PCOS model of rats. Eur. J. Obstet. Gynecol. Reprod. Biol. 2012, 160, 55–59. [Google Scholar] [CrossRef] [PubMed]
- Tehrani, F.R.; Noroozzadeh, M.; Zahediasl, S.; Piryaei, A.; Azizi, F. Introducing a rat model of prenatal androgen-induced polycystic ovary syndrome in adulthood. Exp. Physiol. 2014, 99, 792–801. [Google Scholar] [CrossRef] [PubMed]
- Manneras, L.; Cajander, S.; Holmang, A.; Seleskovic, Z.; Lystig, T.; Lonn, M.; Stener-Victorin, E. A new rat model exhibiting both ovarian and metabolic characteristics of polycystic ovary syndrome. Endocrinology 2007, 148, 3781–3791. [Google Scholar] [CrossRef] [PubMed] [Green Version]
- Locati, M.; Bonecchi, R.; Corsi, M.M. Chemokines and their receptors: Roles in specific clinical conditions and measurement in the clinical laboratory. Am. J. Clin. Pathol. 2005, 123 (Suppl. S1), S82–S95. [Google Scholar] [CrossRef] [PubMed]
- Wu, L.; LaRosa, G.; Kassam, N.; Gordon, C.J.; Heath, H.; Ruffing, N.; Chen, H.; Humblias, J.; Samson, M.; Parmentier, M.; et al. Interaction of chemokine receptor CCR5 with its ligands: Multiple domains for HIV-1 gp120 binding and a single domain for chemokine binding. J. Exp. Med. 1997, 186, 1373–1381. [Google Scholar] [CrossRef] [Green Version]
- Song, G.G.; Kim, J.H.; Lee, Y.H. The chemokine receptor 5 delta32 polymorphism and type 1 diabetes, Behcet’s disease, and asthma: A meta-analysis. Immunol. Investig. 2014, 43, 123–136. [Google Scholar] [CrossRef] [PubMed]
- Jones, K.L.; Maguire, J.J.; Davenport, A.P. Chemokine receptor CCR5: From AIDS to atherosclerosis. Br. J. Pharmacol. 2011, 162, 1453–1469. [Google Scholar] [CrossRef] [Green Version]
- Ota, T. CCR5: A novel player in the adipose tissue inflammation and insulin resistance? Adipocyte 2013, 2, 99–103. [Google Scholar] [CrossRef] [Green Version]
- Lai, Y.S.; Nguyen, H.T.; Salmanida, F.P.; Chang, K.T. MERTK(+/hi) M2c Macrophages Induced by Baicalin Alleviate Non-Alcoholic Fatty Liver Disease. Int. J. Mol. Sci. 2021, 22, 10604. [Google Scholar] [CrossRef]
- Dantas, W.S.; Murai, I.H.; Perandini, L.A.; Azevedo, H.; Moreira-Filho, C.A.; Camara, N.O.; Roschel, H.; Gualano, B. Acute exercise elicits differential expression of insulin resistance genes in the skeletal muscle of patients with polycystic ovary syndrome. Clin. Endocrinol. 2017, 86, 688–697. [Google Scholar] [CrossRef]
- He, B.; Pang, V.; Liu, X.; Xu, S.; Zhang, Y.; Djuanda, D.; Wu, G.; Xu, Y.; Zhu, Z. Interactions Among Nerve Regeneration, Angiogenesis, and the Immune Response Immediately After Sciatic Nerve Crush Injury in Sprague-Dawley Rats. Front. Cell Neurosci. 2021, 15, 717209. [Google Scholar] [CrossRef]
- Andreakos, E.; Abel, L.; Vinh, D.C.; Kaja, E.; Drolet, B.A.; Zhang, Q.; O’Farrelly, C.; Novelli, G.; Rodriguez-Gallego, C.; Haerynck, F.; et al. A global effort to dissect the human genetic basis of resistance to SARS-CoV-2 infection. Nat. Immunol. 2021, 1–6. [Google Scholar] [CrossRef]
- Passman, A.M.; Strauss, R.P.; McSpadden, S.B.; Finch-Edmondson, M.; Andrewartha, N.; Woo, K.H.; Diepeveen, L.A.; Zhao, W.; Fernandez-Irigoyen, J.; Santamaria, E.; et al. Maraviroc Prevents HCC Development by Suppressing Macrophages and the Liver Progenitor Cell Response in a Murine Chronic Liver Disease Model. Cancers 2021, 13, 4935. [Google Scholar] [CrossRef]
- Juan, C.C.; Chen, K.H.; Chen, C.W.; Ho, C.H.; Wang, P.H.; Chen, H.S.; Hwang, J.L.; Lin, Y.H.; Seow, K.M. Increased regulated on activation, normal T-cell expressed and secreted levels and cysteine-cysteine chemokine receptor 5 upregulation in omental adipose tissue and peripheral blood mononuclear cells are associated with testosterone level and insulin resistance in polycystic ovary syndrome. Fertil. Steril. 2021, 116, 1139–1146. [Google Scholar] [CrossRef]
- Ryu, Y.; Kim, S.W.; Kim, Y.Y.; Ku, S.Y. Animal Models for Human Polycystic Ovary Syndrome (PCOS) Focused on the Use of Indirect Hormonal Perturbations: A Review of the Literature. Int. J. Mol. Sci. 2019, 20, 2720. [Google Scholar] [CrossRef] [PubMed] [Green Version]
- Maliqueo, M.; Sun, M.; Johansson, J.; Benrick, A.; Labrie, F.; Svensson, H.; Lonn, M.; Duleba, A.J.; Stener-Victorin, E. Continuous administration of a P450 aromatase inhibitor induces polycystic ovary syndrome with a metabolic and endocrine phenotype in female rats at adult age. Endocrinology 2013, 154, 434–445. [Google Scholar] [CrossRef]
- Li, T.; Zhang, T.; Cui, T.; Yang, Y.; Liu, R.; Chen, Y.; Yin, C. Involvement of endogenous testosterone in hepatic steatosis in women with polycystic ovarian syndrome. J. Steroid Biochem. Mol. Biol. 2020, 204, 105752. [Google Scholar] [CrossRef] [PubMed]
- Ortega, I.; Sokalska, A.; Villanueva, J.A.; Cress, A.B.; Wong, D.H.; Stener-Victorin, E.; Stanley, S.D.; Duleba, A.J. Letrozole increases ovarian growth and Cyp17a1 gene expression in the rat ovary. Fertil. Steril. 2013, 99, 889–896. [Google Scholar] [CrossRef] [PubMed] [Green Version]
- Dunaif, A.; Segal, K.R.; Shelley, D.R.; Green, G.; Dobrjansky, A.; Licholai, T. Evidence for distinctive and intrinsic defects in insulin action in polycystic ovary syndrome. Diabetes 1992, 41, 1257–1266. [Google Scholar] [CrossRef] [PubMed]
- Ciaraldi, T.P.; el-Roeiy, A.; Madar, Z.; Reichart, D.; Olefsky, J.M.; Yen, S.S. Cellular mechanisms of insulin resistance in polycystic ovarian syndrome. J. Clin. Endocrinol. Metab. 1992, 75, 577–583. [Google Scholar] [CrossRef]
- Corbould, A.; Zhao, H.; Mirzoeva, S.; Aird, F.; Dunaif, A. Enhanced mitogenic signaling in skeletal muscle of women with polycystic ovary syndrome. Diabetes 2006, 55, 751–759. [Google Scholar] [CrossRef] [PubMed] [Green Version]
- Seow, K.M.; Juan, C.C.; Hsu, Y.P.; Hwang, J.L.; Huang, L.W.; Ho, L.T. Amelioration of insulin resistance in women with PCOS via reduced insulin receptor substrate-1 Ser312 phosphorylation following laparoscopic ovarian electrocautery. Hum. Reprod. 2007, 22, 1003–1010. [Google Scholar] [CrossRef] [Green Version]
- Kitade, H.; Sawamoto, K.; Nagashimada, M.; Inoue, H.; Yamamoto, Y.; Sai, Y.; Takamura, T.; Yamamoto, H.; Miyamoto, K.; Ginsberg, H.N.; et al. CCR5 plays a critical role in obesity-induced adipose tissue inflammation and insulin resistance by regulating both macrophage recruitment and M1/M2 status. Diabetes 2012, 61, 1680–1690. [Google Scholar] [CrossRef] [PubMed] [Green Version]
- Chan, P.C.; Liao, M.T.; Lu, C.H.; Tian, Y.F.; Hsieh, P.S. Targeting inhibition of CCR5 on improving obesity-associated insulin resistance and impairment of pancreatic insulin secretion in high fat-fed rodent models. Eur. J. Pharmacol. 2021, 891, 173703. [Google Scholar] [CrossRef]
- Shen, L.; Chen, Y.; Cheng, J.; Yuan, S.; Zhou, S.; Yan, W.; Liu, J.; Luo, A.; Wang, S. CCL5 secreted by senescent theca-interstitial cells inhibits preantral follicular development via granulosa cellular apoptosis. J. Cell Physiol. 2019, 234, 22554–22564. [Google Scholar] [CrossRef] [PubMed]
- Genazzani, A.D. Inositol as putative integrative treatment for PCOS. Reprod. Biomed. Online 2016, 33, 770–780. [Google Scholar] [CrossRef] [PubMed] [Green Version]
- Facchinetti, F.; Unfer, V.; Dewailly, D.; Kamenov, Z.A.; Diamanti-Kandarakis, E.; Lagana, A.S.; Nestler, J.E.; Soulage, C.O.; Group of ‘Inositol in PCOS and Reproduction’. Inositols in Polycystic Ovary Syndrome: An Overview on the Advances. Trends Endocrinol. Metab. 2020, 31, 435–447. [Google Scholar] [CrossRef]
- Aperio ImagewScope. Pathology Slides Viewing Software; Aperio Technologies: Vista, CA, USA, 2006. [Google Scholar]


Publisher’s Note: MDPI stays neutral with regard to jurisdictional claims in published maps and institutional affiliations. |
© 2021 by the authors. Licensee MDPI, Basel, Switzerland. This article is an open access article distributed under the terms and conditions of the Creative Commons Attribution (CC BY) license (https://creativecommons.org/licenses/by/4.0/).
Share and Cite
Seow, K.-M.; Liu, P.-S.; Chen, K.-H.; Chen, C.-W.; Chen, L.-K.; Ho, C.-H.; Hwang, J.-L.; Wang, P.-H.; Juan, C.-C. Cysteine–Cysteine Motif Chemokine Receptor 5 Expression in Letrozole-Induced Polycystic Ovary Syndrome Mice. Int. J. Mol. Sci. 2022, 23, 134. https://doi.org/10.3390/ijms23010134
Seow K-M, Liu P-S, Chen K-H, Chen C-W, Chen L-K, Ho C-H, Hwang J-L, Wang P-H, Juan C-C. Cysteine–Cysteine Motif Chemokine Receptor 5 Expression in Letrozole-Induced Polycystic Ovary Syndrome Mice. International Journal of Molecular Sciences. 2022; 23(1):134. https://doi.org/10.3390/ijms23010134
Chicago/Turabian StyleSeow, Kok-Min, Pin-Shiou Liu, Kuo-Hu Chen, Chien-Wei Chen, Luen-Kui Chen, Chi-Hong Ho, Jiann-Loung Hwang, Peng-Hui Wang, and Chi-Chang Juan. 2022. "Cysteine–Cysteine Motif Chemokine Receptor 5 Expression in Letrozole-Induced Polycystic Ovary Syndrome Mice" International Journal of Molecular Sciences 23, no. 1: 134. https://doi.org/10.3390/ijms23010134