
Image- and Fluorescence-Based Test Shows Oxidant-Dependent Damages in Red Blood Cells and Enables Screening of Potential Protective Molecules

 , and
, and 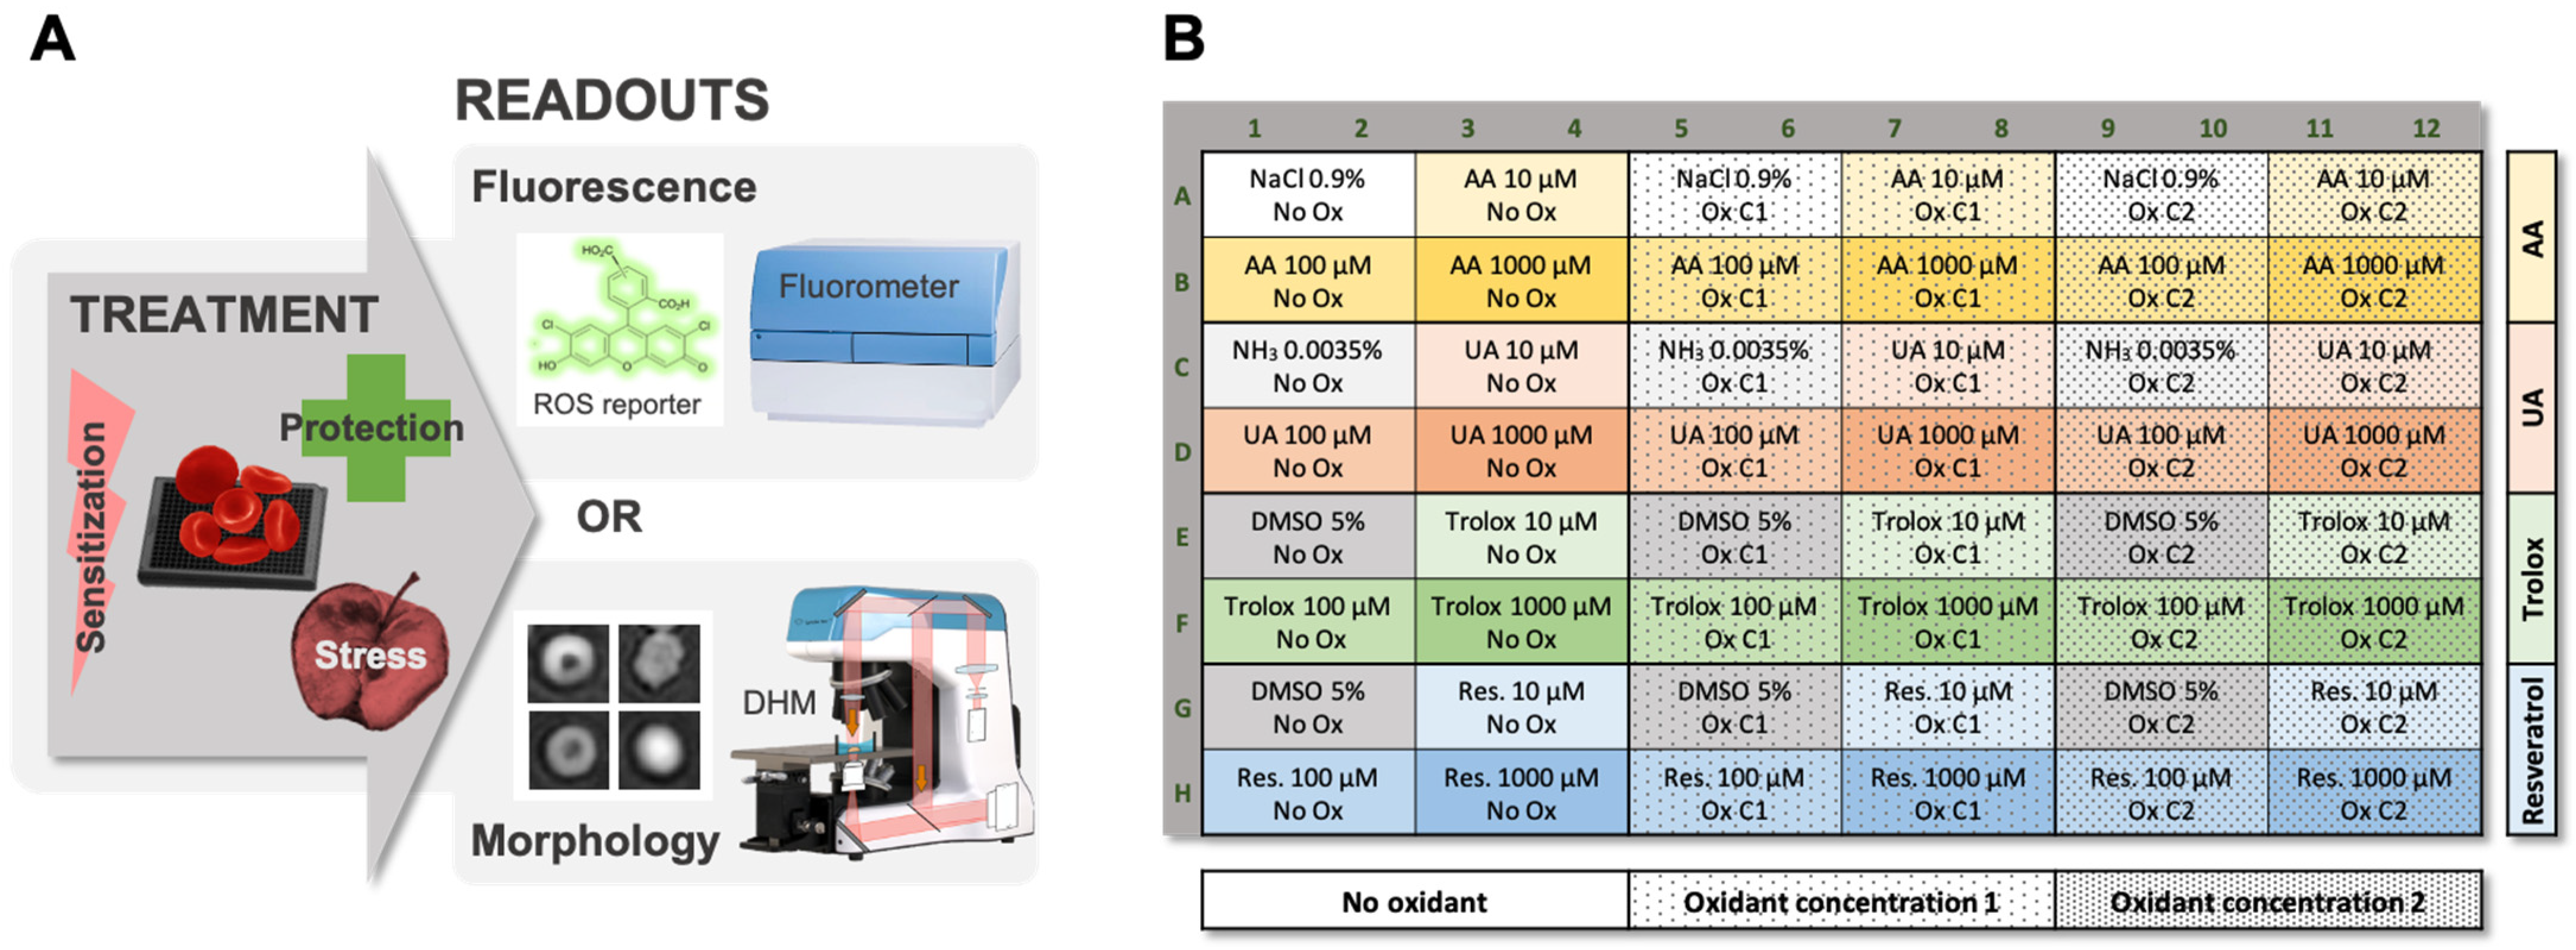
Abstract
:1. Introduction
2. Results
2.1. Workflow of the Test of Sensitivity to Oxidative Stress (TSOX)
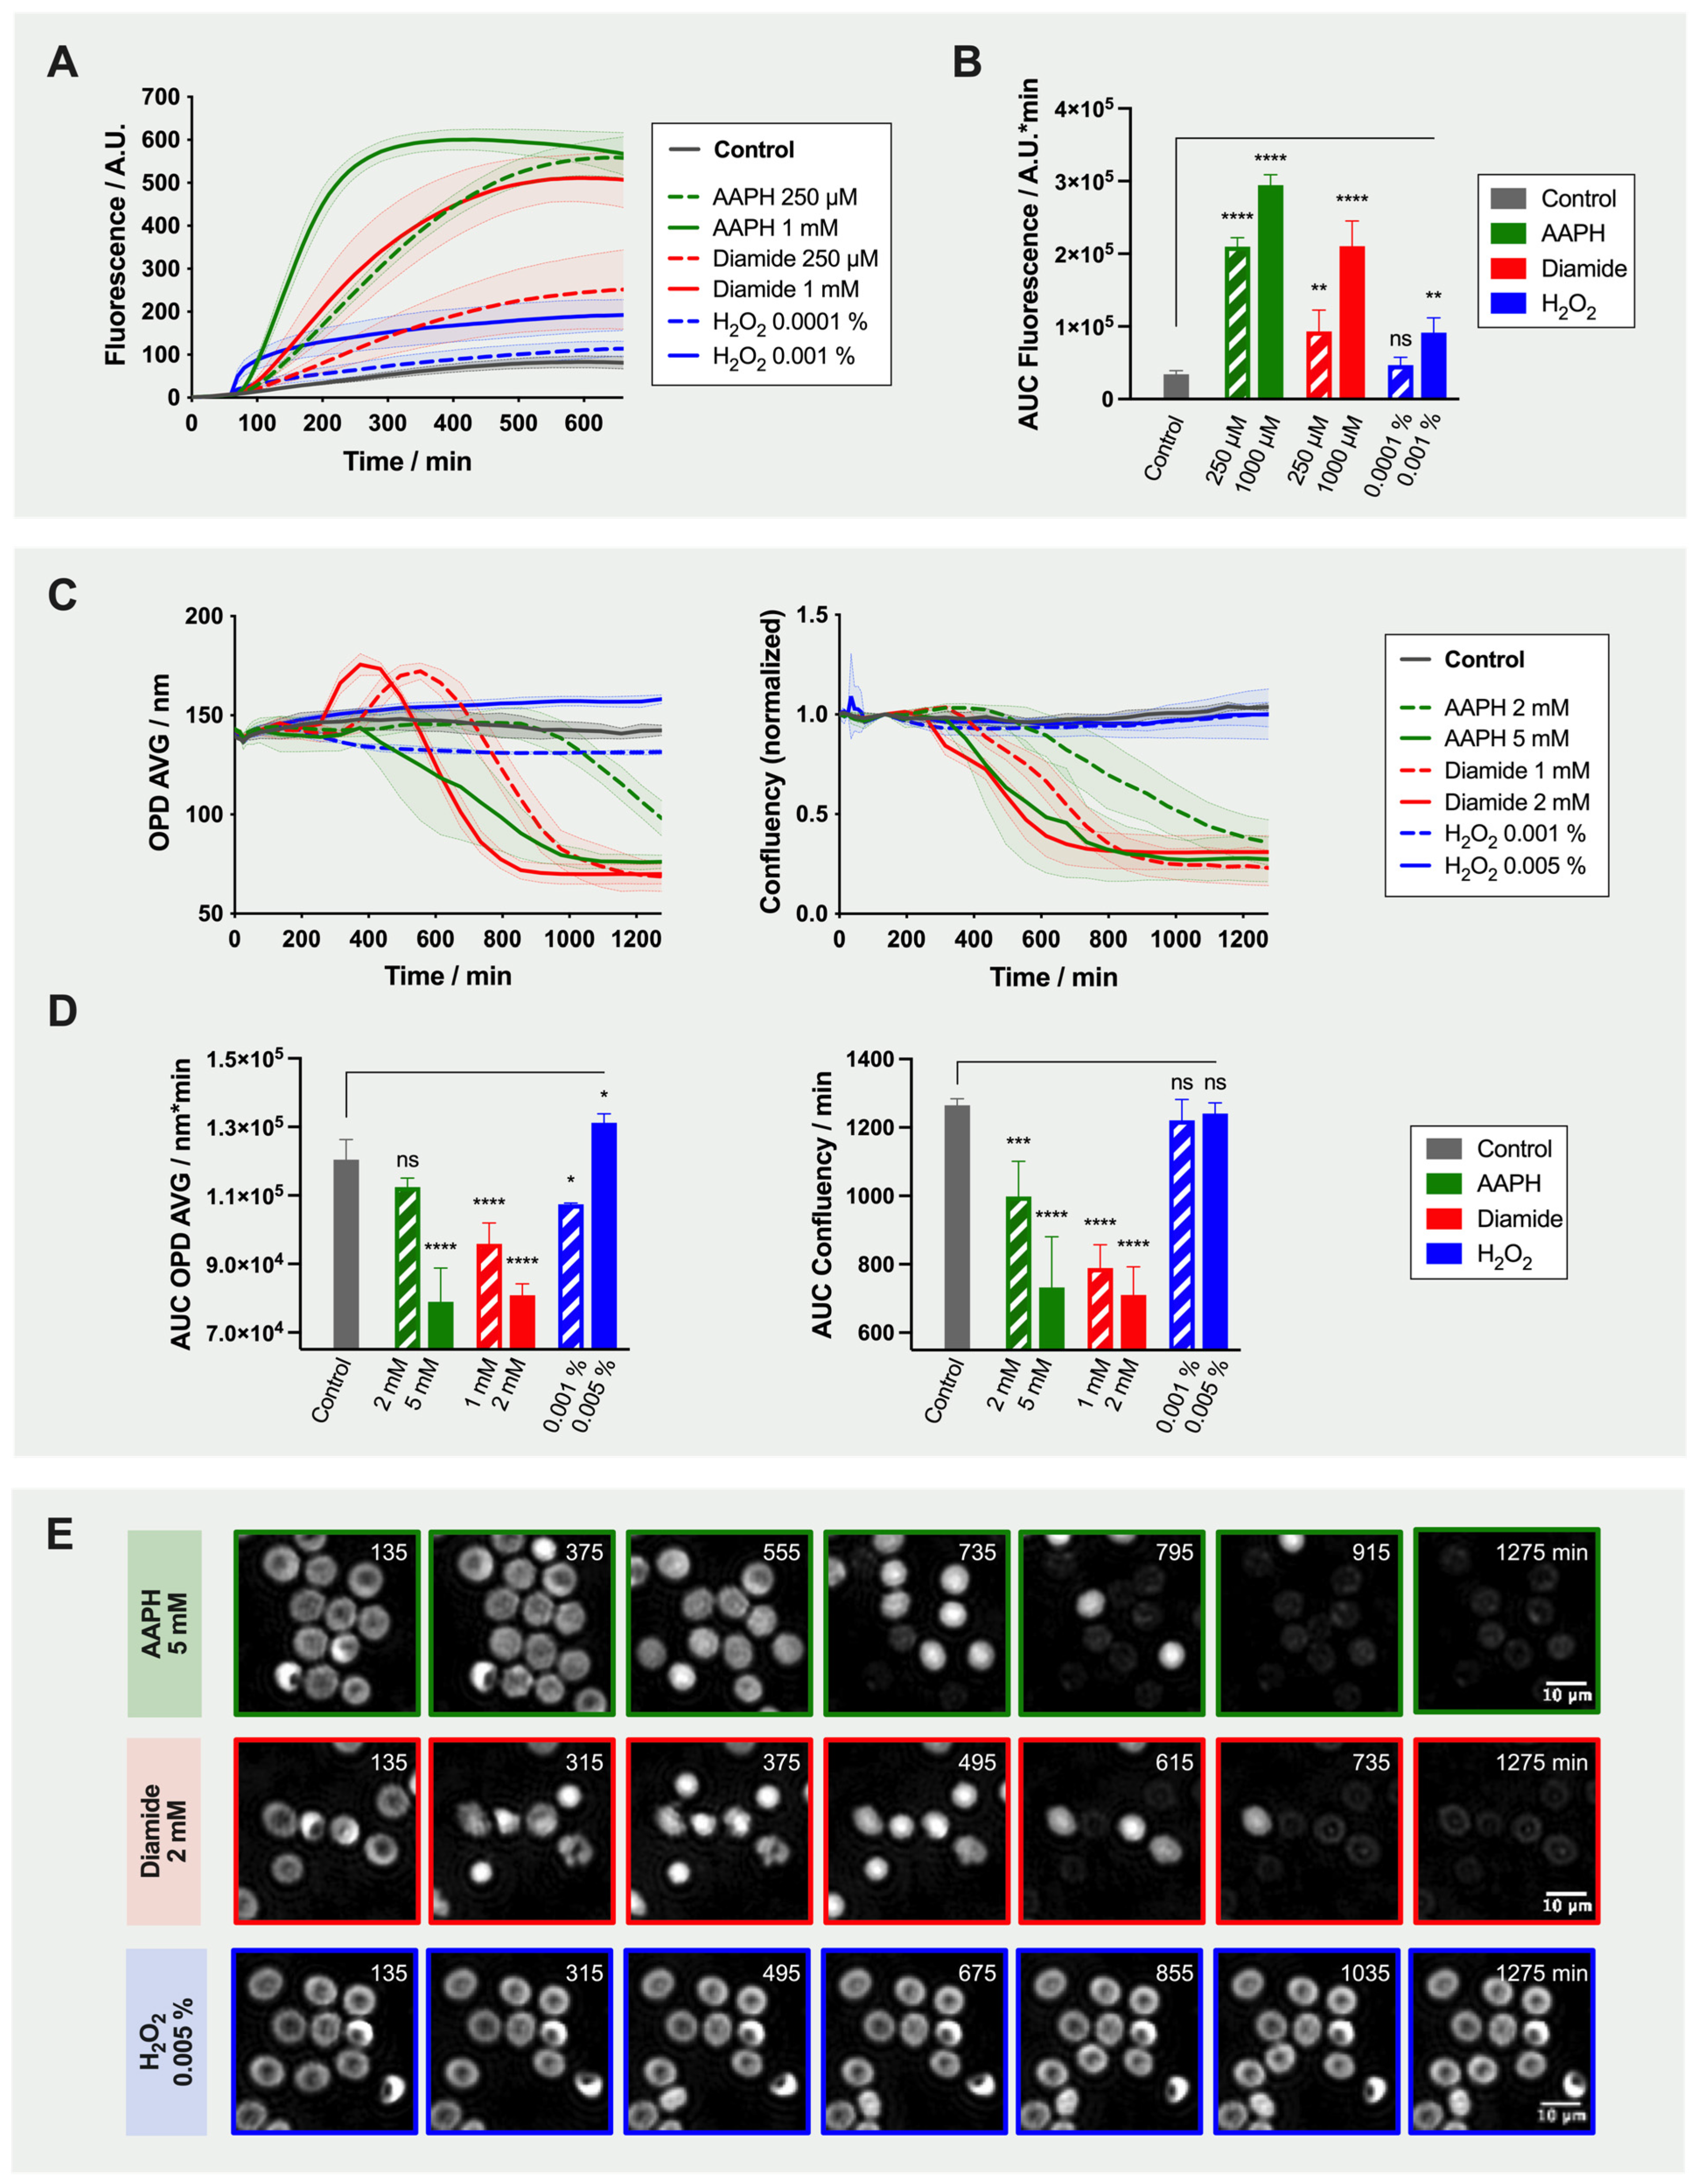
2.2. Effect of Oxidant Treatment on the Red Blood Cells
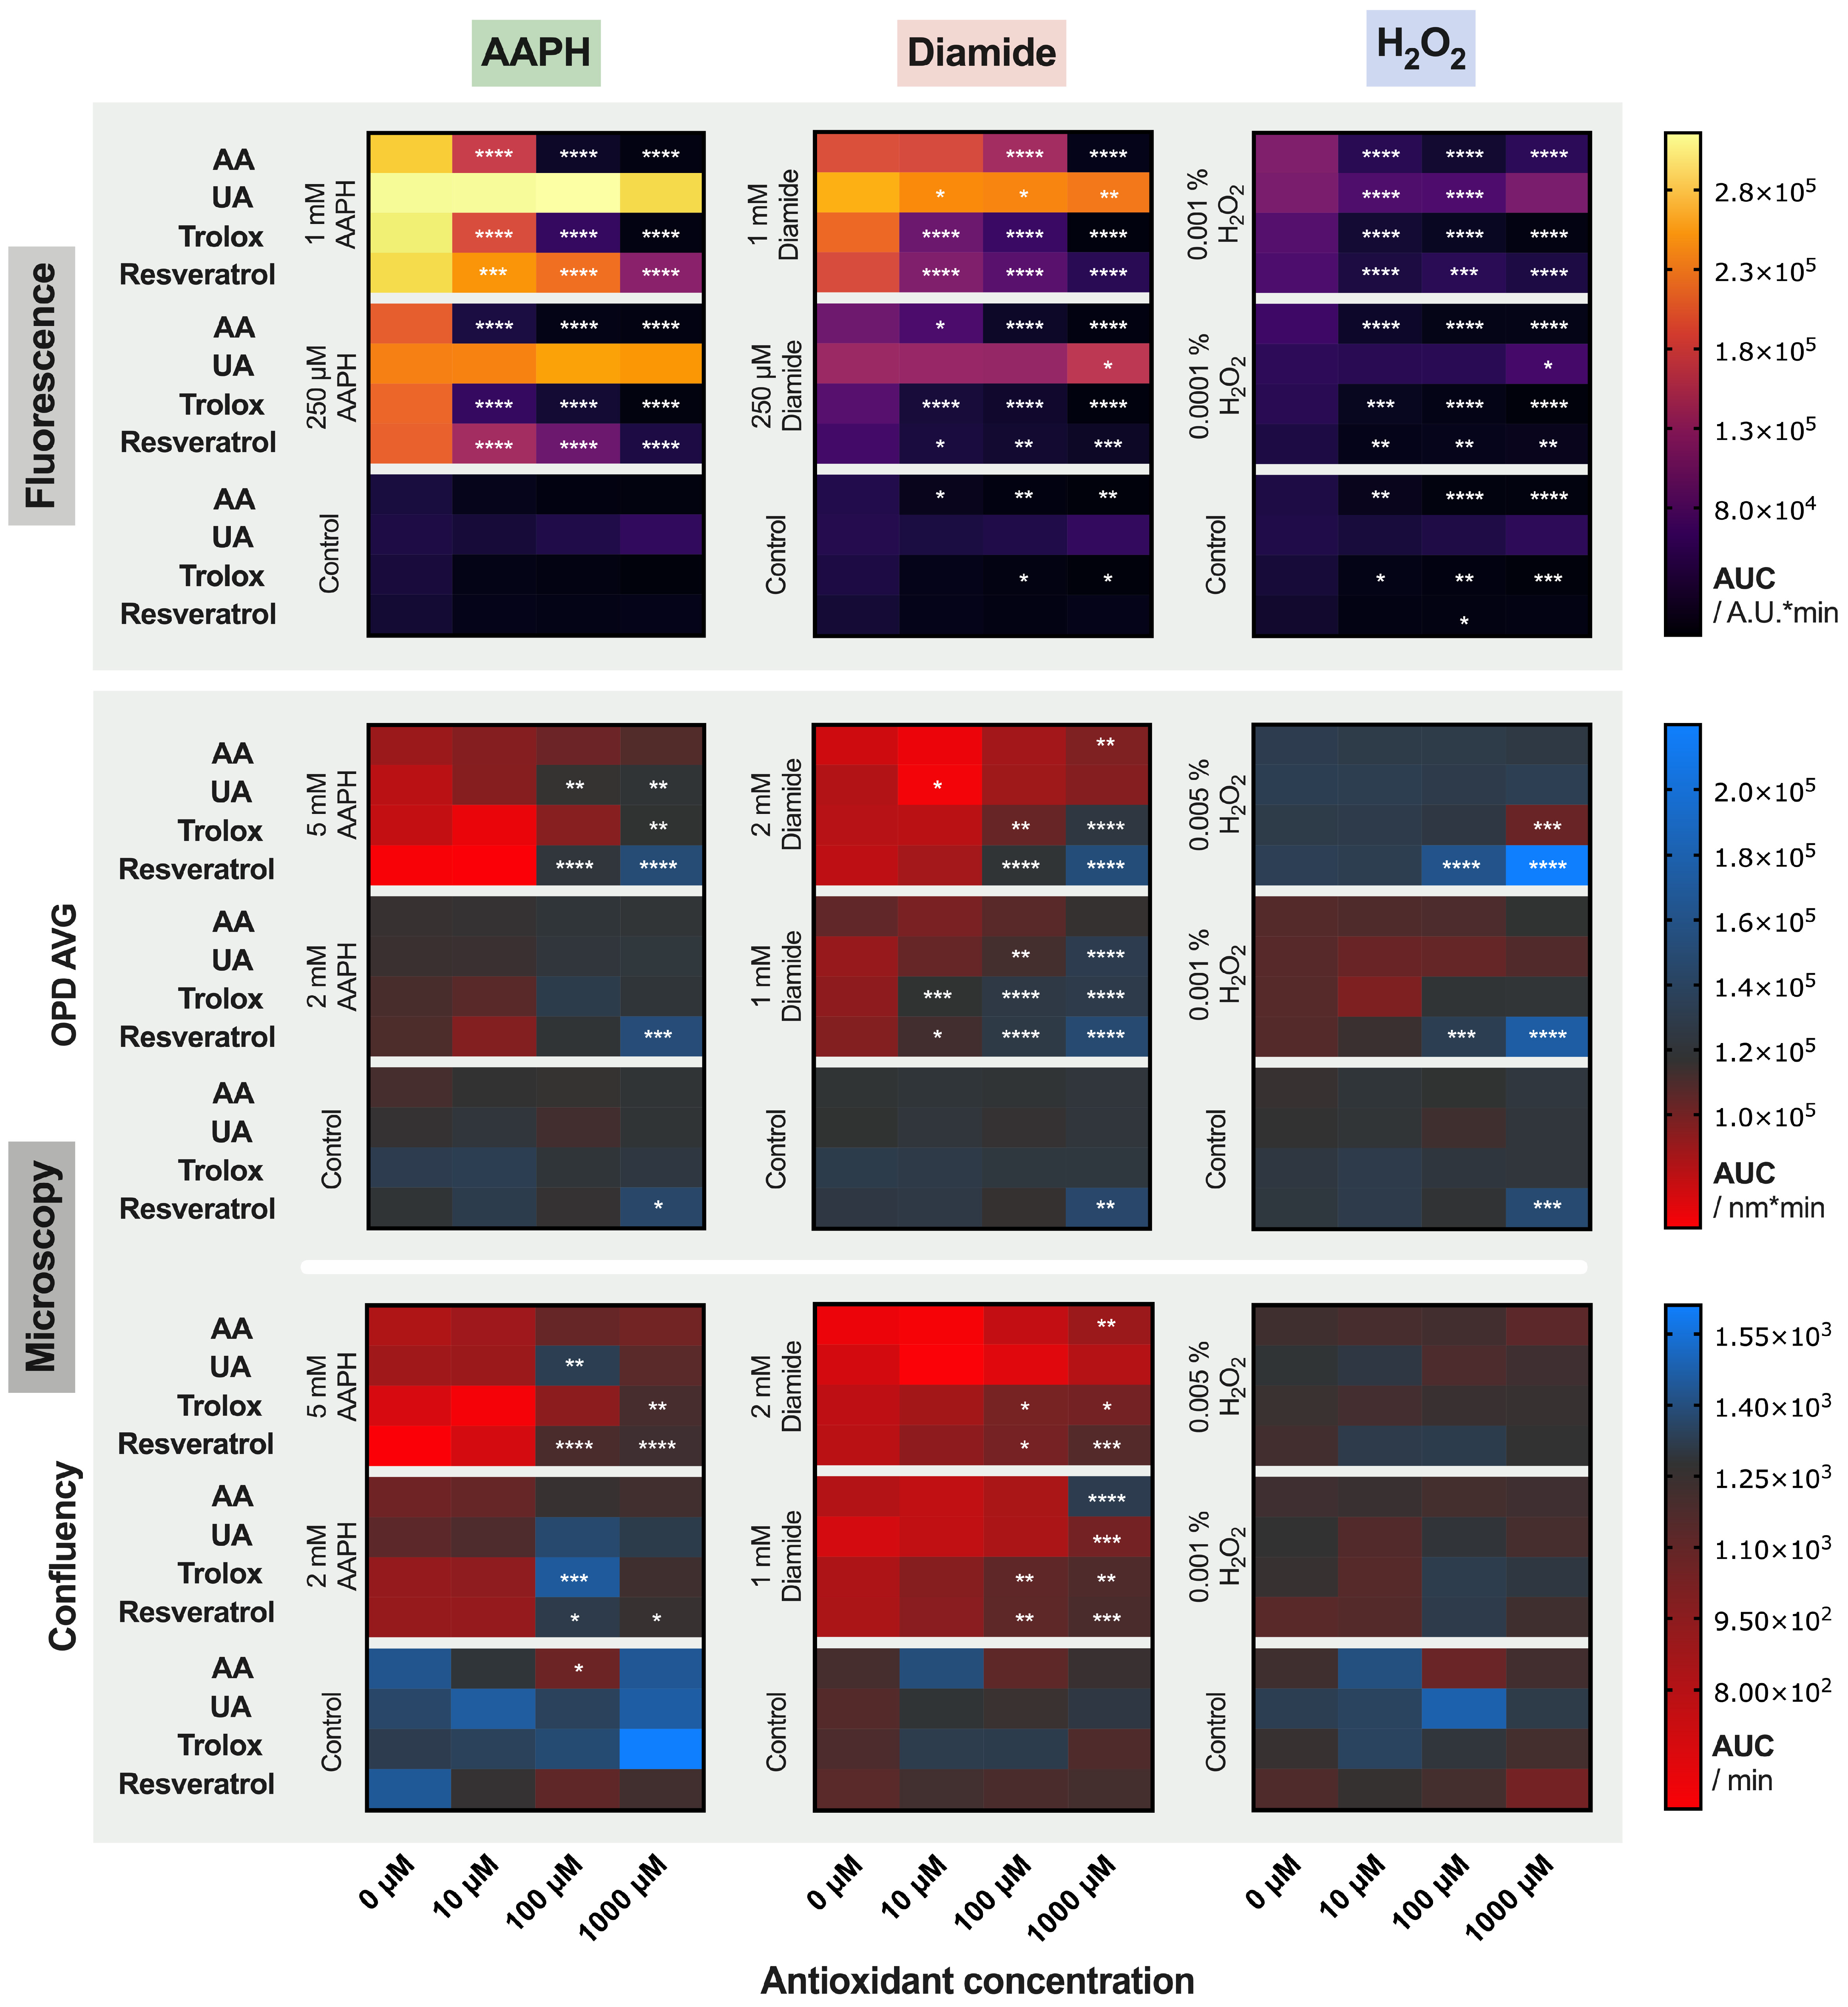
2.3. Treatment of the Red Blood Cells with Antioxidants
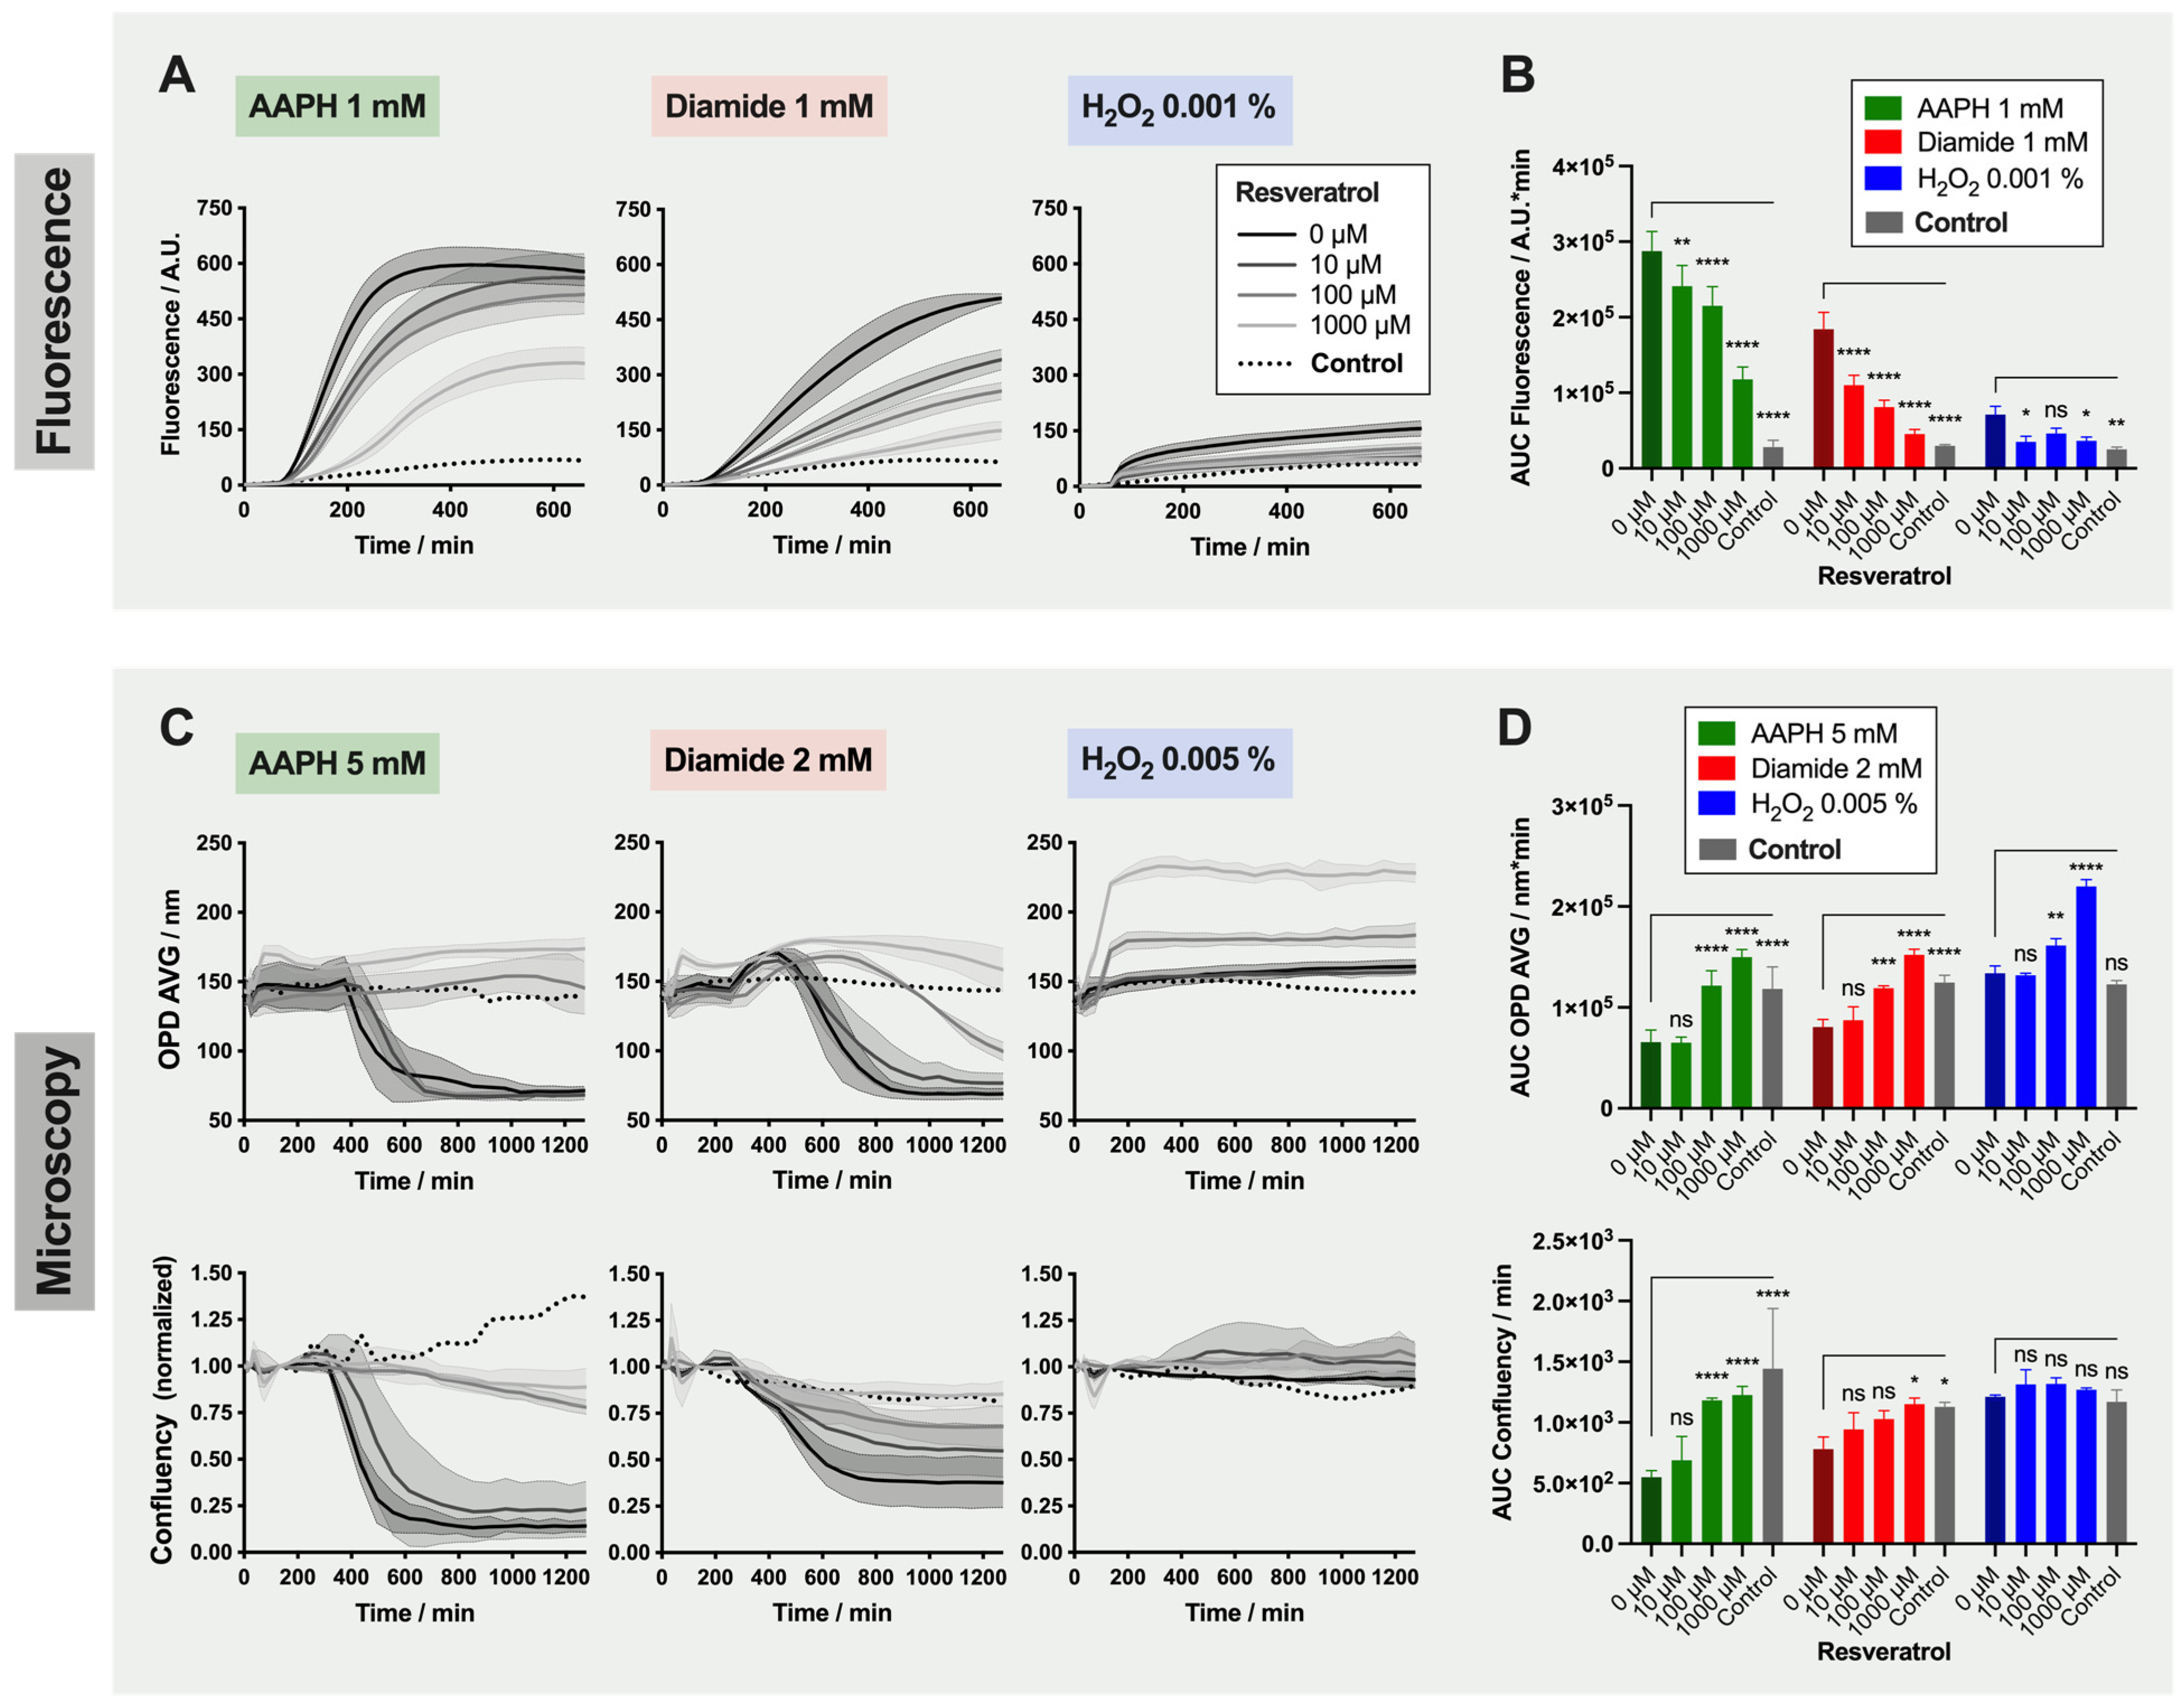
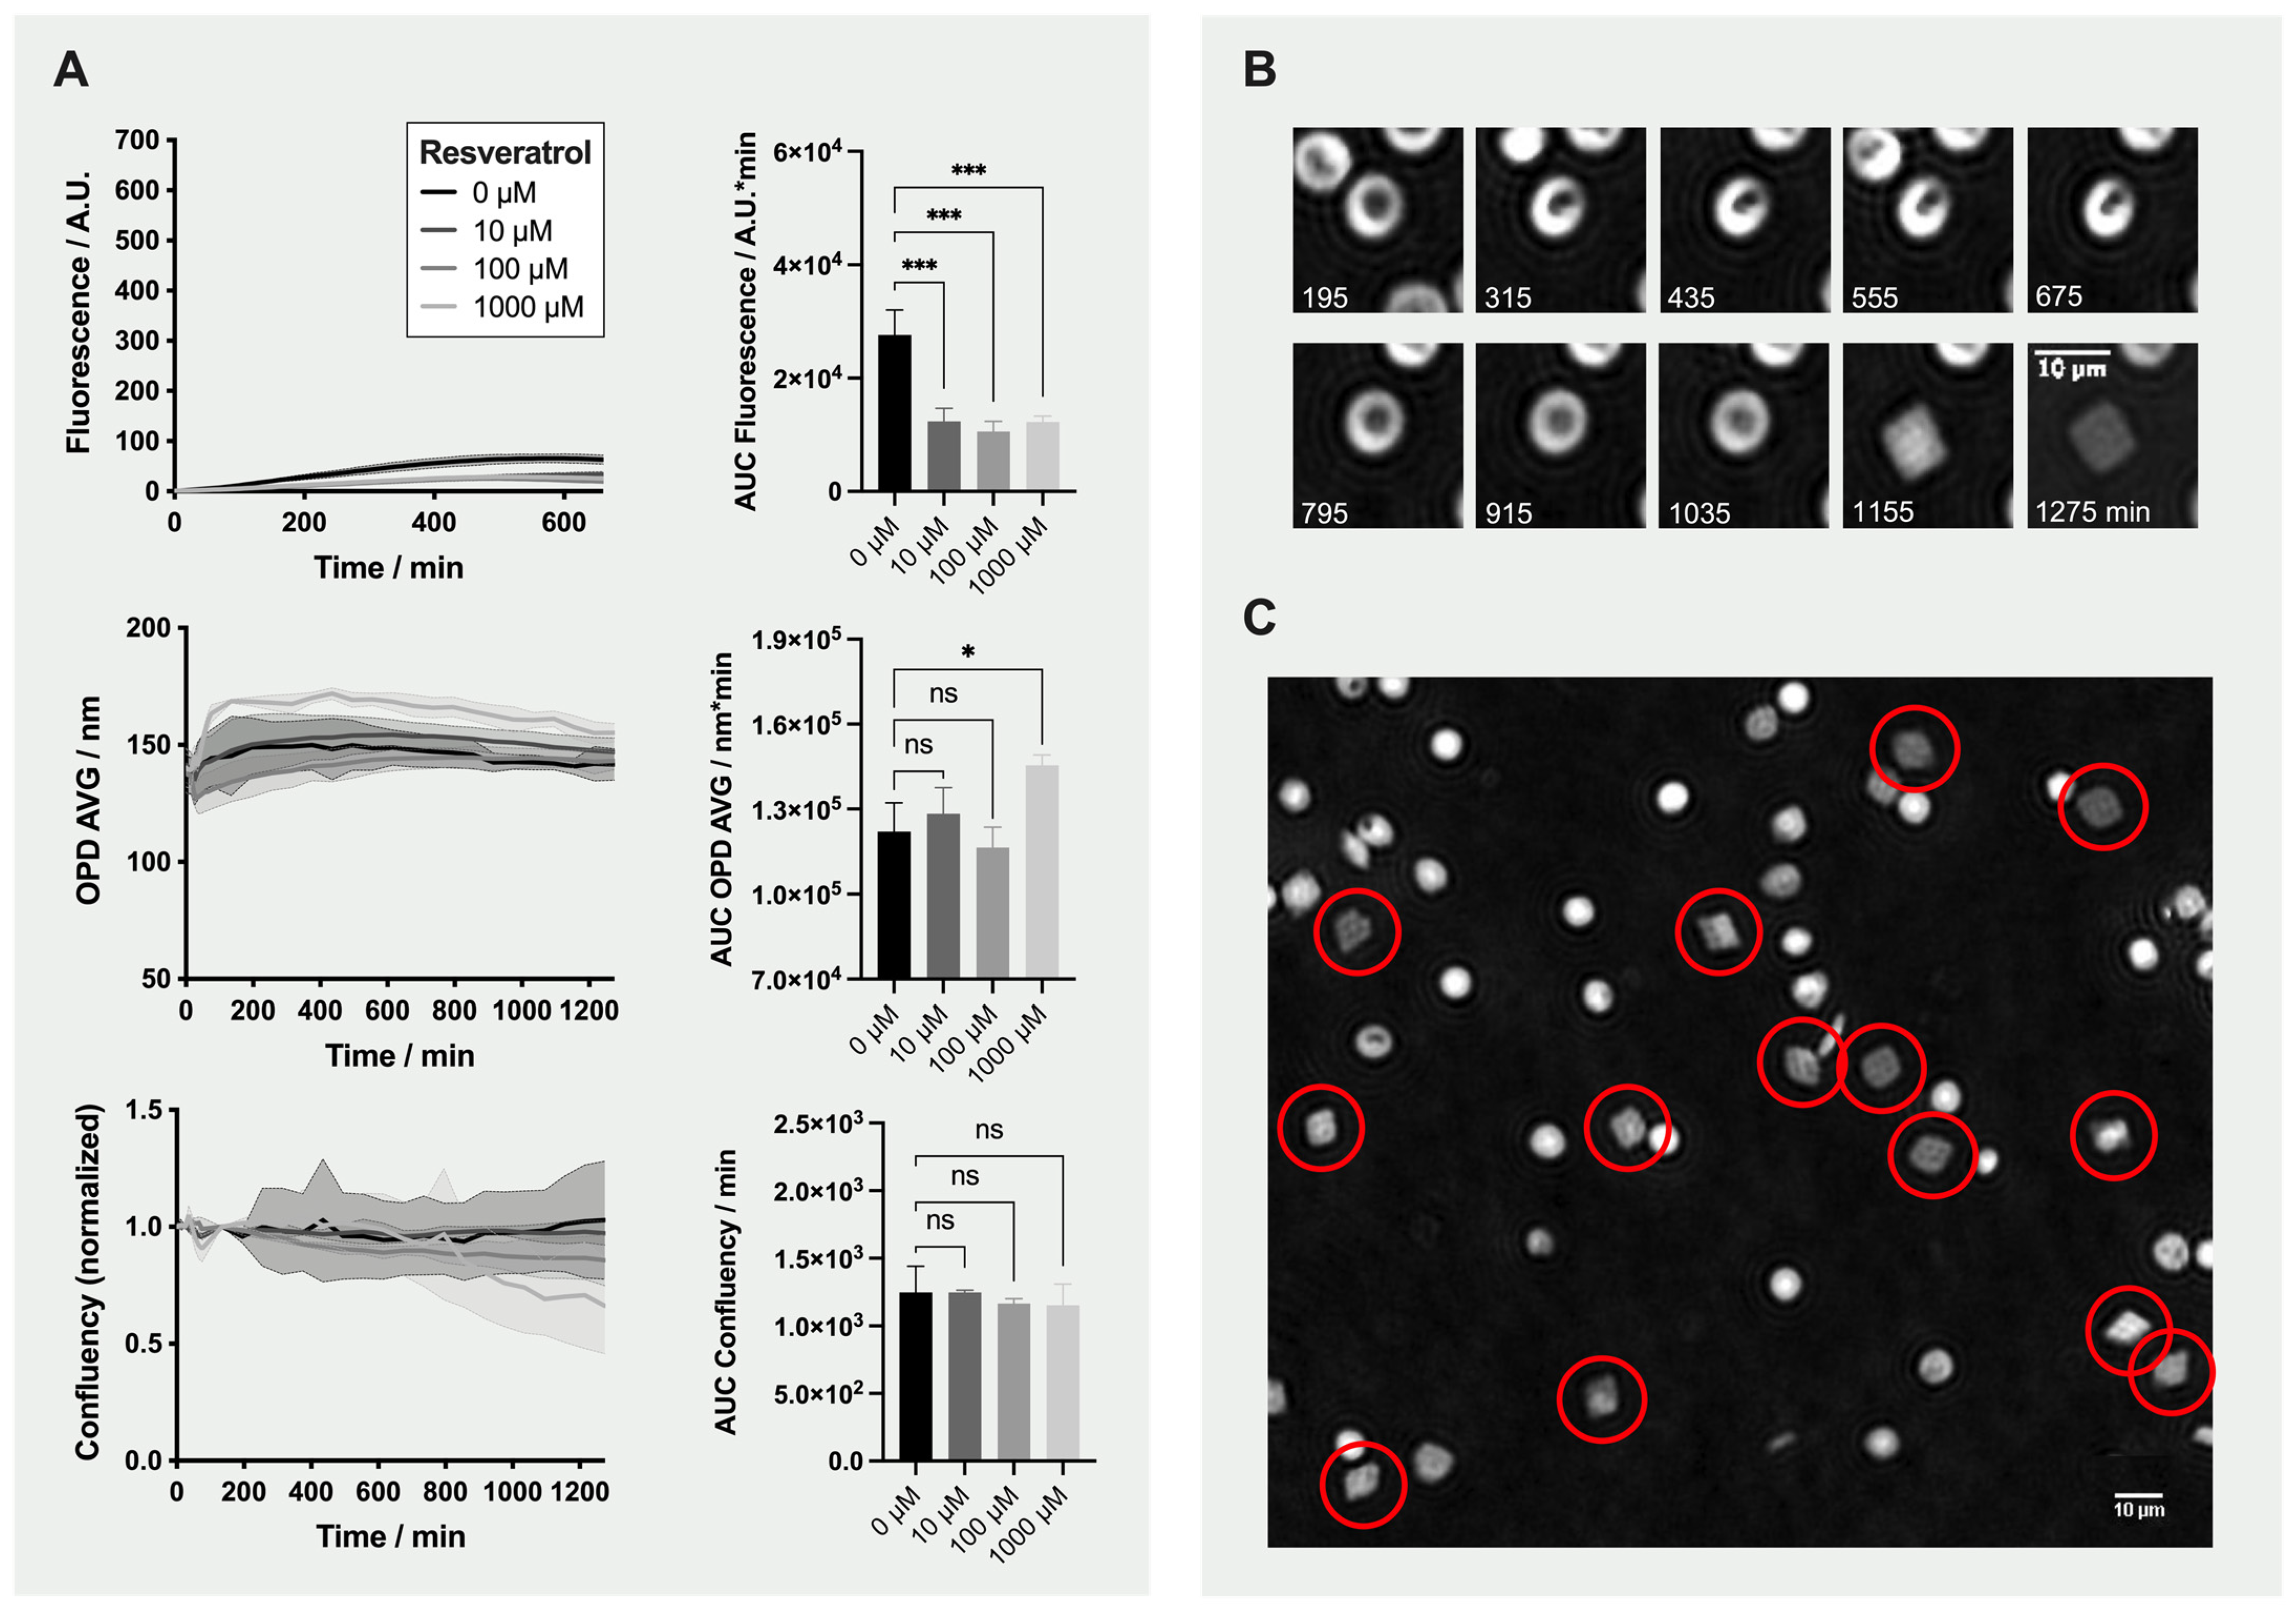
2.4. Detailed Analysis: Effect of Resveratrol on Red Blood Cells
3. Discussion
4. Materials and Methods
4.1. Antioxidant Protection and Oxidative Stress Induction
4.2. Analysis of Reactive Oxygen Species Generation by Fluorometry
4.2.1. Treatment of the Red Blood Cells with DCFH-DA Reporter Probe
4.2.2. Quantification of Fluorescence Emission Using a Microplate Fluorometer
4.3. Analysis of Morphological Changes Using Digital Holographic Microscopy
4.4. Data Analysis and Presentation
5. Conclusions
Supplementary Materials
Author Contributions
Funding
Institutional Review Board Statement
Informed Consent Statement
Data Availability Statement
Conflicts of Interest
Abbreviations
| RBC | Red Blood Cell |
| AA | Ascorbic Acid |
| UA | Uric Acid |
| RCC | Red Blood Cell Concentrate |
| DHM | Digital Holographic Microscope or Microscopy |
| DCFH-DA | 2′-7′-Dichlorofluorescin Diacetate |
| TSOX | Test of Sensitivity Against Oxidation |
| ROS | Reactive Oxygen Species |
| AAPH | 2,2′-Azobis(2-methylpropionamidine) Dihydrochloride |
| H2O2 | Hydrogen Peroxide |
| OPD | Optical Path Difference |
| OPD AVG | Average of Optical Path Difference Distribution |
| AUC | Area Under the Curve |
| HTS | High-Throughput Screening |
| CPD | Citrate-Phosphate-Dextrose |
| SAGM | Saline-Adenine-Glucose-Mannitol |
References
- Yoshida, T.; Prudent, M.; D’Alessandro, A. Red blood cell storage lesion: Causes and potential clinical consequences. Blood Transfus. 2019, 17, 27–52. [Google Scholar] [CrossRef]
- Bardyn, M.; Tissot, J.-D.; Prudent, M. Oxidative stress and antioxidant defenses during blood processing and storage of erythrocyte concentrates. Transfus. Clin. Biol. 2018, 25, 96–100. [Google Scholar] [CrossRef]
- Bardyn, M.; Chen, J.; Dussiot, M.; Crettaz, D.; Schmid, L.; Längst, E.; Amireault, P.; Tissot, J.-D.; Jolicoeur, M.; Prudent, M. Restoration of physiological levels of uric acid and ascorbic acid reroutes the metabolism of stored red blood cells. Metabolites 2020, 10, 226. [Google Scholar] [CrossRef]
- Arun, P.; Nair, K.G.P.; Manojkumar, V.; Deepadevi, K.V.; Lakshmi, L.R.; Kurup, P.A. Decreased hemolysis and lipid peroxidation in blood during storage in the presence of nicotinic acid. Vox Sang. 1999, 76, 220–225. [Google Scholar] [CrossRef] [PubMed]
- Amen, F.; Machin, A.; Touriño, C.; Rodríguez, I.; Denicola, A.; Thomson, L. N-acetylcysteine improves the quality of red blood cells stored for transfusion. Arch. Biochem. Biophys. 2017, 621, 31–37. [Google Scholar] [CrossRef]
- Pallotta, V.; Gevi, F.; D’Alessandro, A.; Zolla, L. Storing red blood cells with vitamin C and N-acetylcysteine prevents oxidative stress-related lesions: A metabolomics overview. Blood Transfus. 2014, 12, 376–387. [Google Scholar] [CrossRef] [PubMed]
- Bardyn, M.; Maye, S.; Lesch, A.; Delobel, J.; Tissot, J.-D.; Cortés-Salazar, F.; Tacchini, P.; Lion, N.; Girault, H.H.; Prudent, M. The antioxidant capacity of erythrocyte concentrates is increased during the first week of storage and correlated with the uric acid level. Vox Sang. 2017, 112, 638–647. [Google Scholar] [CrossRef] [Green Version]
- Burns, J.M.; Yang, X.; Forouzan, O.; Sosa, J.M.; Shevkoplyas, S.S. Artificial microvascular network: A new tool for measuring rheologic properties of stored red blood cells. Transfusion 2012, 52, 1010–1023. [Google Scholar] [CrossRef]
- Roussel, C.; Buffet, P.A.; Amireault, P. Measuring post-transfusion recovery and survival of red blood cells: Strengths and weaknesses of chromium-51 labeling and alternative methods. Front. Med. 2018, 5. [Google Scholar] [CrossRef] [PubMed]
- Roussel, C.; Dussiot, M.; Marin, M.; Morel, A.; Ndour, P.A.; Duez, J.; Le Van Kim, C.; Hermine, O.; Colin, Y.; Buffet, P.A.; et al. Spherocytic shift of red blood cells during storage provides a quantitative whole cell-based marker of the storage lesion. Transfusion 2017, 57, 1007–1018. [Google Scholar] [CrossRef] [PubMed]
- Doan, M.; Sebastian, J.A.; Caicedo, J.C.; Siegert, S.; Roch, A.; Turner, T.R.; Mykhailova, O.; Pinto, R.N.; McQuin, C.; Goodman, A.; et al. Objective assessment of stored blood quality by deep learning. Proc. Natl. Acad. Sci. USA 2020, 117, 21381–21390. [Google Scholar] [CrossRef]
- Bardyn, M.; Rappaz, B.; Jaferzadeh, K.; Crettaz, D.; Tissot, J.-D.; Moon, I.; Turcatti, G.; Lion, N.; Prudent, M. Red blood cells ageing markers: A multi-parametric analysis. Blood Transfus. 2017, 15, 239–248. [Google Scholar] [CrossRef] [PubMed]
- Liu, J.; Zhu, L.; Zhang, F.; Dong, M.; Qu, X. Microdeformation of RBCs under oxidative stress measured by digital holographic microscopy and optical tweezers. Appl. Opt. 2019, 58, 4042–4046. [Google Scholar] [CrossRef]
- Erel, O. A novel automated direct measurement method for total antioxidant capacity using a new generation, more stable ABTS radical cation. Clin. Biochem. 2004, 37, 277–285. [Google Scholar] [CrossRef]
- Lesch, A.; Cortés-Salazar, F.; Prudent, M.; Delobel, J.; Rastgar, S.; Lion, N.; Tissot, J.-D.; Tacchini, P.; Girault, H.H. Large scale inkjet-printing of carbon nanotubes electrodes for antioxidant assays in blood bags. J. Electroanal. Chem. 2014, 717–718, 61–68. [Google Scholar] [CrossRef] [Green Version]
- Wang, H.; Joseph, J.A. Quantifying cellular oxidative stress by dichlorofluorescein assay using microplate reader. Free Radic. Biol. Med. 1999, 27, 612–616. [Google Scholar] [CrossRef]
- Wolfe, K.L.; Liu, R.H. Cellular Antioxidant activity (caa) assay for assessing antioxidants, foods, and dietary supplements. J. Agric. Food Chem. 2007, 55, 8896–8907. [Google Scholar] [CrossRef]
- Honzel, D.; Carter, S.G.; Redman, K.A.; Schauss, A.G.; Endres, J.R.; Jensen, G.S. Comparison of chemical and cell-based antioxidant methods for evaluation of foods and natural products: Generating multifaceted data by parallel testing using erythrocytes and polymorphonuclear cells. J. Agric. Food Chem. 2008, 56, 8319–8325. [Google Scholar] [CrossRef] [Green Version]
- Werber, J.; Wang, Y.J.; Milligan, M.; Li, X.; Ji, J.A. Analysis of 2,2’-azobis (2-amidinopropane) dihydrochloride degradation and hydrolysis in aqueous solutions. J. Pharm. Sci. 2011, 100, 3307–3315. [Google Scholar] [CrossRef]
- Rota, C.; Chignell, C.F.; Mason, R.P. Evidence for free radical formation during the oxidation of 2′-7′-dichlorofluorescin to the fluorescent dye 2′-7′-dichlorofluorescein by horseradish peroxidase: Possible implications for oxidative stress measurements. Free Radic. Biol. Med. 1999, 27, 873–881. [Google Scholar] [CrossRef]
- Rappaz, B.; Barbul, A.; Emery, Y.; Korenstein, R.; Depeursinge, C.; Magistretti, P.J.; Marquet, P. Comparative study of human erythrocytes by digital holographic microscopy, confocal microscopy, and impedance volume analyzer. Cytom. Part. A 2008, 73, 895–903. [Google Scholar] [CrossRef] [PubMed]
- Niki, E. [3] Free Radical Initiators as Source of Water- or Lipid-Soluble Peroxyl Radicals. In Methods in Enzymology; Academic Press: Cambridge, MA, USA, 1990; Volume 186, pp. 100–108. [Google Scholar]
- Sinha, A.; Chu, T.T.T.; Dao, M.; Chandramohanadas, R. Single-cell evaluation of red blood cell bio-mechanical and nano-structural alterations upon chemically induced oxidative stress. Sci. Rep. 2015, 5, 9768. [Google Scholar] [CrossRef] [PubMed] [Green Version]
- Sautin, Y.Y.; Johnson, R.J. Uric Acid: The Oxidant-Antioxidant Paradox. Nucleosides Nucleotides Nucleic Acids 2008, 27, 608–619. [Google Scholar] [CrossRef] [Green Version]
- Turner, R.; Brennan, S.O.; Ashby, L.V.; Dickerhof, N.; Hamzah, M.R.; Pearson, J.F.; Stamp, L.K.; Kettle, A.J. Conjugation of urate-derived electrophiles to proteins during normal metabolism and inflammation. J. Biol. Chem. 2018, 293, 19886–19898. [Google Scholar] [CrossRef] [PubMed] [Green Version]
- Abuja, P.M. Ascorbate prevents prooxidant effects of urate in oxidation of human low density lipoprotein. FEBS Lett. 1999, 446, 305–308. [Google Scholar] [CrossRef] [Green Version]
- Pérez-Jiménez, J.; Saura-Calixto, F. Anti-oxidant capacity of dietary polyphenols determined by ABTS assay: A kinetic expression of the results. Int. J. Food Sci. Technol. 2008, 43, 185–191. [Google Scholar] [CrossRef]
- Naparło, K.; Soszyński, M.; Bartosz, G.; Sadowska-Bartosz, I. Comparison of antioxidants: The limited correlation between various assays of antioxidant activity. Molecules 2020, 25, 3244. [Google Scholar] [CrossRef]
- Tedesco, I.; Russo, M.; Russo, P.; Iacomino, G.; Russo, G.L.; Carraturo, A.; Faruolo, C.; Moio, L.; Palumbo, R. Antioxidant effect of red wine polyphenols on red blood cells. J. Nutr. Biochem. 2000, 11, 114–119. [Google Scholar] [CrossRef]
- Wang, G.; Zhang, M.; Zhong, Q.; Lei, Z.; Wu, H.; Lai, F. Protective effects of resveratrol against hypoxanthine-xanthine oxidase-induced toxicity on human erythrocytes. J. Funct. Foods 2016, 23, 144–153. [Google Scholar] [CrossRef]
- Lei, H.; Karniadakis, G.E. Predicting the morphology of sickle red blood cells using coarse-grained models of intracellular aligned hemoglobin polymers. Soft Matter 2012, 8, 4507. [Google Scholar] [CrossRef] [Green Version]
- Meleleo, D. Study of resveratrol’s interaction with planar lipid models: Insights into its location in lipid bilayers. Membranes 2021, 11, 132. [Google Scholar] [CrossRef]
- Rodrigue, C.M.; Porteu, F.; Navarro, N.; Bruyneel, E.; Bracke, M.; Roméo, P.-H.; Gespach, C.; Garel, M.-C. The cancer chemopreventive agent resveratrol induces tensin, a cell–matrix adhesion protein with signaling and antitumor activities. Oncogene 2005, 24, 3274–3284. [Google Scholar] [CrossRef] [Green Version]
- Jin, H.; Liang, Q.; Chen, T.; Wang, X. Resveratrol protects chondrocytes from apoptosis via altering the ultrastructural and biomechanical properties: An afm study. PLoS ONE 2014, 9, e91611. [Google Scholar] [CrossRef] [PubMed] [Green Version]
- Makrigiorgos, G.M. Detection of lipid peroxidation on erythrocytes using the excimer-forming property of a lipophilic BODIPY fluorescent dye. J. Biochem. Biophys. Methods 1997, 35, 23–35. [Google Scholar] [CrossRef]
- Kühn, J.; Shaffer, E.; Mena, J.; Breton, B.; Parent, J.; Rappaz, B.; Chambon, M.; Emery, Y.; Magistretti, P.J.; Depeursinge, C.; et al. Label-free cytotoxicity screening assay by digital holographic microscopy. Assay Drug Dev. Technol. 2013, 11, 101–107. [Google Scholar] [CrossRef] [Green Version]
- Rappaz, B.; Breton, B.; Shaffer, E.; Turcatti, G. Digital holographic microscopy: A quantitative label-free microscopy technique for phenotypic screening. Comb. Chem. High Throughput Screen. 2014, 14, 80. [Google Scholar] [CrossRef] [Green Version]
- Zhang, J.-H.; Chung, T.D.Y.; Oldenburg, K.R. A simple statistical parameter for use in evaluation and validation of high throughput screening assays. J. Biomol. Screen 1999, 4, 67–73. [Google Scholar] [CrossRef] [PubMed]
- European Committee on Blood Transfusion (CD-P-TS). Guide to the Preparation, Use and Quality Assurance of Blood Components, 20th ed.; European Committee on Blood Transfusion: Strasbourg, France, 2020. [Google Scholar]
- Kellett, M.E.; Greenspan, P.; Pegg, R.B. Modification of the cellular antioxidant activity (CAA) assay to study phenolic antioxidants in a Caco-2 cell line. Food Chem. 2018, 244, 359–363. [Google Scholar] [CrossRef] [PubMed]
- Eruslanov, E.; Kusmartsev, S. Identification of ROS using oxidized DCFDA and flow-cytometry. In Advanced Protocols in Oxidative Stress II; Armstrong, D., Ed.; Humana Press: Totowa, NJ, USA, 2010; pp. 57–72. [Google Scholar]
- Bresolí-Obach, R.; Busto-Moner, L.; Muller, C.; Reina, M.; Nonell, S. NanoDCFH-DA: A silica-based nanostructured fluorogenic probe for the detection of reactive oxygen species. Photochem. Photobiol. 2018, 94, 1143–1150. [Google Scholar] [CrossRef] [PubMed] [Green Version]
- Kim, E.; Winkler, T.E.; Kitchen, C.; Kang, M.; Banis, G.; Bentley, W.E.; Kelly, D.L.; Ghodssi, R.; Payne, G.F. Redox probing for chemical information of oxidative stress. Anal. Chem. 2017, 89, 1583–1592. [Google Scholar] [CrossRef]
- Fan, L.M.; Li, J.-M. Evaluation of methods of detecting cell reactive oxygen species production for drug screening and cell cycle studies. J. Pharmacol. Toxicol. Methods 2014, 70, 40–47. [Google Scholar] [CrossRef] [PubMed]
- Gomes, A.; Fernandes, E.; Lima, J.L.F.C. Fluorescence probes used for detection of reactive oxygen species. J. Biochem. Biophys. Methods 2005, 65, 45–80. [Google Scholar] [CrossRef] [PubMed]


Publisher’s Note: MDPI stays neutral with regard to jurisdictional claims in published maps and institutional affiliations. |
© 2021 by the authors. Licensee MDPI, Basel, Switzerland. This article is an open access article distributed under the terms and conditions of the Creative Commons Attribution (CC BY) license (https://creativecommons.org/licenses/by/4.0/).
Share and Cite
Bardyn, M.; Allard, J.; Crettaz, D.; Rappaz, B.; Turcatti, G.; Tissot, J.-D.; Prudent, M. Image- and Fluorescence-Based Test Shows Oxidant-Dependent Damages in Red Blood Cells and Enables Screening of Potential Protective Molecules. Int. J. Mol. Sci. 2021, 22, 4293. https://doi.org/10.3390/ijms22084293
Bardyn M, Allard J, Crettaz D, Rappaz B, Turcatti G, Tissot J-D, Prudent M. Image- and Fluorescence-Based Test Shows Oxidant-Dependent Damages in Red Blood Cells and Enables Screening of Potential Protective Molecules. International Journal of Molecular Sciences. 2021; 22(8):4293. https://doi.org/10.3390/ijms22084293
Chicago/Turabian StyleBardyn, Manon, Jérôme Allard, David Crettaz, Benjamin Rappaz, Gerardo Turcatti, Jean-Daniel Tissot, and Michel Prudent. 2021. "Image- and Fluorescence-Based Test Shows Oxidant-Dependent Damages in Red Blood Cells and Enables Screening of Potential Protective Molecules" International Journal of Molecular Sciences 22, no. 8: 4293. https://doi.org/10.3390/ijms22084293