Article

Targeted Long-Read Sequencing Decodes the Transcriptional Atlas of the Founding RAS Gene Family Members

by
Panagiotis G. Adamopoulos
,
Panagiotis Tsiakanikas
,
Michaela A. Boti
and
Andreas Scorilas
*
Department of Biochemistry and Molecular Biology, Faculty of Biology, National and Kapodistrian University of Athens, 15701 Athens, Greece
*
Author to whom correspondence should be addressed.
Int. J. Mol. Sci. 2021, 22(24), 13298; https://doi.org/10.3390/ijms222413298
Submission received: 2 November 2021 / Revised: 3 December 2021 / Accepted: 8 December 2021 / Published: 10 December 2021
(This article belongs to the Collection Feature Papers in Molecular Oncology)

Abstract

:
The complicity of human RAS proteins in cancer is a well-documented fact, both due to the mutational hyperactivation of these GTPases and the overexpression of the genes encoding these proteins. Thus, it can be easily assumed that the study of RAS genes at the transcriptional and post-transcriptional level is of the utmost importance. Although previous research has shed some light on the basic mechanisms by which GTPases are involved in tumorigenesis, limited information is known regarding the transcriptional profile of the genes encoding these proteins. The present study highlights for the first time the wide spectrum of the mRNAs generated by the three most significant RAS genes (KRAS, NRAS and HRAS), providing an in-depth analysis of the splicing events and exon/intron boundaries. The implementation of a versatile, targeted nanopore-sequencing approach led to the identification of 39 novel RAS mRNA transcript variants and to the elucidation of their expression profiles in a broad panel of human cell lines. Although the present work unveiled multiple hidden aspects of the RAS gene family, further study is required to unravel the biological function of all the novel alternative transcript variants, as well as the putative protein isoforms.

1. Introduction

The human RAS superfamily of small guanosine triphosphatases (GTPases) consists of more than 150 members and is subdivided into five distinct categories (RAS, RHO, RAB, ARF and RAN) on the basis of the protein-members’ sequences, structures and functional characteristics [1]. The RAS subfamily consists of GTPases that are anchored to the membrane via post-transcriptional modifications that occurred at their C-terminal region, guiding their localization into distinct membrane compartments [2,3,4] where they are capable of regulating signal-transduction pathways [5]. In specific, the RAS GTPases KRAS, NRAS and HRAS represent the founding members of this large superfamily of monomeric small (20–25 kDa) GTPases, which play a major role in the regulation of fundamental cellular processes, including cell-cycle progression, cell survival, cell polarity and movement, actin cytoskeletal organization as well as vesicular and nuclear transport [6,7].
According to the GenBank® database, the human genes that encode the founding Ras GTPases (KRAS, NRAS and HRAS) produce 9 protein-coding alternative splice variants that lead to the generation of 6 distinct protein isoforms. These isoforms are characterized by high sequence similarities, sharing major structural and functional features. In particular, the different RAS isoforms share their highest similarity in the N-terminal, where the catalytic domain (also known as G-domain) is located. The G-domain consists of the residues 1–166 and propagates signaling when bound to GTP, whereas it is inactive when bound to GDP. Specifically, it consists of two lobes and its active site resides within the first half of the domain, referred as the effector lobe (residues 1–86). The specific part of the catalytic domain contains three of the five highly conserved motifs that are observed in small GTPases [8,9], and is 100% identical in sequence among the RAS isoforms [10,11]. The second half of the catalytic domain constitutes the allosteric lobe (residues 87–166), which is characterized by the presence of two motifs, NKXD and EXSAK. The NKXD motif (residues 116–119) is responsible for the specificity of the guanine nucleotide [12], while the EXSAK motif (residues 143–147) subserves the stabilization of the nucleotide binding. The allosteric lobe contains hot spots of protein–ligand interactions that bind membrane components and harbors all the differences between the RAS G-domains at the level of primary structure, with a sequence identity of 90% among the allosteric lobes of the three RAS proteins [11,13,14]. Of note, the G-domain harbors both switch I (residues 30–40) and II (residues 60–76) (S1 and S2) regions, as well as the P-loop (residues 10–17) [15], which are responsible for mediating GTP hydrolysis [5,16] and altering the conformational status of RAS isoforms during the GDP/GTP exchange cycle [17,18], while forming an interaction surface for different effectors and regulators [5].
Their biological role as binary molecular switches places them among the key signal transducers, controlling cellular growth, differentiation, survival and motility as well as cytoskeletal plasticity. More precisely, multiple extracellular stimuli modify the dynamic equilibrium between the inactive (GDP-bound) and active (GTP-bound) states of RAS proteins. As a result, activated RAS-GTP complexes accumulate intracellularly and interact with several downstream effectors to activate critical signaling cascades [7,19]. Because of their involvement in a such significant pathway, these proteins unsurprisingly undergo strict regulation. In particular, RAS GTPases exhibit high-affinity binding for GDP and GTP, but possess low intrinsic GTP-hydrolysis and GDP/GTP-exchange activities [7], which are regulated by two major classes of regulatory proteins. Guanine-nucleotide-exchange factors (GEFs) mediate the composition of an active GTP-bound form [20], whereas GTPase-activating proteins (GAPs) accelerate the intrinsic GTPase activity to mediate the formation of the inactive GDP-bound form [21].
A well-documented fact in the existing literature is the high prevalence of RAS mutations across human malignancies. The major representatives of the RAS gene family, namely HRAS, KRAS and NRAS, are the most frequently mutated genes in malignant neoplasms, and have been under the spotlight of scientific research for the development of targeted therapies [22]. The majority of these mutations contribute to the self-sustainability of the active RAS-GTP state by evading the regulatory circuit of the guanine-exchange cycle, in which GAPs and GEFs tightly regulate GDP/GTP exchange between different RAS states [23,24]. Since these signals are firmly associated with cell growth and division, overactivated RAS signaling can ultimately lead to carcinogenesis [25,26,27,28,29]. Recent scientific evidence shows that among the RAS isoforms, missense mutations are predominantly found in KRAS (85%) and much less frequently in NRAS (12%) and HRAS (3%) [30]. In fact, the founding members of the RAS gene family in humans (KRAS, NRAS and HRAS) are the most common oncogenes in human cancer, whereas mutations that permanently activate RAS are found in almost 25% of all human tumours and up to 90% in specific types of malignancies [31,32,33,34,35,36]. For this reason, RAS inhibitors have been the main subject of research into novel therapeutic strategies in human cancers that are characterized by RAS overactivation.
Apart from their mutational activation, the altered expression patterns of RAS genes have been found in several human malignancies [37]. For example, two of the KRAS alternative splice variants, namely KRAS-4A and KRAS-4B, have been found to encode oncogenic proteins when KRAS is mutated [38]. Although the current evidence for their differential functions is limited, mutated KRAS-4A and KRAS-4B differ in their ability to induce anchorage-independent growth and cell migration. Furthermore, studies in animal models have indicated that wild-type KRAS-4A has tumour-suppressive and pro-apoptotic activity, whereas the wild-type KRAS-4B can be characterized as anti-apoptotic [39,40]. In addition, recent reports have confirmed that the expression levels of the KRAS-4A transcript are notably decreased in colorectal adenocarcinoma (CRC), highlighting that KRAS splicing is notably altered and therefore indicating that the balance among the expression levels of the KRAS splice variants may have a significant role in CRC tumorigenesis [41]. In contrast to their mutational status, which has been thoroughly investigated, the transcriptional landscape of the RAS gene family and the effect of the alternative splicing mechanism in this superfamily remain unclear. As a result, the thorough investigation of RAS pre-mRNA processing and the identification of the actual mature mRNAs that are synthesized under normal and/or pathological conditions are of high significance, as they may lead to the identification of new diagnostic and/or prognostic biomarkers or promising novel therapeutic targets.
To this end, the present study aims to identify new mRNA transcripts of the founding members of the RAS gene family using the cutting-edge nanopore-sequencing technology. However, instead of using the “gold-standard” direct-RNA-sequencing application, which fails to identify novel transcripts due to the seriously decreased sequencing depth in terms of a specific gene, we designed and employed a targeted nanopore-sequencing approach that offered a tremendous sequencing depth, which allowed the thorough investigation of the existing alternative splicing events and the identification of novel RAS mRNA transcripts.

2. Results

2.1. Nanopore Sequencing Reveals Novel RAS mRNA Transcripts

Visualization of the aligned nanopore-sequencing reads with Integrative Genomics Viewer (IGV) confirmed the annotated mRNA transcripts of KRAS, NRAS and HRAS genes with significant depth. However, a bioinformatics analysis also unveiled novel splice junctions between annotated exons of these genes, which were confirmed by our in-house developed generic splicing tool “ASDT” [42] and visualization of the mapped sequencing reads with IGV (Figure 1). Notably, due to the long-read technology that nanopore sequencing offers, the derived sequencing reads that bear the novel splice junctions covered the entire cDNA sequences from the first until the last exon of each RAS gene, thus representing novel RAS mRNA transcripts (Supplementary data). In addition, it should be mentioned that even though the frequency of each new splicing event was decreased as compared to the annotated ones, each newly identified RAS mRNA transcript was validated by multiple nanopore-sequencing reads. For all three of the RAS genes that were investigated in the present work, a total of 39 novel mRNA transcripts were identified and their exon/intron boundaries were fully characterized (Figure 1).

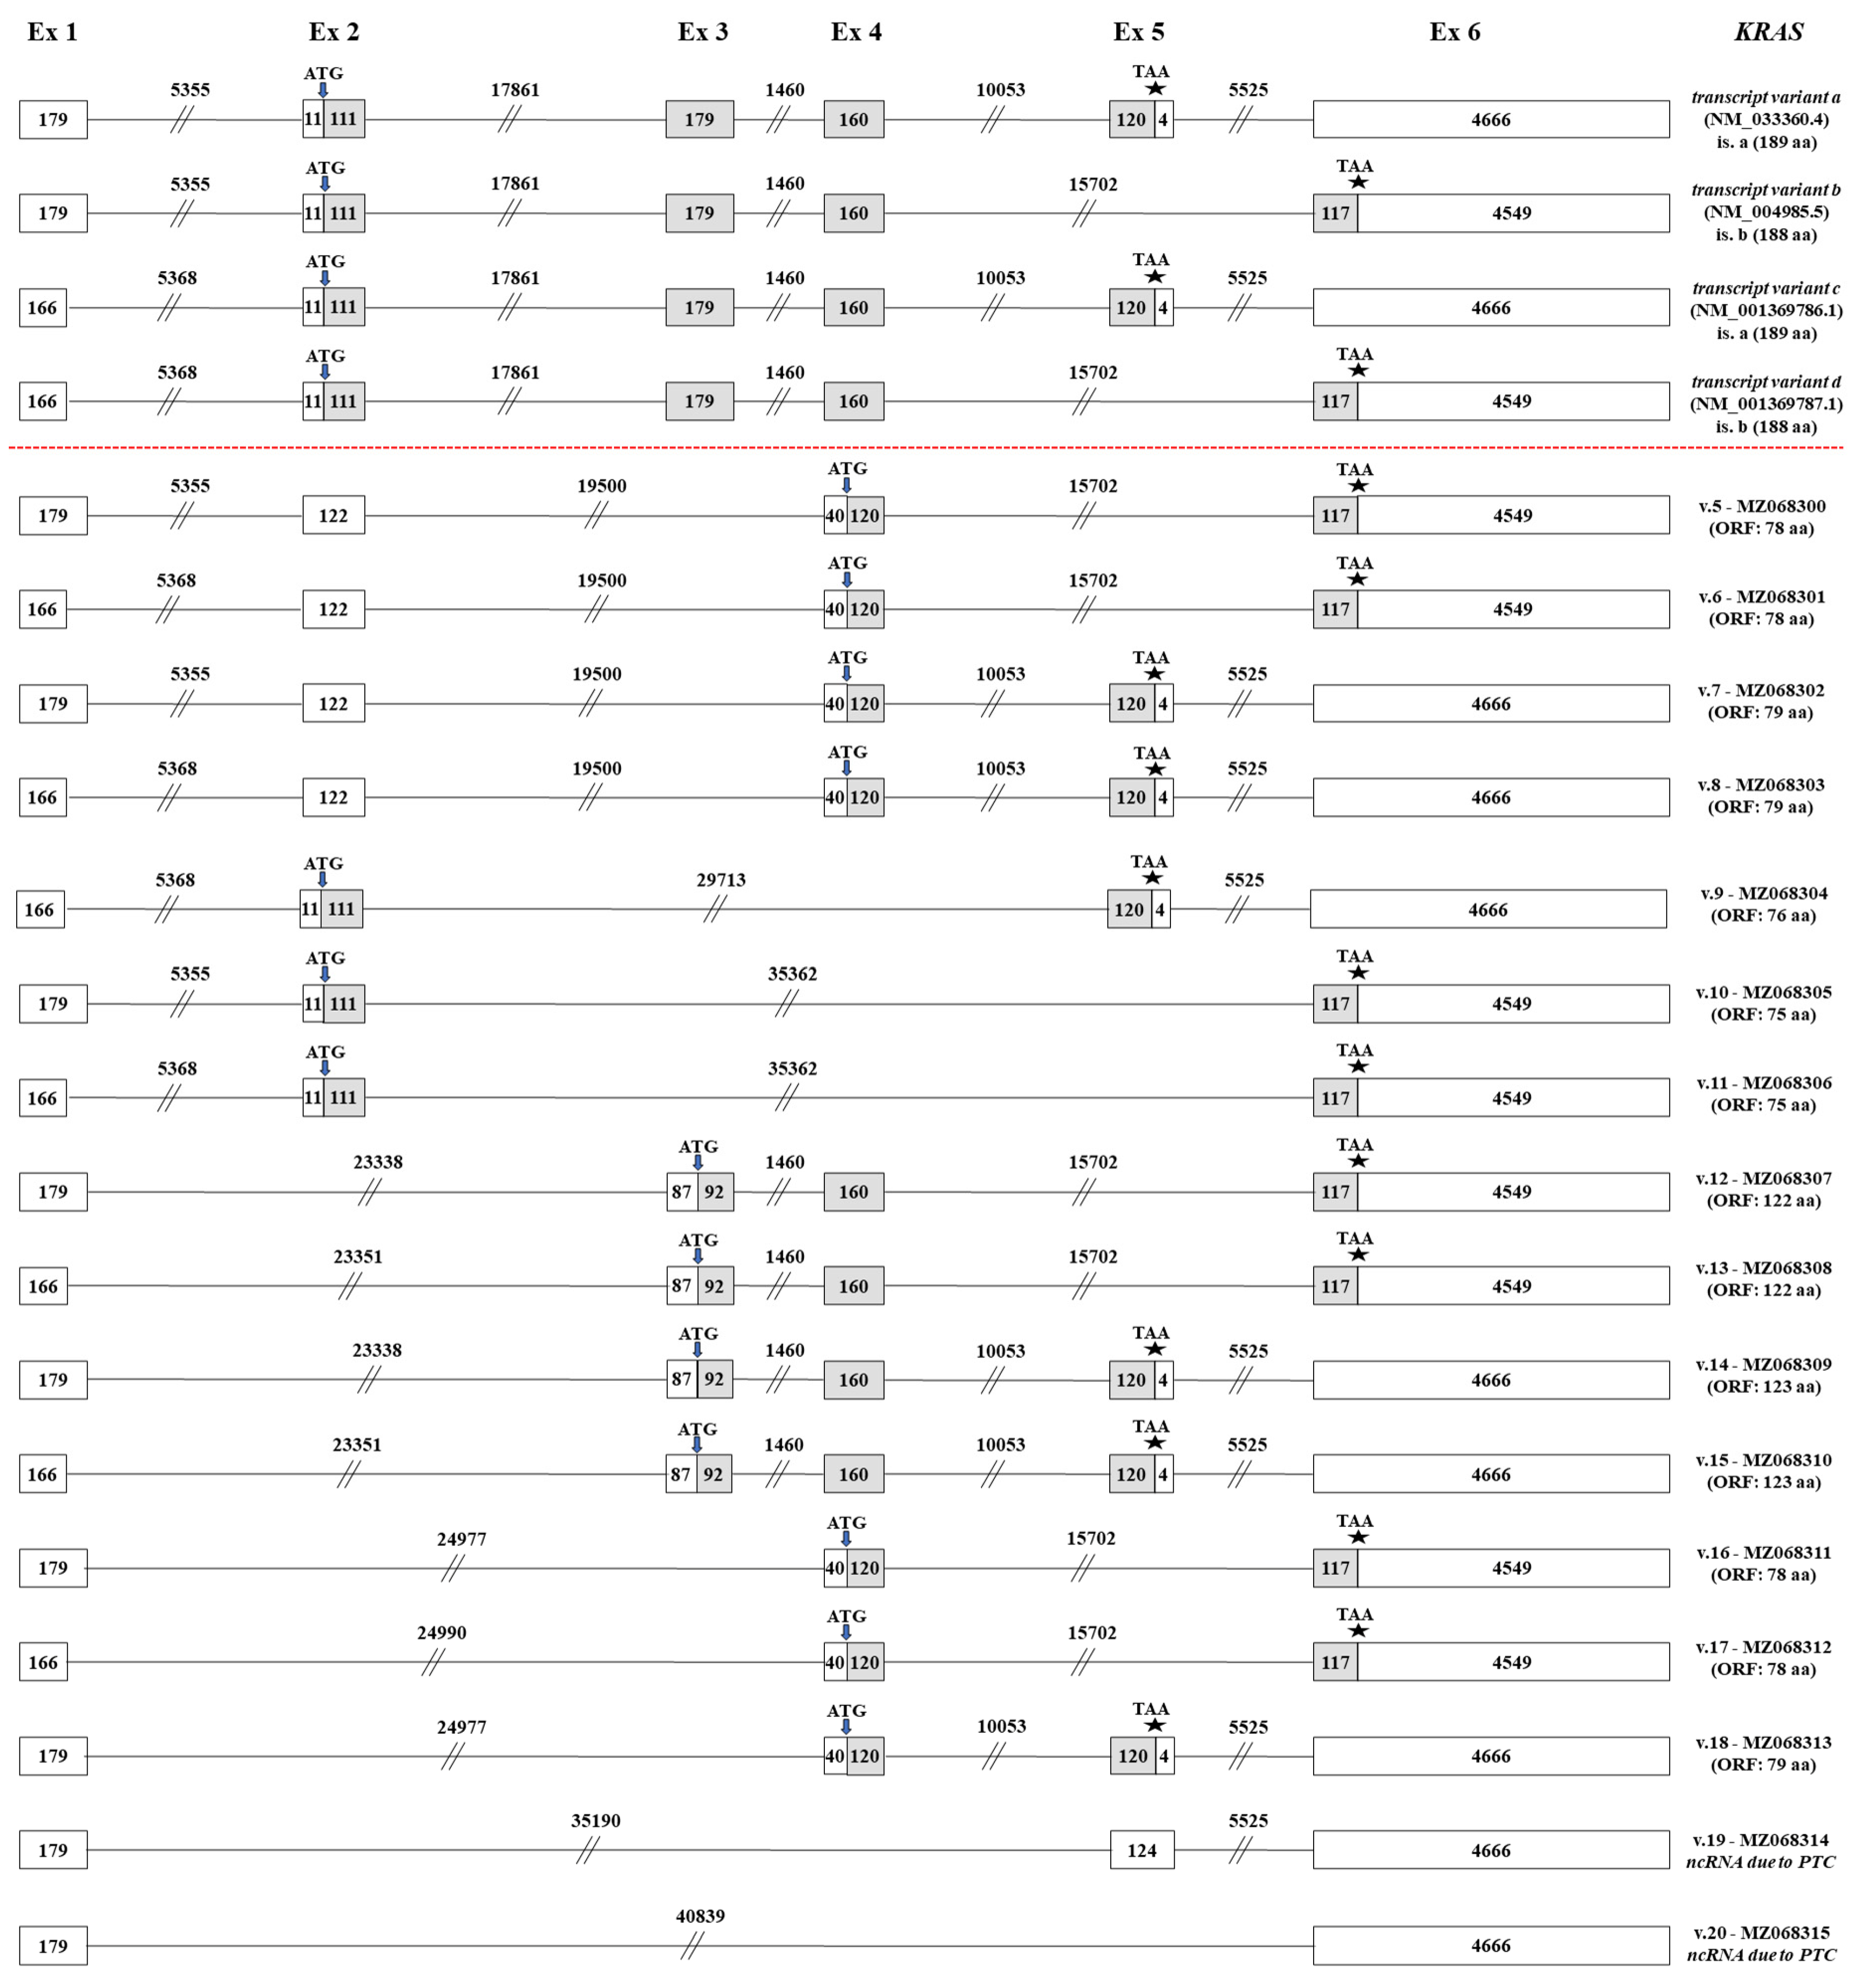
2.2. Identification of Novel KRAS mRNA Transcripts

Briefly, 4 annotated KRAS transcript variants (variants a, b, c and d, GenBank® accession numbers: NM_033360.4, NM_004985.5, NM_001369786.1 and NM_001369787.1, respectively), which were generated by a total of six distinct exons, have already been confirmed (Figure 2). Variants a and c encode the main KRAS isoform (189 aa), while variants b and d synthesize an alternative KRAS isoform of 188 aa. The two transcripts that encode each isoform are almost identical, since they only contain a subtle differentiation in their first exon, which is characterized by an alternative 5’ splice site. Therefore, the first exon of variants a and b is composed of 179 nt, whereas variants b and d encompass a truncated exon 1 (166 nt). Besides the validation of these 4 annotated KRAS transcript variants, the sequencing results of the current study confirmed the existence of 16 novel KRAS mRNA transcripts (KRAS v.5 – v.20, GenBank® accession numbers: MZ068300–MZ068315, accordingly) that are characterized by new exon-skipping events.
Based on the obtained raw reads, 4 new KRAS transcript variants (KRAS v.5 – v.8) share the novel splicing event between exons 2 and 4, thus lacking the sequence of exon 3 (Figure 2). Although KRAS v.5 and v.6 are also characterized by the exon skipping of exon 5 that is observed on two annotated variants (b and d), this exon is present on both KRAS v.7 and v.8. In addition, KRAS v.5 and v.7 encompass the annotated first exon that consists of 179 nt, while KRAS v.6 and v.8 bear the alternative truncated exon 1 (166 nt). This subtle difference in the first exon is also encountered on the rest of the identified KRAS transcripts, leading to pairs of new variants that contain only this subtle differentiation. An in silico query for open reading frames (ORFs) indicated that KRAS v.5 – v.8 are predicted to encode new KRAS isoforms, utilizing an alternative translation-initiation codon that resides in exon 4 (Figure 2).
An additional KRAS mRNA transcript was identified (KRAS v.9), which is characterized by the truncated exon 1 (166 nt) and the simultaneous absence of exons 3 and 4 from its cDNA sequence. Despite this new splicing event between exons 2 and 5, KRAS v.9 is predicted to be protein-coding since it has an ORF of 76aa (Figure 2). The next two novel transcripts, KRAS v.10 and v.11, share the previously undescribed splicing event between exons 2 and 6, while being differentiated only in the 5’ splice site of the first exon. Both KRAS v.10 and v.11 have ORFs, utilizing annotated start and stop codons and, therefore, are predicted to be protein-coding mRNAs.
Furthermore, our findings confirmed a set of 4 novel KRAS mRNA transcripts (KRAS v.12 – v.15), which share the exon skipping of exon 2, an exon that is present in all the annotated KRAS transcripts. Both KRAS v.12 and v.13 are also characterized by the exon skipping of exon 5, while KRAS v.14 and v.15 contain the entire exon 5 sequence. Once again, these two pairs of transcripts are further differentiated based on whether they encompass the truncated exon 1 (Figure 2). Regarding their protein-coding ability, KRAS v.12 – v.15 are expected to be protein-coding, utilizing an alternative translation-initiation codon residing on exon 3.
Besides the previously described findings, the derived sequencing reads led to the identification of 3 additional novel KRAS transcripts (KRAS v.16 – v.18) that are characterized by the new splicing event between exons 1 and 4. These splice variants have notably truncated nucleotide sequences as compared to the annotated ones, since both exons 2 and 3 are absent. Two of these transcripts, KRAS v.16 and v.17, also lack exon 5 and are differentiated in the 5’ splice site of the first exon. On the contrary, KRAS v.18 contains exon 5 and encompasses the full sequence of exon 1 (179 nt). This new splicing event between exons 1 and 4 leads to the creation of ORFs and therefore KRAS v.16 – v.18 are most likely protein-coding mRNAs. Finally, our findings unveiled two non-coding mRNA transcripts, KRAS v.19 – v.20, which are significantly truncated transcripts as they are generated by new splicing events between distant exons (Figure 2).

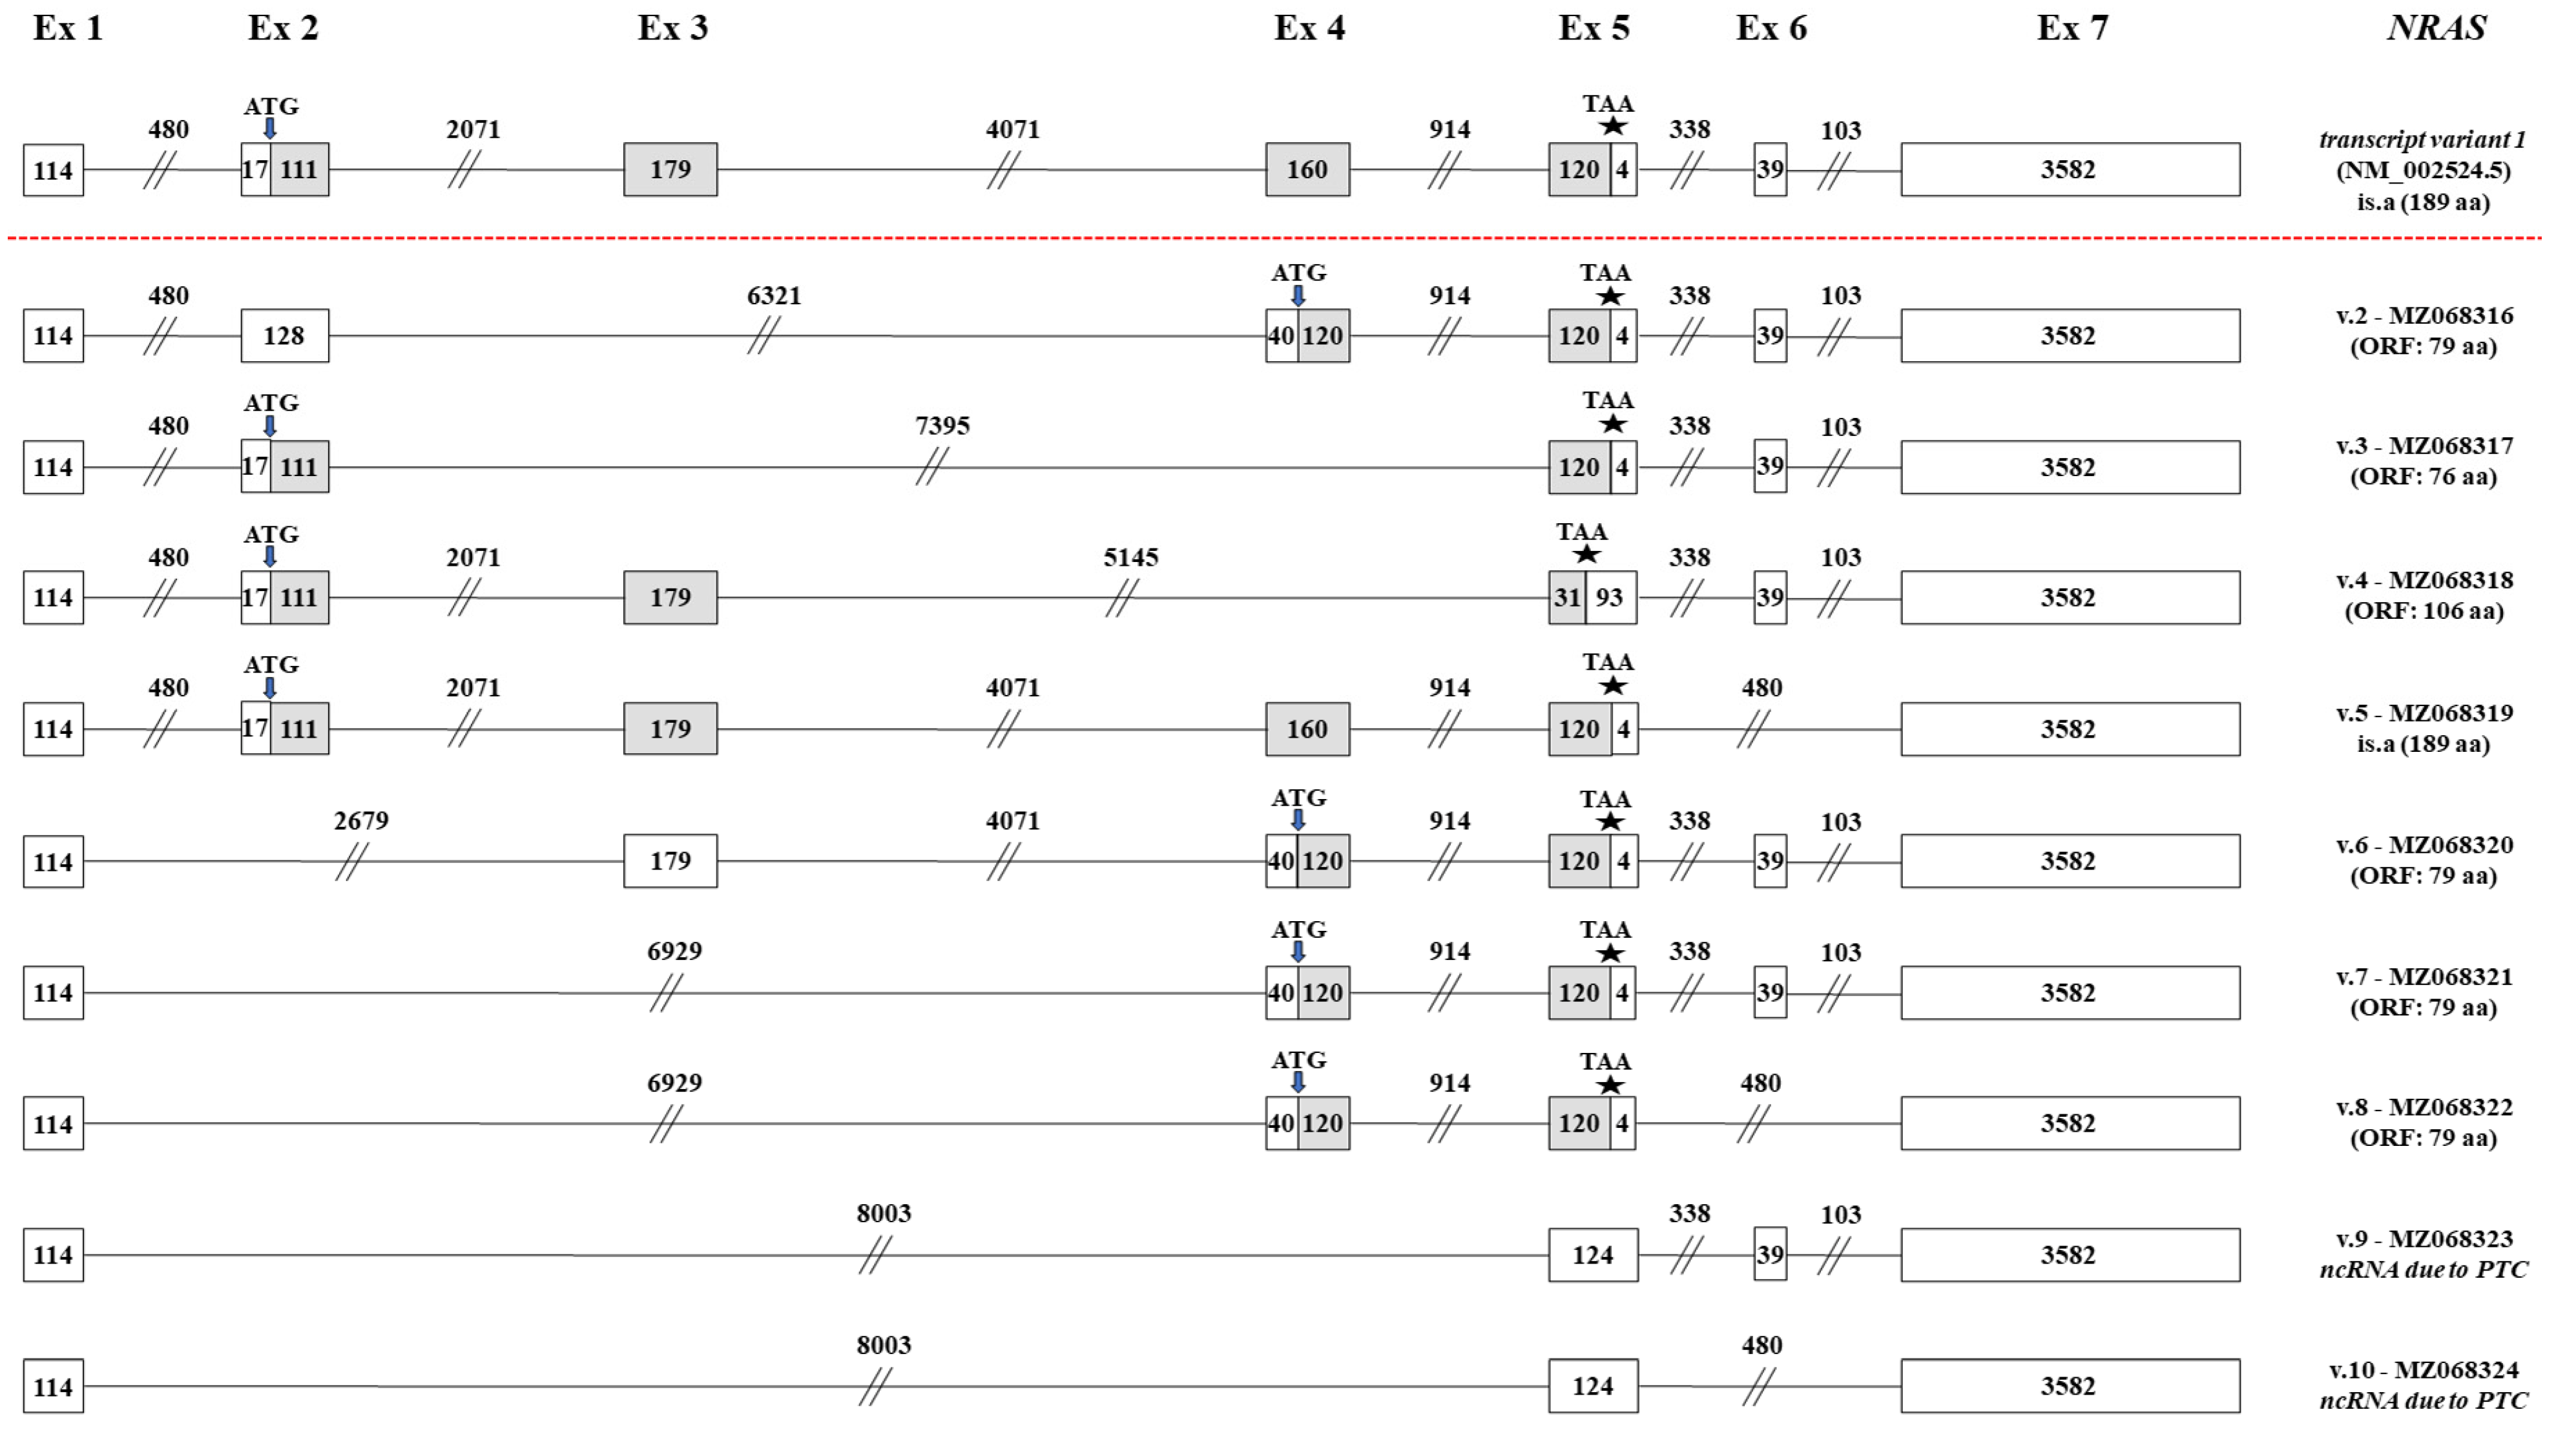
2.3. Identification of Novel NRAS mRNA Transcripts

Only a single annotated transcript (NRAS v.1, GenBank® accession number: NM_002524.5) is currently curated for the human NRAS gene. This mRNA is composed of 7 distinct exons and encodes the NRAS GTPase. Despite NRAS v.1 being the most abundant mRNA in the obtained sequencing data, a computational analysis confirmed multiple novel exon-skipping events that lead to the generation of 9 novel NRAS mRNA transcripts (NRAS v.2 – v.10, GenBank® accession numbers: MZ068316–MZ068324, respectively).
A bioinformatics analysis unveiled a set of 5 NRAS transcripts (NRAS v.2 – v.6), each one derived from a new exon-skipping event. In detail, NRAS v.2 is produced by the exon skipping of exon 3, whereas NRAS v.3 lacks both exons 3 and 4 (Figure 3). Additionally, NRAS v.4 is characterized by the exon skipping of exon 4 and NRAS v.5 is produced by the new splicing event between exons 5 and 7, thus lacking exon 6. Finally, NRAS v.6 lacks exon 2, which contains the annotated translation-initiation codon. Although NRAS v.2 – v.6 are derived from different exon-skipping events, they all have ORFs and as a result they most likely represent protein-coding mRNAs (Figure 3).
Furthermore, our findings indicate the existence of two additional splice variants, NRAS v.7 and v.8. These two novel NRAS transcripts share the new splicing event between exons 1 and 4 but are differentiated since NRAS v.8 also lacks exon 6. The simultaneous exon skipping of exons 2 and 3 in these transcripts leads to the creation of the same ORF, and therefore NRAS v.7 and v.8 are predicted to encode the same protein isoform. In addition, the last two identified transcripts, NRAS v.9 and v.10, share the new splicing event between exons 1 and 5, thus being significantly truncated as compared to the annotated NRAS v.1. Their difference is detected on exon 5, which is present on NRAS v.9, but absent from NRAS v.10 (Figure 3). Finally, the new splicing of exons 1 and 5 leads to the formation of a premature termination codon (PTC) and, as a result, both NRAS v.9 and v.10 are highly expected to represent non-coding mRNAs.

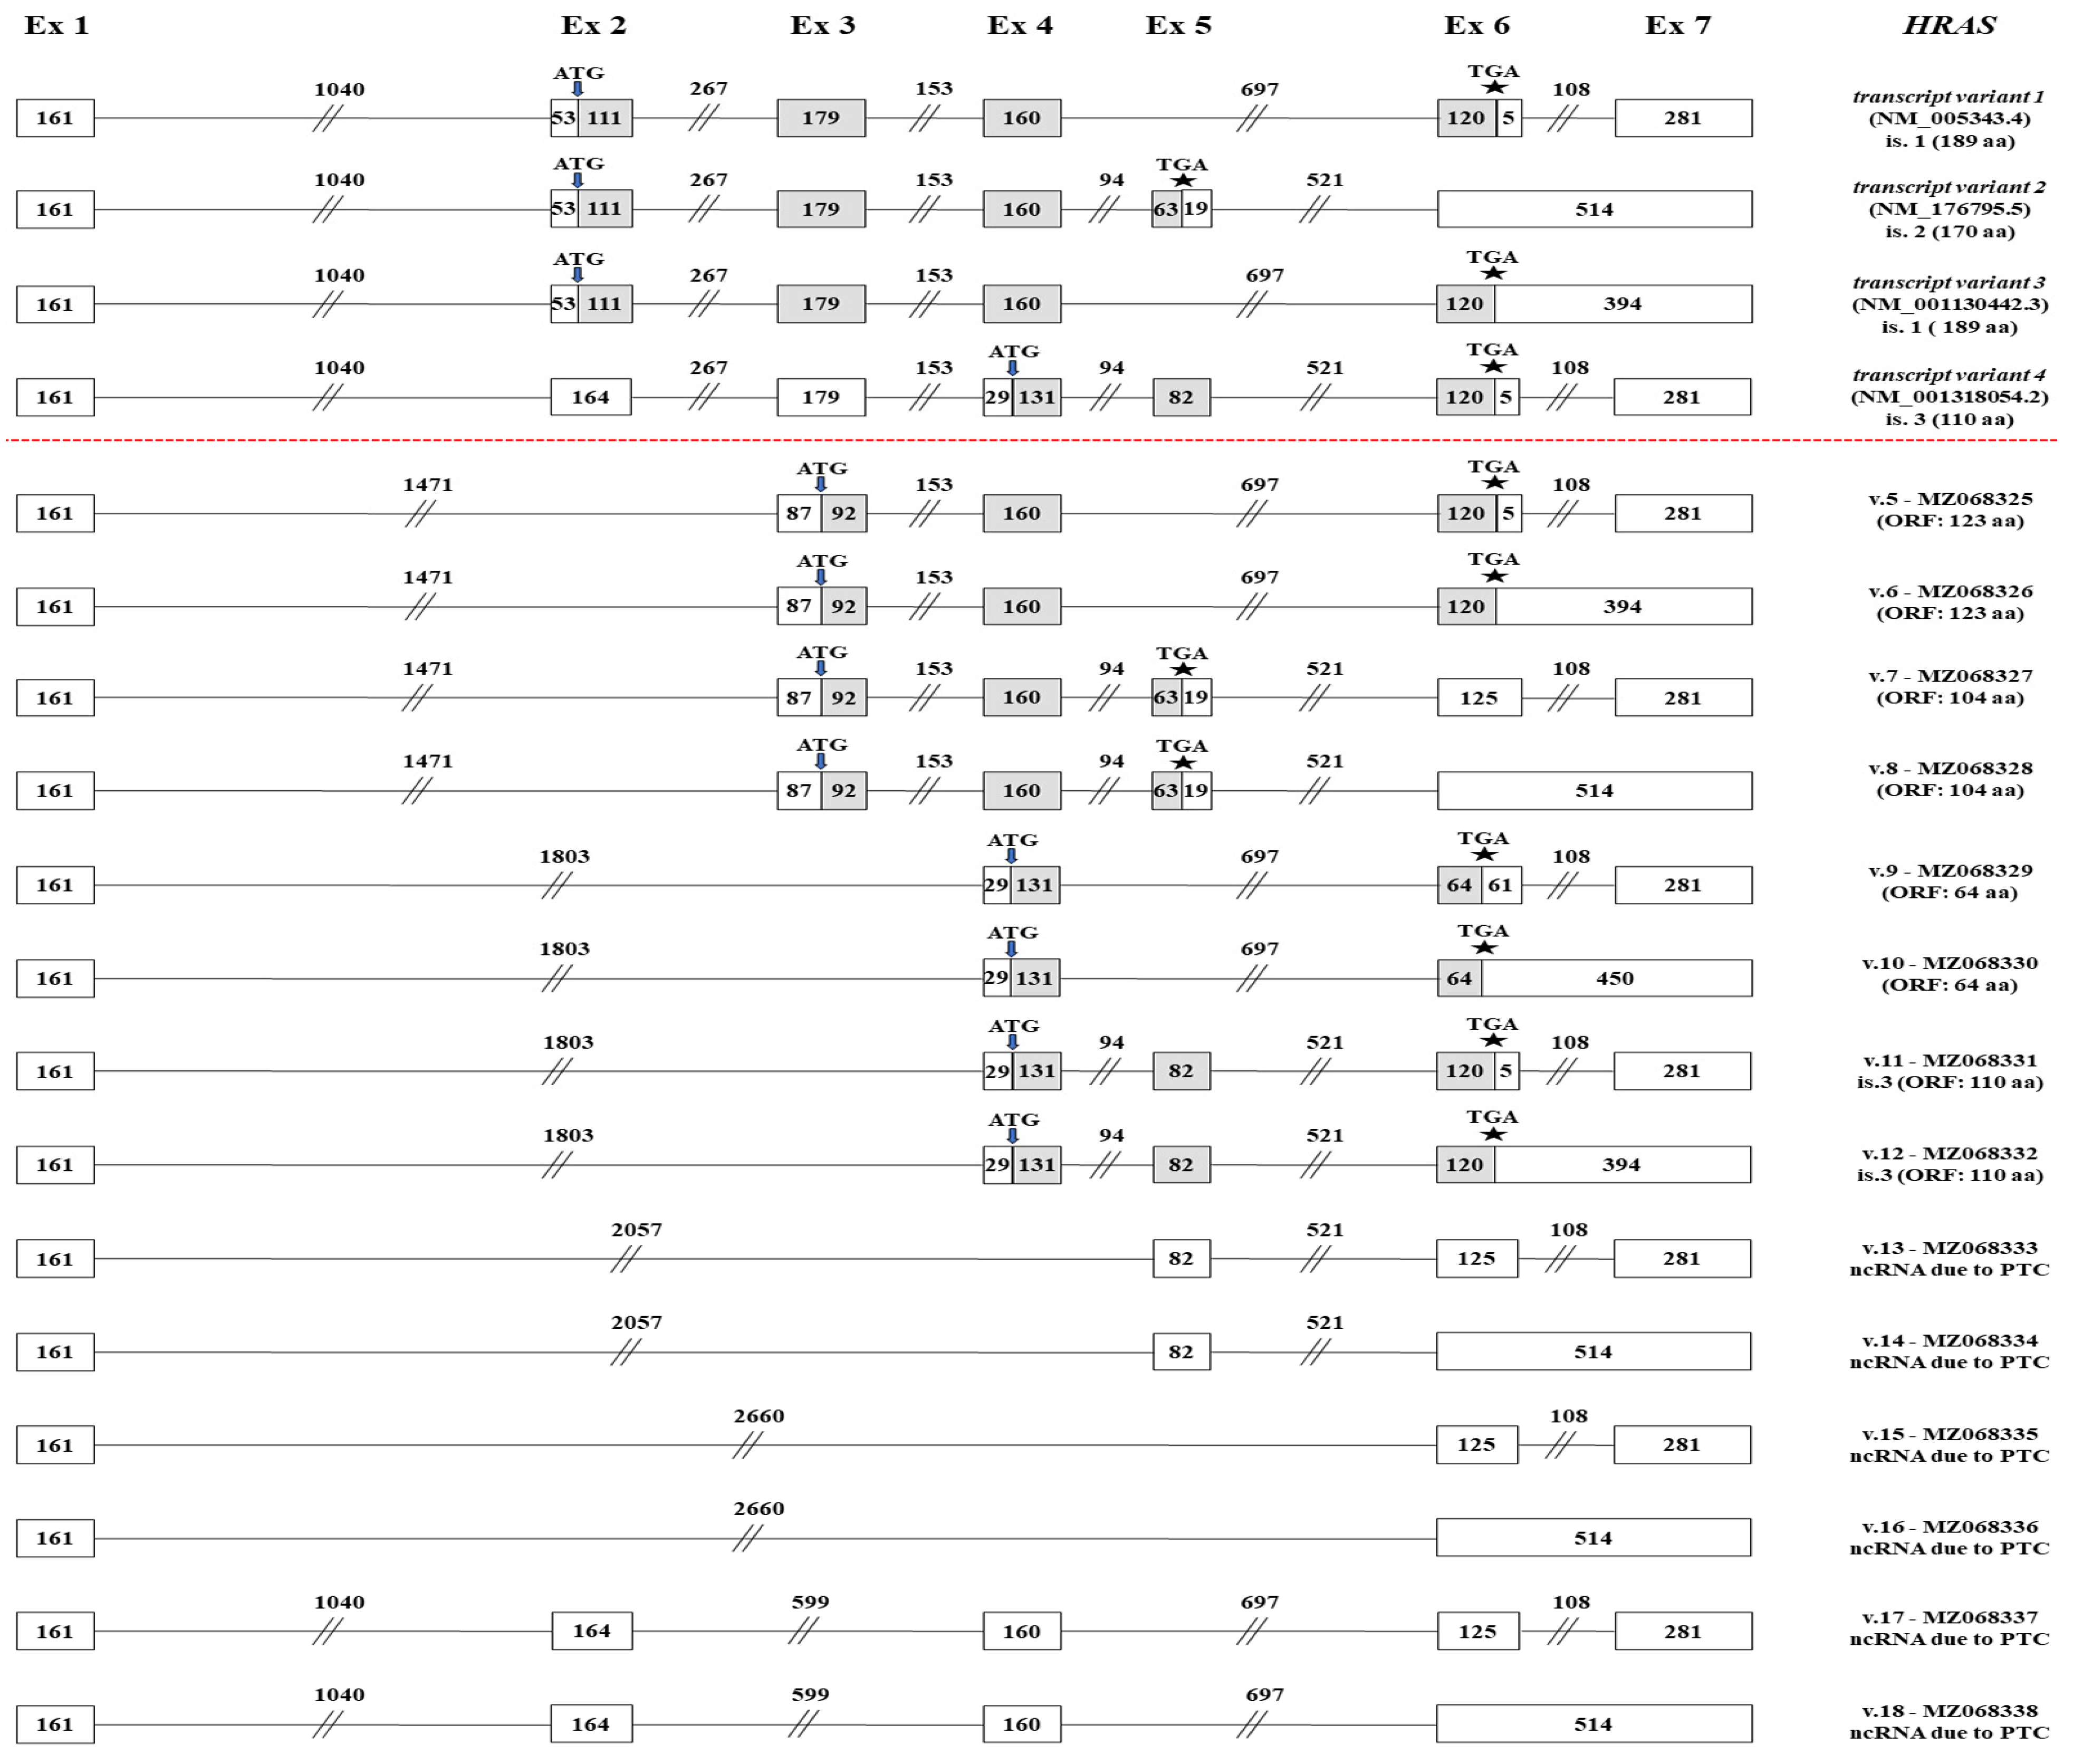
2.4. Identification of Novel HRAS mRNA Transcripts

Based on the existing literature, 4 annotated HRAS transcripts have been already confirmed (HRAS v.1 – v.4, GenBank® accession numbers: NM_005343.4, NM_176795.5, NM_001130442.3 and NM_001318054.2). In total, 7 distinct exons of the gene have been elucidated, whereas an intron retention between exons 6 and 7 has also been identified in HRAS v.2 and v.3 (Figure 4). Although our nanopore sequencing results validated all the annotated mRNAs, they also revealed the existence of 5 new alternative splicing events that eventually led to the identification of 14 novel HRAS mRNA transcripts (HRAS v.5 – v.18, GenBank® accession numbers: MZ068325–MZ068338, accordingly).
Initially, we identified a set of 4 novel HRAS mRNA transcripts (HRAS v.5 – v.8), which share the previously unidentified exon skipping of exon 2, since exon 1 is alternatively spliced with exon 3 (Figure 4). Besides this new splicing event, both HRAS v.5 and v.6 lack the complete sequence of exon 5 and are differentiated in the intron retention between exons 6 and 7, which is present only on HRAS v.6. On the contrary, both HRAS v.7 and v.8 encompass exon 5 and once again their difference is the intron retention between exons 6 and 7. Based on the in silico ORF query, HRAS v.5 – v.8 have ORFs and are therefore predicted to be protein-coding mRNAs. An additional set of 4 novel HRAS mRNA transcripts (HRAS v.9 – v.12) that share the new splicing event between exons 1 and 4 was unveiled (Figure 4). Besides the simultaneous absence of exons 2 and 3, these transcripts are differentiated based on whether they contain exon 5 and the intron retention between exons 6 and 7, which is a pattern that was also observed in the previously described set of transcripts (HRAS v.5 – v.8). Additionally, it should also be mentioned that HRAS v.9 – v.12 have ORFs, utilizing the annotated translation-initiation codon of HRAS v.4, and therefore they are expected to encode novel isoforms (Figure 4).
Finally, 6 additional HRAS mRNA transcripts with PTCs were identified and thus predicted to be non-coding mRNAs. These mRNAs can be divided into three pairs of transcripts, with each pair being differentiated only in the intron retention between exons 6 and 7. Briefly, HRAS v.13 and v.14 share the new splicing event between exons 1 and 5, while HRAS v.15 and v.16 are further truncated mRNAs as they are characterized by the new splicing event between exons 1 and 6 (Figure 4). The last two novel transcripts, HRAS v.17 and v.18, share the simultaneous exon skipping of exons 3 and 5.

2.5. Expression Pattern of the Novel RAS Transcripts in a Wide Spectrum of Human Tissues

Although most of the novel transcript variants are detected in notably lower counts compared to the annotated mRNAs, interestingly, some of them demonstrate broad expression patterns across human tissues (Figure 5). In detail, the new transcript variants KRAS v5, v6, v10 and v12, NRAS v2, v3, v4 and HRAS v5 were identified as the most abundant in the human cell lines that were tested. On the contrary, KRAS v9, v15, and v19, NRAS v8 and v10 and HRAS v11, v12, v13, v14, v15, v16 and v18 were almost undetectable. However, some of the latter demonstrate a notable, tissue-specific expression. Specifically, KRAS transcript variants v13, v14, v15, v16, v17 and v19 were found to be highly expressed in lung cancer (Figure 5). Accordingly, based on our sequencing results, NRAS v9 is predominantly expressed in breast and brain cancer. Finally, HRAS v13 and v15 were notably expressed only in liver and renal carcinomas. This evidence supports a putative tissue-specific role of the corresponding transcript variants that merits further investigation regarding their biological role and their clinical value in human malignancies.

3. Discussion

In the present study, we developed and employed a versatile targeted nanopore sequencing approach to the in-depth detection of new alternative splicing events of the founding RAS family gene members (KRAS, NRAS and HRAS), and more specifically the identification of novel mRNA transcripts. The obtained sequencing data led to the identification of 39 novel RAS mRNA transcripts that originate from previously uncharacterized alternative splicing junctions between the annotated exons of these genes. Even though our research was mainly focused on the elucidation of novel splicing events occurring during RNA processing, the identification of the presented RAS transcripts was achieved by applying a targeted DNA-sequencing approach that exploited the nanopore-sequencing technology, instead of using the “gold-standard” direct-RNA-sequencing application [43]. The implementation of the presented targeted-sequencing approach offered a tremendous sequencing depth, enabling the identification and characterization of previously undetected mRNA transcripts in single reads. Of note, more conventional techniques for transcriptional analysis, such as direct-RNA, direct-cDNA or PCR-cDNA sequencing approaches are unable to detect novel transcript variants due to the significantly decreased sequencing depth they provide in terms of a specific gene.
Since RAS proteins play a crucial role in cancer, both due to the mutational hyperactivation of these GTPases and the overexpression of the genes encoding these proteins [22,23,24,37], it can be easily assumed that the study of these genes at the transcriptional and post-transcriptional level is of the utmost importance. The presumptive existence of transcript variants that have not yet been identified, as well as their potential association with specific types of cancers, may lay the foundations for the identification of novel diagnostic, prognostic and/or predictor biomarkers, and may also ameliorate the therapeutic management of cancers that are related to the oncogenic RAS genes [22,34].
Regarding the presented 16 novel alternative variants of KRAS, 14 of them are predicted to have ORFs and, thus, encode novel protein isoforms, whereas the remaining 2 transcripts contain PTCs and are therefore candidates for non-sense-mediated mRNA decay (NMD). Particularly, KRAS v.5 – v.11 and KRAS v.16 – v.18 are predicted to contain previously undescribed small ORFs (smORFs) and their potential translation would lead to the generation of KRAS micropeptides containing less than 100 aa [44]. Although the coding potential of these smORFs had not been elucidated in the past, recent studies have highlighted the crucial regulatory function of these small proteins [45,46,47]. Even though these studies provide new insights regarding the emerging role of these biomolecules in cellular physiology and widen our knowledge about the potential involvement of these molecules in human diseases, there is an urgent necessity for their further investigation to fully characterize and unveil their function in human malignancies. Regarding the structure of these KRAS micropeptides, the potential translation of KRAS v.5 – v.8 and v.16 – v.18 would lead to the production of small proteins that are expected to lack the effector lobe of the G-domain and a significant part of the allosteric lobe [11,48]. Although the residues that contribute to the formation of the allosteric lobe are present in the amino acid sequence of the aforementioned protein isoforms, the absence of the switch I and II regions indicate that these potential proteins are not capable of interacting with their downstream effectors [11,12,48]. On the contrary, KRAS v.9 – v.11 are predicted to encode KRAS micropeptides that are characterized by a truncated effector lobe, while they lack the allosteric lobe and as a result, they are not expected to mediate signaling. However, their C-terminal region is integral, enabling the transport of the particular proteins to the suitable membrane compartment [3,4].
The rest of the KRAS transcripts that are predicted to be coding (KRAS v.12 – v.15) are characterized by the presence of a novel translation-initiation codon. Specifically, KRAS v.12 and v.13 are predicted to encode the same protein isoform that consists of 122 aa, while the potential translation of KRAS v.14 and v.15 is expected to lead to the generation of a new protein that consists of 123 aa (Figure 2). These two novel protein isoforms are characterized by a truncated G-domain and a lack of the effector lobe, but retaining the allosteric lobe. Since the active site of the G-domain is missing, these isoforms would not be capable of mediating signaling [7]. However, the existence of a C-terminal that is identical to the C-terminal of the annotated protein isoforms indicates that these proteins can be transferred to the proper membrane compartment [3,4].
Besides the novel findings for KRAS, the in silico computational analysis led to the identification of 14 novel HRAS transcripts, 8 of which are predicted to encode new protein isoforms, while the rest of them contain PTCs, thus being NMD candidates. In specific, HRAS v.5 and v.6 are predicted to encode the same protein isoform, which is composed of 123 aa (Figure 4). This protein lacks a significant part of the effector lobe, including the switch I and II regions, and thus the specific isoform is not expected to interact with GAPs, which mediate GTP hydrolysis and alter the conformation of RAS isoforms during the GDP/GTP-exchange cycle [21]. Likewise, HRAS v.7 and v.8 are predicted to contain a novel initiation codon in exon 3 and, as a result, encode a new protein isoform that consists of 104 aa. The potential translation of these two alternative transcript variants would lead to the generation of a protein that displays a truncated N-terminal region, compared to the annotated HRAS isoform 2, and that lacks the effector lobe. Additionally, the newly identified HRAS v.9 and v.10 contain a smORF that is characterized by alternative initiation and termination codons, and the potential translation of these variants would lead to the generation of a small protein that may have regulatory roles [44]. Of note, HRAS v.11 and v.12 are predicted to encode a protein isoform that is identical to the annotated HRAS isoform 3 (110 aa), which is encoded by the annotated transcript variant 4 (Figure 4). The existence of three distinct transcript variants that encode the same protein isoform may indicate the tissue-specific expression of these mRNAs, as well as the differential regulation they undergo regarding their 5’ and/or 3’ untranslated regions.
Similar findings were observed from NRAS, as the obtained results led to the identification of nine novel NRAS transcript variants, seven of which are predicted to have ORFs and, thus, encode new protein isoforms. Particularly, it was found that the newly identified transcripts NRAS v.2, v.3, v.6, v.7 and v.8 contain previously undescribed smORFs and their potential translation would lead to the synthesis of NRAS micropeptides, containing less than 100 aa [44]. In specific, the protein encoded by NRAS v.3 is predicted to have a truncated effector lobe, but lacks the allosteric lobe, while the protein isoform that is encoded by the other four transcripts is expected to display no similarity to the annotated NRAS GTPase, since its amino-acid sequence is totally different. Additionally, NRAS v.4 is predicted to encode a novel protein isoform of 106 aa that retains the effector lobe of the G-domain but lacks the allosteric lobe. The generation of a protein that is characterized by an intact effector lobe without the site responsible for the stabilization of the nucleotide binding [14] would render the activation of the potential GTPase unlikely. Finally, the last coding transcript that was identified, NRAS v.5, is predicted to have the same ORF as the annotated NRAS v.1 and, thus, the potential translation of this particular novel variant would lead to the generation of the annotated NRAS GTPase (Figure 3).
In conclusion, our study highlights the wide spectrum of RAS mRNAs that are transcribed, providing an in-depth analysis of splicing events and exon/intron boundaries in a broad panel of cancerous and non-cancerous human cell lines. Although the current study provides a transcriptional profile regarding KRAS, HRAS and NRAS, further studies must be conducted to elucidate the biological function of all of the novel alternative transcript variants, as well as their putative protein isoforms.

4. Materials and Methods

4.1. Culture of Human Cell Lines

The implementation of the present work was carried out using an established panel of 40 human cell lines (Table S1). To investigate the expression of the putative novel RAS transcripts in a wide spectrum of human cancers, 37 cell lines that were cultured originated from 13 distinct human malignancies, whereas the other 3 are non-cancerous. All human cell lines were propagated based on the American Type Culture Collection (ATCC) guidelines.

4.2. Total RNA Extraction, Poly(A) Selection and First-Strand cDNA Synthesis

Total RNA isolation from every cultured cell line was carried out with the TRIzol Reagent (Ambion™, Thermo Fisher Scientific Inc., Waltham, MA, USA). The derived RNA samples were diluted in the RNA Storage Solution (Ambion™), whereas the assessment of their concentration and purity was performed spectrophotometrically at 260 and 280 nm, using a BioSpec-nano Micro-volume UV-Vis Spectrophotometer (Shimadju, Kyoto, Japan). Finally, oligo dT-based mRNA enrichment was performed using the NEBNext® Poly(A) mRNA Magnetic Isolation Module (New England Biolabs Inc., Ipswich, MA, USA) and 5μg total RNA from each cell line.
The poly(A)-enriched RNA samples were used as templates in reverse transcription (RT) reactions for the generation of single-stranded cDNAs. For this purpose, an oligo-dT20 was used as an RT primer to anneal in the 3’ poly(A) tail of the mRNA transcripts. Briefly, each RT reaction was carried out in a Veriti 96-Well Fast Thermal Cycler (Applied Biosystems™) and in reaction volumes of 20 μL, which included 150 ng of mRNA, 1 μL of oligo-dT20 (10 μM), 1 μL dNTP Mix (10 mM each), 4 μL 5× First-Strand Buffer, 1 μL DTT (0.1 M), 1 μL RNaseOUT™ (Invitrogen™, Thermo Fisher Scientific Inc.) and 1 μL (200 U) of SuperScript™ III Reverse Transcriptase (Invitrogen™, Thermo Fisher Scientific Inc.), following the manufacturer’s protocol. The Glyceraldehyde 3-phosphate dehydrogenase (GAPDH) gene was used as housekeeping for the quality control of the produced cDNA samples.
Equimolar amounts of each cDNA sample were mixed for the creation of 14 distinct cDNA pools that corresponded to a specific human tissue or malignancy, as shown in Table S1. The derived cDNA pools were exploited as templates for the downstream PCR amplification step.

4.3. PCR Amplification of RAS mRNA Transcripts

Touchdown PCR-based assays were employed for the amplification of the mRNA transcript variants of KRAS, NRAS and HRAS genes in each cDNA pool sample with significantly increased sensitivity, specificity and PCR yield [49]. In specific, a forward (F) gene-specific primer was designed to target the first annotated exon and was used along with a reverse (R) gene-specific primer that was designed to anneal onto the last annotated exon of each targeted RAS gene (Table 1).
The touchdown PCR assays were performed in reaction volumes of 25 μL containing KAPA Taq Buffer A (Kapa Biosystems Inc., Wilmington, MA, USA), which included MgCl2 at a final concentration of 1.5 mM, 0.2 mM dNTPs, 0.4 μM of each primer, and 1 unit of KAPA Taq DNA Polymerase (Kapa Biosystems Inc.). In addition, the applied cycling protocol included an initial denaturation step at 95 °C for 3 min, followed by 30 cycles of 95 °C for 30 s, 65 °C (auto-ΔTa: −0.3 °C/cycle) for 30 s, 72 °C for 2 min, and a final extension step at 72 °C for 2 min. The amplicons from each cDNA pool sample were purified with the NucleoSpin® Gel and PCR Clean-up kit (Macherey-Nagel GmbH & Co. KG, Duren, Germany).

4.4. Nanopore Sequencing

The purified PCR product derived from each cDNA pool was used for the construction of a barcoded library for nanopore sequencing. As a result, 14 barcoded libraries were constructed that corresponded to breast cancer, ovarian cancer, prostate cancer, colorectal cancer, urinary bladder cancer, hepatocellular carcinoma, lung cancer, cervical cancer, brain cancer, hematological malignancies, gastric cancer, endometrial cancer, renal cancer, and non-cancerous cell lines. Briefly, the NEBNext® Ultra™ II End Repair/dA-Tailing Module (New England Biolabs, Inc) was employed for the end-repair process, the Agencourt AMPure XP beads magnetic beads (Beckman Coulter, Brea, CA, USA) were used for the nucleic-acid-purification steps, whereas the Quick T4 Ligase (New England Biolabs, Inc) enabled the adapter ligation. The derived barcoded libraries were quantified using the Qubit® 2.0 Fluorometer and were mixed equimolarly. Nanopore sequencing was carried out on a MinION Mk1C sequencer (Oxford Nanopore Technologies Ltd., Oxford, UK), using a FLO-MIN106D flow cell with R9.4.1 chemistry and the Ligation Sequencing Kit (SQK-LSK109, ONT), following the manufacturer’s instructions.

4.5. Validation of Nanopore Findings with Next-Generation Sequencing

Reproducibility of the nanopore-sequencing findings was carried out using NGS based on a semi-conductor-sequencing technology. The Ion Xpress™ Plus Fragment Library Kit (Ion Torrent™, Thermo Fisher Scientific Inc.) was employed for the DNA-seq library construction, using 1 μg of purified PCR product mix as the input. Enzymatic fragmentation, adapter ligation, nick-repair and purification of the ligated DNA were implemented following the manufacturer’s protocol. Bead-based size selection of the constructed DNA-seq library was performed using the KAPA Pure Beads (Kapa Biosystems Inc.) in the recommended ratio of fragmented dsDNA:beads in order to enrich the library for 300–400 bp fragments. The size-selected library was quantified with the Ion Library TaqMan™ Quantitation Kit (Ion Torrent™) in an ABI 7500 Fast Real-Time PCR System (Applied Biosystems™). The sequencing template was created with emulsion PCR on an Ion OneTouch™ 2 System (Ion Torrent™), using the Ion PGM™ Hi-Q™ View OT2 kit (Ion Torrent™), whereas Ion OneTouch ES™ instrument (Ion Torrent™) was used for the template enrichment. Ultimately, a semi-conductor-sequencing methodology was carried out in an Ion 316™ Chip v2 using an Ion PGM™ System (Ion Torrent™) and the Ion PGM™ Hi-Q™ View Sequencing kit.

4.6. Post Processing and Bioinformatics Analysis

The primary analysis of the acquired nanopore-sequencing data, including base calling, demultiplexing, adapter trimming as well as quality assessment was performed with Guppy [50]. Nanopore-sequencing reads were separated into the “pass” and “fail” folder based on their quality scores, while only passed reads were used for the bioinformatics analysis. The obtained raw nanopore-sequencing data were mapped to the human reference genome (GRCh38) with Minimap2 aligner [51]. Mapped sequencing reads were visualized with IGV for the analysis of the existing alternative splicing events in the RAS target genes [52].
Besides mapping with Minimap2, the detection of alternative splicing events in the created FASTQ file was also implemented with our in-house developed algorithm “ASDT”, which was designed by members of our group as a generic splicing tool capable of identifying alternative splicing events and cryptic exons from high-throughput sequencing datasets [42]. Briefly, “ASDT” produces nucleotide k-mers for every possible splicing event that can occur between the annotated exons of a target gene. Then, it detects these nucleotide k-mers within the sequencing reads of the FASTQ file and extracts them into a separate output file. Furthermore, “ASDT” can detect novel exons, exon extensions or intron retentions by splitting intronic regions into a set of nucleotide k-mers and detecting them within the FASTQ file.
The raw number of the sequencing reads that cover the entire length of both the annotated and novel transcript variants was used to assess their abundance in human tissues. The derived count matrix was normalized using the median of ratios (MRN) method. The expression for each novel mRNA was calculated as the log2-transformed ratio of the difference between the normalized number of reads that corresponded to a specific transcript variant and the normalized number of all the annotated transcripts (log2FC).
In addition, a bioinformatics analysis of the acquired NGS dataset included the mapping of the experimental sequencing reads to the reference genome GRCh38 using HISAT2 aligner [53], the conversion of the created SAM file to BAM with samtools and, finally, the visualization of the aligned reads with IGV.

Supplementary Materials

The following are available online at https://www.mdpi.com/article/10.3390/ijms222413298/s1.

Author Contributions

P.G.A.: Conceptualization, Methodology, Bioinformatics analysis, Writing—Original draft preparation. P.T.: Methodology, Bioinformatics analysis, Data curation. M.A.B.: Methodology, Data curation, Writing—Original draft preparation. A.S.: Conceptualization, Supervision, Critical Reviewing and Editing. All authors have read and agreed to the published version of the manuscript.

Funding

This research received no external funding.

Institutional Review Board Statement

Not applicable.

Informed Consent Statement

Not applicable.

Data Availability Statement

The described novel nucleic acid sequences of the present work, which correspond to the new KRAS, NRAS and HRAS cDNA sequences (KRAS v.5 – v.20, NRAS v.2 – v.10 and HRAS v.5 – v.18), have been submitted and deposited to the GenBank® Data Library, under the accession numbers MZ068300–MZ068338, accordingly.

Acknowledgments

The present study was supported by the Bodossaki Foundation (Athens, Greece) with a postdoctoral fellowship to Panagiotis G. Adamopoulos.

Conflicts of Interest

The authors declare no conflict of interest.

References

  1. Rojas, A.M.; Fuentes, G.; Rausell, A.; Valencia, A. The ras protein superfamily: Evolutionary tree and role of conserved amino acids. J. Cell Biol. 2012, 196, 189–201. [Google Scholar] [CrossRef] [Green Version]
  2. Abankwa, D.; Gorfe, A.A.; Inder, K.; Hancock, J.F. Ras membrane orientation and nanodomain localization generate isoform diversity. Proc. Natl. Acad. Sci. USA 2010, 107, 1130–1135. [Google Scholar] [CrossRef] [Green Version]
  3. Hancock, J.F. Ras proteins: Different signals from different locations. Nat. Rev. Mol. Cell Biol. 2003, 4, 373–384. [Google Scholar] [CrossRef] [PubMed]
  4. Prior, I.A.; Hancock, J.F. Ras trafficking, localization and compartmentalized signalling. Semin. Cell Dev. Biol. 2012, 23, 145–153. [Google Scholar] [CrossRef] [Green Version]
  5. Milburn, M.V.; Tong, L.; de Vos, A.M.; Brünger, A.; Yamaizumi, Z.; Nishimura, S.; Kim, S.H. Molecular switch for signal transduction: Structural differences between active and inactive forms of protooncogenic ras proteins. Science 1990, 247, 939–945. [Google Scholar] [CrossRef] [PubMed] [Green Version]
  6. Colicelli, J. Human ras superfamily proteins and related gtpases. Sci. STKE 2004, 2004, RE13. [Google Scholar] [CrossRef] [PubMed] [Green Version]
  7. Wennerberg, K.; Rossman, K.L.; Der, C.J. The ras superfamily at a glance. J. Cell Sci. 2005, 118, 843–846. [Google Scholar] [CrossRef] [Green Version]
  8. Bourne, H.R.; Sanders, D.A.; McCormick, F. The gtpase superfamily: Conserved structure and molecular mechanism. Nature 1991, 349, 117–127. [Google Scholar] [CrossRef]
  9. Valencia, A.; Chardin, P.; Wittinghofer, A.; Sander, C. The ras protein family: Evolutionary tree and role of conserved amino acids. Biochemistry 1991, 30, 4637–4648. [Google Scholar] [CrossRef]
  10. Gorfe, A.A.; Grant, B.J.; McCammon, J.A. Mapping the nucleotide and isoform-dependent structural and dynamical features of ras proteins. Structure 2008, 16, 885–896. [Google Scholar] [CrossRef] [Green Version]
  11. Buhrman, G.; O’Connor, C.; Zerbe, B.; Kearney, B.M.; Napoleon, R.; Kovrigina, E.A.; Vajda, S.; Kozakov, D.; Kovrigin, E.L.; Mattos, C. Analysis of binding site hot spots on the surface of ras gtpase. J. Mol. Biol. 2011, 413, 773–789. [Google Scholar] [CrossRef] [Green Version]
  12. Zhong, J.M.; Chen-Hwang, M.C.; Hwang, Y.W. Switching nucleotide specificity of ha-ras p21 by a single amino acid substitution at aspartate 119. J. Biol. Chem. 1995, 270, 10002–10007. [Google Scholar] [CrossRef] [PubMed] [Green Version]
  13. Parker, J.A.; Mattos, C. The ras-membrane interface: Isoform-specific differences in the catalytic domain. Mol. Cancer Res. MCR 2015, 13, 595–603. [Google Scholar] [CrossRef] [Green Version]
  14. Johnson, C.W.; Reid, D.; Parker, J.A.; Salter, S.; Knihtila, R.; Kuzmic, P.; Mattos, C. The small gtpases k-ras, n-ras, and h-ras have distinct biochemical properties determined by allosteric effects. J. Biol. Chem. 2017, 292, 12981–12993. [Google Scholar] [CrossRef] [PubMed] [Green Version]
  15. Karnoub, A.E.; Weinberg, R.A. Ras oncogenes: Split personalities. Nat. Rev. Mol. Cell Biol. 2008, 9, 517–531. [Google Scholar] [CrossRef] [Green Version]
  16. Spoerner, M.; Hozsa, C.; Poetzl, J.A.; Reiss, K.; Ganser, P.; Geyer, M.; Kalbitzer, H.R. Conformational states of human rat sarcoma (ras) protein complexed with its natural ligand gtp and their role for effector interaction and gtp hydrolysis. J. Biol. Chem. 2010, 285, 39768–39778. [Google Scholar] [CrossRef] [Green Version]
  17. Ahearn, I.; Zhou, M.; Philips, M.R. Posttranslational modifications of ras proteins. Cold Spring Harb. Perspect. Med. 2018, 8, a031484. [Google Scholar] [CrossRef] [PubMed]
  18. Hobbs, G.A.; Der, C.J.; Rossman, K.L. Ras isoforms and mutations in cancer at a glance. J. Cell Sci. 2016, 129, 1287–1292. [Google Scholar] [CrossRef] [Green Version]
  19. Rajalingam, K.; Schreck, R.; Rapp, U.R.; Albert, S. Ras oncogenes and their downstream targets. Biochim. Biophys. Acta 2007, 1773, 1177–1195. [Google Scholar] [CrossRef] [Green Version]
  20. Bishop, A.L.; Hall, A. Rho gtpases and their effector proteins. Biochem. J. 2000, 348, 241–255. [Google Scholar] [CrossRef]
  21. Bernards, A.; Settleman, J. Gap control: Regulating the regulators of small gtpases. Trends Cell Biol. 2004, 14, 377–385. [Google Scholar] [CrossRef] [PubMed]
  22. Moore, A.R.; Rosenberg, S.C.; McCormick, F.; Malek, S. Ras-targeted therapies: Is the undruggable drugged? Nat. Rev. Drug Discov. 2020, 19, 533–552. [Google Scholar] [CrossRef] [PubMed]
  23. Bos, J.L.; Rehmann, H.; Wittinghofer, A. Gefs and gaps: Critical elements in the control of small g proteins. Cell 2007, 129, 865–877. [Google Scholar] [CrossRef] [PubMed] [Green Version]
  24. Prior, I.A.; Lewis, P.D.; Mattos, C. A comprehensive survey of ras mutations in cancer. Cancer Res. 2012, 72, 2457–2467. [Google Scholar] [CrossRef] [PubMed] [Green Version]
  25. Santos, E.; Martin-Zanca, D.; Reddy, E.P.; Pierotti, M.A.; Della Porta, G.; Barbacid, M. Malignant activation of a k-ras oncogene in lung carcinoma but not in normal tissue of the same patient. Science 1984, 223, 661–664. [Google Scholar] [CrossRef]
  26. Nakano, H.; Yamamoto, F.; Neville, C.; Evans, D.; Mizuno, T.; Perucho, M. Isolation of transforming sequences of two human lung carcinomas: Structural and functional analysis of the activated c-k-ras oncogenes. Proc. Natl. Acad. Sci. USA 1984, 81, 71–75. [Google Scholar] [CrossRef] [Green Version]
  27. Goel, S.; Huang, J.; Klampfer, L. K-ras, intestinal homeostasis and colon cancer. Curr. Clin. Pharmacol. 2015, 10, 73–81. [Google Scholar] [CrossRef] [PubMed]
  28. Hirai, H.; Okabe, T.; Anraku, Y.; Fujisawa, M.; Urabe, A.; Takaku, F. Activation of the c-k-ras oncogene in a human pancreas carcinoma. Biochem. Biophys. Res. Commun. 1985, 127, 168–174. [Google Scholar] [CrossRef]
  29. Chen, S.; Li, F.; Xu, D.; Hou, K.; Fang, W.; Li, Y. The function of ras mutation in cancer and advances in its drug research. Curr. Pharm. Des. 2019, 25, 1105–1114. [Google Scholar] [CrossRef]
  30. Simanshu, D.K.; Nissley, D.V.; McCormick, F. Ras proteins and their regulators in human disease. Cell 2017, 170, 17–33. [Google Scholar] [CrossRef] [Green Version]
  31. Downward, J. Targeting ras signalling pathways in cancer therapy. Nat. Rev. Cancer 2003, 3, 11–22. [Google Scholar] [CrossRef] [PubMed]
  32. Mascaux, C.; Iannino, N.; Martin, B.; Paesmans, M.; Berghmans, T.; Dusart, M.; Haller, A.; Lothaire, P.; Meert, A.P.; Noel, S.; et al. The role of ras oncogene in survival of patients with lung cancer: A systematic review of the literature with meta-analysis. Br. J. Cancer 2005, 92, 131–139. [Google Scholar] [CrossRef] [Green Version]
  33. Fernández-Medarde, A.; Santos, E. Ras in cancer and developmental diseases. Genes Cancer 2011, 2, 344–358. [Google Scholar] [CrossRef] [Green Version]
  34. Friday, B.B.; Adjei, A.A. K-ras as a target for cancer therapy. Biochim. Biophys. Acta 2005, 1756, 127–144. [Google Scholar] [CrossRef] [PubMed]
  35. Shibata, D.; Almoguera, C.; Forrester, K.; Dunitz, J.; Martin, S.E.; Cosgrove, M.M.; Perucho, M.; Arnheim, N. Detection of c-k-ras mutations in fine needle aspirates from human pancreatic adenocarcinomas. Cancer Res. 1990, 50, 1279–1283. [Google Scholar] [PubMed]
  36. Pao, W.; Girard, N. New driver mutations in non-small-cell lung cancer. Lancet Oncol. 2011, 12, 175–180. [Google Scholar] [CrossRef]
  37. Vageli, D.; Kiaris, H.; Delakas, D.; Anezinis, P.; Cranidis, A.; Spandidos, D.A. Transcriptional activation of h-ras, k-ras and n-ras proto-oncogenes in human bladder tumors. Cancer Lett. 1996, 107, 241–247. [Google Scholar] [CrossRef]
  38. Capon, D.J.; Seeburg, P.H.; McGrath, J.P.; Hayflick, J.S.; Edman, U.; Levinson, A.D.; Goeddel, D.V. Activation of ki-ras2 gene in human colon and lung carcinomas by two different point mutations. Nature 1983, 304, 507–513. [Google Scholar] [CrossRef]
  39. Plowman, S.J.; Arends, M.J.; Brownstein, D.G.; Luo, F.; Devenney, P.S.; Rose, L.; Ritchie, A.M.; Berry, R.L.; Harrison, D.J.; Hooper, M.L.; et al. The k-ras 4a isoform promotes apoptosis but does not affect either lifespan or spontaneous tumor incidence in aging mice. Exp. Cell Res. 2006, 312, 16–26. [Google Scholar] [CrossRef] [PubMed]
  40. Luo, F.; Ye, H.; Hamoudi, R.; Dong, G.; Zhang, W.; Patek, C.E.; Poulogiannis, G.; Arends, M.J. K-ras exon 4a has a tumour suppressor effect on carcinogen-induced murine colonic adenoma formation. J. Pathol. 2010, 220, 542–550. [Google Scholar] [CrossRef]
  41. Plowman, S.J.; Berry, R.L.; Bader, S.A.; Luo, F.; Arends, M.J.; Harrison, D.J.; Hooper, M.L.; Patek, C.E. K-ras 4a and 4b are co-expressed widely in human tissues, and their ratio is altered in sporadic colorectal cancer. J. Exp. Clin. Cancer Res. 2006, 25, 259–267. [Google Scholar]
  42. Adamopoulos, P.G.; Theodoropoulou, M.C.; Scorilas, A. Alternative splicing detection tool-a novel perl algorithm for sensitive detection of splicing events, based on next-generation sequencing data analysis. Ann. Transl. Med. 2018, 6, 244. [Google Scholar] [CrossRef] [PubMed]
  43. Depledge, D.P.; Srinivas, K.P.; Sadaoka, T.; Bready, D.; Mori, Y.; Placantonakis, D.G.; Mohr, I.; Wilson, A.C. Direct rna sequencing on nanopore arrays redefines the transcriptional complexity of a viral pathogen. Nat. Commun. 2019, 10, 754. [Google Scholar] [CrossRef] [Green Version]
  44. Couso, J.P.; Patraquim, P. Classification and function of small open reading frames. Nat. Rev. Mol. Cell Biol. 2017, 18, 575–589. [Google Scholar] [CrossRef] [PubMed]
  45. Orr, M.W.; Mao, Y.; Storz, G.; Qian, S.-B. Alternative orfs and small orfs: Shedding light on the dark proteome. Nucleic Acids Res. 2019, 48, 1029–1042. [Google Scholar] [CrossRef]
  46. Khitun, A.; Ness, T.J.; Slavoff, S.A. Small open reading frames and cellular stress responses. Mol. Omics 2019, 15, 108–116. [Google Scholar] [CrossRef] [PubMed] [Green Version]
  47. Plaza, S.; Menschaert, G.; Payre, F. In search of lost small peptides. Annu. Rev. Cell Dev. Biol. 2017, 33, 391–416. [Google Scholar] [CrossRef]
  48. Herrmann, C. Ras-effector interactions: After one decade. Curr. Opin. Struct. Biol. 2003, 13, 122–129. [Google Scholar] [CrossRef]
  49. Korbie, D.J.; Mattick, J.S. Touchdown pcr for increased specificity and sensitivity in pcr amplification. Nat. Protoc. 2008, 3, 1452–1456. [Google Scholar] [CrossRef] [PubMed]
  50. Wick, R.R.; Judd, L.M.; Holt, K.E. Performance of neural network basecalling tools for oxford nanopore sequencing. Genome Biol. 2019, 20, 129. [Google Scholar] [CrossRef] [PubMed] [Green Version]
  51. Li, H. Minimap2: Pairwise alignment for nucleotide sequences. Bioinformatics 2018, 34, 3094–3100. [Google Scholar] [CrossRef] [PubMed]
  52. Thorvaldsdottir, H.; Robinson, J.T.; Mesirov, J.P. Integrative genomics viewer (igv): High-performance genomics data visualization and exploration. Brief. Bioinform. 2013, 14, 178–192. [Google Scholar] [CrossRef] [PubMed] [Green Version]
  53. Kim, D.; Langmead, B.; Salzberg, S.L. Hisat: A fast spliced aligner with low memory requirements. Nat. Methods 2015, 12, 357–360. [Google Scholar] [CrossRef] [PubMed] [Green Version]
Figure 1. Visualization of aligned sequencing reads representing the novel RAS mRNA transcripts described in the present study, using IGV. The human genome 38 (GRCh38) was used as reference. (A) Visualization of the 16 novel KRAS transcripts (KRAS v.5 – v.20). (B) Visualization of the 9 novel NRAS transcripts (NRAS v.2 – v.10). (C) Visualization of the 14 novel HRAS transcripts (HRAS v.5 – v.18).
Ijms 22 13298 g001
Figure 2. Detailed structural demonstration of the 16 novel KRAS transcript variants (KRAS v.5 – v.20) identified in the current study. Exons are exhibited as boxes and introns as lines, while the numbers that characterize every box and line correspond to their length in nucleotides. Gray and white boxes represent coding and non-coding regions, respectively. The positions of the ATG and stop codons are pointed out with arrows (↓) and asterisks (*), accordingly.
Ijms 22 13298 g002
Figure 3. Detailed structural demonstration of the 9 novel NRAS transcript variants (NRAS v.2 – v.10) identified in the current study. Exons are exhibited as boxes and introns as lines, while the numbers that characterize every box and line correspond to their length in nucleotides. Gray and white boxes represent coding and non-coding regions, respectively. The positions of the ATG and stop codons are pointed out with arrows (↓) and asterisks (*), accordingly.
Ijms 22 13298 g003
Figure 4. Detailed structural demonstration of the 14 novel HRAS transcript variants (HRAS v.5 – v.18) identified in the current study. Exons are exhibited as boxes and introns as lines, while the numbers that characterize every box and line correspond to their length in nucleotides. Gray and white boxes represent coding and non-coding regions, respectively. The positions of the ATG and stop codons are pointed out with arrows (↓) and asterisks (*), accordingly.
Ijms 22 13298 g004
Figure 5. Heatmap demonstrating the fold change (Log2FC) ratios of each novel transcript variant relative to the abundance of the annotated mRNA(s) for each RAS gene. Negative values in the color scale bar indicate that all the novel alternative transcript variants are downregulated compared to the main transcript variant. Red coloring is indicative of higher relative abundance of the corresponding transcript variant, whereas blue coloring corresponds to low-frequent or undetectable transcript variants.
Ijms 22 13298 g005
Table 1. List of primers that were used for the specific amplification of the RAS mRNA transcripts with touchdown PCR. The melting temperature (Tm) of each primer was calculated by Primer-BLAST designing tool.
Amplification of RAS Transcripts with Touchdown PCRPrimers
DirectionSequence (5′→3′)Length (nt)Tm (°C)
KRASForwardGCCATTTCGGACTGGGAGC1961.12
ReverseCTCGAACTAATGTATAGAAGGCATCATC2859.76
NRASForwardGCTGTGGTCCTAAATCTGTCCA2260.03
ReverseCTGTGAGACTGAAGACAGCAAC2259.20
HRASForwardGCAGTCGCGCCTGTGAAC1862.08
ReverseGCACCTCCATGTCCTGAGCTT2162.40
Publisher’s Note: MDPI stays neutral with regard to jurisdictional claims in published maps and institutional affiliations.

