
Description of Release Process of Doxorubicin from Modified Carbon Nanotubes

 , , , , and
Abstract
:1. Introduction
2. Results and Discussion
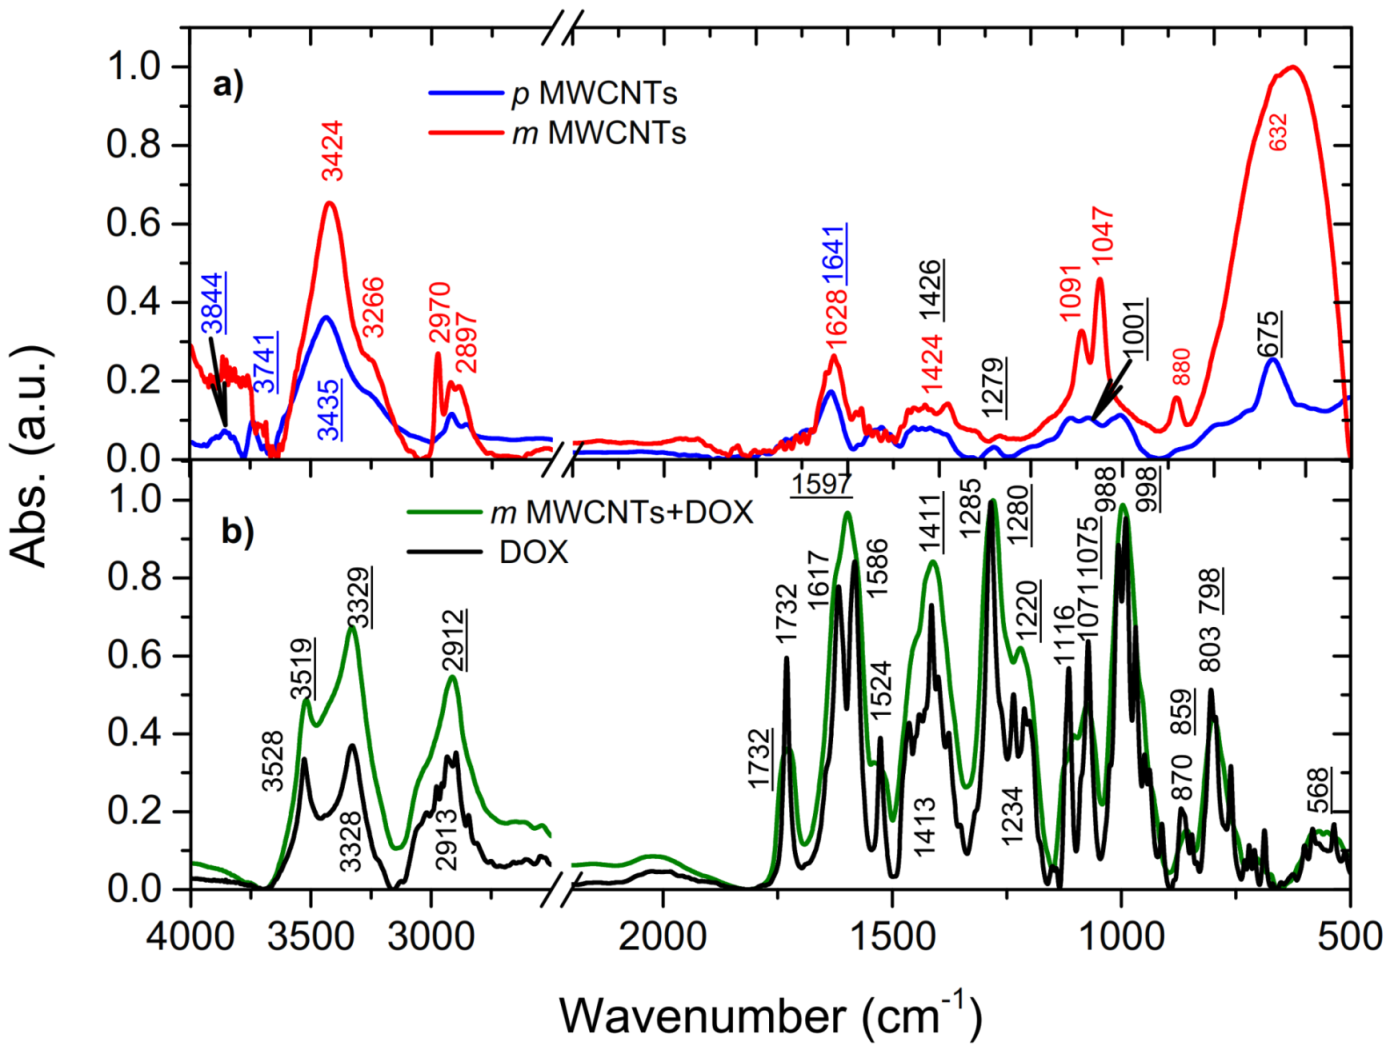
2.1. Fourier Transform Infrared (FTIR) Spectroscopy
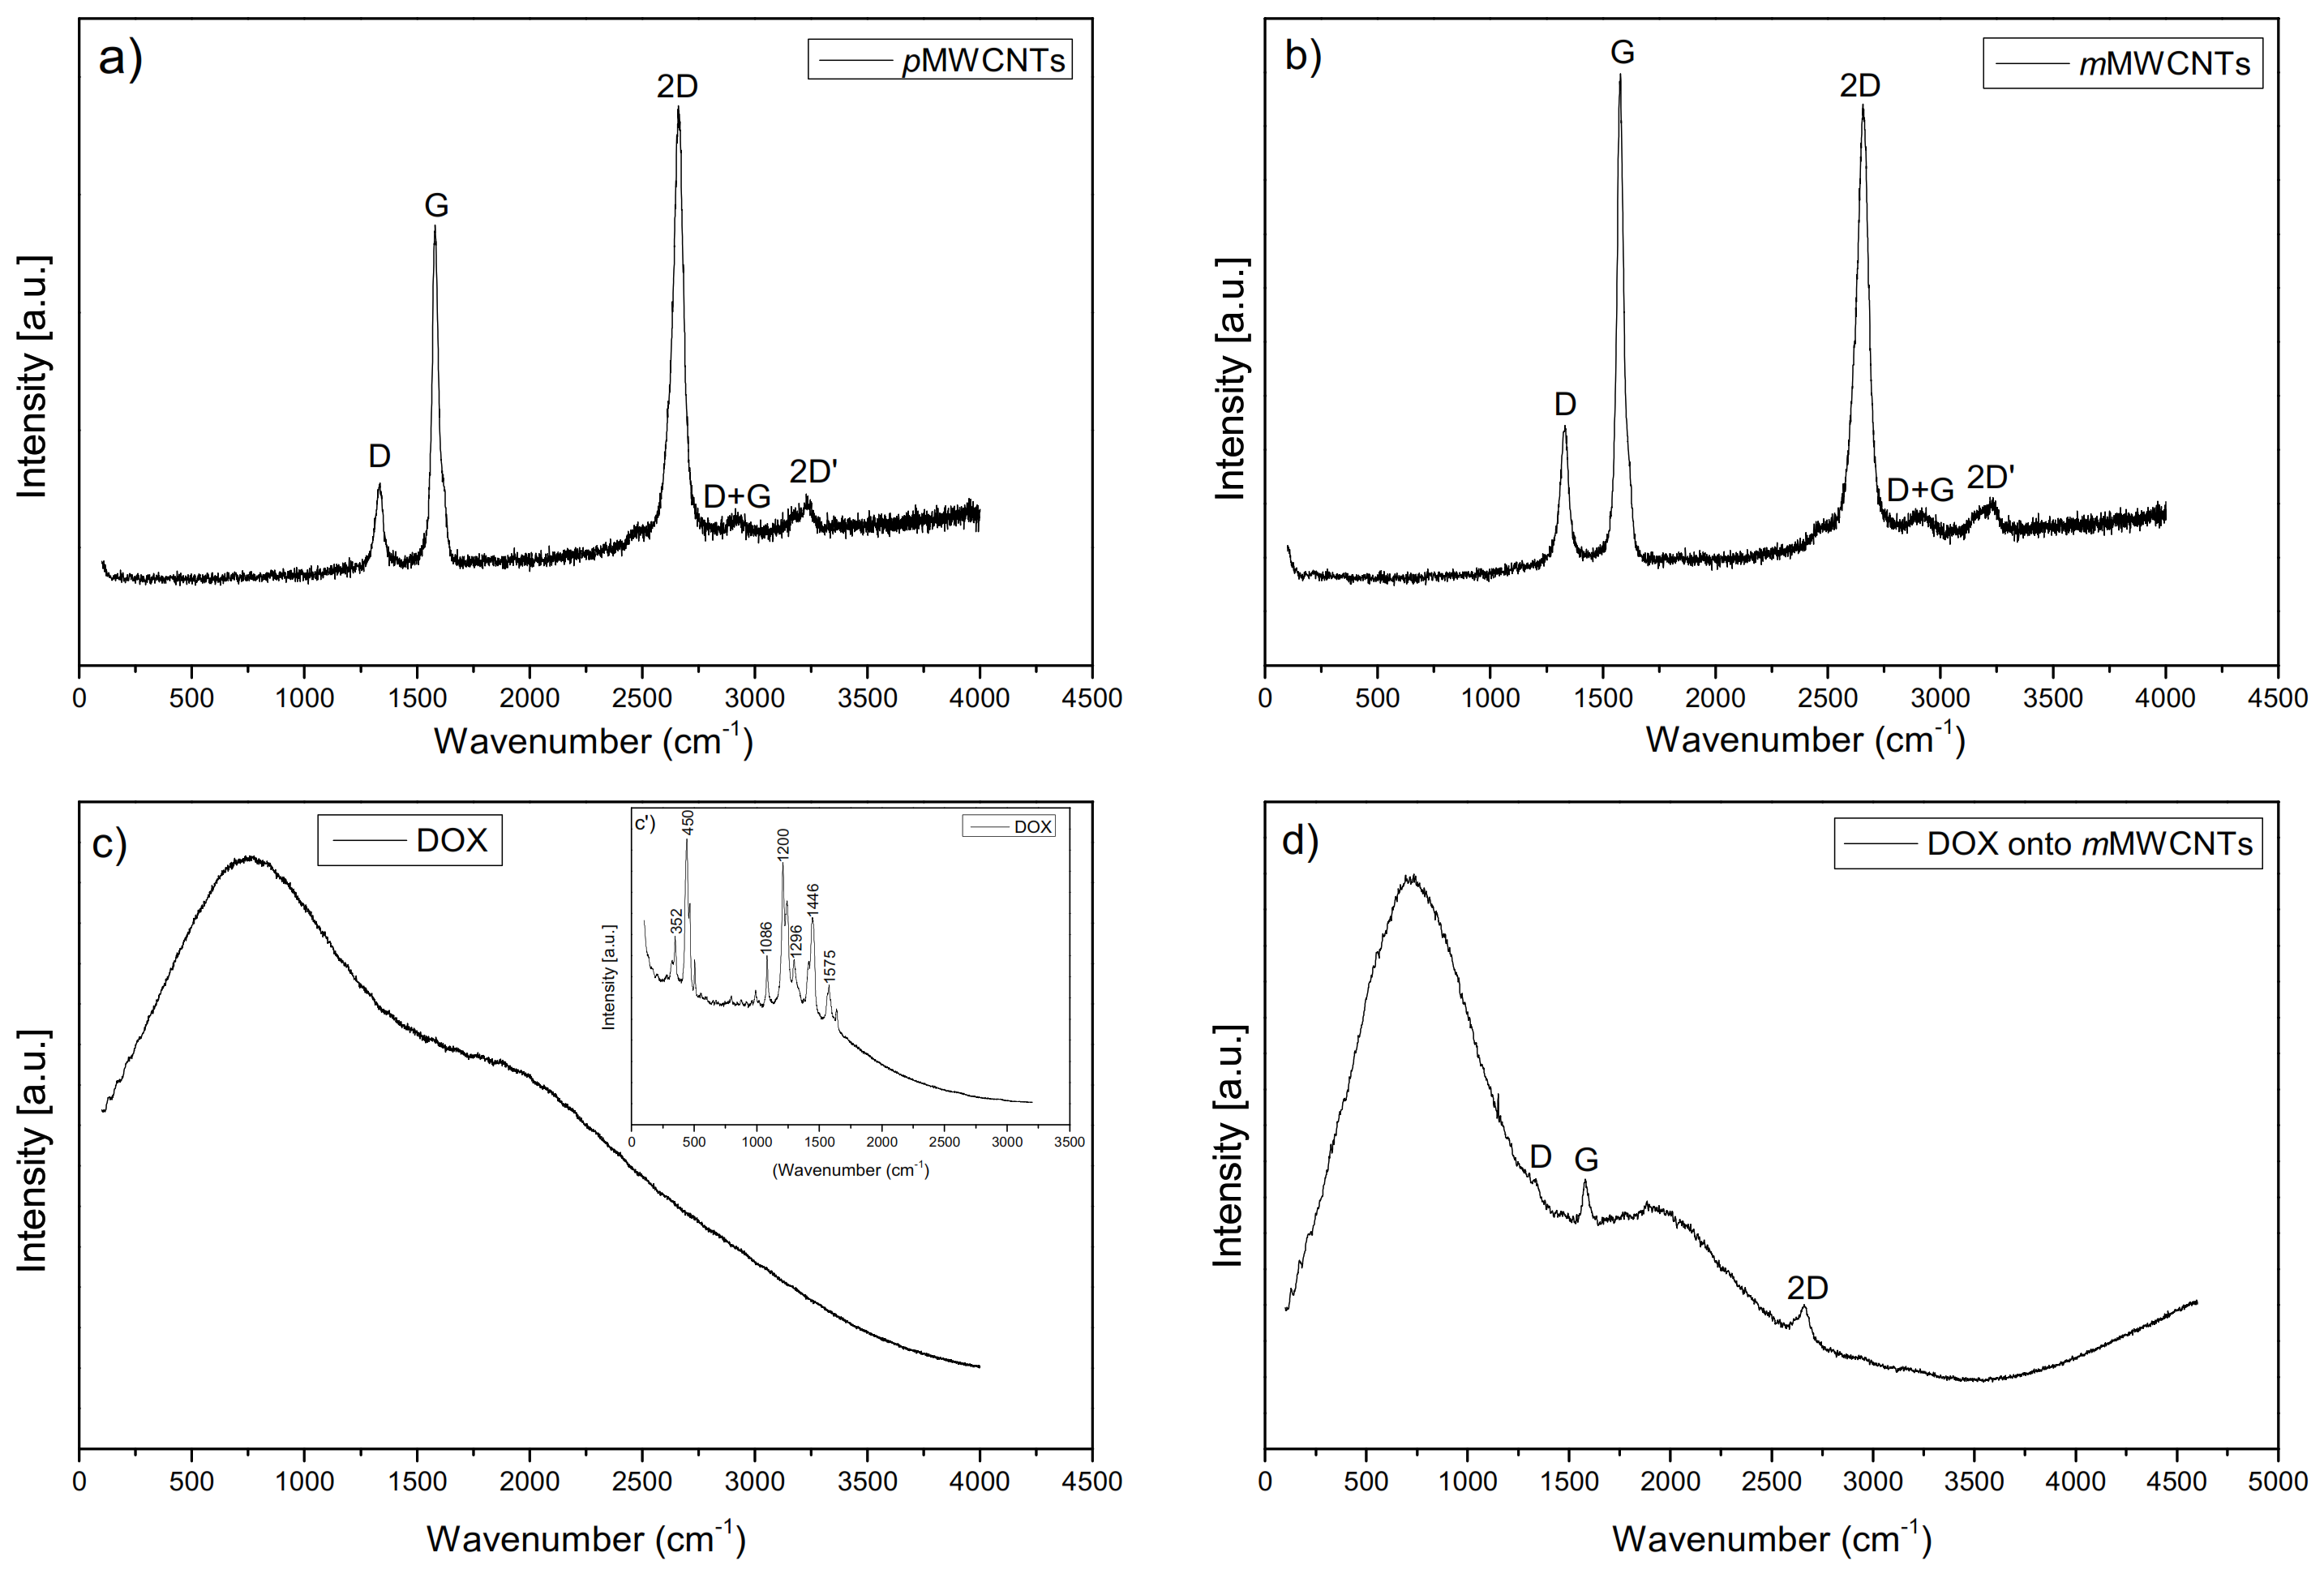
2.2. Raman Spectroscopy
2.3. Microscopic Techniques
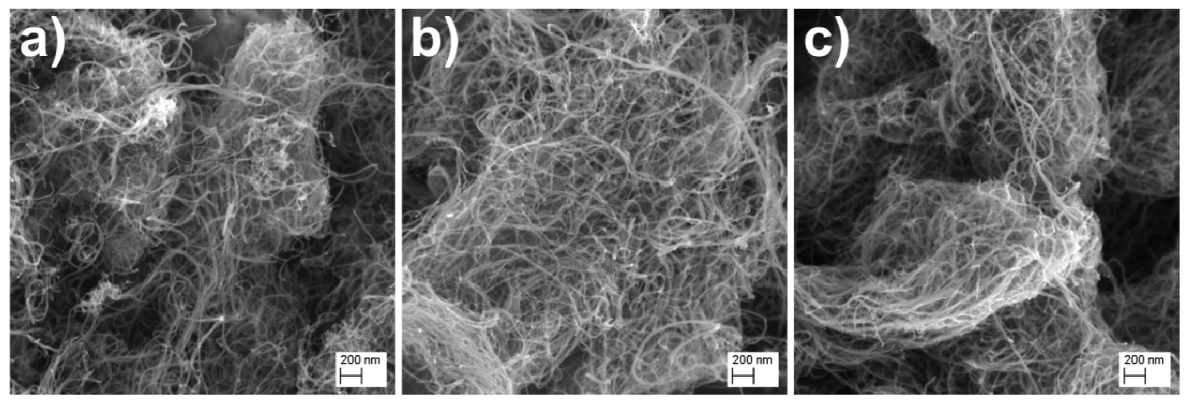
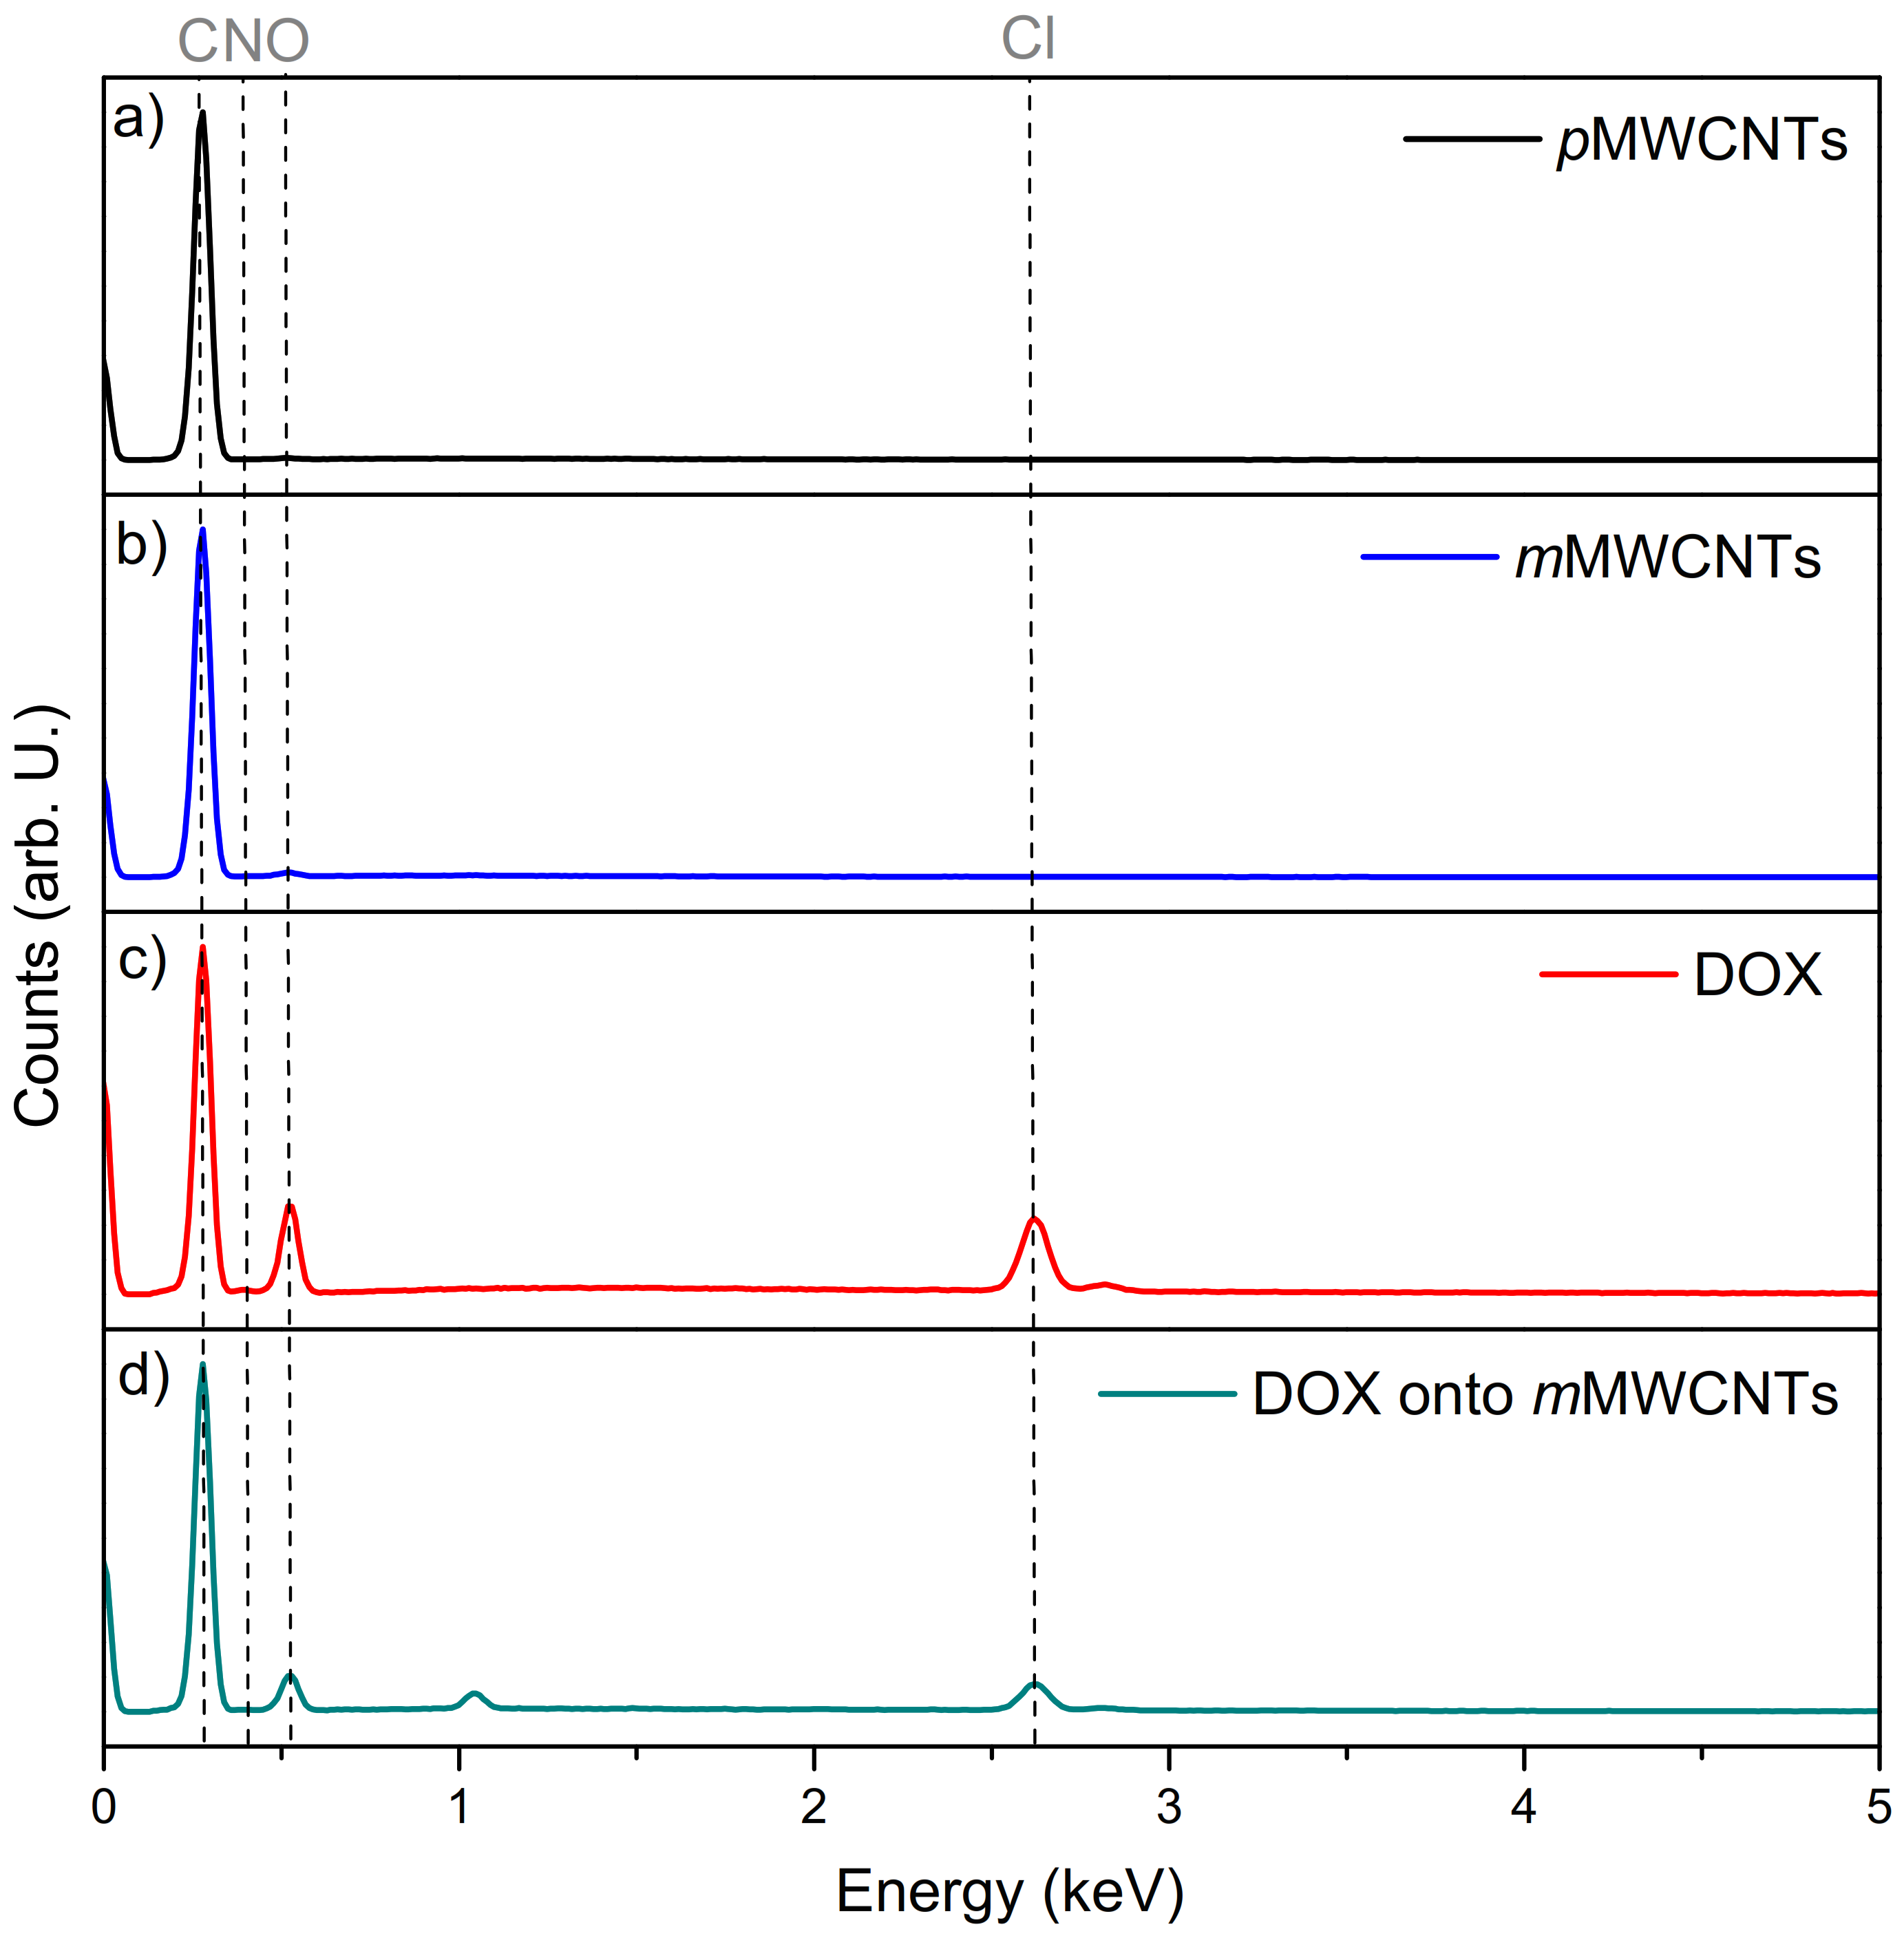
2.3.1. SEM Analysis
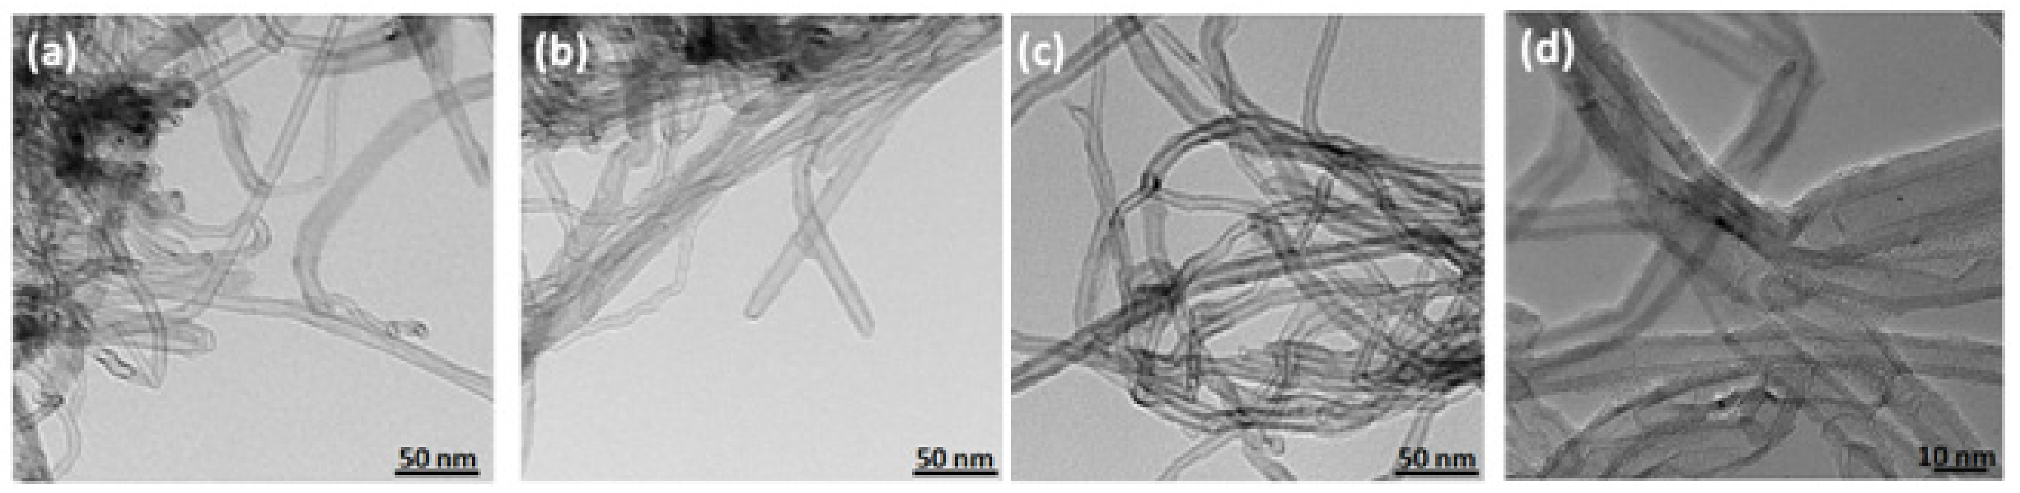
2.3.2. TEM Analysis
2.4. UV-VIS Spectroscopy
Mechanism of the Drug Release
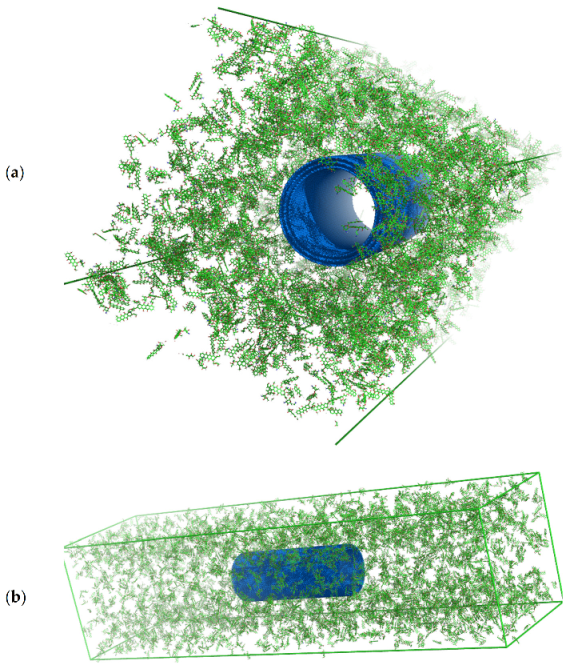
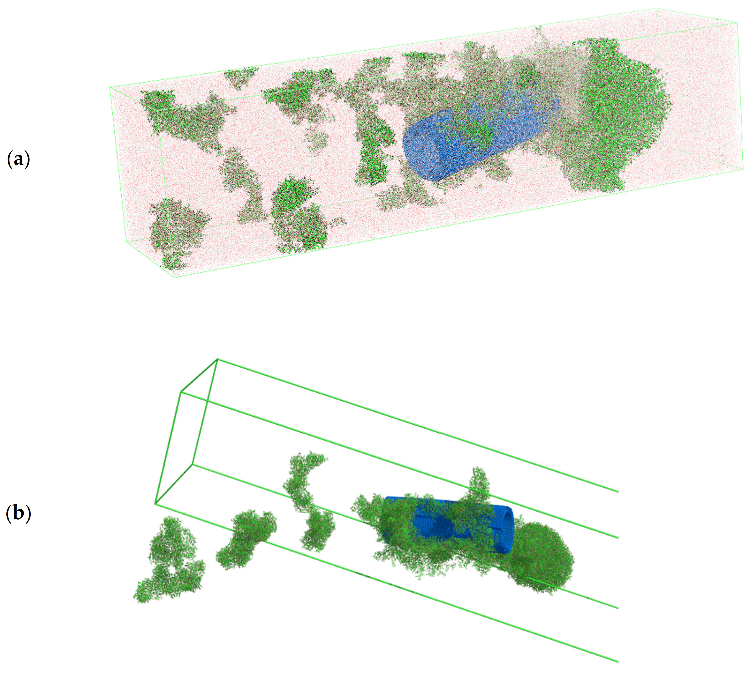
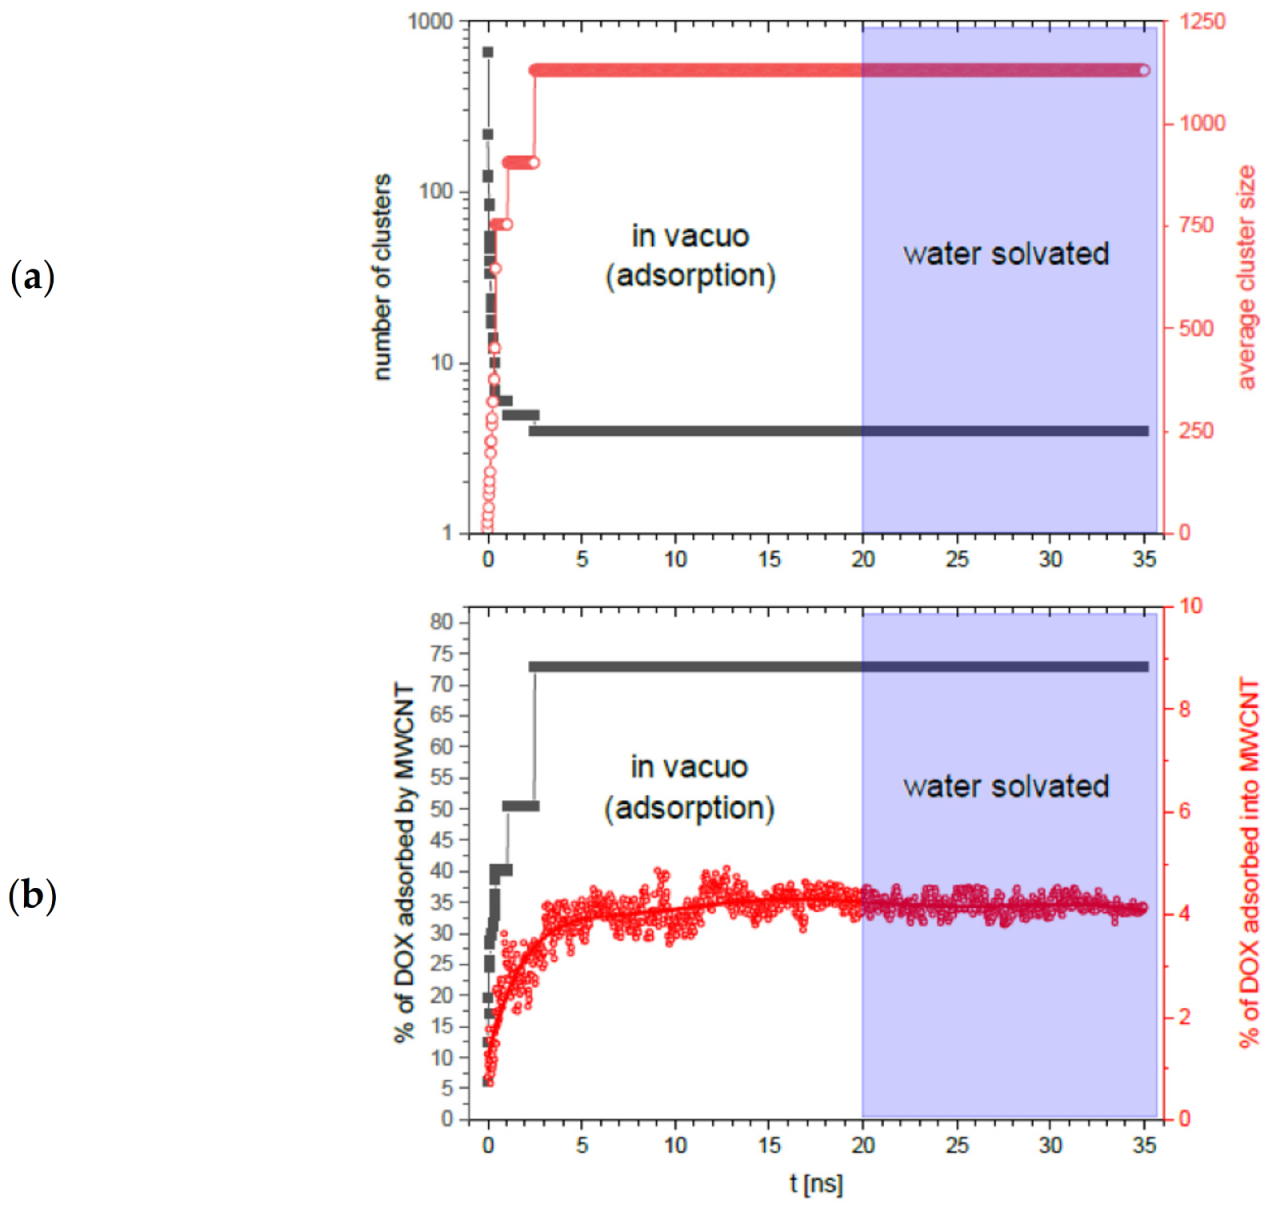
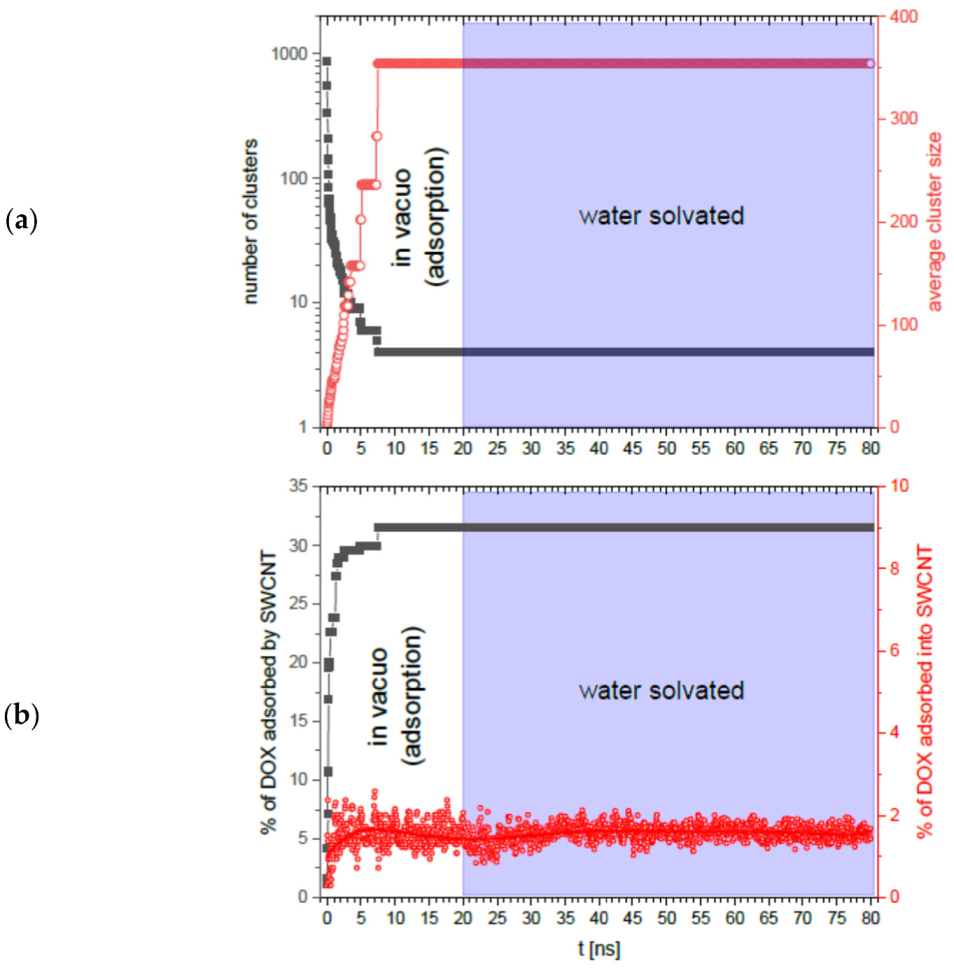
2.5. Molecular Dynamics Simulations
3. Materials and Methods
3.1. Materials
Modification of Multi-Walled Carbon Nanotubes
3.2. Methods
3.2.1. FTIR
3.2.2. Raman Spectroscopy
3.2.3. Microscopic Methods
3.2.4. UV-VIS
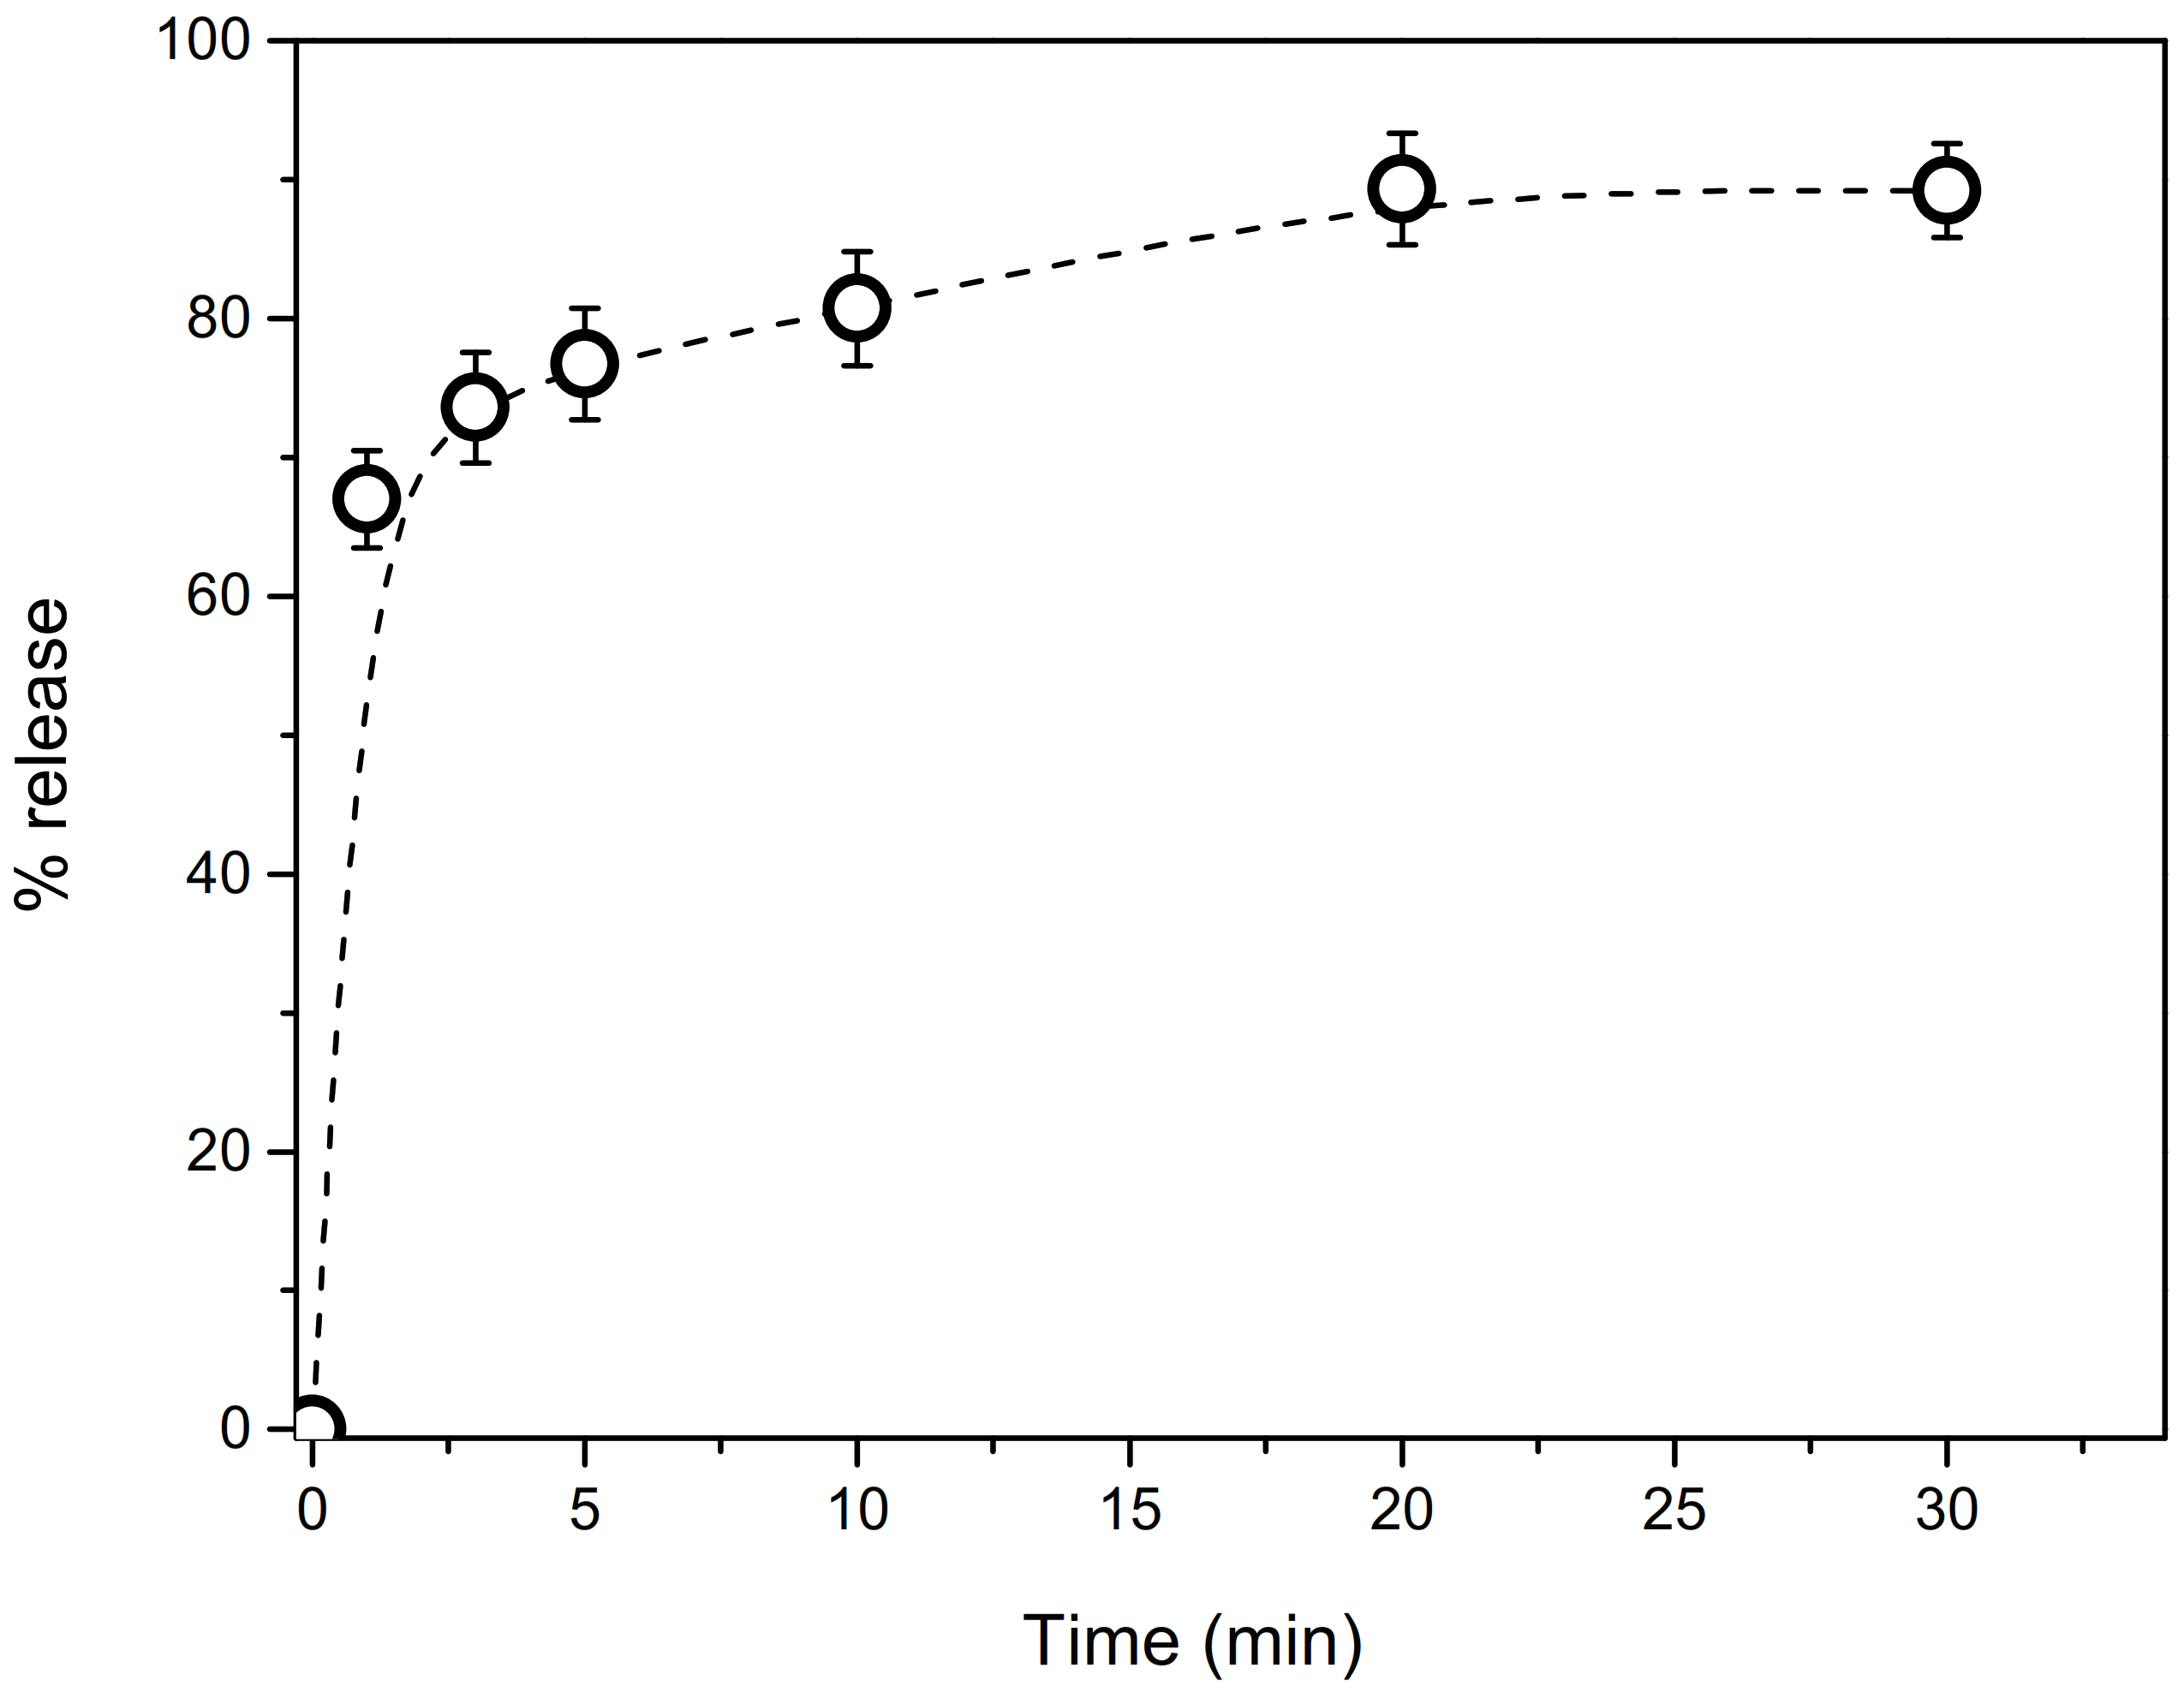
The Release Process of DOX from mMWCNTs
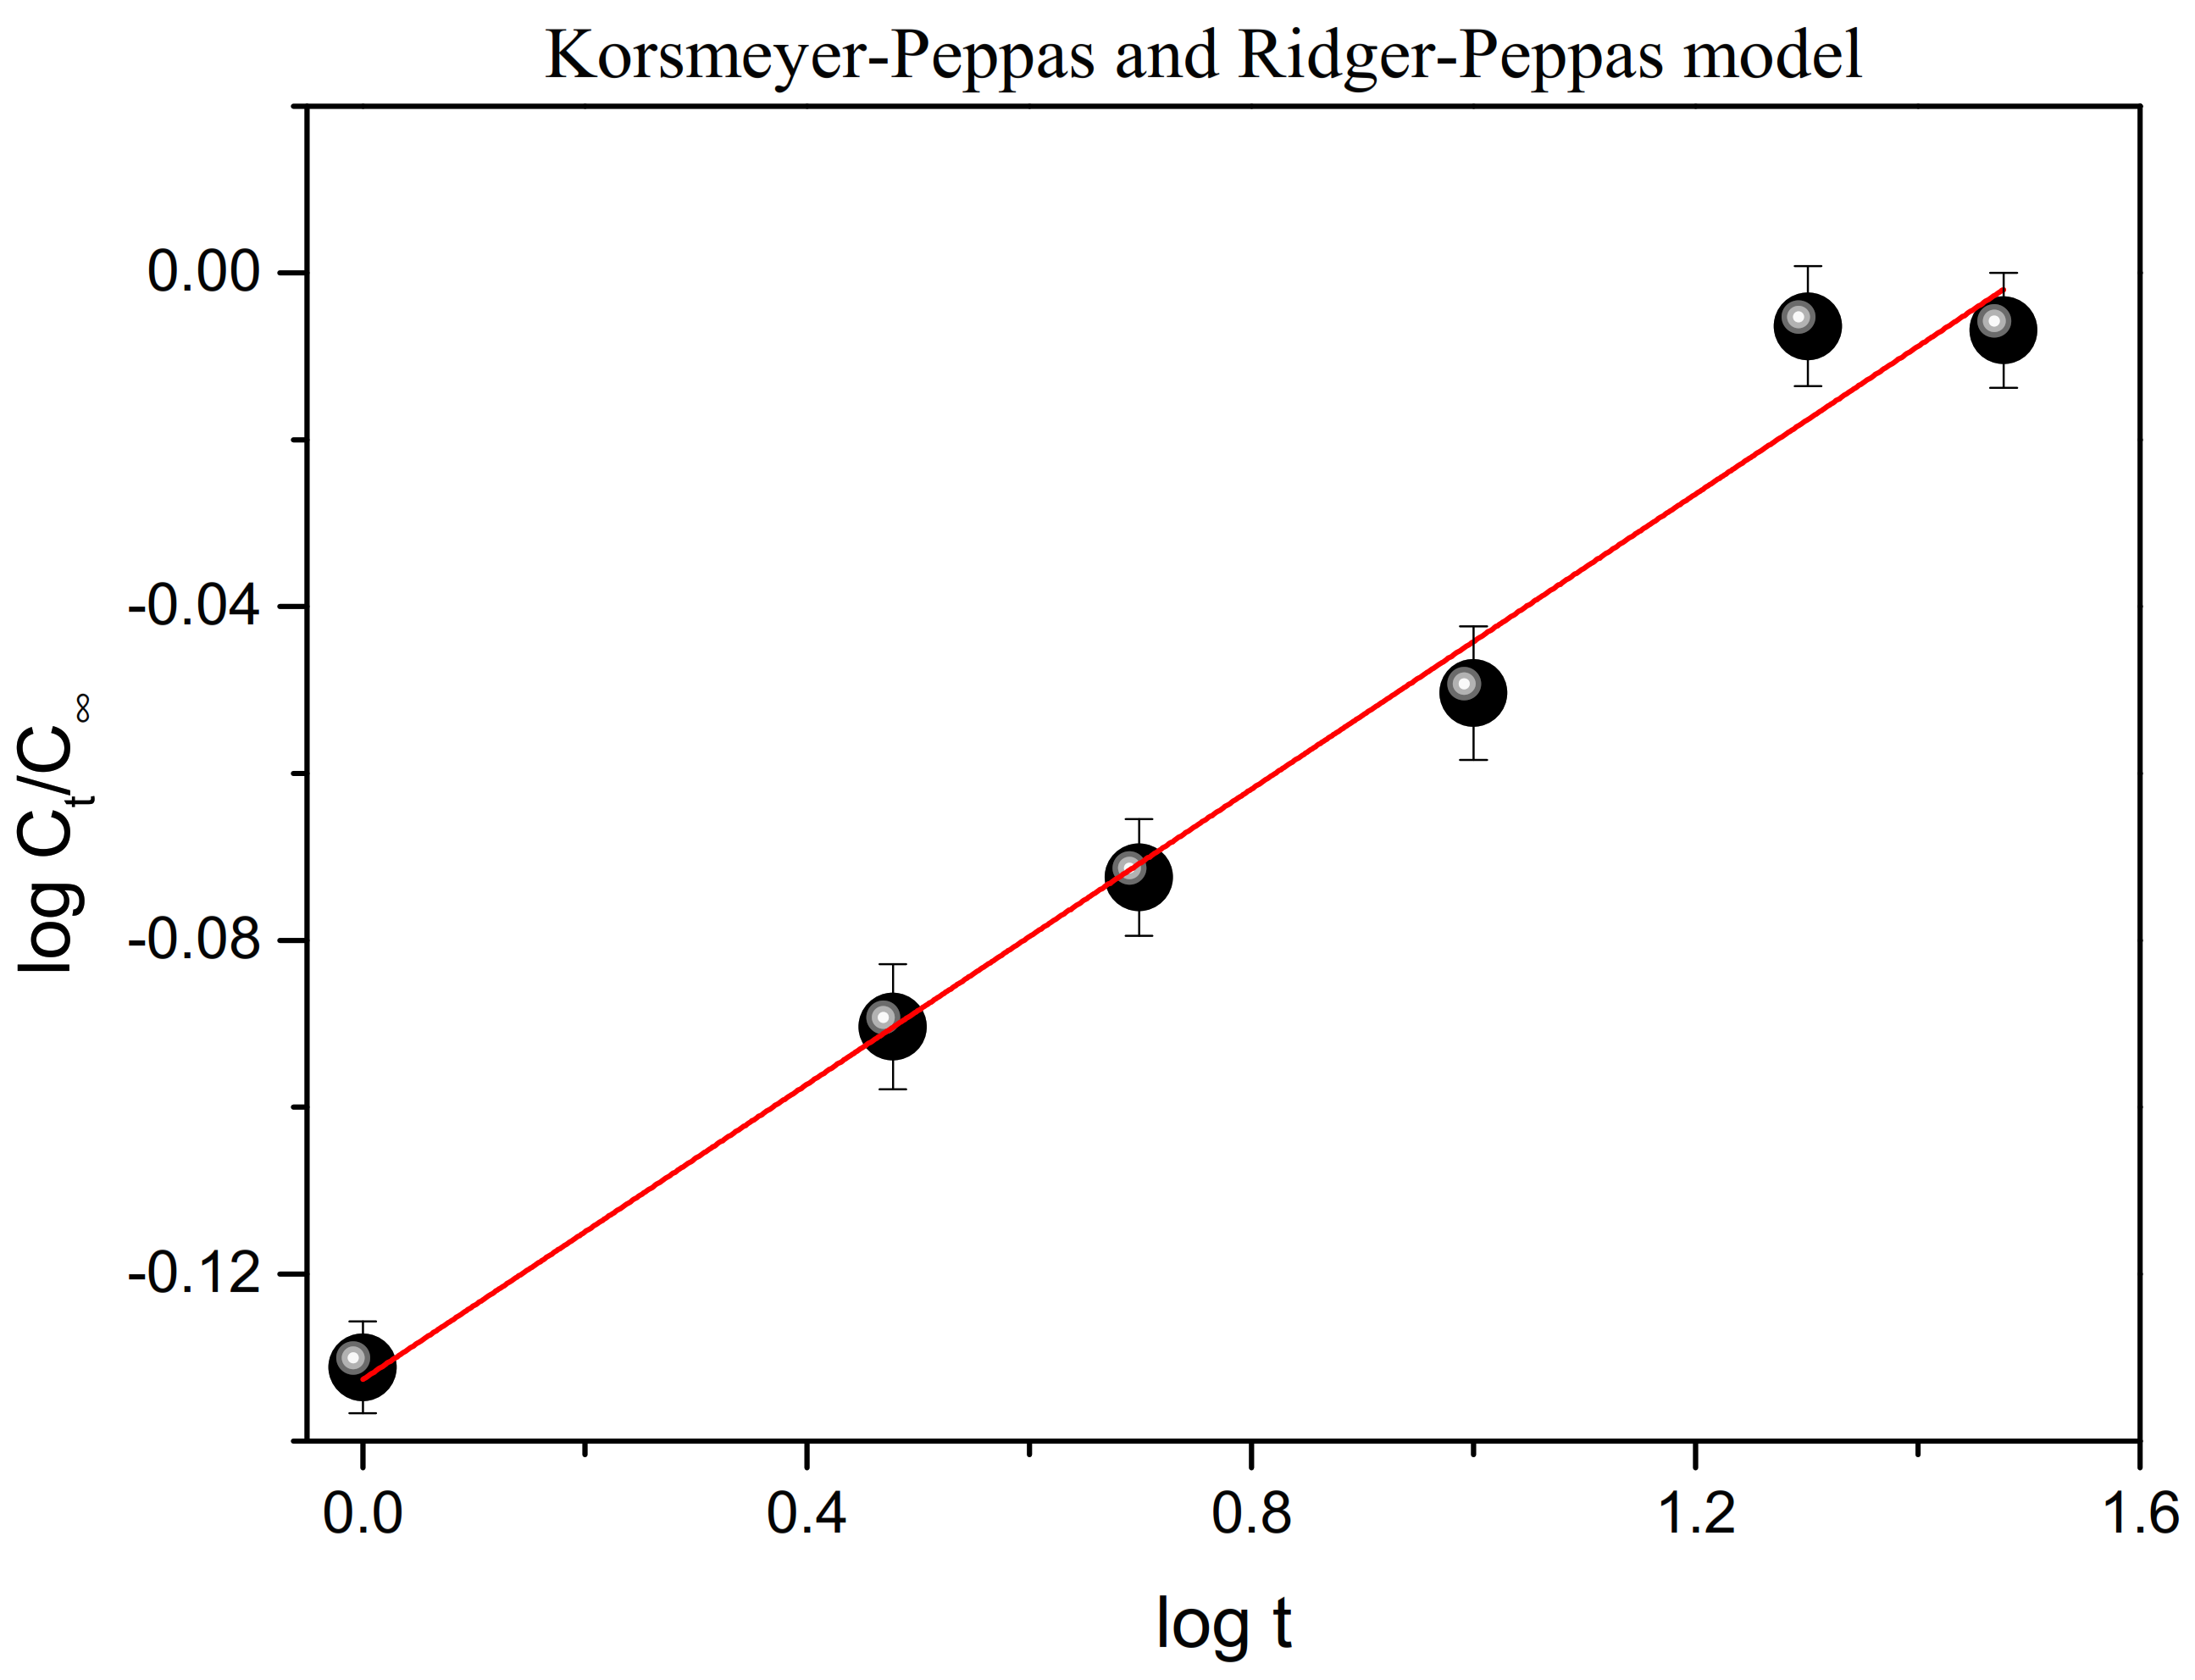
Determination of Release Kinetics of Doxorubicin in Liquid Medium
Molecular Dynamics Simulations
4. Conclusions
Author Contributions
Funding
Acknowledgments
Conflicts of Interest
References
- Li, X.; Liu, X.; Huang, J.; Fan, Y.; Cui, F.-Z. Biomedical investigation of CNT based coatings. Surf. Coat. Technol. 2011, 206, 759–766. [Google Scholar] [CrossRef]
- Liu, Z.; Tabakman, S.; Welsher, K.; Dai, H. Carbon nanotubes in biology and medicine: In vitro and in vivo detection, imaging and drug delivery. Nano Res. 2009, 2, 85–120. [Google Scholar] [CrossRef] [PubMed] [Green Version]
- Prato, M.; Kostarelos, K.; Bianco, A. Functionalized Carbon Nanotubes in Drug Design and Discovery. Acc. Chem. Res. 2008, 41, 60–68. [Google Scholar] [CrossRef] [PubMed]
- Campidelli, S.; Klumpp, C.; Bianco, A.; Guldi, D.M.; Prato, M. Functionalization of CNT: Synthesis and applications in photovoltaics and biology. J. Phys. Org. Chem. 2006, 19, 531–539. [Google Scholar] [CrossRef]
- Foldvari, M.; Bagonluri, M. Carbon nanotubes as functional excipients for nanomedicines: II. Drug delivery and biocompatibility issues. Nanomed. Nanotechnol. Biol. Med. 2008, 4, 183–200. [Google Scholar] [CrossRef]
- Schipper, M.L.; Nakayama-Ratchford, N.; Davis, C.R.; Kam, N.W.S.; Chu, P.; Liu, Z.; Sun, X.; Dai, H.; Gambhir, S.S. A pilot toxicology study of single-walled carbon nanotubes in a small sample of mice. Nat. Nanotechnol. 2008, 3, 216–221. [Google Scholar] [CrossRef]
- Izadyar, A.S.; Farhadian, N.; Chenarani, N. Molecular dynamics simulation of doxorubicin adsorption on a bundle of functionalized CNT. J. Biomol. Struct. Dyn. 2015, 34, 1797–1805. [Google Scholar] [CrossRef]
- Matyszewska, D.; Napora, E.; Żelechowska, K.; Biernat, J.F.; Bilewicz, R. Synthesis, characterization, and interactions of single-walled carbon nanotubes modified with doxorubicin with Langmuir–Blodgett biomimetic membranes. J. Nanopart. Res. 2018, 20, 143. [Google Scholar] [CrossRef] [Green Version]
- Zhanga, X.; Meng, L.; Luab, Q.; Feic, Z.; Dyson, P. Targeted delivery and controlled release of doxorubicin to cancer cells using modified single wall carbon nanotubes. Biomaterials 2009, 30, 6041–6047. [Google Scholar] [CrossRef]
- Wang, Y.; Yang, S.-T.; Wang, Y.; Liu, Y.; Wang, H. Adsorption and desorption of doxorubicin on oxidized carbon nanotubes. Colloids Surf. B Biointerfaces 2012, 97, 62–69. [Google Scholar] [CrossRef]
- Farahani, B.V.; Behbahani, G.R.; Javadi, N. Functionalized Multi Walled Carbon Nanotubes as a Carrier for Doxorubicin: Drug Adsorption Study and Statistical Optimization of Drug Loading by Factorial Design Methodology. J. Braz. Chem. Soc. 2015, 27, 694–705. [Google Scholar] [CrossRef]
- Chen, K.; Cai, H.; Zhang, H.; Zhu, H.; Gu, Z.; Gong, Q.; Luo, K. Stimuli-responsive polymer-doxorubicin conjugate: Antitumor mechanism and potential as nano-prodrug. Acta Biomater. 2019, 84, 339–355. [Google Scholar] [CrossRef]
- Abdullah, C.S.; Ray, P.; Alam, S.; Kale, N.; Aishwarya, R.; Morshed, M.; Dutta, D.; Hudziak, C.; Banerjee, S.K.; Mallik, S.; et al. Chemical Architecture of Block Copolymers Differentially Abrogate Cardiotoxicity and Maintain the Anticancer Efficacy of Doxorubicin. Mol. Pharm. 2020, 17, 4676–4690. [Google Scholar] [CrossRef]
- Maleki, R.; Afrouzi, H.H.; Hosseini, M.; Toghraie, D.; Piranfar, A.; Rostami, S. pH-sensitive load-ing/releasing of doxorubicin using single-walled carbon nanotube and multi-walled carbon nanotube: A molecular dynamics study. Comput. Methods Programs Biomed. 2020, 186, 105210. [Google Scholar] [CrossRef]
- Meng, L.; Zhang, X.; Lu, Q.; Fei, Z.; Dyson, P. Single walled carbon nanotubes as drug delivery vehicles: Targeting doxorubicin to tumors. Biomaterials 2012, 33, 1689–1698. [Google Scholar] [CrossRef]
- Lu, Y.-J.; Wei, K.-C.; Ma, C.-C.M.; Yang, S.-Y.; Chen, J.-P. Dual targeted delivery of doxorubicin to cancer cells using folate-conjugated magnetic multi-walled carbon nanotubes. Colloids Surf. B Biointerfaces 2012, 89, 1–9. [Google Scholar] [CrossRef]
- Pistone, A.; Iannazzo, D.; Ansari, S.; Milone, C.; Salamò, M.; Galvagno, S.; Cirmi, S.; Navarra, M. Tunable doxorubicin release from polymer-gated multiwalled carbon nanotubes. Int. J. Pharm. 2016, 515, 30–36. [Google Scholar] [CrossRef]
- Wen, S.; Liu, H.; Cai, H.; Shen, M.; Shi, X. Targeted and pH-Responsive Delivery of Doxorubicin to Cancer Cells Using Multifunctional Dendrimer-Modified Multi-Walled Carbon Nanotubes. Adv. Health Mater. 2013, 2, 1267–1276. [Google Scholar] [CrossRef]
- Mo, Y.; Wang, H.; Liu, J.; Lan, Y.; Guo, R.; Zhang, Y.; Xue, W.; Zhang, Y. Controlled release and targeted delivery to cancer cells of doxorubicin from polysaccharide-functionalised single-walled carbon nanotubes. J. Mater. Chem. B 2015, 3, 1846–1855. [Google Scholar] [CrossRef]
- Xu, H.; Fang, G.; Gou, J.; Wang, S.; Yao, Q.; Zhang, Y.; Tang, X.; Zhao, Y. Lyophilization of Self-Assembled Polymeric Nanoparticles Without Compromising Their Microstructure and Their In Vivo Evaluation: Pharmacokinetics, Tissue Distribution and Toxicity. J. Biomater. Tissue Eng. 2015, 5, 919–929. [Google Scholar] [CrossRef]
- Zdrojek, M.; Gebicki, W.; Jastrzebski, C.; Melin, T.; Huczko, A. Studies of Multiwall Carbon Nanotubes Using Raman Spectroscopy and Atomic Force Microscopy. Solid State Phenom. 2004, 99–100, 265–268. [Google Scholar] [CrossRef]
- Kaniyoor, A.; Ramaprabhu, S. A Raman spectroscopic investigation of graphite oxide derived graphene. AIP Adv. 2012, 2, 32183. [Google Scholar] [CrossRef] [Green Version]
- Muzyka, R.; Drewniak, S.; Pustelny, T.; Chrubasik, M.; Gryglewicz, G. Characterization of Graphite Oxide and Reduced Graphene Oxide Obtained from Different Graphite Precursors and Oxidized by Different Methods Using Raman Spectroscopy. Materials 2018, 11, 1050. [Google Scholar] [CrossRef] [Green Version]
- Kawashima, Y.; Katagiri, G. Fundamentals, overtones, and combinations in the Raman spectrum of graphite. Phys. Rev. B 1995, 52, 10053–10059. [Google Scholar] [CrossRef]
- Vecera, P.; Eigler, S.; Koleśnik-Gray, M.; Krstić, V.; Vierck, A.; Maultzsch, J.; Schäfer, R.A.; Hauke, F.; Hirsch, A. Degree of functionalisation dependence of individual Raman intensities in covalent graphene derivatives. Sci. Rep. 2017, 7, 45165. [Google Scholar] [CrossRef]
- Farhane, Z.; Bonnier, F.; Casey, A.; Byrne, H.J. Raman micro spectroscopy for in vitro drug screening: Subcellular localisation and interactions of doxorubicin. Analys 2015, 140, 4212–4223. [Google Scholar] [CrossRef] [Green Version]
- Eliasson, C.; Lorén, A.; Murty, K.; Josefson, M.; Käll, M.; Abrahamsson, J. Multivariate evaluation of doxorubicin surface-enhanced Raman spectra. Spectrochim. Acta Part A Mol. Biomol. Spectrosc. 2001, 57, 1907–1915. [Google Scholar] [CrossRef]
- Chudoba, D.; Łudzik, K.; Jażdżewska, M.; Wołoszczuk, S. Kinetic and Equilibrium Studies of Doxorubicin Adsorption onto Carbon Nanotubes. Int. J. Mol. Sci. 2020, 21, 8230. [Google Scholar] [CrossRef]
- Rezaian, M.; Maleki, R.; Dahroud, M.D.; Alamdari, A.; Alimohammadi, M. pH-Sensitive Co-Adsorption/Release of Doxorubicin and Paclitaxel by Carbon Nanotube, Fullerene, and Graphene Oxide in Combination with N-isopropylacrylamide: A Molecular Dynamics Study. Biomolecules 2018, 8, 127. [Google Scholar] [CrossRef] [Green Version]
- Farazi, R.; Vaezi, M.; Molaei, M.; Saeidifar, M.; Behnam-Ghader, A. Effect of pH and temperature on doxorubicin hydrochloride release from magnetite/graphene oxide nanocomposites. Mater. Today Proc. 2018, 5, 15726–15732. [Google Scholar] [CrossRef]
- Ahnfelt, E.; Sjögren, E.; Hansson, P.; Lennernäs, H. Release Mechanisms of Doxorubicin from a Clinical Bead Drug-Delivery System. J. Pharm. Sci. 2016, 105, 3387–3398. [Google Scholar] [CrossRef] [PubMed] [Green Version]
- Yang, X.; Wang, Y.; Huang, X.; Ma, Y.; Huang, Y.; Yang, R.; Duan, H.; Chen, Y. Multi-functionalized graphene oxide based anticancer drug-carrier with dual-targeting function and pH-sensitivity. J. Mater. Chem. 2011, 21, 3448–3454. [Google Scholar] [CrossRef]
- Wangm, G.; Ma, Y.; Zhang, L.; Mu, J.; Zhang, Z.; Zhang, X.; Che, H.; Bai, Y.; Hou, J. Facile synthesis of manganese ferrite/graphene oxide nanocomposites for controlled targeted drug delivery. J. Magn. Magn. Mater. 2016, 401, 647–650. [Google Scholar] [CrossRef]
- Heister, E.; Neves, V.; Lamprecht, C.; Silva, S.R.P.; Coley, H.M.; McFadden, J. Drug loading, dispersion stability, and therapeutic efficacy in targeted drug delivery with carbon nanotubes. Carbon 2012, 50, 622–632. [Google Scholar] [CrossRef] [Green Version]
- Pennetta, C.; Floresta, G.; Graziano, A.C.E.; Cardile, V.; Rubino, L.; Galimberti, M.; Rescifina, A.; Barbera, V. Functionalization of Single and Multi-Walled Carbon Nanotubes with Polypropylene Glycol Decorated Pyrrole for the Development of Doxorubicin Nano-Conveyors for Cancer Drug Delivery. Nanomaterials 2020, 10, 1073. [Google Scholar] [CrossRef]
- Zhu, W.; Huang, H.; Dong, Y.; Han, C.; Sui, X.; Jian, B. Multi-walled carbon nanotube-based systems for improving the controlled release of insoluble drug dipyridamole. Exp. Ther. Med. 2019, 17, 4610–4616. [Google Scholar] [CrossRef] [Green Version]
- Bruschi Marcos, L. Strategies to Modify the Drug Release from Pharmaceutical Systems; Elsevier: Cambridge, UK; Woodhead Publishing: Cambridge, UK, 2015. [Google Scholar]
- Wojcik-Pastuszka, D.; Krzak, J.; Macikowski, B.; Berkowski, R.; Osiński, B.; Musiał, W. Evaluation of the Release Kinetics of a Pharmacologically Active Substance from Model Intra-Articular Implants Replacing the Cruciate Ligaments of the Knee. Materials 2019, 12, 1202. [Google Scholar] [CrossRef] [Green Version]
- Siepmann, J.; Peppas, N.A. Higuchi equation: Derivation, applications, use and misuse. Int. J. Pharm. 2011, 418, 6–12. [Google Scholar] [CrossRef]
- Hixson, A.W.; Crowell, J.H. Dependence of Reaction Velocity upon surface and Agitation. Ind. Eng. Chem. 1931, 23, 923–931. [Google Scholar] [CrossRef]
- Weilbull, W. A statistical distribution function of wide applicability. J. Appl. Mech. 1951, 18, 293–297. [Google Scholar] [CrossRef]
- Korsmeyer, R.W.; Gurny, R.; Doelker, E.; Buri, P.; Peppas, N.A. Mechanisms of solute release from porous hydrophilic polymers. Int. J. Pharm. 1983, 15, 25–35. [Google Scholar] [CrossRef]
- Ritger, P.L.; Peppas, N.A. A simple equation for description of solute release I. Fickian and non-fickian release from non-swellable devices in the form of slabs, spheres, cylinders or discs. J. Control. Release 1987, 5, 23–36. [Google Scholar] [CrossRef]
- Papadopoulou, V.; Kosmidis, K.; Vlachou, M.; Macheras, P. On the use of the Weibull function for the discernment of drug release mechanisms. Int. J. Pharm. 2006, 309, 44–50. [Google Scholar] [CrossRef]
- Soares, P.I.P.; Sousa, A.I.; Silva, J.C.; Ferreira, I.M.M.; Novo, C.M.M.; Borges, J.P. Chitosan-based nanoparticles as drug delivery systems for doxorubicin: Optimization and modelling. Carbohydr. Polym. 2016, 147, 304–312. [Google Scholar] [CrossRef]
- Fallahi-Samberan, M.; Salami-Kalajahi, M.; Dehghani, E.; Abbasi, F. Investigation of different core-shell toward Janus morphologies by variation of surfactant and feeding composition: A study on the kinetics of DOX release. Colloids Surf. B Biointerfaces 2018, 170, 578–587. [Google Scholar] [CrossRef]
- Fallahi-Samberan, M.; Salami-Kalajahi, M.; Dehghani, E.; Abbasi, F. Investigating Janus morphology development of poly(acrylic acid)/poly(2-(dimethylamino)ethyl methacrylate) composite particles: An experimental study and mathematical modeling of DOX release. Microchem. J. 2019, 145, 492–500. [Google Scholar] [CrossRef]
- Abasian, P.; Radmansouri, M.; Jouybari, M.H.; Ghasemi, M.V.; Mohammadi, A.; Irani, M.; Jazi, F.S. Incorporation of magnetic NaX zeolite/DOX into the PLA/chitosan nanofibers for sustained release of doxorubicin against carcinoma cells death in vitro. Int. J. Biol. Macromol. 2019, 121, 398–406. [Google Scholar] [CrossRef]
- Badea, N.; Craciun, M.M.; Dragomir, A.S.; Balas, M.; Dinischiotu, A.; Nistor, C.; Gavan, C.; Ionita, D. Systems based on carbon nanotubes with potential in cancer therapy. Mater. Chem. Phys. 2020, 241, 22435. [Google Scholar] [CrossRef]
- Azqhandi, M.H.A.; Farahani, B.V.; Dehghani, N. Encapsulation of methotrexate and cyclophosphamide in interpolymer complexes formed between poly acrylic acid and poly ethylene glycol on multi-walled carbon nanotubes as drug delivery systems. Mater. Sci. Eng. C 2017, 79, 841–847. [Google Scholar] [CrossRef]
- Peng, X.; Zhuang, Q.; Peng, D.; Dong, Q.; Tan, L.; Jiao, F.; Liu, L.; Liu, J.; Zhao, C.; Wang, X. Sustained Release of Naproxen in a New Kind Delivery System of Carbon Nanotubes Hydrogel. Iran. J. Pharm. Res. 2013, 12, 581–586. [Google Scholar]
- Berendsen, H.J.C.; Van Der Spoel, D.; Van Drunen, R. GROMACS: A message-passing parallel molecular dynamics implementation. Comput. Phys. Commun. 1995, 91, 43–56. [Google Scholar] [CrossRef]
- Jorgensen, W.L.; Maxwell, D.S.; Tirado-Rives, J. Development and Testing of the OPLS All-Atom Force Field on Conformational Energetics and Properties of Organic Liquids. J. Am. Chem. Soc. 1996, 118, 11225–11236. [Google Scholar] [CrossRef]
- Jorgensen, W.L.; Tirado-Rives, J. The OPLS [optimized potentials for liquid simulations] potential functions for proteins, energy minimizations for crystals of cyclic peptides and crambin. J. Am. Chem. Soc. 1988, 110, 1657–1666. [Google Scholar] [CrossRef]
- Hess, B.; Bekker, H.; Berendsen, H.; Fraaije, J. LINCS: A linear constraint solver for molecular simulations. J. Comput. Chem. 1997, 18, 1463–1472. [Google Scholar] [CrossRef]
- Minoia, A. YASC. Available online: http://chembytes.wikidot.com/buildcstruct (accessed on 7 October 2021).


| Acetic Buffer Volume (mL) | % Release |
|---|---|
| 10 | 73.8 |
| 20 | 79.8 |
| 50 | 88.2 |
| 100 | 86.9 |
| Kinetic Model | Parameters | Values |
|---|---|---|
| The zero-order | K0/g mg−1 min−1 | 0.0829 |
| R2 | 0.223 | |
| The first-order | K1/min−1 | 0.0552 |
| R2 | 0.660 | |
| The second-order | K2/mL μg−1 min−1 | 0.0015 |
| R2 | 0.892 | |
| Higuchi | KH/mg mL−1 min−1/2 | 34.9 |
| R2 | 0.840 | |
| Hixson-Crowell | KH-C/μg1/3 mL−1/3 min−1 | 0.0630 |
| R2 | 0.546 | |
| Weibull | B | 0.3612 |
| R2 | 0.877 | |
| Power law | K | 0.7379 |
| n | 0.088 | |
| R2 | 0.979 |
Publisher’s Note: MDPI stays neutral with regard to jurisdictional claims in published maps and institutional affiliations. |
© 2021 by the authors. Licensee MDPI, Basel, Switzerland. This article is an open access article distributed under the terms and conditions of the Creative Commons Attribution (CC BY) license (https://creativecommons.org/licenses/by/4.0/).
Share and Cite
Chudoba, D.; Jażdżewska, M.; Łudzik, K.; Wołoszczuk, S.; Juszyńska-Gałązka, E.; Kościński, M. Description of Release Process of Doxorubicin from Modified Carbon Nanotubes. Int. J. Mol. Sci. 2021, 22, 12003. https://doi.org/10.3390/ijms222112003
Chudoba D, Jażdżewska M, Łudzik K, Wołoszczuk S, Juszyńska-Gałązka E, Kościński M. Description of Release Process of Doxorubicin from Modified Carbon Nanotubes. International Journal of Molecular Sciences. 2021; 22(21):12003. https://doi.org/10.3390/ijms222112003
Chicago/Turabian StyleChudoba, Dorota, Monika Jażdżewska, Katarzyna Łudzik, Sebastian Wołoszczuk, Ewa Juszyńska-Gałązka, and Mikołaj Kościński. 2021. "Description of Release Process of Doxorubicin from Modified Carbon Nanotubes" International Journal of Molecular Sciences 22, no. 21: 12003. https://doi.org/10.3390/ijms222112003