Article

Towards a Cardoon (Cynara cardunculus var. altilis)-Based Biorefinery: A Case Study of Improved Cell Cultures via Genetic Modulation of the Phenylpropanoid Pathway

1
National Research Council—Institute of Agricultural Biology and Biotechnology (CNR-IBBA), Via Edoardo Bassini 15, 20133 Milano, Italy
2
Department of Pharmacy—University of Naples Federico II (UNINA), Via Domenico Montesano 49, 80131 Naples, Italy
3
National Research Council—Institute of Bioscience and Bioresources (CNR-IBBR), Via Università 133, 80055 Portici, Italy
*
Authors to whom correspondence should be addressed.
Int. J. Mol. Sci. 2021, 22(21), 11978; https://doi.org/10.3390/ijms222111978
Submission received: 13 October 2021 / Revised: 2 November 2021 / Accepted: 3 November 2021 / Published: 5 November 2021

Abstract

:
Cultivated cardoon (Cynara cardunculus var. altilis L.) is a promising candidate species for the development of plant cell cultures suitable for large-scale biomass production and recovery of nutraceuticals. We set up a protocol for Agrobacterium tumefaciens-mediated transformation, which can be used for the improvement of cardoon cell cultures in a frame of biorefinery. As high lignin content determines lower saccharification yields for the biomass, we opted for a biotechnological approach, with the purpose of reducing lignin content; we generated transgenic lines overexpressing the Arabidopsis thaliana MYB4 transcription factor, a known repressor of lignin/flavonoid biosynthesis. Here, we report a comprehensive characterization, including metabolic and transcriptomic analyses of AtMYB4 overexpression cardoon lines, in comparison to wild type, underlining favorable traits for their use in biorefinery. Among these, the improved accessibility of the lignocellulosic biomass to degrading enzymes due to depletion of lignin content, the unexpected increased growth rates, and the valuable nutraceutical profiles, in particular for hydroxycinnamic/caffeoylquinic and fatty acids profiles.

1. Introduction

Among the family of Asteraceae, Cynara cardunculus L. (2n = 2x = 34) is a species of perennial herbaceous plants with annual growth cycle; the species consists of three closely related botanical varieties: the wild cardoon (var. sylvestris), the globe artichoke (var. scolymus), and the cultivated cardoon (var. altilis) [1]. Given the full cross-compatibility between these varieties, in addition to phenotypic and genetic evidences, previous studies concluded that both the cultivated cardoon and the globe artichoke were domesticated from wild cardoons [2,3]. Cultivated cardoons are well-adapted to the semi-arid environment of the Mediterranean basin, where they are considered a traditional crop. Cardoons are in fact grown as vegetables in southern Europe and north Africa, and consumed for their whitened fleshy stalks; flowers are harvested and used as vegetable rennet [4].
Over the last 30 years, the potential of cultivated cardoon for biomass production has been increasingly investigated [5,6]. Advantages are represented by its perennial nature, the ability to photosynthesize during winter, and the high yields of lignocellulosic biomass (approximately 5–30 t/ha/year of dry matter, reviewed by [7]) obtained with minimal agricultural inputs. Moreover, cardoon is a highly adaptive species able to tolerate abiotic stresses such as soil salinity [8,9], drought [10], and soil contamination by heavy metals [11,12].
The use of cardoon to produce energy has been thoroughly evaluated [13,14,15,16]; a recent study reported that the total energy (E) obtainable from cardoon biomass was 236 GJ/ha/year, with an increase of E measured over the three cropping years of the experiment, suggesting that the use of this species as an energy-crop might be effective especially in semi-arid areas with low productivity soils [17]. Cardoon stalks have also been considered as a good source of fiber for the production of paper [18].
Cardoon biomass should also be considered for the high content in specialized metabolites (SMs); these molecules are in fact high-value compounds in a biorefinery perspective. Notably, cardoon extracts, especially from leaves, are rich in phenylpropanoids [19]. The most representative extracts are hydroxycinnamic and caffeoylquinic acids (particularly chlorogenic acid, CGA), p-coumaric acid, and several flavonoids (vitexin, luteolin, apigenin, naringin) [20,21,22]; these molecules mainly contribute to the antioxidant properties of the cardoon extracts [23,24].
For example, CGA has been described as a bioactive molecule against obesity, diabetes, cancer, and for its role in cardio and neuro-protection [25]. Moreover, cardoon extracts have potential in the prevention of hepatic and cardiac oxidative stresses [26,27], and they have been studied for their anti-microbial and anti-fungal activities related to the presence of flavonoids [24,28]. Therefore, the recovery of such nutraceuticals would be impactful for their possible downstream uses.
The importance of profiling phenylpropanoids is noteworthy when it comes to lignin. The term lignin refers to a large class of structural phenolic polymers that create complexes with the polysaccharides of cell walls (cellulose, hemicellulose and pectins); the abundance and chemical nature of such complexes contribute to the recalcitrance to the microbial or enzymatic degradative process of lignocellulosic biomass [29]. Therefore, chemical/physical or biological pre-treatments are required to improve the digestibility and availability of the cellulose fraction to enzymatic degradation, and facilitate the recovery of fermentable sugars (saccharification). However, such pre-treatments are expensive and invasive, and they determine a reduction in the sustainability of biomass valorization [30]. Consequently, using plant biomass with reduced and/or easily removable lignin is advantageous, and efforts have been performed to reach this goal through biotechnological approaches [31].
Another interesting feature of cardoon biomass is represented by its oil content (largely derived from seeds); cardoon oils, given their high unsaturated to saturated fatty acids ratio, the high levels of oleic and linoleic acids, and stability to oxidation [22,32], have potential for nutraceutical use, lowering serum cholesterol levels [33], and for biorefinery, e.g. for the production of bioplastics [34]. Indeed, plant oils and fats are among the most important renewable raw materials of the chemical industry, and examples of industrial applications include their use in environmentally friendly fluids and lubricants [35]. More recently, the possibility of functionalizing fatty acids skeletons through organic synthesis and/or microbial reactions gave strong emphasis to the possibility of improving oil production in plants [36]. Consequently, modification of the fatty acid flux, especially in favor of high monounsaturated fatty acids (MUFAs) accumulation, represents a major goal for biotechnology oriented towards green chemistry.
Among the drawbacks of cardoon biomass production from field cultivation, there are the variability in yields [37] and in the quality of the lignocellulosic biomass [38]. Field production also affects SMs: most of the cardoon genotypes assessed suffer from strong environmental effects on their phenolic profiles [39], and, in particular, alterations of the phenylpropanoid levels can be traced back to biotic and abiotic stressors [40]. Similarly, differences in the fatty acid profile of oils have been described as a result of genotype, plant tissues, climatic factors, and geographical regions [22,32,41,42]. For these reasons, the development of cardoon cell cultures for biorefinery applications is a promising strategy alternative to field production. Undifferentiated plant cell cultures (PCC) are totipotent, i.e., able to express the full genetic machinery of their species/tissue of origin. Characterization and improvement of PCC is thus an important target of research, to overcome limitations imposed by climatic changes and/or pathogen attacks, and by the genetic segregation of traits of interest that are cancelled with the propagation of selected stable cell lines of clones [43,44]. Moreover, many nutraceuticals are usually accumulated in low concentration in plant organs; the use of PCC and bioreactors, coupled with the possibility of selecting the best lines (and modifying their genome) and with elicitation techniques, improves the economic gains derived from the production, while at the same time reducing the environmental impacts bound to field cultivation [45,46]. Furthermore, PCC are devoid from the risk of containing toxic substances, such as residual pesticides. Altogether, this paves the way to the development of a pipeline of great interest to use PCC in the frame of biorefinery [44,47].
In this study, we tested the potential of improving cardoon PCC for biorefinery. To this end, we developed a method for the stable genetic transformation of cardoon cells via Agrobacterium tumefaciens, with the goal to reduce lignin biosynthesis. Given the challenges to single out an enzyme solely responsible of a complex metabolic flux (as for the phenylpropanoid pathway), the use of transcription factors (TFs) has revealed a successful approach to modify the biosynthesis of SMs [43,44]. As largely investigated, MYB-TFs, among their role in numerous physiological pathways, are responsible for the regulation of the biosynthesis of phenylpropanoids; in this regard, functional characterization approaches in different species indicated that MYBs acting as transcriptional repressors have more extensive effects than the corresponding MYB activators (recently reviewed by [48]).
Hence, we overexpressed in cardoon cell cultures AtMYB4, an R2R3-type TF of the MYB family (subgroup 4), a known transcriptional repressor of lignin biosynthesis in Arabidopsis thaliana. This TF was initially characterized as a repressor of the sinapate ester biosynthesis in response to UV-B [49]. The activity of transcriptional repression of the lignin pathway is highly conserved among MYB4 orthologues in plants [50]: a reduced lignification is in fact obtained from the heterologous expression of the maize (Zea mays) ZmMYB31 and ZmMYB42 genes in Arabidopsis [51,52]; the same phenotype was described in tobacco plants overexpressing the wheat (Triticum aestivum) TaMYB1D and TaMYB4 [53,54], and the switchgrass (Panicum virgatum) PvMYB4 genes [55]. In poplar (Populus trichocarpa), the overexpression of the PtMYB156 gene negatively affects secondary cell wall biosynthesis [56], while the loss-of-function of a rice (Oryza sativa) MYB4 transcription factor (OsMYB108) favors lignification [57]. In addition, MYB4 TFs were also suggested to be repressors of flavonoid biosynthesis [58,59]. Only very recently have the detailed molecular mechanisms of this additive MYB4 function been fully elucidated: MYB4 can repress the transcription of ADT6 gene catalyzing the final step of biosynthesis of phenylalanine (the precursor of flavonoid biosynthesis), and can also attenuate the transcriptional function of the MYB-bHLH-WDR complexes to regulate anthocyanin and proanthocyanidin biosynthesis. It has been hypothesized that AtMYB4 may function as a sensor in the phenylpropanoid pathway regulating the cross-talk between primary (phenylalanine) and secondary metabolism [60]. Moreover, since our investigation is also addressed towards the development of cardoon cell lines to be used for the production of fatty acids, we also investigated the effects of AtMYB4 overexpression on the fatty acid profile of the transgenic lines.
For these reasons, we obtained independent AtMYB4-overexpressing transgenic lines, exploring their potential value in the frame of biorefinery; we therefore analyzed their growth curves, lignin content, and accessibility to degradation of the cellulose fraction, in addition to characterizing their biochemical profile, both for the phenolic and fatty acid profiles.

2. Results

2.1. Development of a Method for the Stable Transformation of Cardoon

In this work, we developed a method for the stable genetic transformation of cardoon leaf-derived cell cultures via A. tumefaciens, overexpressing the coding sequence of the A. thaliana MYB4 transcription factor under the control of the constitutive cauliflower mosaic virus (CaMV35S) promoter. Five distinct transformation experiments were carried out: wild type (WT) calluses obtained from cardoon plants (“Spagnolo” genotype) were co-cultivated with AGL1 or EHA105 A. tumefaciens strains carrying the p35S::AtMYB4 construct. To select transformants, the co-cultivated cardoon cells were spread on the selective solid Gamborg B5 medium containing 10 mg/L phosphinothricin (PPT) and 200 mg/L cefotaxime (CFX), sub-culturing emerging calluses to new medium every 21 days. While at first, we counted 48 independent calluses emerging from the selective plates, only 15 of them survived the second and further sub-culturing rounds. Three months after transformation, all 15 resistant calluses were checked via PCR, and confirmed to be carrying the transgene and devoid of Agrobacterium contamination. All lines were maintained on PPT and CFX-containing media in order to avoid genetic chimerism, and the three AtMYB4oe lines selected to be analyzed for this study are here referred as L1, L24 (from infection with the AGL1 strain), and L18 (from infection with the EHA105 strain). The three lines appeared similar to each other, but different from the WT, with the callus texture softer than WT and thus more easily spreadable when sub-cultured (Figure 1a). RT-qPCR was used to verify the expression of AtMYB4, showing that the different lines expressed the transgene at different levels, with L1 having the lowest and L18 the highest level of expression (Figure 1b).

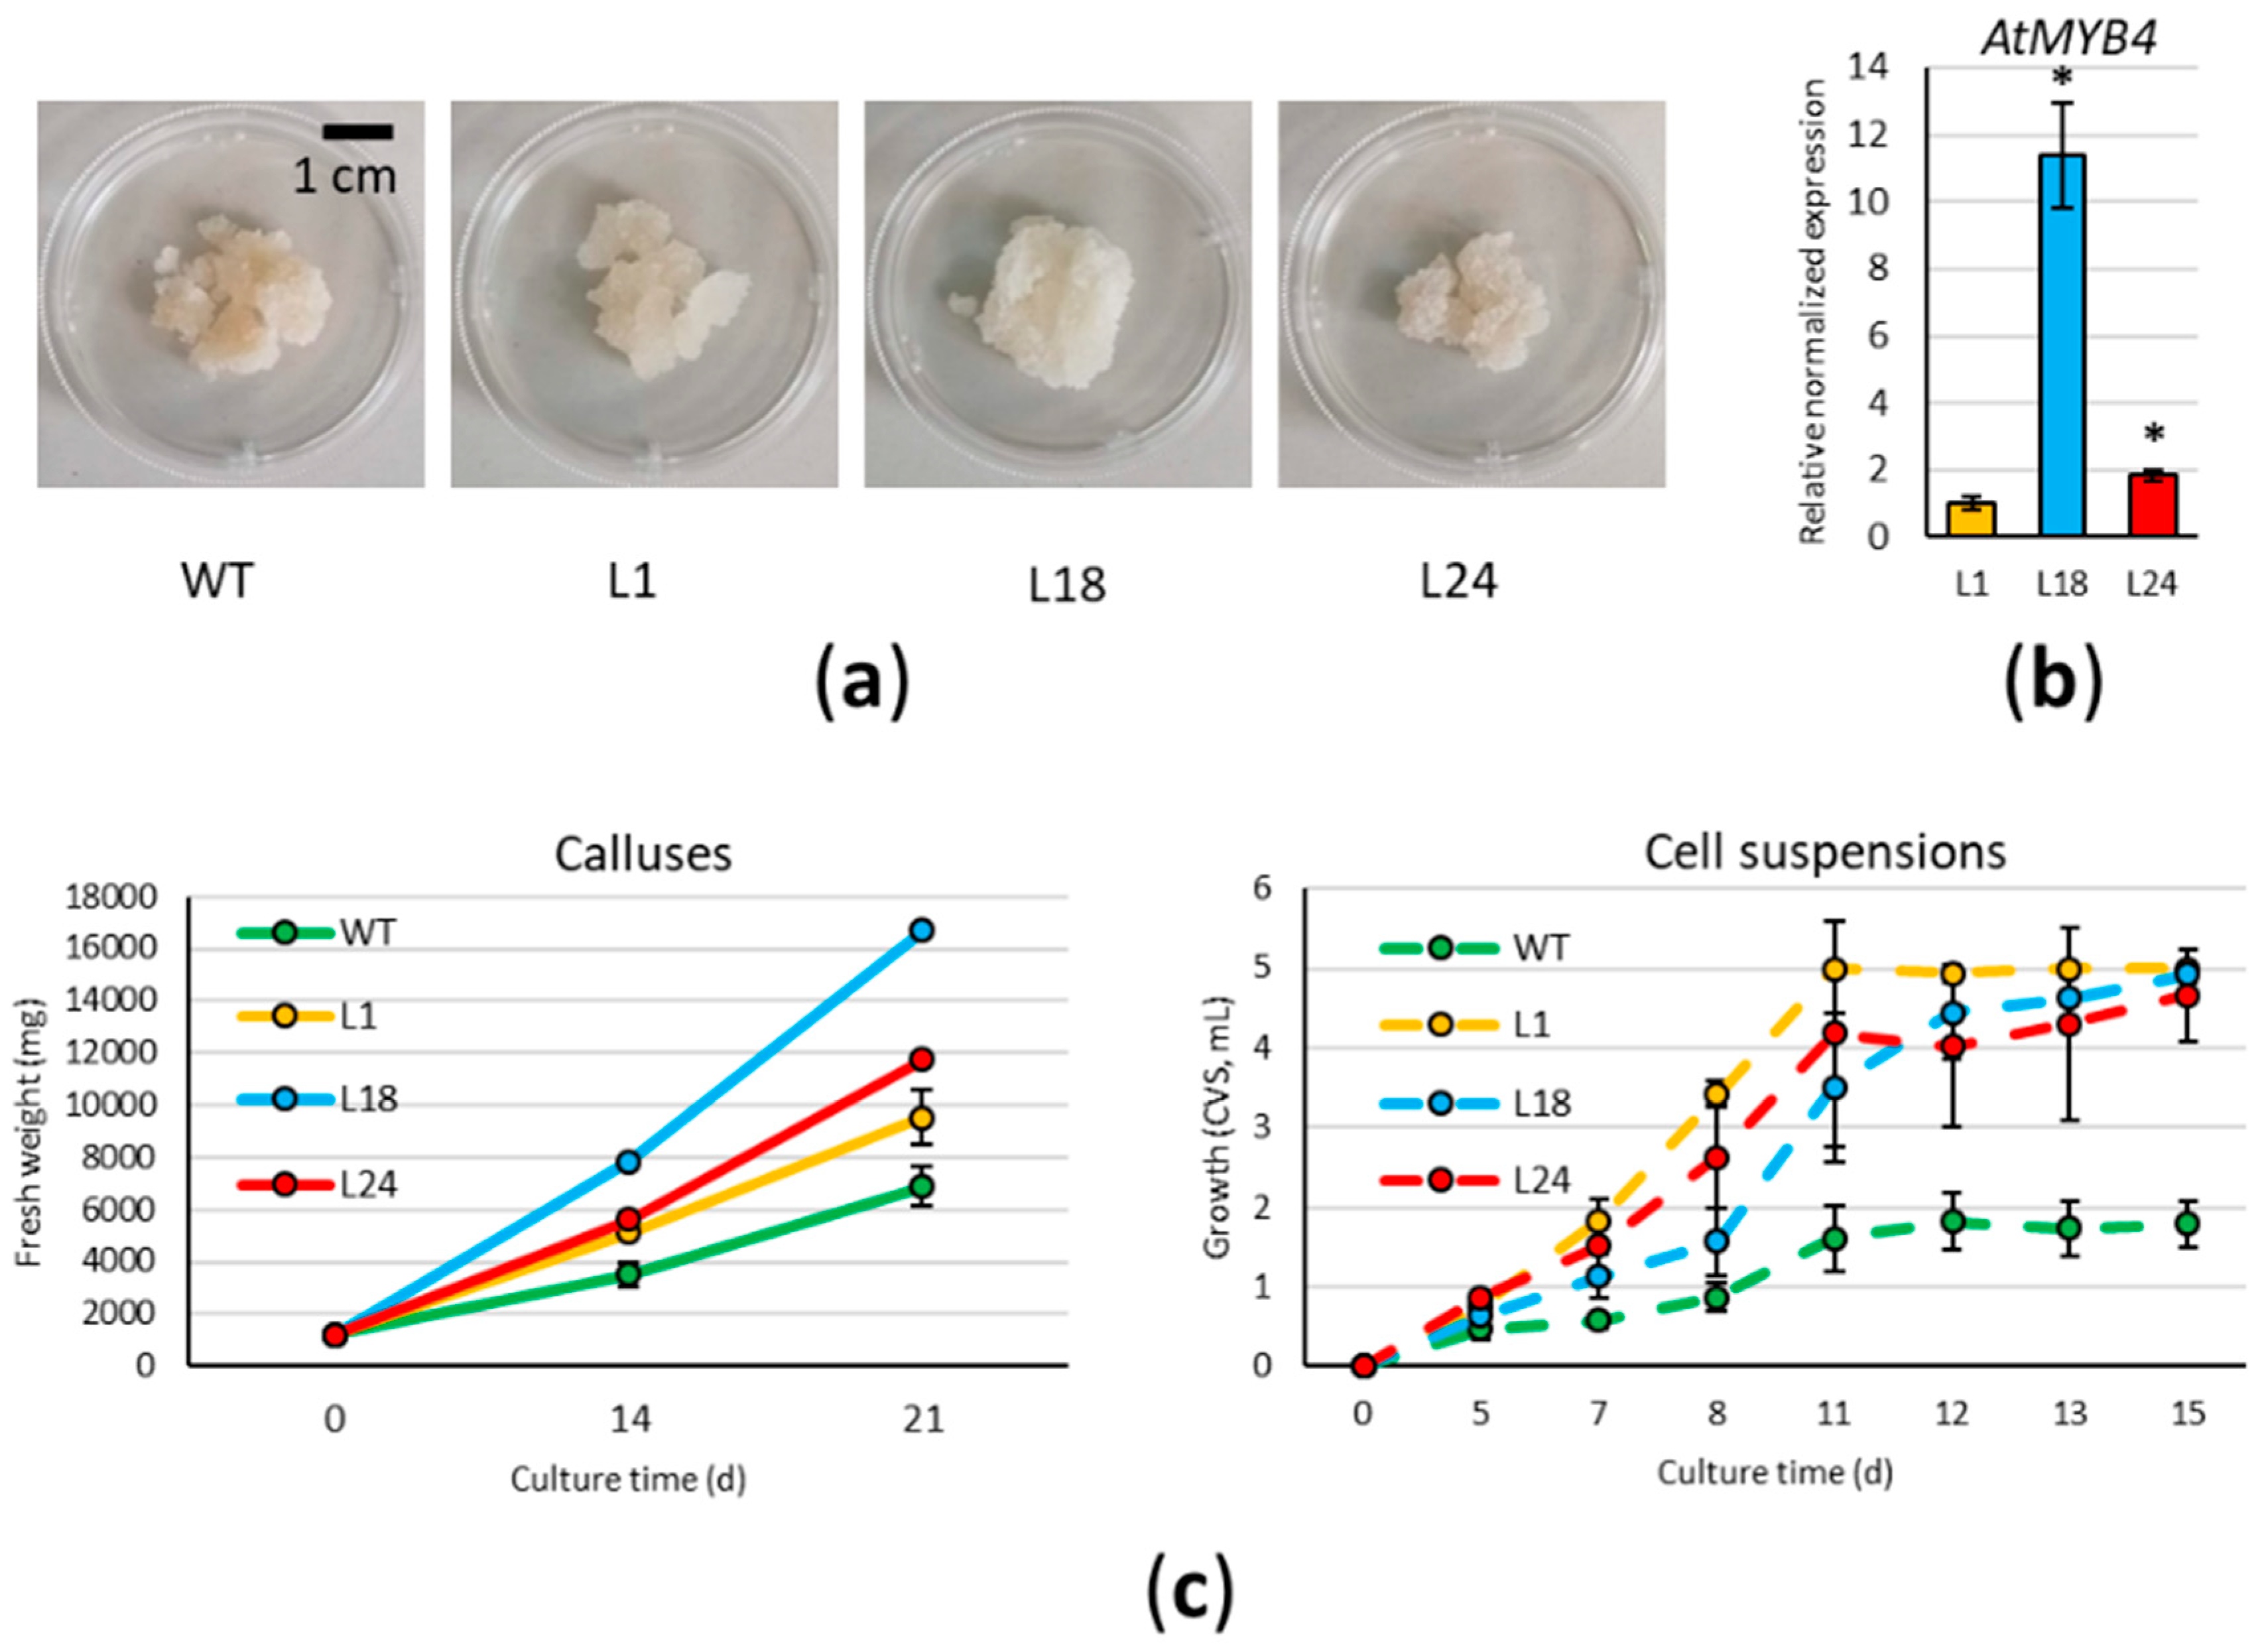
2.2. AtMYB4oe Lines Have Higher Growth Rates Than Wild Type

Growth rates of WT and AtMYB4oe lines were monitored both on solid and liquid media (Figure 1c); for this purpose, the starting material belonged to the XXII round of sub-cultures for WT, and to the XIV for AtMYB4oe lines. Calluses (6 × 200 mg each) were placed on Gamborg B5 solid medium in Petri dishes, and the total cellular mass (fresh weight, FW) was evaluated at 14 and 21 days of the sub-culture. All transgenic lines showed a significant higher growth rate than WT at both time points; in particular, after 14 days, AtMYB4oe biomass was 1.5-fold (L1 and L24) and 2-fold (L18) higher than WT. A similar trend was observed after 21 days in L1 and L24, whereas L18 mass increased 2.4-fold with respect to the WT. The fastest growing lines (L18 and L24) were also characterized by the lowest variation among experimental replicates, granting a more uniform growing behavior compared to WT. Relative differences of FW observed between WT and AtMYB4oe lines were confirmed in the comparison of dry weights (DW), as the percentage of the ratio between DW and FW was nearly identical for all samples (3.6%). Cell suspensions were grown for a maximum of 15 days, and the cell volume after sedimentation (CVS) was used to follow their growth. During the initial lag phase up to the fifth day, we observed a similar growth in all lines, whereas during the exponential phase, from the 5th to the 11th day, all the transgenic lines had a higher growth rate than the WT one (biomass 2–3-fold higher). L18 and L24 showed a slightly lower growth rate than L1 at the end of the exponential phase; nevertheless, on the 15th day, all the transgenic lines reached a biomass 3-fold higher than the WT.
Additionally, as plants of the “Spagnolo” genotype are tolerant to salinity stress [9], we grew WT and transgenic lines, adding 100 mM NaCl to solid medium. WT line showed some degree of tolerance to this condition, whereas AtMYB4oe lines did not grow, and turned quickly to necrosis (Figure S1).

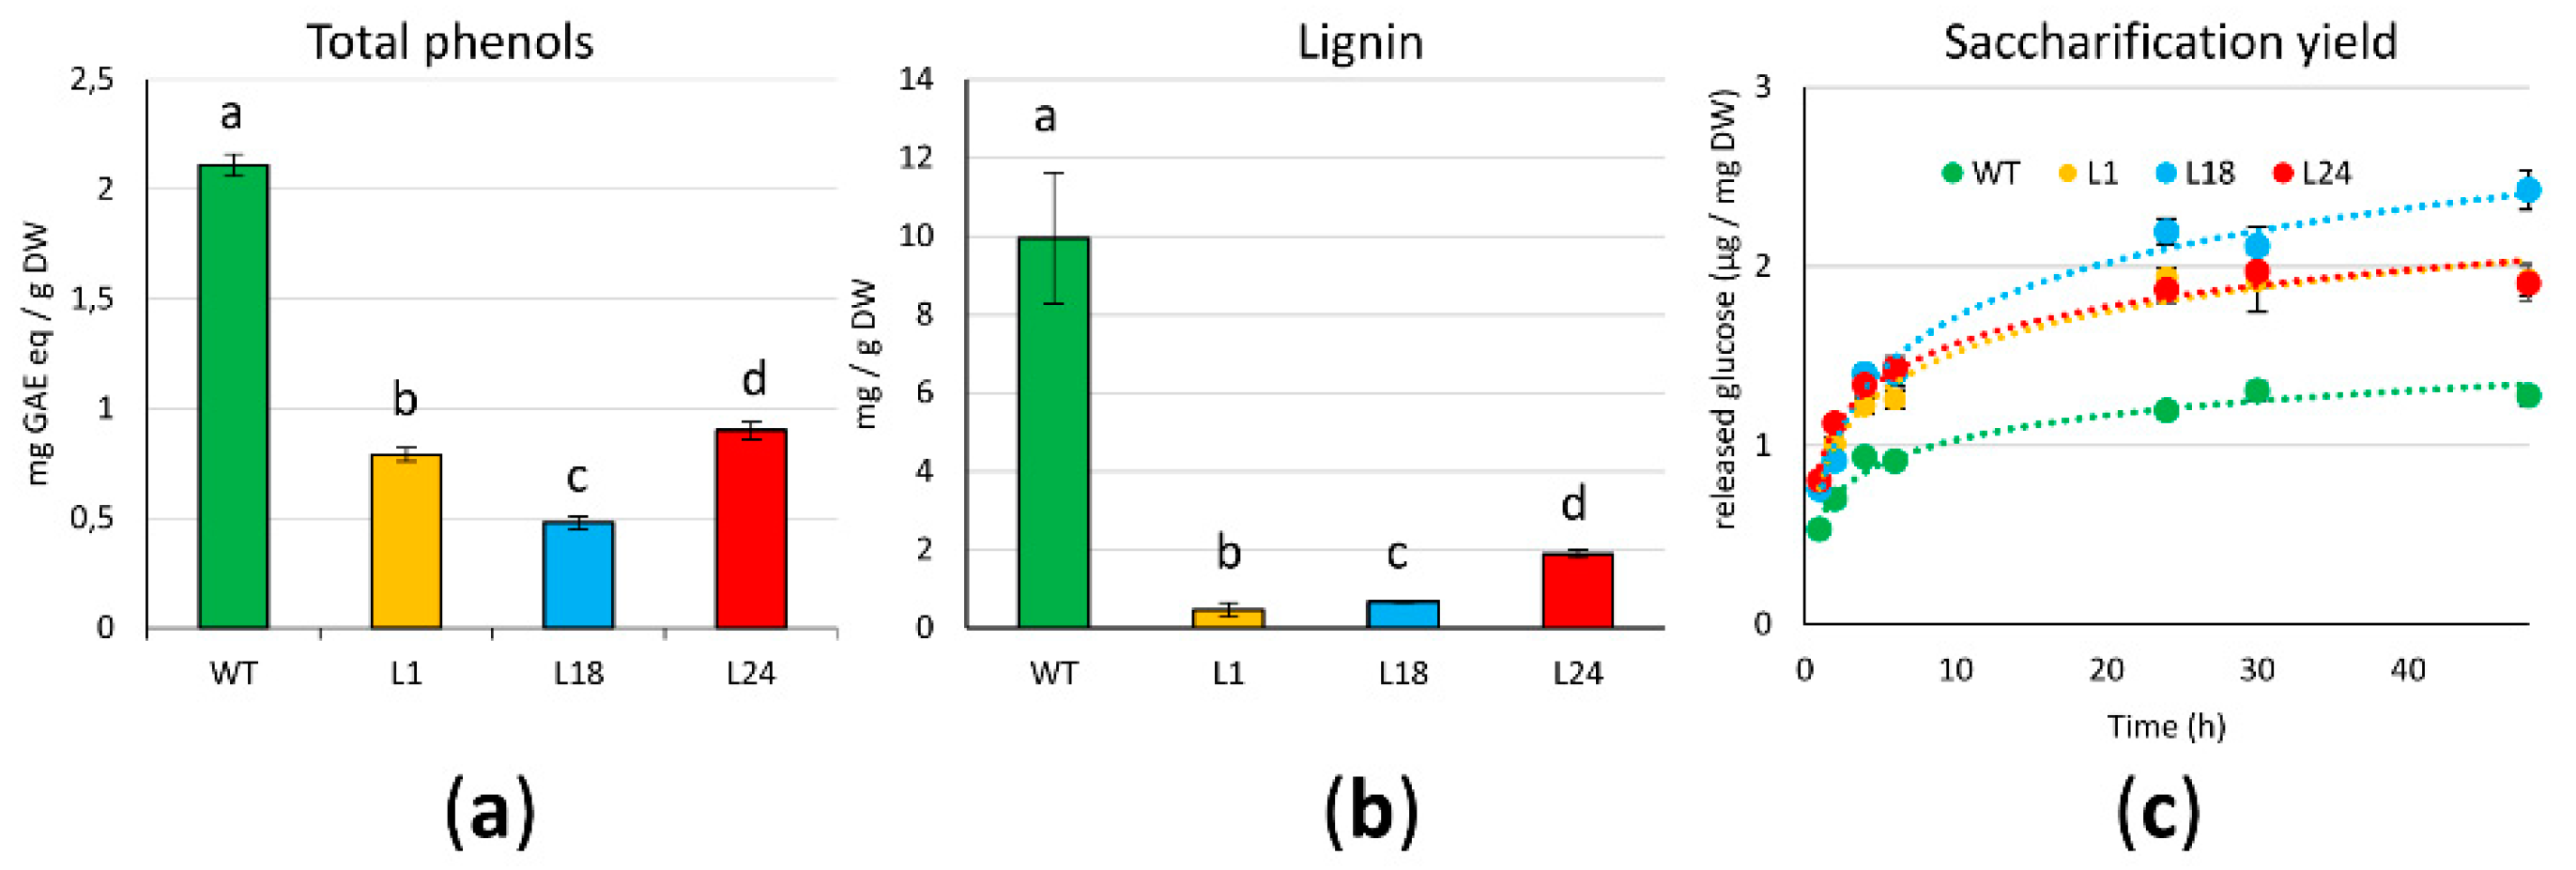
2.3. AtMYB4oe Lines Show Decreased Phenolic Compounds and Lignin Content and Enhanced Enzymatic Saccharification Efficiency

To investigate if the overexpression of AtMYB4 exerted a similar repression on the phenylpropanoid pathway to what was observed in other species, particularly on lignin, and as recently demonstrated also on anthocyanins and proanthocyanidins [60], we measured the amount of phenolic compounds in extracts of 21 days-old freeze-dried calluses (sub-cultures: XXII for WT and XIV for AtMYB4oe lines). Figure 2a shows that all AtMYB4oe lines have significantly less phenolic compounds than WT, with the strongest reduction in L18. As lignin monomers are one of the main products of the phenylpropanoid pathway, we quantified lignin content. As for total phenolic compounds, we reported a significant lignin reduction (close to −90%) for all transgenic lines (Figure 2b).
Next, we wanted to test if the depletion in lignin content of AtMYB4oe lines had an impact on the saccharification yields of the lignocellulosic biomass, measured as the amount of fermentable sugars obtained from the hydrolysis of the cell wall polysaccharides. This provides an estimate of the accessibility of the cell wall to degradative enzymes and, consequently, of the accessibility of biomass to extract useful compounds. To do this, we measured over time the amount of glucose released from the freeze-dried biomass subjected to enzymatic degradation with a cellulase (Figure 2c). Over 48 h of reactions, logarithmic regression models fit very well with saccharification trends for WT and transgenic lines (R2 > 0.97); the amount of released glucose from AtMYB4oe lines was higher than WT already at the earliest time points of the reactions (1 h, 2 h), and this was also confirmed when the reaction plateau was reached. In fact, from 24 h on, L1 and L24 had a 1.3-fold increase of released glucose over WT, a value that is even higher (2-fold) in L18.

2.4. AtMYB4oe Lines Show a Different Profile of Polyphenolic Compounds and Fatty Acids Compared to Wild Type

WT and transgenic lines were analyzed for the characterization of phenolic compounds, antioxidant activities, and fatty acids (Table 1). As for the other analyses, measurements were performed on 21-days old calluses (sub-cultures: XXII for WT, and XIV for AtMYB4oe lines). Typical full-scan chromatograms and the specifications of the observed peaks are reported in Figure S2.
On average, WT lines have a total polyphenolic content of 6962 µg/g DW, while transgenic lines are characterized by a significant reduction, strongest for L18 (−96%). In all lines, hydroxycinnamic acids account for the largest fraction; phenolic acids are present in significantly lower quantities and, among them, p-coumaric content is 3.50 µg/g DW in WT, reduced only in L18 (−57%). Eight peaks were assigned to non-anthocyanin flavonoids: quercetin and the deriving quercetin-glucoside, kaempferol and kaempferol-glucoside, naringin, luteolin, myricetin, and apigenin, all of which resulted reduced in L18. Among nutraceuticals, CGA (319 µg/g DW in WT) was reduced in L18 compared to WT (−69%); notably, the opposite is true for L1 and L24, which accumulated CGA more than WT (+60% and +32%, respectively). Furthermore, we observed that the reduction in phenolics of AtMYB4oe lines was also reflected in a reduced antioxidant activity, as evaluated with three different techniques: 2,2-diphenyl-1-picrylhydrazyl (DPPH) radical scavenging, 2,2′-azino-bis (3-ethylbenzothiazoline-6-sulfonic acid) (ABTS) decolorization, and Ferric Reducing Antioxidant Power (FRAP) assays. The correlation between phenol content and antioxidant activity is high for all the three assays: R2DPPH = 0.96, R2ABTS = 0.99, and R2ABTS = 0.87.
Considering the interest of the fatty acids profile typical of cardoon oil, we also characterized this fraction. The oil content of the biomass is slightly reduced in transgenic lines, with L24 exhibiting the lowest oil yield at 7.2%. We characterized, in detail, the fatty acid fraction by means of gas chromatography analysis (Table 1). Among saturated fatty acids (SFAs), palmitic acid (C16:0) is the most abundant, followed by stearic acid (C18:0), and lignoceric acid (C24:0); for all of these SFAs, no significant changes between WT and transgenic lines were detected. The content of MUFAs is mostly represented by oleic acid (C18:1 n9), which accounts for 3.4% of total fatty acids in WT and L18; interestingly, we detected a 3–4-fold increase in L1 and L24 lines. The content of PUFAs consists mostly of linoleic acid (C18:2 n6, LA) and linolenic acid (C18:3 n3, ALA), whose levels behave oppositely in WT and transgenic lines; notably, the content of LA in AtMYB4oe lines represents a 2-fold increase over WT. On the other hand, WT content of ALA is reduced by 2–4 fold in transgenic lines. Overall, there are no significant changes compared to WT in the total unsaturated:saturated fatty acids ratio, which ranges from 2.4 to 2.6 in transgenic lines; L1 and L24 transgenic lines, however, differ significantly in the PUFA:MUFA ratio from WT and L18 line (5.3 and 4.3 vs. 14.7 and 15.4, respectively).

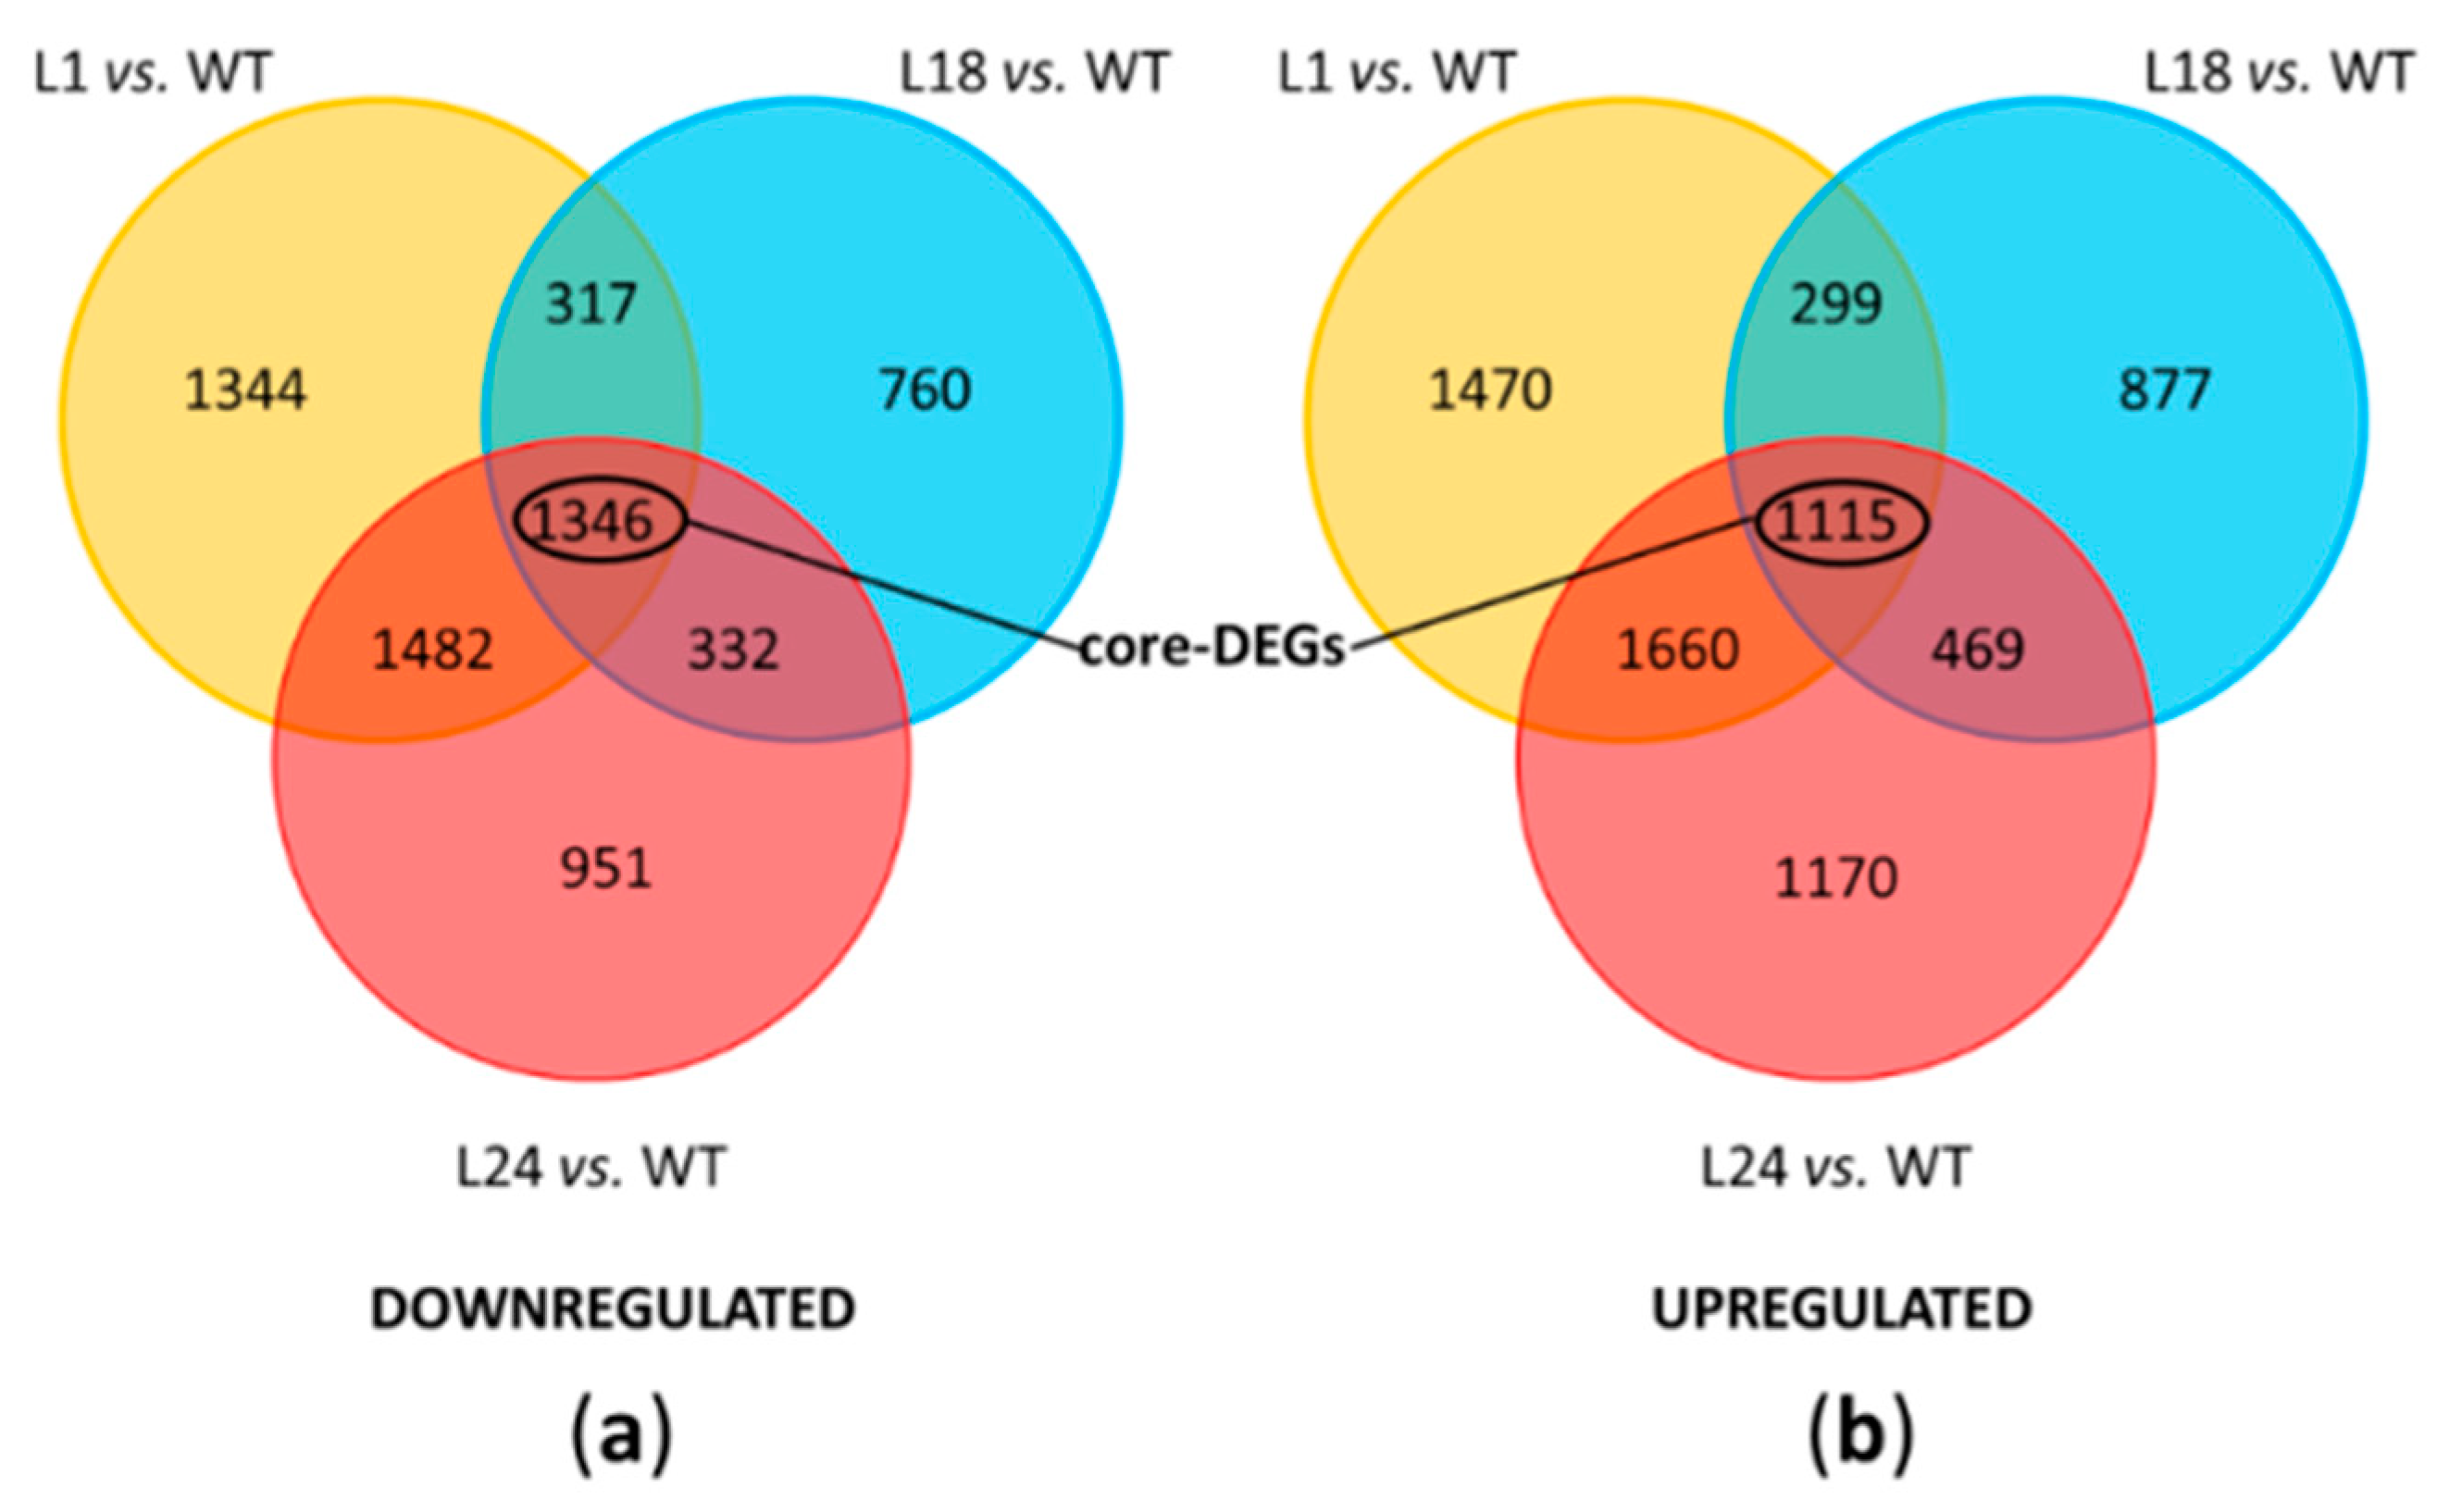
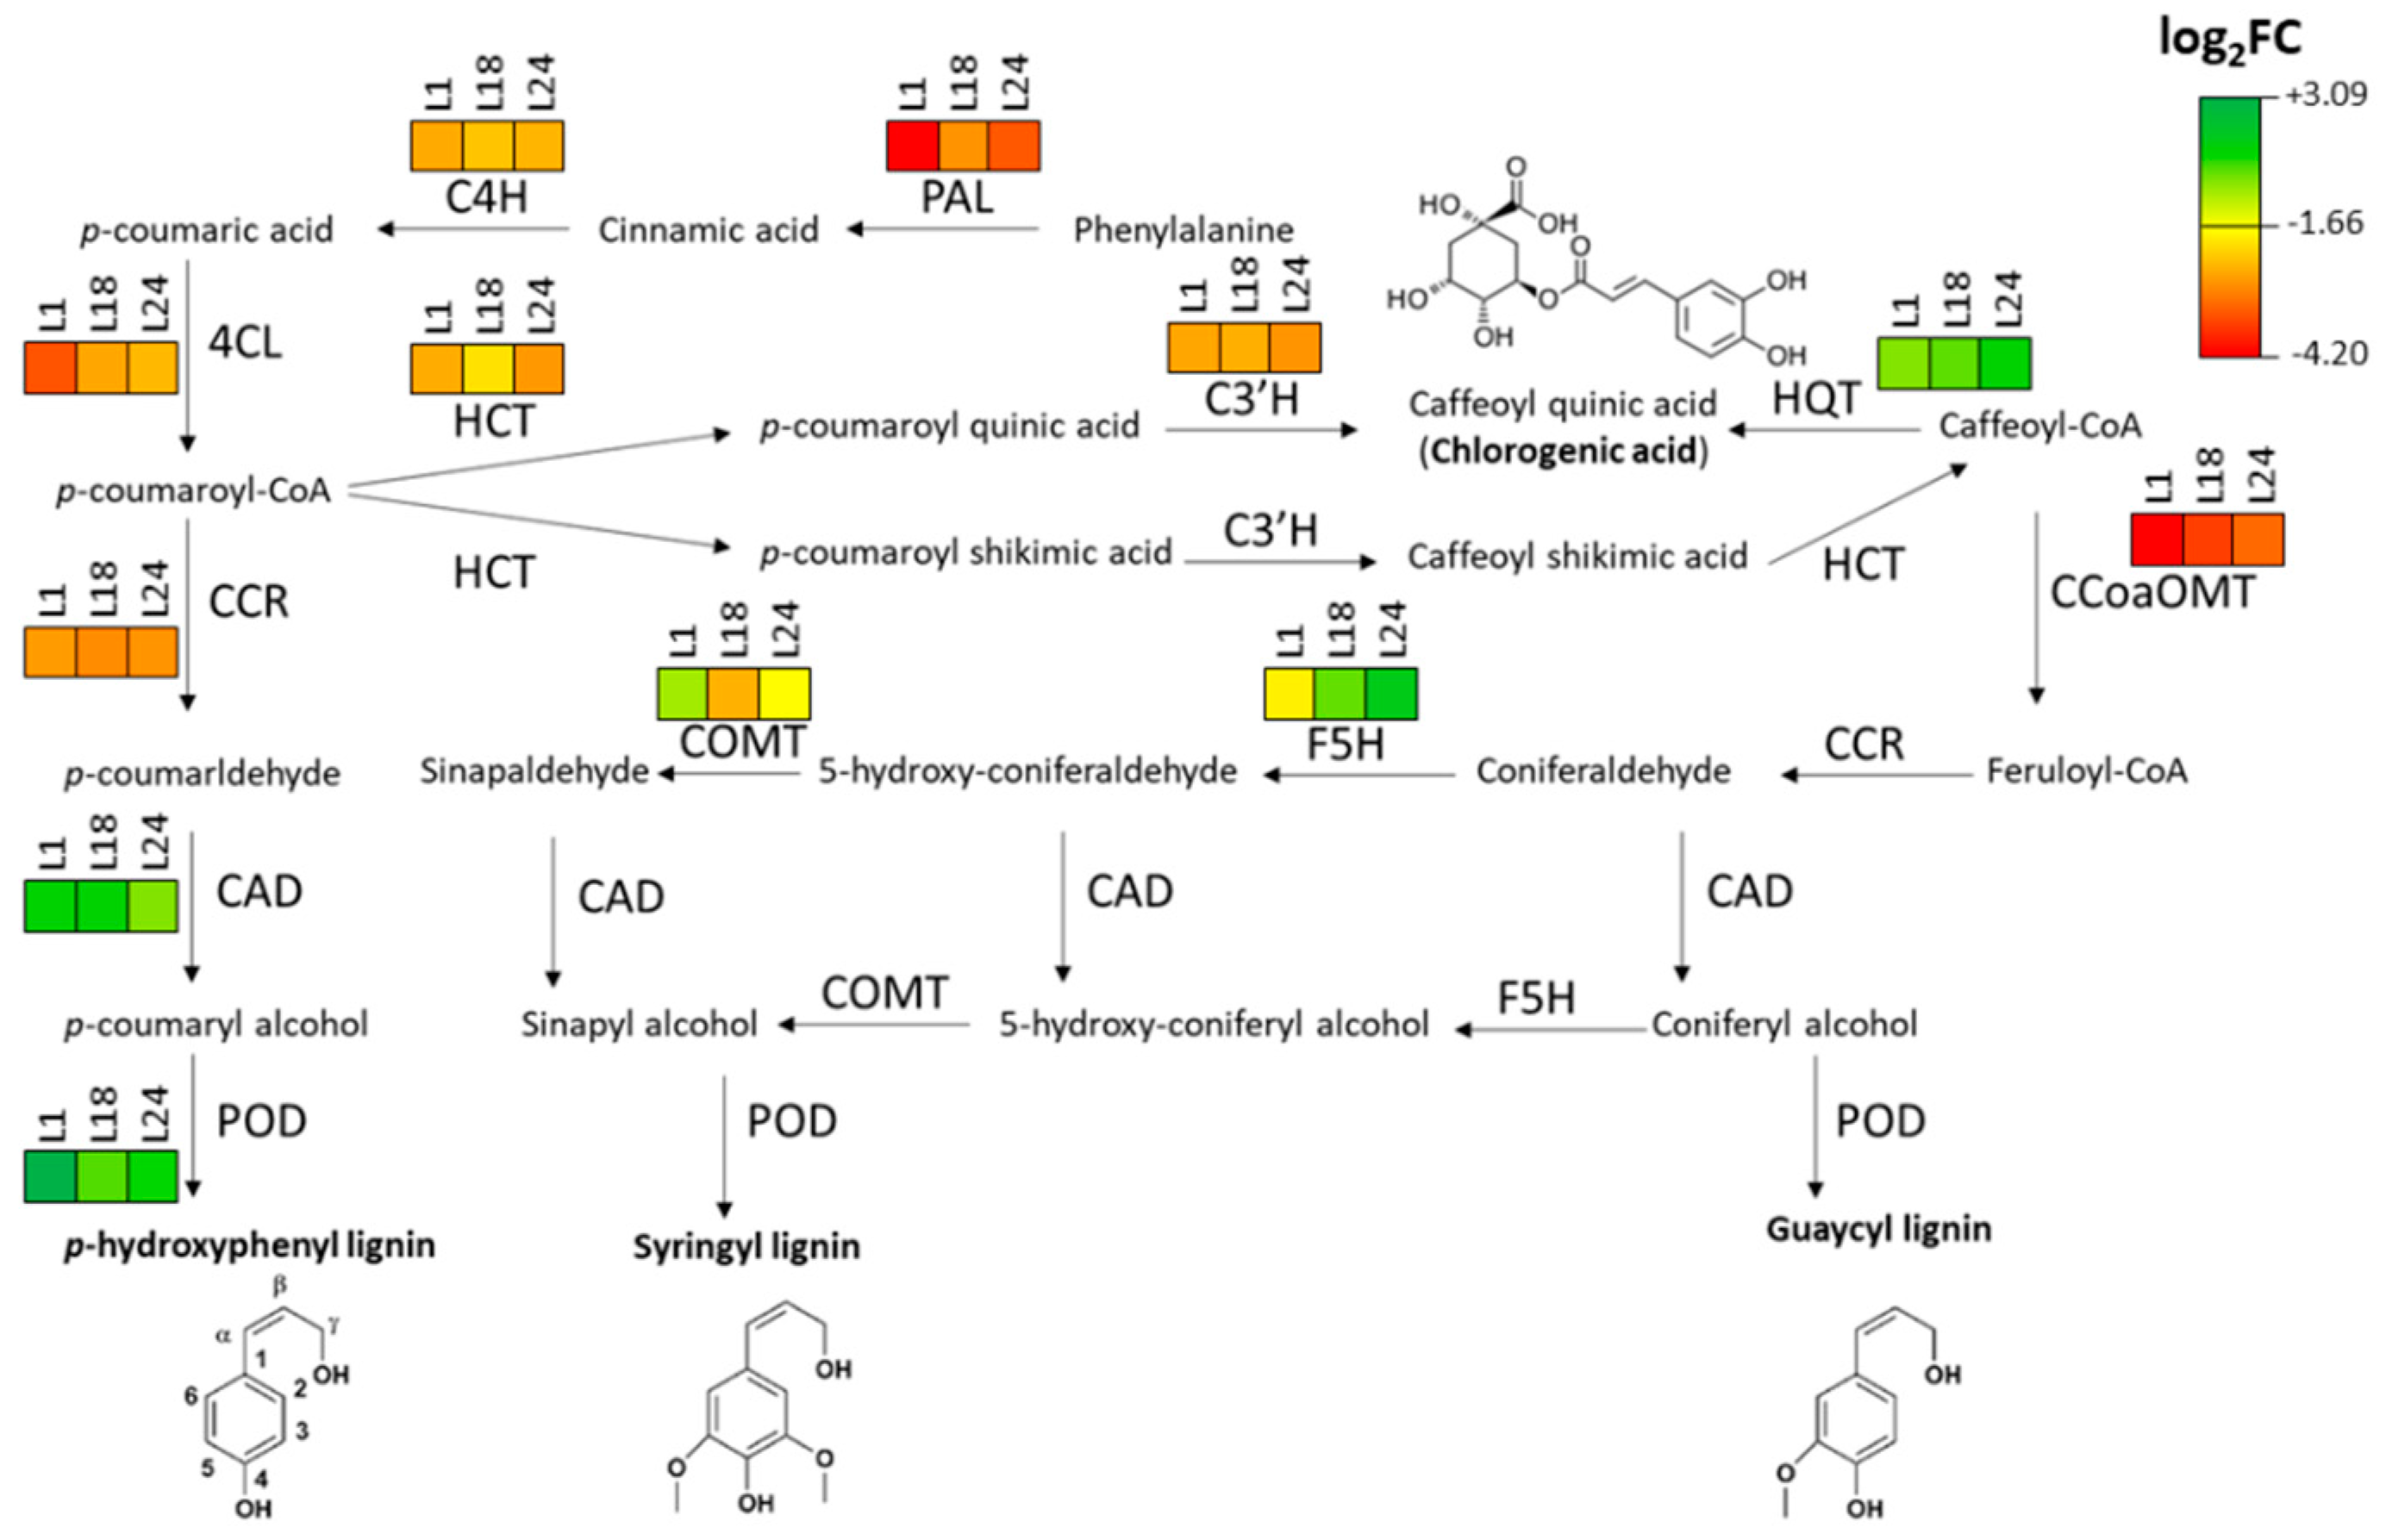
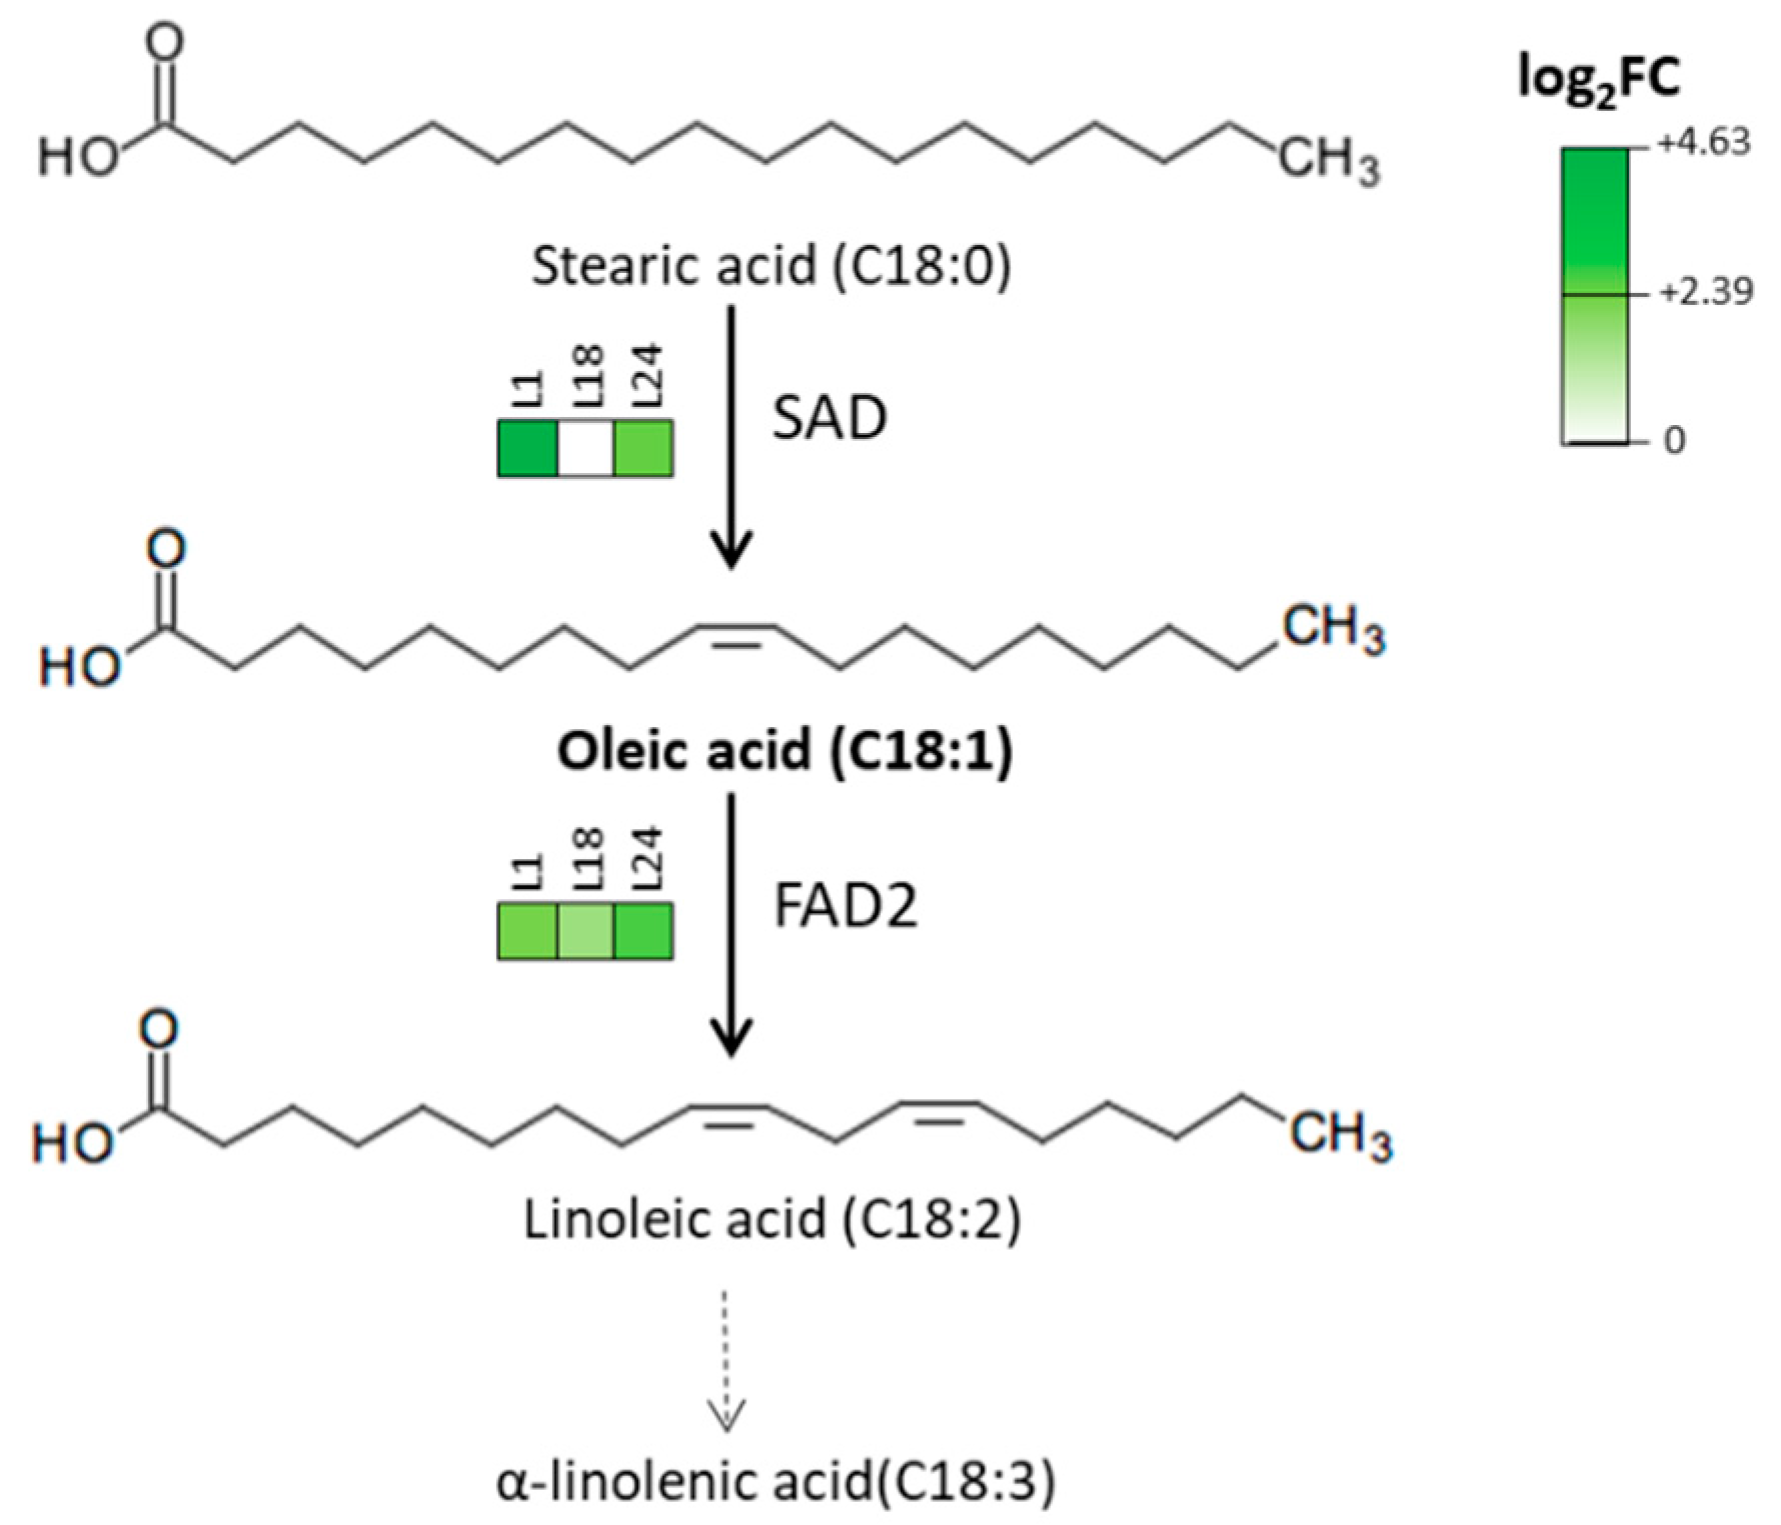
2.5. Transcriptomic Analysis of AtMYB4oe Lines

Transcriptomic changes induced by the heterologous overexpression of AtMYB4 were evaluated by RNA-seq analysis. The dataset included 12 samples divided in the four experimental groups (WT—XXII sub-culture—as a control and three independent transgenic lines: L1, L18, and L24—XIV sub-culture). The quality of the raw reads was very high. After trimming, an average of 91.6% of reads (17.4 M reads/sample) were retained and usable for downstream analyses. All samples presented over 94% of unique mapping to the reference genome, with very low percentages of multi-and un-mapped reads (Table S1). In order to quantify gene expression, fragments per kilobase of exon model per million bases mapped (FPKM) values were calculated. The overall quality of the experiment was then evaluated; on the basis of the high similarity between replicates, based on the Principal Component Analysis (PCA) using the normalized gene expression values as input (Figure S3a), data from all 12 samples were used for further investigations.
A differential expression analysis was performed to identify the differentially expressed genes (DEGs) emerging from the three comparisons (L1 vs. WT, L18 vs. WT, and L24 vs. WT), as well as DEGs common to multiple comparisons. For each comparison, the relationship between fold change (FC) values and the statistical significance of DEGs was visualized via volcano plots, while MA-plots were used to identify normalization issues and expression-dependent patterns in the log ratios (Figure S3b,c). Each comparison produced several thousand DEGs (Figure 3). The transgenic line L1 was the one with the most DEGs, in comparison to WT (9033, downregulated = 4489/upregulated = 4544), followed by L24 (8225, downregulated = 4111/upregulated = 4114), and L18 (5515, downregulated = 2755/upregulated = 2760). In order to identify common pattern of gene expression among transgenic lines, we also considered the list of all the significant DEGs that overlapped among the three comparisons, which resulted in total of 2461 core-DEGs (downregulated = 1346/upregulated = 1115). Among core-DEGs, 632 had a log2FC < −1 and 579 had a log2FC > +1. The complete list of the identified DEGs for each comparison is provided in Table S2.
Validation of the RNA-seq expression data was performed by means of RT-qPCR, testing the expression of selected core-DEGs. In particular, in order to span a consistent range of FC values (−7.99 < log2FC < +8.14) and gene functions, the following were tested: genes encoding phenylpropanoid enzymes (Ccrd_010165/C4H, Ccrd_015556/4CL, Ccrd_015561/HCT, Ccrd_004659/CCoAOMT), other enzymes (Ccrd_024577/NADPH dehydrogenase, Ccrd_000418/xyloglucan endoglucosylase), cyclin-dependent kinase inhibitors (Ccrd_010818/KRP7-like), and TFs (Ccrd_019107/MADS-TF, Ccrd_016332/AP2-TF). The quality of the expression data from RNA-seq was excellent given the high correlation of expression values via validation (R2 = 0.9), and the consistency among biological and technical replicates analyzed (Figure S4).

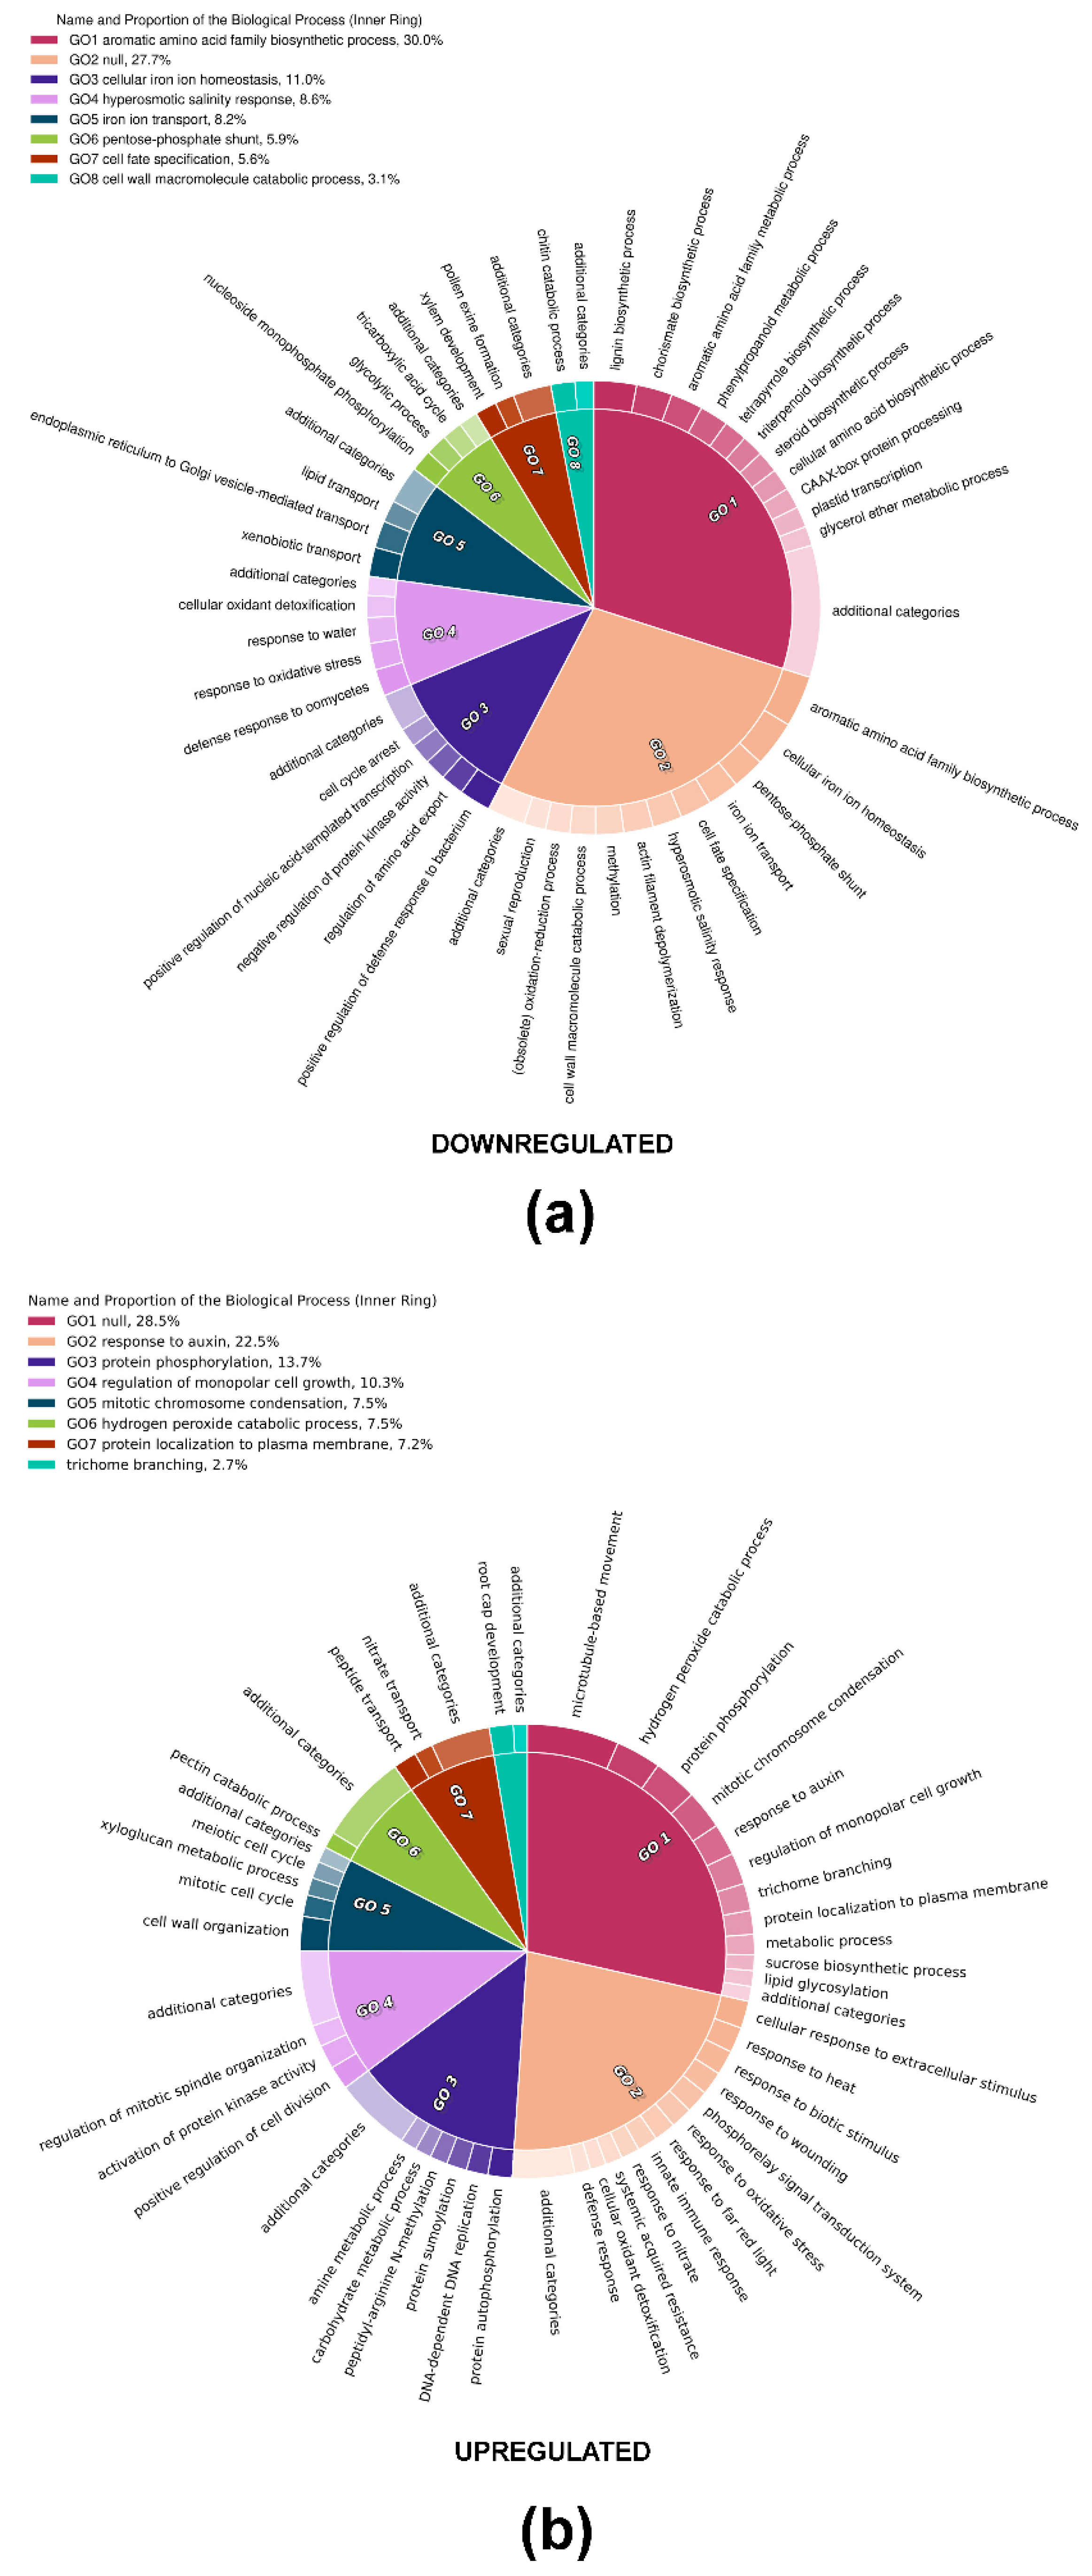
2.6. Gene Ontology Enrichment Analysis (GOEA)

A Gene Ontology (GO), followed by a Gene Ontology Enrichment Analysis (GOEA), was performed with the core-DEGs to identify the most enriched GO terms. The complexity of the list of enriched GO terms for biological processes (BP), molecular functions (MF), and cellular components (CC) was reduced via the software REVIGO, in order to identify and collapse redundant terms. Figure 4 shows CirGO visualization of enriched BP; interestingly downregulated core-DEGs were categorized in processes such as lignin biosynthesis (GO:0009809), phenylpropanoid metabolism (GO:0009698), aromatic amino acids biosynthesis (GO:0009073), hyperosmotic salinity response (GO:0042538), and cell cycle arrest (GO:0007050). On the other hand, BP relative to upregulated core-DEGs included the mitotic cell cycle (GO:0000278), positive regulation of cell division (GO:0051781), mitotic chromosome condensation (GO:0007076), and microtubule-based movement (GO:0007018). For a complete exploration of GO annotations of core-DEGs, full GOEA lists are provided as Table S3.
Besides MYB4, the regulation of phenylpropanoid metabolism depends on many other transcription factors (TFs). Analysis of our transcriptomic data against the PlantTFDB database detected 153 genes encoding DE TFs (78 downregulated and 75 upregulated in AtMYB4oe lines, compared to WT), accounting for 6.2% of the total core-DEGs (Table 2). The most numerous TF family was bHLH (18), followed by NAC (17) and WRKY (15). A total of 11 core-DEGs encoded MYB-related TFs, here listed alongside their putative Arabidopsis paralogues: among these, six were downregulated (Ccrd_007105/AtMYB5, Ccrd_006948/AtMYB79, Ccrd_002014/AtMYB15, Ccrd_001286/AtMYB19, Ccrd_018110/AtMYB48, Ccrd_013908/AtMYB107), and five were upregulated (Ccrd_002100/AtMYBS2, Ccrd_001632/AtMYB62, Ccrd_012299/AtMYB36, Ccrd_012123/AtMYB38, Ccrd_009207/AtMYB14). Other TFs, such as bZIP, GRAS, AP2 and MADS, HSF, and bZIP, were also identified.
Considering the observed reduction in the phenolic content of transgenic lines and the GOEA identifying several DEGs involved in phenylpropanoid pathways, as well as the changes in the fatty acids profile (particularly oleic acid), we focused our attention on the transcriptional changes that the AtMYB4 overexpression induces on the biosynthesis of these compounds. Based on the Kyoto Encyclopedia of Genes and Genomes (KEGG) annotations of the phenylpropanoid biosynthesis (ccav:00940), we identified all Cynara enzymes involved in all the catalytic steps of the pathway leading to lignin monomers and CGA, and their relative genes among DEGs (Table S4). Similarly, we identified the main genes putatively involved in the production and conversion of oleic acid, as part of the biosynthesis of unsaturated fatty acids (ccav:01040) (Table S5). For the phenylpropanoid biosynthesis, the 12 main catalytic steps, identified by their Enzyme Commission (E.C.) number, involved a total of 73 genes found in at least one of the three DEG lists; the three transgenic lines had a similar number of DEGs belonging to this pathway: in L1, 55 DEGs (24 downregulated and 31 upregulated), in L18, 49 DEGs (27 downregulated and 22 upregulated), in L24, 58 DEGs (29 downregulated and 27 upregulated). Strong downregulation is particularly represented upstream in the pathway, as demonstrated by the number of core-DEGs encoding catalytic activities for the early biosynthetic steps: phenylalanine ammonia-lyase/PAL [E.C. 4.3.1.24], cinnamate 4-hydroxylase/C4H [E.C. 1.14.14.91], 4-coumaroyl CoA-ligase/4CL [E.C. 6.2.1.12], and hydroxyl-cinnamoyl-transferase/HCT [E.C. 2.3.1.133], with two downregulated core-DEGs found for each of these steps. Among later biosynthetic steps, peroxidase activity/POD [E.C. 1.11.1.7] accounted for the majority of the DEGs (41), followed by cinnamyl-alcohol dehydrogenase/CAD [EC:1.1.1.195]. Overall, average downregulation was stronger in the early catalytic steps of the pathway (Figure 5).
When focusing on the biosynthesis of oleic acid (Figure 6), genes encoding the activity of soluble stearoyl-ACP desaturase/SAD [E.C. 1.14.19.2-1.14.19.11-1.14.19.26] activity were found to be upregulated in L1 and L24, while upregulated genes encoding the activity of ∆(12)-fatty-acid desaturase/FAD2 [E.C. 1.14.19.6-1.14.19.22] were found for all lines, including three upregulated core-DEGs.

3. Discussion

For this study, we set up a protocol for the stable genetic transformation of cardoon cell cultures, with the aim of lowering the lignin content of cell walls, and increasing the accessibility to degradative enzymes, by overexpressing the coding sequence of the Arabidopsis MYB4 transcription factor under the control of the constitutive CaMV35S promoter. While biolistic transformation of cell suspension from cardoon has been attempted before [61], to the best of our knowledge, ours is the first report of successful stable transformation of cardoon cell cultures via A. tumefaciens.
To this end, we used two Agrobacterium strains (EHA105 and AGL1) with the same genetic background (C58), obtaining a similar number of transformation events, thus highlighting the reproducibility and value of this method.
The analyses of the transgenic lines proved that the CaMV35S promoter is suitable for overexpression strategies also in cardoon cells, as already shown for other Asteraceae such as artichoke [62], chicory (Cichorium intybus var. sativum L., [63]), and gerbera (Gerbera jamesonii, [64]). The three independent lines selected for this study overexpressed the transgene at significantly different levels, allowing for the exploration dose-dependent phenotypes.
The overexpression of different MYB4 proteins resulted in reduced plant stature [49,59,65,66]. Moreover, it has been recently shown that in the dwarf ref4-3 Arabidopsis plants, affected in a regulator of phenylpropanoid homeostasis [67], AtMYB4 expression is up-regulated, and in the myb4 ref4-3 double mutant there is a reversion to the wild type phenotype [60]. More generally, different lignin mutants exhibit impaired growth that interferes with the broader deployment of lignin engineered plants, a phenomenon referred to as lignin modification-induced dwarfism (LMID). Although the actual mechanism by which dwarfism arises remains unknown, some possible interpretations have been proposed [68]. Surprisingly, a remarkable and unforeseen characteristic of the cardoon AtMYB4oe lines is their faster and more replicable growth rate, in comparison to WT, both on solid and liquid media. L18 is the fastest line to accumulate biomass on solid medium, hinting at a correlation with its highest overexpression levels of AtMYB4. However, growth rates of all AtMYB4oe lines are of particular interest in the case of cell suspensions. The use of bioreactors for PCC depends in fact on the possibility of using appropriate liquid medium and apparatus to propagate cells [69]. Previous studies have already highlighted how cardoon cells are promising for the production of high yields of biomass [70], and for their use in continuous cell culture systems. This feature is due to the ability of these cells to adapt to new environmental conditions, and to the low aggregation and low cell growth on the walls of the fermenters [71]. Our transcriptomic data bolster the evidence of faster growth rates of AtMYB4oe lines: a significant number of upregulated DEGs was classified via GOEA as belonging to different activities related to mitosis. Among them, Ccrd_006023 (orthologue of Arabidopsis AUR3) encodes a Ser/Thr kinase, whose activity peaks during cell division [72], Ccrd_013806 encodes a DNA-polymerase and Ccrd_000826 (orthologue of AtHUB1) positively regulates G2/M transition through histone monoubiquitination [73].
Several plant MYB TFs, in particular of R1R2R3-type, have been shown to regulate cell cycle [74], and this function has been reported also for the AtMYB59, AtMYB125, FOUR LIPS/AtMYB124, AtMYB88, AtMYB46, and AtMYB83 R2R3-type MYBs [74,75,76,77,78]. For AtMYB4 and its orthologues involvement in the control of cell cycle has not been reported; however, the reduced plant stature in different species overexpressing MYB4 orthologues, the faster growth rate of the AtMYB4oe cardoon lines, and the differences in their transcriptional modulation of cell cycle genes as compared with WT suggest a possible role of AtMYB4 in the regulation of cell cycle progression. A recent article characterized the MYB4-comprising regulatory network driving lignification in bamboo (Phyllostachys edulis), and the transcriptomic analyses confirmed that genes related to cell cycle activation and cell differentiation are downregulated as lignification progresses in shoots [79], supporting the idea of a negative correlation between the synthesis of lignin and growth rate. In addition to this, it was very recently shown that AtMYB46 and AtMYB83 in Arabidopsis thaliana and RrMYB18 in Rosa rugosa are induced by wounding, and regulate the expression of genes involved in cell wall biosynthesis, including lignin, and cell cycle progression. Moreover, expression correlation analysis in different species revealed that this co-regulation of genes involved in both processes is highly conserved [74]. These results question the previous accepted suggestion that these two processes are independently regulated [80]. It can also be hypothesized that AtMYB4 may be part of this co-regulatory network, and that the opposite phenotype observed in plants and in PCC overexpressing MYB4 proteins might depend on the important and dispensable role of lignin in the two systems, respectively, and then in the different compensation mechanisms activated by the cells in plants compared to PCC.
A lack of growth of AtMYB4oe lines on 100 mM NaCl-medium is corroborated by the downregulation of hyperosmotic salinity response detected by GOEA, as well as by the reduction in antioxidant activity of all the transgenic lines; the increased salt-sensitivity could also be related to the reduction of lignin content in cell walls. On the contrary, WT tolerance to this stress condition confirms what was already revealed for plants of the same genotype [9].
We demonstrated that the levels of phenolic compounds were severely affected in AtMYB4oe lines. We also showed a high correlation between phenolics and antioxidant activities, coherent with previous studies on different cardoon tissues [22]. Folin–Ciocalteu’s quantification was used to quickly confirm the depletion of total phenolics, which accumulate at the lowest level in L18, another evidence of a putative dose-dependent effect of the overexpression of AtMYB4.
We showed that lignin content was severely reduced in AtMYB4oe lines, and the depletion of total phenols and lignin was reflected by the RNA-seq data: GOEA of DEGs revealed the downregulation of genes involved in phenylpropanoid biosynthesis and, more specifically, in lignin biosynthesis and cell wall organization. Lignin polymers reinforce plant cell walls, binding cellulose fibers, and protecting them from enzymatic degradation. This evidently means that lignin is also a barrier to efficient biomass saccharification, thus making pretreatments of lignocellulosic biomass necessary to efficiently achieve the hydrolysis of polysaccharide fractions, for example, for the recovery of fermentable sugars [81]. We demonstrated that the reduction of lignin in AtMYB4oe lines significantly increases saccharification yields, as proven by the higher levels of released glucose: this is another fundamental and desirable feature for the use of these cell lines in bioreactors, as the reduction of lignin enhances the accessibility of the cellulose fraction to enzymatic degradation. A similar result was shown in planta through the overexpression of PvMYB4 in switchgrass [66].
Altogether, the described biochemical and molecular evidence proves that the heterologous protein AtMYB4 also maintains its role when expressed in cardoon cells.
Notably, the overexpression of AtMYB4 allowed for the simultaneous alteration of the expression of other TFs (including several other MYBs). This should be considered for the potential amplification effects on the modulation of the same pathway, or for cascade effects on other pathways. Amplification effects can for example be explained by the detected downregulation of Ccrd_002014 (orthologue of AtMYB15), which is involved in lignin biosynthesis [82]. In a biorefinery context, in addition to the high yields of biomass, cardoon has been described for its rich phenolic profile, characterized by high-added value nutraceuticals [19,22]. Metabolic analyses revealed that cardoon calluses accumulate high levels of phenolics, in particular CGA and cynarine [22,83]. We confirmed the presence of high levels of total phenols in WT lines, that are even higher than previously observed in leaves of the same genotype [22], whereas total phenols were reduced in the AtMYB4oe lines, as expected. However, a deeper quantitative and qualitative characterization revealed interesting findings about specific nutraceuticals: CGA accumulates more in two of the lines we tested (L1 and L24) than WT. Similarly, in L1 and L24 lines, p-coumaric acid and flavonoids identified in the extracts (quercetin, kaempferol, naringin, luteolin, myricetin, and apigenin) accumulated at similar levels than WT. Notably, this confirms that while the overexpression of AtMYB4 represses the phenylpropanoid pathway by reducing the production of lignin monomers, it does not necessarily depauperate nutraceuticals, which could be recovered from the cell cultures, increasing the interest in these lines from a biotechnological point of view.
Given the potential of cardoon as a source of oils, we performed quantitative and qualitative analyses of the fatty acids profile of WT and transgenic lines. The use of friable calluses from other species has been previously suggested as a potential source for plant oils, especially for biofuels, such in the case of Jatropha curcas [84]; we have shown that leaf-derived cell cultures of cardoon only contain limited amounts of oil in WT (and even less in AtMYB4oe lines, though a more precise quantitative approach is required), a result that does not differ from what is observed in leaves, where the oil content ranges from 10 to 15%, depending on the genotype [22]. While the levels of calluses oil content do not match the average levels of seeds (25%, [22]), the faster accumulation of biomass of the transgenic lines could, however, offset this drawback. Unexpectedly, we have also observed how the overexpression of AtMYB4 also reflects on the composition of oils. A major result is the 3-fold increase in the levels of oleic acid in two of the transgenic lines (L1 and L24), which should be taken in consideration both from a nutraceutical and industrial perspective. The increase of oleic acid is corroborated by the transcriptional data, as shown by the expression levels of genes encoding SAD activity, responsible for the conversion of saturated stearic acid to oleic acid [85]: only in L1 and L24 are SAD genes in fact upregulated, while their expression level does not change for L18, whose oleic acid levels do not differ from WT, despite being the line with the strongest AtMYB4 overexpression. High levels of oleic acid reduce oxidation of oils due to the presence of a single double bond in the C chain of the molecule—thus improving shelf life [86]; in addition to this, oleic acid is also beneficial to health as it inhibits fatty acid biosynthesis and cholesterogenesis in vivo as well as in vitro [33]. Moreover, we also report how the levels of linoleic acid increase in all transgenic lines, coherently with the strong upregulation of genes encoding FAD2 activity, responsible for the additional desaturation that converts oleic acid into linoleic acid [85]. From a nutritional perspective, it is also notable that the linoleic/linolenic acids ratio (omega-6/omega-3), which was 1:2 in WT, drastically changes in transgenic lines, with values ranging from 2–4:1, overlapping the range considered optimal for nutritional value of oils [87].
Many biotechnological approaches have been conducted to manipulate the fatty acid composition of oilseed crops, both for industrial and food uses [88]. This has been considered over the years an important goal of research, for example, for the increase of oleic acid levels; this has been attempted mainly via the alteration of genes encoding fatty acid biosynthetic enzymes [89]. For example, high oleic acid mutants defective in desaturase FAD2 genes (and therefore impaired in the conversion of oleic into linoleic acid) have been generated and investigated in maize (Zea mays, [90]), soybean (Glycine max, [91]), and peanut (Arachis hypogaea, [92]). Indeed, all of these approaches envisaged the use of metabolic engineering strategies to make the whole plant a “platform” for the production of industrial lipids. To the best of our knowledge, ours is the first report of efficient modifications of fatty acid profiles in plant calluses, and of how MYB4 levels could also affect the content and composition of plant oils; such a role is otherwise known for other MYB-TFs, that interestingly we found among downregulated genes of transgenic lines, as in the case of MYB5 and MYB107 [93,94]. Alternatively, the alterations observed in the fatty acid profiles of the described cell lines could be traced back to the growth characteristics of the AtMYB4oe lines, rather than directly to MYB4 activity. Studies on cell suspensions and calluses from Acer pseudoplatanus and Arabidopsis thaliana have in fact highlighted how faster growth rates correlate with higher levels of oleic acid (C18:1), and the decrease in the levels of PUFAs (particularly C18:2 and C18:3), a phenomenon that might be explained by considering that when membrane synthesis/turnover are fast, the activities of FAD2/FAD3 might to match phospholipid synthesis and editing, leading to 18:1 accumulation [95]; interestingly, the same positive correlation between growth rates and oleic acid content can be observed for two of the AtMYB4oe lines presented here, as well as a minor reduction on the levels of C18:2 + C18:3. Additional studies on the identification of FAD2/FAD3 encoding genes and their activities in cardoon cell cultures are therefore required, as they would further drive the characterization of fatty acids accumulation in the frame of biorefinery.
While plant regeneration protocols from undifferentiated cell cultures (also from friable calluses) were successful for many different—including non-model—species (reviewed recently by [96]), cardoon or other Cynara species have proven recalcitrant to regeneration [97]. Cell culture-based biofactories allow for the overcoming of the difficulties of obtaining whole transgenic plants from cardoon and related species; moreover, their use is not affected by the strict genetically modified organism (GMO) legislation of several countries. However, the setup of plant regeneration protocols from wild-type and transgenic cardoon cell cultures would be of outstanding interest for translating the biochemical/physiological improvements developed in cell cultures. This would allow for their evaluation in field, in the attempt to overcome several agronomic drawbacks by which this species is otherwise notoriously affected [37,38].We are currently testing the described cardoon cell cultures potential in pilot bioreactors, with the aim of improving yields and optimizing production process; interestingly, we have so far also confirmed that in such scale-up approaches, AtMYB4oe lines show a significant higher productivity than WT lines (L. Langellotti—University of Naples Federico II, personal communication, October 2021). Our findings suggest that AtMYB4oe lines represent a valid solution to provide a fast and continuous supply of biomass with high uniformity in yields and quality. Further investigation related to life cycle assessment (LCA) is also being carried on, in order to correctly evaluate the potential of cardoon cell cultures in the frame of biorefinery.

4. Materials and Methods

4.1. Plant Material and Growth

Undifferentiated wild type (WT) friable calluses were induced from leaves of cardoon (“Spagnolo” genotype), as described in [70], with the following modifications of the callus-inducing and growth medium: Gamborg B5 agar medium including vitamins (Duchefa Biochemie, Haarlem, Netherlands, #G0209), supplied with 1 mg/L 2,4-dichlorophenoxyacetic acid (2,4-D), 1 mg/L adenine, 0.1 mg/L kinetin, 3% (w/v) sucrose, 7.5% (w/v) agar, adjusted to pH = 5.8. WT calluses were grown in the dark at 25 °C, and sub-cultured approximately every 30 days. Cell suspension cultures were started by inoculating 1.5 g of friable callus in a 250 mL Erlenmeyer flask containing 50 mL of liquid medium, and kept on a gyratory shaker at 100 rpm in the dark at 25 °C. To determine the cell growth, CVS was measured using 250 mL Erlenmeyer flasks with a graduated beak. This method has been shown to be rapid and non-destructive for the routine estimation of cell biomass, given how CVS is highly correlated with the fresh weight of cells [98]. All measures were performed on biological triplicates.

4.2. Construct Preparation

The coding sequence (849 bp) of AtMYB4 (At4g38620) was amplified from cDNA of Arabidopsis thaliana mature flowers (Col-0 ecotype) using Gateway-cloning compatible primers and Phusion HF DNA Polymerase (Thermo Fisher Scientific, Waltham, MA, USA, #F530S), and subsequently cloned in a pDONR207 vector; subcloning to pB2GW7 destination vector [99] was performed to obtain the final construct p35S::AtMYB4. BP and LR cloning reactions were performed according to the Gateway Cloning manual (Thermo Fisher Scientific). A. tumefaciens electro-competent cells (strains AGL1 and EHA105) were transformed with 100 ng of plasmid and recombinant clones were used for transformation of cardoon cells. Primers used for the construct preparation are listed in Table S6.

4.3. Cardoon Cell Suspension Transformation and Selection

Cell suspensions of WT cardoon were set in 250 mL sterile flasks, and kept in the dark at 25 °C under gentle agitation until the start of exponential growth (5 days); next, 5 mL of cell suspension and 10 mL of fresh liquid medium were added to a 100 mL sterile flask, and agitated for five additional days. Meanwhile, a single colony of recombinant Agrobacterium was used to start a 50 mL inoculum in LB medium, which was grown at 28 °C with 200 rpm shaking until OD600 = 0.7–0.9 (approximately 48 h), then pelleted (15 min at 2000× g) and re-suspended in Gamborg B5 liquid medium to a final OD600 = 0.80–0.85. Co-cultivation was performed adding 1 mL of Agrobacterium cells to each cell suspension in the presence of 400 µM acetosyringone (Sigma Aldrich, Darmstadt, Germany, #D134406), leaving flasks in the dark at 25 °C in gentle agitation for 48 h. Afterwards, pelleted cells were washed three times with fresh Gamborg B5 medium supplied with 200 mg/L CFX and 10 mg/L PPT, before being spread on sterile filter paper to remove the liquid excess; cells were then moved to the solid selective medium containing CFX and PPT. After 30 days, emerging resistant calluses were individually transferred to new plates and separately sub-cultured approximately every 21 days to fresh selective medium. PCR was used to confirm the presence of the transgene and to evaluate residual Agrobacterium contamination using AGL1 and EHA105 colonies as positive controls [100]. Primers used for the selection of transgenic lines are listed in Table S6.

4.4. Quantification of Total Phenols

Total phenolic content of the samples was determined via Folin–Ciocalteu’s method using gallic acid as a standard, as reported [101]. 1 mL of methanol/water (80:20 v/v) was added to 10 mg of freeze-dried sample before sonication (10 min), and vials were mixed in an orbital shaker overnight in the dark; after centrifugation (20 min, 13,000× g), 20 µL of each extract was added to 1.58 mL of deionized water and 100 µL of Folin–Ciocalteu’s reagent/water solution (1:9 v/v, Sigma Aldrich, #F9252), incubated for 8 min, then 300 µL of a 20% (w/v) Na2CO3 aqueous solution was added, and the samples were incubated in the dark for 2 h at room temperature. Measurements of absorbance at 765 nm were carried out against a reagent blank without extract in a microplate reader Infinite 200 Pro (Tecan, www.tecan.it). Total phenolic content was calculated based on a calibration curve (R2 = 0.99) from the gallic acid standard (Sigma Aldrich, # 398225), over the 0.004–0.25 mg/mL range. The results were expressed as mg of the Gallic Acid Equivalent (GAE) per g of DW. Measurements were carried out in triplicates. Student’s t-tests were run to identify significant differences among samples (p < 0.01).

4.5. Quantification of Total Lignin Content

The amount of total soluble lignin was determined by spectrophotometric measurement following derivatization with TGA, adapting a previously described method [102]. All steps were carried out at room temperature unless specified. A 60 mg freeze-dried sample was washed twice with 6 mL of phosphate buffer (100 mM K2HPO4/KH2PO4, pH = 7.8 in water, with 0.5% Triton X-100), the tubes placed in an orbital shaker (30 min), and spun (20 min, 3200× g). The pellet was washed three times for 20 min in 100% methanol, and the resulting structural biomass (SBM) was dried at 80 °C (12–16 h). Three aliquots of 2 mg of SBM were mixed with 1.5 mL 2N HCl and 0.3 mL TGA (Sigma Aldrich, T3758). After incubation at 95 °C (4 h), samples were centrifuged (10 min, 13,000× g), and pellets washed three times with distilled water (10 min, 13,000× g), before incubation with 1 mL of 0.5N NaOH for 18 h in the dark. After centrifugation (15 min, 13,000× g), the resulting supernatant was mixed to 0.3 mL of 37% w/w HCl, and samples were incubated at 4 °C (4 h) before centrifugation (10 min, 13,000× g). The pellet was solubilized in 1 mL of 0.5N NaOH, and the absorbance was read at 280 nm. Lignin quantification was calculated based on a calibration curve (R2 = 0.99) obtained following the same steps with commercial lignin (Sigma Aldrich, #370959), over the 10−1–10−4 mg/mL range. Student’s t-tests were run to identify significant differences among samples (p < 0.01).

4.6. Saccharification and Evaluation of Glucose Content of Cell Walls

The saccharification yields were tested according to a previously described protocol [103], with the minor modifications reported here. 20 mg of untreated freeze-dried samples were dissolved for 5 min at 50 °C in 0.9 mL of acetic acid buffer solution (pH = 4.8), and then subjected to hydrolysis with 100 µL of a cellulase mix from Trichoderma reesei (Celluclast® 1.5 L—Sigma Aldrich, #C2730), measuring the saccharification yield over a 48-h time interval. The enzymatic activity of the cellulase mix was 0.023 filter paper units (FPU)/mL. For each time point, an aliquot of 20 µL was used as substrate to indirectly measure glucose concentration; this was done by measuring the absorbance at 405 nm (A405) of the oxidized ABTS (Sigma Aldrich, #11112422001), which results from the activities of glucose oxidase (GOD, TCI Europe, Zwijndrecht, Belgium, #TCIAG0050, www.tcichemicals.com) and peroxidase (POD, Sigma Aldrich, #P6782). GOD/POD reactions and measurements of A405 were carried out at 37 °C in a microplate spectrophotometer Infinite 200 Pro (Tecan, Männedorf, Switzerland). Glucose content was calculated based on a calibration curve (R2 = 0.97) obtained following the same steps with D-glucose standards (Sigma Aldrich, #G8270), over the 20–200 µM range. Measurements were carried out in triplicates.

4.7. Extraction of Polyphenols

The ultrasound-assisted extraction was performed as previously reported [22]. A total of 3 g of the freeze-dried sample were extracted with 30 mL of ethanol/water (50:50 v/v) by sonication at room temperature for 30 min, centrifuged at 4 °C (10 min, 4000× g), filtered through 0.45 µm nylon membranes, and then used for high-resolution mass spectrometry analysis and antioxidant activity assays.

4.8. Antioxidant Activity Determination

The antioxidant activities of the polyphenolic extracts were tested with three independent strategies: DPPH, ABTS, and FRAP assays [22]. For each assay, determinations were performed in triplicates and results are expressed as Trolox®-equivalent antioxidant capacity (TEAC, mmol Trolox®-equivalents/kg of DW). ABTS in the crystallized diammonium salt form (CAS #30931-67-0) and DPPH (CAS #1898-66-4) were supplied from Merck. TPTZ (2,4,6-Tris(2-pyridyl)-s-triazine, CAS #3682-35-7) and ferric chloride (CAS #7705-08-0) used for FRAP assay were provided by Merck (Darmstadt, Germany). DPPH assay: 1 mL of DPPH solution (100 µM in methanol) was added to 0.2 mL of polyphenolic extract, and the decrease in absorbance of the resulting solution was monitored at 517 nm after 10 min; for the ABTS assay, 44 µL of aqueous 2.45 mM K2S2O8 were added to 7 mM aqueous ABTS solution and incubated in the dark at room temperature (23 °C) for 12 h. After dilution (1:88) with ethanol, the absorbance at 734 nm (A734) of this ABTS working solution was A734 = 0.700 ± 0.050. The assay was performed by adding 0.1 mL of filtered and suitably diluted sample to 1 mL of ABTS working solution, and the A734 was monitored after 2.5 min; FRAP assay: FRAP reagent contained a solution of 10 µM Tetrazolium Red (TPTZ) in 40 µM HCl, 20 µM of aqueous FeCl3 and acetate buffer (300 µM, pH = 3.6) at 1:1:10 (v/v/v). The FRAP reagent (300 µL) and sample solutions (10 µL) were mixed, and the absorbance was monitored at 593 nm after 10 min.

4.9. UHPLC-HRMS Analysis of Polyphenols

The qualitative and quantitative analysis of polyphenols extracted from cardoon cell cultures was performed via High-Resolution Mass-Spectroscopy using an Ultra-High-Pressure Liquid Chromatograph Dionex UltiMate 3000 (UHPLC, Thermo Fisher Scientific), coupled with a Q-Exactive Orbitrap mass spectrometer (Thermo Fisher Scientific). The parameters were set as previously reported [22]. Chromatographic separation of polyphenolics was achieved at 25 °C with a Kinetex 2.6 µm Biphenyl (100 × 2.1 mm, Phenomenex, Torrance, CA, USA) column, with a mobile phase composed of eluent A (0.1% formic acid in water v/v) and eluent B (0.1% formic acid in methanol v/v). The gradient for elution was: 0–1.3 min 5% B, 1.3–9.3 min 5–100% B, 9.3–11.3 min 100% B, 11.3–13.3 min 100–5% B, and 13.3–20 min 5% B. The flow rate was 0.2 mL/min, and the injection volume was 2 µL. The mass spectrometer was operated in the negative ion mode (ESI-) setting for two scan events (Full ion MS and All ion fragmentation, AIF) for all compounds of interest. Full scan data were acquired setting a resolving power of 35,000 full width at half maximum (FWHM) at m/z 200. The key parameters were as follows: spray voltage −2.8 kV, sheath gas flow rate 35 arbitrary units, auxiliary-gas flow rate, 10 arbitrary units, capillary temperature 310 °C, auxiliary gas heater temperature 350 °C, S-lens RF level 50. For the scan event of AIF, the resolving power was set at 17.500 FWHM, the collision energies were 10, 20, and 45 eV, and the scan range was m/z 80–1200. Data acquisition and processing were performed with Quan/Qual Browser Xcalibur software, v. 3.1.66.10 (Thermo Fisher Scientific).

4.10. Oil Extraction

An adaptation of the solvent extraction previously described [104] was used in this study. Freeze-dried samples were extracted with hexane (1:10 w:v) for 24 h; the solution was filtered through paper under reduced pressure, and concentrated to remove the solvent in a Rotavapor RE 120 (Büchi, Essen, Germany). The final weight of the extract was recorded.

4.11. Fatty Acids Analysis

Fatty acid methyl esters (FAMEs) were prepared according to previous reports [105], using 300 mg of grounded freeze-dried samples (3 replicates/sample). FAMEs were then analyzed on an Agilent 8860 GC system (Agilent Technologies, Santa Clara, CA, USA) equipped with autosampler and Flame Ionization Detector (FID). Separation was performed on an Agilent J&W DB-FastFame column (30 m × 0.25 mm × 0.25 μm). Adopted analytical conditions were as follows: carrier gas, hydrogen (10 psi, constant pressure mode); inlet, split mode (split ratio 64:1); inlet temperature 250 °C; oven, 80 °C (0.5 min), 40 °C/min to 165 °C (1 min), 4 °C/min to 230 °C (4 min); FID, 260 °C, Hydrogen (35 mL/min), Air (350 mL/min), Make-up gas 20 mL/min; and injection volume, 1 μL. Fatty acid methyl esters were identified by comparison of their retention times with those of reference standards (Supelco 37 Component FAME mix, 47885-U, Merck). Results were expressed as percentages of total fatty acid methyl esters.

4.12. RNA Extraction, cDNA Preparation and Expression Analysis via q-PCR

For RNA extraction, 200 mg of callus were ground under liquid nitrogen, lysed/homogenized with 1 mL of TRIzol (Thermo Fisher Scientific, #15596026), and, after addition of 0.2 mL of Phenol:Chloroform:Isoamyl-alcohol (25:24:1) and centrifugation (10 min, 13,000× g), the RNA was precipitated from the aqueous phase with 1 volume of isopropanol. Total RNA was treated using the Ambion TURBO DNA-free DNase (Thermo Fisher Scientific, #AM1907), and then reverse transcribed to cDNA using the High-Capacity cDNA Reverse Transcription Kit (Thermo Fisher Scientific, #4368814), according to the manufacturers’ instructions. q-PCR was performed on technical triplicates in 20 µL reactions, using the iQ5 real-time PCR detection system (Bio-Rad, Hercules, CA, USA) and 250 nM of each primer with SYBR Green PCR Master Mix (Bio-Rad, #175-5121). The q-PCR protocol used was: (95 °C 3 min) + 40 × [(95 °C 10 s) + (60 °C 30 s)], testing the melt curve over the 60 °C–95 °C range with +0.5 °C increments. The cDNA were standardized relative to the level of two different validated internal housekeeping genes: ELF1a/Ccrd_012208 [106] and ACT7-like/Ccrd_013113. Relative gene expression analysis was calculated with the 2−ΔΔCt method, using the Bio-Rad CFX Maestro software v. 4.0 (Bio-Rad). Student’s t-tests were run for each experiment to identify significant differences among samples (p < 0.01). Primers used in the experiments are listed in Table S6.

4.13. RNA-Seq, Read Mapping, Gene Expression Evaluation, GOEA Analysis and TF Prediction

Total RNAs were extracted in triplicates from four experimental groups: one WT, and three independent transgenic lines carrying the construct p35S::AtMYB4 (AtMYB4oe L1, L18 and L24), for a total of 12 samples. Preliminary analysis confirmed that all samples passed the quality control (A260/A280 = 2.10, total RNA amount > 10 µg/sample and RNA integrity number > 9). Sequencing libraries were prepared according to the manufacturer’s instructions using the Illumina TruSeq RNA Sample Prep kit, and sequenced on a NovaSeq 6000 Sequencing System (Illumina, San Diego, CA, USA) to obtain 15–22 M 150 bp paired-end reads per sample. In order to preserve the longest high-quality parts of reads, trimming was performed on raw sequencing data via BBDuk software (JGI), setting the minimum length to 35 bp and the quality score to 35. The Spliced Transcripts Alignment to a Reference (STAR) software [107] was used to align the reads to the Cynara cardunculus reference genome (version CcrdV1, Accession number GCA_001531365), and FPKM (fragments per kilobase of exon model per million reads mapped) values were calculated for all of the genes in order to obtain expression quantification in the 12 samples. The count matrix was filtered with the HTSfilter package [108] to eliminate the genes that created uninformative signal. The identification of the differentially expressed genes (DEGs) was performed with the package edgeR [109], setting the threshold for significance of False Discovery Rate (FDR, Benjamini–Hochberg correction to p-value) to FDR ≤ 0.05. Data validation of Fold change (FC) values obtained by RNA-seq analysis was performed via q-PCR on 10 different sequences selected among upregulated and downregulated DEGs (q-PCR conditions as described above), and the correlation coefficient was calculated from the comparison of log2FC values obtained with the two methods. An informative functional interpretation of the DEGs lists was derived from a Gene Ontology Enrichment Analysis (GOEA), carried out using AgriGO v.2.0 [110] and REVIGO [111]. Visualization of enriched GO terms was performed using CirGO [112]. Amino acid sequences of DEGs were submitted to the PlantTFDB webtool (http://planttfdb.gao-lab.org/, last accessed 4 November 2021) to identify genes encoding putative transcription factors among the DEGs [113]. The Kyoto Encyclopedia of Genes and Genomes (KEGG) database (www.genome.jp/kegg, last accessed 4 November 2021) was used to annotate DEGs in metabolic pathway of interest.

5. Conclusions

We have shown that the protocol we set up allows the stable genetic transformation of cardoon cells. The AtMYB4oe lines presented in this study proved to be valuable tools for their use in bioreactors. The main advantages of these lines are represented by their faster growth rate and improved accessibility of the biomass to enzymatic degradation, due to the reduction in lignin content, which also implies an easier extractability of compounds of interest, as well as an interesting modification in their nutraceutical value. The development of this technique represents a significant step towards the industrial use of cardoon cell cultures, which can be further improved targeting specific metabolic pathways of interest; two examples would be represented by targeting other MYB transcription factors involved in the production of specialized metabolites, or by the alteration of the activity of biosynthetic genes for fatty acids, both in the frame of gain or loss-of-function genetic approaches. Moreover, further exploration of the generated RNA-seq data could provide useful to further support molecular analyses of primary and specialized metabolic pathways of cardoon cell cultures. Finally, in order to evaluate whether the use of cardoon cells for biorefinery is energetically and economically sustainable, further studies on large-scale production are being conducted.

Supplementary Materials

Author Contributions

Conceptualization, D.P., F.L., E.C., M.D.P., T.D., M.T. and F.S.; methodology, D.P., F.L., S.P. and G.G.; investigation and formal analysis, D.P., F.L., E.C., R.P., S.P. and G.G; writing—original draft preparation, D.P.; writing—review and editing, D.P., F.L., E.C., R.P., M.D.P., T.D., M.T. and F.S; visualization, D.P., F.L. and R.P.; supervision, F.L., E.C. and F.S.; project administration, A.R., M.T. and F.S.; funding acquisition, A.R., M.T. and F.S. All authors have read and agreed to the published version of the manuscript.

Funding

This work was funded by Fondazione Cariplo as part of the project BOBCAT—Biotechnologies for Sustainable Production of Bio-Based Commodity and Specialty Products in a Cardoon-Based Biorefinery (2018-0955).

Data Availability Statement

All RNA-seq files are available from the NCBI GEO database (accession number GSE185693).

Acknowledgments

The authors wish to thank Elia Lacchini (VIB, Gent, Belgium) for providing the AGL1 strain of A. tumefaciens.

Conflicts of Interest

The authors declare no conflict of interest.

References

  1. Barracosa, P.; Barracosa, M.; Pires, E. Cardoon as a Sustainable Crop for Biomass and Bioactive Compounds Production. Chem. Biodivers. 2019, 16, e1900498. [Google Scholar] [CrossRef]
  2. Basnizki, J.; Zohary, D. Breeding of Seed-Planted Artichoke. In Plant Breeding Reviews; John Wiley & Sons, Inc.: Oxford, UK, 2010; pp. 253–269. [Google Scholar]
  3. Acquadro, A.; Barchi, L.; Portis, E.; Mangino, G.; Valentino, D.; Mauromicale, G.; Lanteri, S. Genome reconstruction in Cynara cardunculus taxa gains access to chromosome-scale DNA variation. Sci. Rep. 2017, 7, 5617. [Google Scholar] [CrossRef] [PubMed]
  4. Almeida, C.M.; Simões, I. Cardoon-based rennets for cheese production. Appl. Microbiol. Biotechnol. 2018, 102, 4675–4686. [Google Scholar] [CrossRef] [PubMed]
  5. Toscano, V.; Sollima, L.; Genovese, C.; Melilli, M.G.; Raccuia, S.A. Pilot plant system for biodiesel and pellet production from cardoon: Technical and economic feasibility. In Proceedings of the Acta Horticulturae, International Society for Horticultural Science, La Plata, Argentina, 17 November 2016; Volume 1147, pp. 429–442. [Google Scholar]
  6. Pappalardo, H.D.; Toscano, V.; Puglia, G.D.; Genovese, C.; Raccuia, S.A. Cynara cardunculus L. as a Multipurpose Crop for Plant Secondary Metabolites Production in Marginal Stressed Lands. Front. Plant Sci. 2020, 11, 240. [Google Scholar] [CrossRef] [PubMed]
  7. Gominho, J.; Curt, M.D.; Lourenço, A.; Fernández, J.; Pereira, H. Cynara cardunculus L. as a biomass and multi-purpose crop: A review of 30 years of research. Biomass Bioenergy 2018, 109, 257–275. [Google Scholar] [CrossRef]
  8. Colla, G.; Rouphael, Y.; Cardarelli, M.; Svecova, E.; Rea, E.; Lucini, L. Effects of saline stress on mineral composition, phenolic acids and flavonoids in leaves of artichoke and cardoon genotypes grown in floating system. J. Sci. Food Agric. 2013, 93, 1119–1127. [Google Scholar] [CrossRef]
  9. Docimo, T.; De Stefano, R.; Cappetta, E.; Piccinelli, A.L.; Celano, R.; De Palma, M.; Tucci, M. Physiological, Biochemical, and Metabolic Responses to Short and Prolonged Saline Stress in Two Cultivated Cardoon Genotypes. Plants 2020, 9, 554. [Google Scholar] [CrossRef]
  10. Gominho, J.; Lourenço, A.; Palma, P.; Lourenço, M.E.; Curt, M.D.; Fernández, J.; Pereira, H. Large scale cultivation of Cynara cardunculus L. for biomass production—A case study. Ind. Crop. Prod. 2011, 33, 1–6. [Google Scholar] [CrossRef]
  11. Sorrentino, M.C.; Capozzi, F.; Amitrano, C.; Giordano, S.; Arena, C.; Spagnuolo, V. Performance of three cardoon cultivars in an industrial heavy metal-contaminated soil: Effects on morphology, cytology and photosynthesis. J. Hazard. Mater. 2018, 351, 131–137. [Google Scholar] [CrossRef]
  12. Capozzi, F.; Sorrentino, M.C.; Caporale, A.G.; Fiorentino, N.; Giordano, S.; Spagnuolo, V. Exploring the phytoremediation potential of Cynara cardunculus: A trial on an industrial soil highly contaminated by heavy metals. Environ. Sci. Pollut. Res. 2020, 27, 9075–9084. [Google Scholar] [CrossRef]
  13. Piscioneri, I.; Sharma, N.; Baviello, G.; Orlandini, S. Promising industrial energy crop, Cynara cardunculus: A potential source for biomass production and alternative energy. Energy Convers. Manag. 2000, 41, 1091–1105. [Google Scholar] [CrossRef]
  14. Fernández, J.; Curt, M.D.; Aguado, P.L. Industrial applications of Cynara cardunculus L. for energy and other uses. Ind. Crop. Prod. 2006, 24, 222–229. [Google Scholar] [CrossRef]
  15. Mantineo, M.; D’Agosta, G.M.; Copani, V.; Patanè, C.; Cosentino, S.L. Biomass yield and energy balance of three perennial crops for energy use in the semi-arid Mediterranean environment. Field Crop. Res. 2009, 114, 204–213. [Google Scholar] [CrossRef]
  16. Foti, S.; Mauromicale, G.; Raccuia, S.A.; Fallico, B.; Fanella, F.; Maccarone, E. Possible alternative utilization of Cynara spp. I. Biomass, grain yield and chemical composition of grain. Ind. Crop. Prod. 1999, 10, 219–228. [Google Scholar] [CrossRef]
  17. Ierna, A.; Sortino, O.; Mauromicale, G. Biomass, seed and energy yield of Cynara cardunculus L. as affected by environment and season. Agronomy 2020, 10, 1584. [Google Scholar] [CrossRef]
  18. Gominho, J.; Fernandez, J.; Pereira, H. Cynara cardunculus L. A new fibre crop for pulp and paper production. Ind. Crop. Prod. 2001, 13, 1–10. [Google Scholar] [CrossRef]
  19. Barbosa, C.H.; Andrade, M.A.; Vilarinho, F.; Castanheira, I.; Fernando, A.L.; Loizzo, M.R.; Silva, A.S. A new insight on cardoon: Exploring new uses besides cheese making with a view to zero waste. Foods 2020, 9, 564. [Google Scholar] [CrossRef]
  20. Pandino, G.; Lombardo, S.; Mauromicale, G.; Williamson, G. Phenolic acids and flavonoids in leaf and floral stem of cultivated and wild Cynara cardunculus L. genotypes. Food Chem. 2011, 126, 417–422. [Google Scholar] [CrossRef]
  21. Pinelli, P.; Agostini, F.; Comino, C.; Lanteri, S.; Portis, E.; Romani, A. Simultaneous quantification of caffeoyl esters and flavonoids in wild and cultivated cardoon leaves. Food Chem. 2007, 105, 1695–1701. [Google Scholar] [CrossRef]
  22. Graziani, G.; Docimo, T.; De Palma, M.; Sparvoli, F.; Izzo, L.; Tucci, M.; Ritieni, A. Changes in Phenolics and Fatty Acids Composition and Related Gene Expression during the Development from Seed to Leaves of Three Cultivated Cardoon Genotypes. Antioxidants 2020, 9, 1096. [Google Scholar] [CrossRef]
  23. Kollia, E.; Markaki, P.; Zoumpoulakis, P.; Proestos, C. Antioxidant activity of Cynara scolymus L. and Cynara cardunculus L. extracts obtained by different extraction techniques. Nat. Prod. Res. 2017, 31, 1163–1167. [Google Scholar] [CrossRef] [PubMed]
  24. Falleh, H.; Ksouri, R.; Chaieb, K.; Karray-Bouraoui, N.; Trabelsi, N.; Boulaaba, M.; Abdelly, C. Phenolic composition of Cynara cardunculus L. organs, and their biological activities. Comptes Rendus Biol. 2008, 331, 372–379. [Google Scholar] [CrossRef]
  25. Naveed, M.; Hejazi, V.; Abbas, M.; Kamboh, A.A.; Khan, G.J.; Shumzaid, M.; Ahmad, F.; Babazadeh, D.; FangFang, X.; Modarresi-Ghazani, F.; et al. Chlorogenic acid (CGA): A pharmacological review and call for further research. Biomed. Pharmacother. 2018, 97, 67–74. [Google Scholar] [CrossRef]
  26. Mehmetçik, G.; Özdemirler, G.; Koçak-Toker, N.; Çevikbaş, U.; Uysal, M. Effect of pretreatment with artichoke extract on carbon tetrachloride-induced liver injury and oxidative stress. Exp. Toxicol. Pathol. 2008, 60, 475–480. [Google Scholar] [CrossRef] [PubMed]
  27. Küçükgergin, C.; Aydın, A.F.; Özdemirler-Erata, G.; Mehmetçik, G.; Koçak-Toker, N.; Uysal, M. Effect of artichoke leaf extract on hepatic and cardiac oxidative stress in rats fed on high cholesterol diet. Biol. Trace Elem. Res. 2010, 135, 264–274. [Google Scholar] [CrossRef]
  28. Kukić, J.; Popović, V.; Petrović, S.; Mucaji, P.; Ćirić, A.; Stojković, D.; Soković, M. Antioxidant and antimicrobial activity of Cynara cardunculus extracts. Food Chem. 2008, 107, 861–868. [Google Scholar] [CrossRef] [Green Version]
  29. Zoghlami, A.; Paës, G. Lignocellulosic Biomass: Understanding Recalcitrance and Predicting Hydrolysis. Front. Chem. 2019, 7, 874. [Google Scholar] [CrossRef] [Green Version]
  30. Kumar, A.K.; Sharma, S. Recent updates on different methods of pretreatment of lignocellulosic feedstocks: A review. Bioresour. Bioprocess. 2017, 4, 7. [Google Scholar] [CrossRef] [Green Version]
  31. Halpin, C. Lignin engineering to improve saccharification and digestibility in grasses. Curr. Opin. Biotechnol. 2019, 56, 223–229. [Google Scholar] [CrossRef] [Green Version]
  32. Maccarone, E.; Fallico, B.; Fanella, F.; Mauromicale, G.; Raccuia, S.A.; Foti, S. Possible alternative utilization of Cynara spp. II. Chemical characterization of their grain oil. Ind. Crop. Prod. 1999, 10, 229–237. [Google Scholar] [CrossRef]
  33. Lavermicocca, P.; Rossi, M.; Russo, F.; Srirajaskanthan, R. Chapter 77—Table Olives: A Carrier for Delivering Probiotic Bacteria to Humans A2—Preedy, Victor R; Academic Press: New York, NY, USA, 2010; pp. 735–743. [Google Scholar]
  34. Wellenreuther, C.; Wolf, A. Innovative Feedstocks in Biodegradable Bio-Based Plastics: A Literature Review; Hamburgisches Welt-Wirtschafts-Archiv (HWWA): Hamburg, Germany, 2020. [Google Scholar]
  35. Koh, M.Y.; Tinia, T.I. A review of biodiesel production from Jatropha curcas L. oil. Renew. Sustain. Energy Rev. 2011, 15, 2240–2251. [Google Scholar] [CrossRef]
  36. Metzger, J.O.; Bornscheuer, U. Lipids as renewable resources: Current state of chemical and biotechnological conversion and diversification. Appl. Microbiol. Biotechnol. 2006, 71, 13–22. [Google Scholar] [CrossRef] [PubMed]
  37. Ierna, A.; Mauro, R.P.; Mauromicale, G. Biomass, grain and energy yield in Cynara cardunculus L. as affected by fertilization, genotype and harvest time. Biomass Bioenergy 2012, 36, 404–410. [Google Scholar] [CrossRef]
  38. Ottaiano, L.; Di Mola, I.; Impagliazzo, A.; Cozzolino, E.; Masucci, F.; Mori, M.; Fagnano, M. Yields and quality of biomasses and grain in Cynara cardunculus L. grown in southern Italy, as affected by genotype and environmental conditions. Ital. J. Agron. 2017, 12, 375–382. [Google Scholar] [CrossRef] [Green Version]
  39. Pandino, G.; Lombardo, S.; Moglia, A.; Portis, E.; Lanteri, S.; Mauromicale, G. Leaf polyphenol profile and SSR-based fingerprinting of new segregant Cynara cardunculus genotypes. Front. Plant Sci. 2015, 5, 800. [Google Scholar] [CrossRef] [Green Version]
  40. Sharma, A.; Shahzad, B.; Rehman, A.; Bhardwaj, R.; Landi, M.; Zheng, B. Response of phenylpropanoid pathway and the role of polyphenols in plants under abiotic stress. Molecules 2019, 24, 2452. [Google Scholar] [CrossRef] [PubMed] [Green Version]
  41. Curt, M.D.; Sánchez, G.; Fernández, J. The potential of Cynara cardunculus L. for seed oil production in a perennial cultivation system. Biomass Bioenergy 2002, 23, 33–46. [Google Scholar] [CrossRef]
  42. Raccuia, S.A.; Piscioneri, I.; Sharma, N.; Melilli, M.G. Genetic variability in Cynara cardunculus L. domestic and wild types for grain oil production and fatty acids composition. Biomass Bioenergy 2011, 35, 3167–3173. [Google Scholar] [CrossRef]
  43. Balestrini, R.; Brunetti, C.; Cammareri, M.; Caretto, S.; Cavallaro, V.; Cominelli, E.; De Palma, M.; Docimo, T.; Giovinazzo, G.; Grandillo, S.; et al. Strategies to Modulate Specialized Metabolism in Mediterranean Crops: From Molecular Aspects to Field. Int. J. Mol. Sci. 2021, 22, 2887. [Google Scholar] [CrossRef]
  44. Nielsen, E.; Temporiti, M.E.E.; Cella, R. Improvement of phytochemical production by plant cells and organ culture and by genetic engineering. Plant Cell Rep. 2019, 38, 1199–1215. [Google Scholar] [CrossRef]
  45. Ferid, A.; Mohammed, A.; Khalivulla, S.I.; Korivi, M.; Abdul Razab, M.K.A. Plant Cell and Callus Cultures as an Alternative Source of Bioactive Compounds with Therapeutic Potential against Coronavirus Disease (COVID-19). IOP Conf. Ser. Earth Environ. Sci. 2020, 596, 012099. [Google Scholar] [CrossRef]
  46. Ramachandra Rao, S.; Ravishankar, G.A. Plant cell cultures: Chemical factories of secondary metabolites. Biotechnol. Adv. 2002, 20, 101–153. [Google Scholar] [CrossRef]
  47. Efferth, T. Biotechnology Applications of Plant Callus Cultures. Engineering 2019, 5, 50–59. [Google Scholar] [CrossRef]
  48. Anwar, M.; Chen, L.; Xiao, Y.; Wu, J.; Zeng, L.; Li, H.; Wu, Q.; Hu, Z. Recent Advanced Metabolic and Genetic Engineering of Phenylpropanoid Biosynthetic Pathways. Int. J. Mol. Sci. 2021, 22, 9544. [Google Scholar] [CrossRef]
  49. Jin, H.; Cominelli, E.; Bailey, P.; Parr, A.; Mehrtens, F.; Jones, J.; Tonelli, C.; Weisshaar, B.; Martin, C. Transcriptional repression by AtMYB4 controls production of UV-protecting sunscreens in Arabidopsis. EMBO J. 2000, 19, 6150–6161. [Google Scholar] [CrossRef] [PubMed] [Green Version]
  50. Ma, D.; Constabel, C.P. MYB Repressors as Regulators of Phenylpropanoid Metabolism in Plants. Trends Plant Sci. 2019, 24, 275–289. [Google Scholar] [CrossRef] [PubMed]
  51. Fornalé, S.; Shi, X.; Chai, C.; Encina, A.; Irar, S.; Capellades, M.; Fuguet, E.; Torres, J.-L.; Rovira, P.; Puigdomènech, P.; et al. ZmMYB31 directly represses maize lignin genes and redirects the phenylpropanoid metabolic flux. Plant J. 2010, 64, 633–644. [Google Scholar] [CrossRef]
  52. Sonbol, F.M.; Fornalé, S.; Capellades, M.; Encina, A.; Touriño, S.; Torres, J.L.; Rovira, P.; Ruel, K.; Puigdomènech, P.; Rigau, J.; et al. The maize ZmMYB42 represses the phenylpropanoid pathway and affects the cell wall structure, composition and degradability in Arabidopsis thaliana. Plant Mol. Biol. 2009, 70, 283–296. [Google Scholar] [CrossRef]
  53. Ma, Q.H.; Wang, C.; Zhu, H.H. TaMYB4 cloned from wheat regulates lignin biosynthesis through negatively controlling the transcripts of both cinnamyl alcohol dehydrogenase and cinnamoyl-CoA reductase genes. Biochimie 2011, 93, 1179–1186. [Google Scholar] [CrossRef]
  54. Wei, Q.; Zhang, F.; Sun, F.; Luo, Q.; Wang, R.; Hu, R.; Chen, M.; Chang, J.; Yang, G.; He, G. A wheat MYB transcriptional repressor TaMyb1D regulates phenylpropanoid metabolism and enhances tolerance to drought and oxidative stresses in transgenic tobacco plants. Plant Sci. 2017, 265, 112–123. [Google Scholar] [CrossRef]
  55. Rao, X.; Chen, X.; Shen, H.; Ma, Q.; Li, G.; Tang, Y.; Pena, M.; York, W.; Frazier, T.P.; Lenaghan, S.; et al. Gene regulatory networks for lignin biosynthesis in switchgrass (Panicum virgatum). Plant Biotechnol. J. 2019, 17, 580–593. [Google Scholar] [CrossRef]
  56. Yang, L.; Zhao, X.; Ran, L.; Li, C.; Fan, D.; Luo, K. PtoMYB156 is involved in negative regulation of phenylpropanoid metabolism and secondary cell wall biosynthesis during wood formation in poplar. Sci. Rep. 2017, 7, 41209. [Google Scholar] [CrossRef] [PubMed] [Green Version]
  57. Miyamoto, T.; Takada, R.; Tobimatsu, Y.; Takeda, Y.; Suzuki, S.; Yamamura, M.; Osakabe, K.; Osakabe, Y.; Sakamoto, M.; Umezawa, T. OsMYB108 loss-of-function enriches p-coumaroylated and tricin lignin units in rice cell walls. Plant J. 2019, 98, 14290. [Google Scholar] [CrossRef]
  58. Fornalé, S.; Lopez, E.; Salazar-Henao, J.E.; Fernández-Nohales, P.; Rigau, J.; Caparros-Ruiz, D. AtMYB7, a new player in the regulation of UV-sunscreens in arabidopsis thaliana. Plant Cell Physiol. 2014, 55, 507–516. [Google Scholar] [CrossRef] [PubMed]
  59. Li, M.; Li, Y.; Guo, L.; Gong, N.; Pang, Y.; Jiang, W.; Liu, Y.; Jiang, X.; Zhao, L.; Wang, Y.; et al. Functional characterization of tea (Camellia sinensis) MYB4a transcription factor using an integrative approach. Front. Plant Sci. 2017, 8, 943. [Google Scholar] [CrossRef] [Green Version]
  60. Wang, X.C.; Wu, J.; Guan, M.L.; Zhao, C.H.; Geng, P.; Zhao, Q. Arabidopsis MYB4 plays dual roles in flavonoid biosynthesis. Plant J. 2020, 101, 637–652. [Google Scholar] [CrossRef] [PubMed]
  61. Nuno de Sousa Sampaio, P.; Neto, H.; Poejo, P.; Serrazina, S.M.T.; Pais, M.S.S. Overexpression and characterization of cyprosin B in transformed suspension cells of Cynara cardunculus. Plant Cell Tissue Organ Cult. 2010, 101, 311–321. [Google Scholar] [CrossRef]
  62. Menin, B.; Moglia, A.; Comino, C.; Lanteri, S.; Van Herpen, T.W.J.M.; Beekwilder, J. In vitro callogenesis and agrobacterium-mediated transformation of globe artichoke. Acta Hortic. 2012, 961, 267–271. [Google Scholar] [CrossRef] [Green Version]
  63. Maroufi, A.; Karimi, M.; Mehdikhanlou, K.; De Loose, M. Inulin chain length modification using a transgenic approach opening new perspectives for chicory. 3 Biotech 2018, 8, 349. [Google Scholar] [CrossRef]
  64. Ainasoja, M.M.; Pohjala, L.L.; Tammela, P.S.M.; Somervuo, P.J.; Vuorela, P.M.; Teeri, T.H. Comparison of transgenic Gerbera hybrida lines and traditional varieties shows no differences in cytotoxicity or metabolic fingerprints. Transgenic Res. 2008, 17, 793–803. [Google Scholar] [CrossRef] [PubMed]
  65. Tamagnone, L.; Merida, A.; Parr, A.; Mackay, S.; Culianez-Macia, F.A.; Roberts, K.; Martin, C. The AmMYB308 and AmMYB330 transcription factors from antirrhinum regulate phenylpropanoid and lignin biosynthesis in transgenic tobacco. Plant Cell 1998, 10, 135–154. [Google Scholar] [CrossRef] [Green Version]
  66. Shen, H.; He, X.; Poovaiah, C.R.; Wuddineh, W.A.; Ma, J.; Mann, D.G.J.; Wang, H.; Jackson, L.; Tang, Y.; Neal Stewart, J.; et al. Functional characterization of the switchgrass (Panicum virgatum) R2R3-MYB transcription factor PvMYB4 for improvement of lignocellulosic feedstocks. New Phytol. 2012, 193, 121–136. [Google Scholar] [CrossRef]
  67. Bonawitz, N.D.; Soltau, W.L.; Blatchley, M.R.; Powers, B.L.; Hurlock, A.K.; Seals, L.A.; Weng, J.K.; Stout, J.; Chapple, C. REF4 and RFR1, subunits of the transcriptional coregulatory complex mediator, are required for phenylpropanoid homeostasis in Arabidopsis. J. Biol. Chem. 2012, 287, 5434–5445. [Google Scholar] [CrossRef] [Green Version]
  68. Muro-Villanueva, F.; Mao, X.; Chapple, C. Linking phenylpropanoid metabolism, lignin deposition, and plant growth inhibition. Curr. Opin. Biotechnol. 2019, 56, 202–208. [Google Scholar] [CrossRef] [PubMed]
  69. Valdiani, A.; Hansen, O.K.; Nielsen, U.B.; Johannsen, V.K.; Shariat, M.; Georgiev, M.I.; Omidvar, V.; Ebrahimi, M.; Tavakoli Dinanai, E.; Abiri, R. Bioreactor-based advances in plant tissue and cell culture: Challenges and prospects. Crit. Rev. Biotechnol. 2019, 39, 20–34. [Google Scholar] [CrossRef]
  70. Figueiredo, A.C.; Fevereiro, P.; Cabral, J.M.S.; Novais, J.M.; Salomé, M.; Pais, S. Callus and suspension cultures for biomass production of Cynara cardunculus (Compositae). Biotechnol. Lett. 1987, 9, 213–218. [Google Scholar] [CrossRef]
  71. Cordeiro, M.C.; Pais, M.S.; Brodelius, P.E. Cynara cardunculus subsp.flavescens (Cardoon): In Vitro Culture, and the Production of Cyprosins—Milk-Clotting Enzymes. Biotechnol. Agric. For. 1998, 41, 132–153. [Google Scholar] [CrossRef]
  72. van Damme, D.; de Rybel, B.; Gudesblat, G.; Demidov, D.; Grunewald, W.; de Smet, I.; Houben, A.; Beeckman, T.; Russinova, E. Arabidopsis α Aurora kinases function in formative cell division plane orientation. Plant Cell 2011, 23, 4013–4024. [Google Scholar] [CrossRef] [Green Version]
  73. Himanen, K.; Boccardi, T.M.; De Rycke, R.; Odeny, O.P.; Van Lijsebettens, M. Is HUB1 a hub for plant fitness? Plant Signal. Behav. 2012, 7, 1537–1540. [Google Scholar] [CrossRef] [Green Version]
  74. Shi, J.; Zhang, Q.; Yan, X.; Zhang, D.; Zhou, Q.; Shen, Y.; Anupol, N.; Wang, X.; Bao, M.; Larkin, R.M.; et al. A conservative pathway for coordination of cell wall biosynthesis and cell cycle progression in plants. Plant J. 2021, 106, 630–648. [Google Scholar] [CrossRef]
  75. Mu, R.L.; Cao, Y.R.; Liu, Y.F.; Lei, G.; Zou, H.F.; Liao, Y.; Wang, H.W.; Zhang, W.K.; Ma, B.; Du, J.Z.; et al. An R2R3-type transcription factor gene AtMYB59 regulates root growth and cell cycle progression in Arabidopsis. Cell Res. 2009, 19, 1291–1304. [Google Scholar] [CrossRef] [PubMed] [Green Version]
  76. Brownfield, L.; Hafidh, S.; Borg, M.; Sidorova, A.; Mori, T.; Twell, D. A plant germline-specific integrator of sperm specification and cell cycle progression. PLoS Genet. 2009, 5, e1000430. [Google Scholar] [CrossRef] [PubMed] [Green Version]
  77. Vanneste, S.; Coppens, F.; Lee, E.; Donner, T.J.; Xie, Z.; Van Isterdael, G.; Dhondt, S.; De Winter, F.; De Rybel, B.; Vuylsteke, M.; et al. Developmental regulation of CYCA2s contributes to tissue-specific proliferation in Arabidopsis. EMBO J. 2011, 30, 3430–3441. [Google Scholar] [CrossRef] [PubMed] [Green Version]
  78. Xie, Z.; Lee, E.; Lucas, J.R.; Morohashi, K.; Li, D.; Murray, J.A.H.; Sack, F.D.; Grotewolda, E. Regulation of cell proliferation in the stomatal lineage by the Arabidopsis MYB FOUR LIPS via direct targeting of core cell cycle genes. Plant Cell 2010, 22, 2306–2321. [Google Scholar] [CrossRef] [Green Version]
  79. Yang, K.; Li, L.; Lou, Y.; Zhu, C.; Li, X.; Gao, Z. A regulatory network driving shoot lignification in rapidly growing bamboo. Plant Physiol. 2021, 187, 900–916. [Google Scholar] [CrossRef] [PubMed]
  80. Sablowski, R.; Carnier Dornelas, M. Interplay between cell growth and cell cycle in plants. J. Exp. Bot. 2014, 65, 2703–2714. [Google Scholar] [CrossRef] [Green Version]
  81. Oliveira, D.M.; Mota, T.R.; Grandis, A.; de Morais, G.R.; de Lucas, R.C.; Polizeli, M.L.T.M.; Marchiosi, R.; Buckeridge, M.S.; Ferrarese-Filho, O.; dos Santos, W.D. Lignin plays a key role in determining biomass recalcitrance in forage grasses. Renew. Energy 2020, 147, 2206–2217. [Google Scholar] [CrossRef]
  82. Wang, N.; Wang, K.Y.; Li, G.; Guo, W.; Liu, D. Expression and characterization of camel chymosin in Pichia pastoris. Protein Expr. Purif. 2015, 111, 75–81. [Google Scholar] [CrossRef]
  83. Trajtemberg, S.P.; Apóstolo, N.M.; Fernández, G. Calluses of Cynara cardunculus Var. Cardunculus cardoon (Asteraceae): Determination of cynarine and chlorogenic acid by automated high-performance capillary electrophoresis. Vitr. Cell. Dev. Biol. Plant 2006, 42, 534–537. [Google Scholar] [CrossRef]
  84. Correa, S.M.; Atehortúa, L. Lipid Profile of In Vitro Oil Produced through Cell Culture of Jatropha curcas. J. AOAC Int. 2012, 95, 1161–1169. [Google Scholar] [CrossRef]
  85. Hernández, M.L.; Sicardo, M.D.; Alfonso, M.; Martínez-Rivas, J.M. Transcriptional Regulation of Stearoyl-Acyl Carrier Protein Desaturase Genes in Response to Abiotic Stresses Leads to Changes in the Unsaturated Fatty Acids Composition of Olive Mesocarp. Front. Plant Sci. 2019, 10, 251. [Google Scholar] [CrossRef] [PubMed] [Green Version]
  86. Kummerow, F.A. The negative effects of hydrogenated trans fats and what to do about them. Atherosclerosis 2009, 205, 458–465. [Google Scholar] [CrossRef] [PubMed]
  87. Simopoulos, A.P. The importance of the ratio of omega-6/omega-3 essential fatty acids. Biomed. Pharm. 2002, 56, 365–379. [Google Scholar] [CrossRef]
  88. Lee, K.-R.; Jeon, I.; Yu, H.; Kim, S.-G.; Kim, H.-S.; Ahn, S.-J.; Lee, J.; Lee, S.-K.; Kim, H.U. Increasing Monounsaturated Fatty Acid Contents in Hexaploid Camelina sativa Seed Oil by FAD2 Gene Knockout Using CRISPR-Cas9. Front. Plant Sci. 2021, 0, 1279. [Google Scholar] [CrossRef]
  89. Damude, H.G.; Kinney, A.J. Enhancing Plant Seed Oils for Human Nutrition. Plant Physiol. 2008, 147, 962. [Google Scholar] [CrossRef] [Green Version]
  90. Beló, A.; Zheng, P.; Luck, S.; Shen, B.; Meyer, D.J.; Li, B.; Tingey, S.; Rafalski, A. Whole genome scan detects an allelic variant of fad2 associated with increased oleic acid levels in maize. Mol. Genet. Genom. 2008, 279, 1–10. [Google Scholar] [CrossRef]
  91. Zhang, L.; Yang, X.D.; Zhang, Y.Y.; Yang, J.; Qi, G.X.; Guo, D.Q.; Xing, G.J.; Yao, Y.; Xu, W.J.; Li, H.Y.; et al. Changes in oleic acid content of transgenic soybeans by antisense RNA mediated posttranscriptional gene silencing. Int. J. Genom. 2014, 2014, 921950. [Google Scholar] [CrossRef] [Green Version]
  92. Patel, M.; Jung, S.; Moore, K.; Powell, G.; Ainsworth, C.; Abbott, A. High-oleate peanut mutants result from a MITE insertion into the FAD2 gene. Theor. Appl. Genet. 2004, 108, 1492–1502. [Google Scholar] [CrossRef]
  93. Cheng, T.; Zhao, P.; Ren, Y.; Zou, J.; Sun, M.-X. AtMIF1 increases seed oil content by attenuating GL2 inhibition. New Phytol. 2021, 229, 2152–2162. [Google Scholar] [CrossRef]
  94. Gou, M.; Hou, G.; Yang, H.; Zhang, X.; Cai, Y.; Kai, G.; Liu, C.-J. The MYB107 Transcription Factor Positively Regulates Suberin Biosynthesis. Plant Physiol. 2017, 173, 1045. [Google Scholar] [CrossRef] [Green Version]
  95. Meï, C.; Michaud, M.; Cussac, M.; Albrieux, C.; Gros, V.; Maréchal, E.; Block, M.A.; Jouhet, J.; Rébeillé, F. Levels of polyunsaturated fatty acids correlate with growth rate in plant cell cultures. Sci. Rep. 2015, 5, 15207. [Google Scholar] [CrossRef] [PubMed] [Green Version]
  96. Bidabadi, S.S.; Mohan Jain, S. Cellular, molecular, and physiological aspects of in vitro plant regeneration. Plants 2020, 9, 702. [Google Scholar] [CrossRef] [PubMed]
  97. Comino, C.; Moglia, A.; Repetto, A.; Tavazza, R. Globe Artichoke Tissue Culture and Its Biotechnological Application. Globe Artichoke Genome 2019, 41–64. [Google Scholar] [CrossRef]
  98. Blom, T.J.M.; Kreis, W.; van Iren, F.; Libbenga, K.R. A non-invasive method for the routine-estimation of fresh weight of cells grown in batch suspension cultures. Plant Cell Rep. 1992, 11, 146–149. [Google Scholar] [CrossRef] [PubMed]
  99. Karimi, M.; Inzé, D.; Depicker, A. GATEWAYTM vectors for Agrobacterium-mediated plant transformation. Trends Plant Sci. 2002, 7, 193–195. [Google Scholar] [CrossRef]
  100. Haas, J.H.; Ream, W.; Manulis, S. Universal PCR Primers for Detection of Phytopathogenic. Microbiology 1995, 61, 2879–2884. [Google Scholar]
  101. Gabotti, D.; Locatelli, F.; Cusano, E.; Baldoni, E.; Genga, A.; Pucci, L.; Consonni, R.; Mattana, M. Cell suspensions of Cannabis sativa (var. futura): Effect of elicitation on metabolite content and antioxidant activity. Molecules 2019, 24, 4056. [Google Scholar] [CrossRef] [Green Version]
  102. Docimo, T.; Consonni, R.; Coraggio, I.; Mattana, M. Early phenylpropanoid biosynthetic steps in Cannabis sativa: Link between genes and metabolites. Int. J. Mol. Sci. 2013, 14, 13626–13644. [Google Scholar] [CrossRef] [Green Version]
  103. Acker, R.; Vanholme, R.; Piens, K.; Boerjan, W. Saccharification Protocol for Small-scale Lignocellulosic Biomass Samples to Test Processing of Cellulose into Glucose. Bio-Protocol 2016, 6, e1701. [Google Scholar] [CrossRef] [Green Version]
  104. Kostić, M.D.; Joković, N.M.; Stamenković, O.S.; Rajković, K.M.; Milić, P.S.; Veljković, V.B. Optimization of hempseed oil extraction by n-hexane. Ind. Crop. Prod. 2013, 48, 133–143. [Google Scholar] [CrossRef]
  105. O’Fallon, J.V.; Busboom, J.R.; Nelson, M.L.; Gaskins, C.T. A direct method for fatty acid methyl ester synthesis: Application to wet meat tissues, oils, and feedstuffs. J. Anim. Sci. 2007, 85, 1511–1521. [Google Scholar] [CrossRef] [PubMed] [Green Version]
  106. Sonnante, G.; D’Amore, R.; Blanco, E.; Pierri, C.L.; de Palma, M.; Luo, J.; Tucci, M.; Martin, C. Novel hydroxycinnamoyl-coenzyme a quinate transferase genes from artichoke are involved in the synthesis of chlorogenic acid. Plant Physiol. 2010, 153, 1224–1238. [Google Scholar] [CrossRef] [PubMed] [Green Version]
  107. Dobin, A.; Davis, C.A.; Schlesinger, F.; Drenkow, J.; Zaleski, C.; Jha, S.; Batut, P.; Chaisson, M.; Gingeras, T.R. STAR: Ultrafast universal RNA-seq aligner. Bioinformatics 2013, 29, 15–21. [Google Scholar] [CrossRef]
  108. Rau, A.; Gallopin, M.; Celeux, G.; Jaffrézic, F. Data-based filtering for replicated high-throughput transcriptome sequencing experiments. Bioinformatics 2013, 29, 2146–2152. [Google Scholar] [CrossRef] [Green Version]
  109. Robinson, M.D.; McCarthy, D.J.; Smyth, G.K. edgeR: A Bioconductor package for differential expression analysis of digital gene expression data. Bioinformatics 2010, 26, 139–140. [Google Scholar] [CrossRef] [PubMed] [Green Version]
  110. Tian, T.; Liu, Y.; Yan, H.; You, Q.; Yi, X.; Du, Z.; Xu, W.; Su, Z. AgriGO v2.0: A GO analysis toolkit for the agricultural community, 2017 update. Nucleic Acids Res. 2017, 45, W122–W129. [Google Scholar] [CrossRef]
  111. Supek, F.; Bošnjak, M.; Škunca, N.; Šmuc, T. REVIGO Summarizes and Visualizes Long Lists of Gene Ontology Terms. PLoS ONE 2011, 6, e21800. [Google Scholar] [CrossRef] [Green Version]
  112. Kuznetsova, I.; Lugmayr, A.; Siira, S.J.; Rackham, O.; Filipovska, A. CirGO: An alternative circular way of visualising gene ontology terms. BMC Bioinform. 2019, 20, 84. [Google Scholar] [CrossRef] [Green Version]
  113. Jin, J.; Tian, F.; Yang, D.C.; Meng, Y.Q.; Kong, L.; Luo, J.; Gao, G. PlantTFDB 4.0: Toward a central hub for transcription factors and regulatory interactions in plants. Nucleic Acids Res. 2017, 45, D1040–D1045. [Google Scholar] [CrossRef] [Green Version]
Figure 1. Phenotype and growth of cardoon lines: (a) Calluses of wild type (WT) and AtMYBoe lines (L1, L18, L24) grown for 21 days on solid medium; (b) Relative expression level (mean ± standard deviation, S.D.) of the transgene in the three lines selected for this study. Asterisks indicate significant differences (p < 0.01); (c) Growth curves for calluses grown on solid medium (left) and for cell suspension grown in liquid medium (right). CVS: cell volume after sedimentation. Each value represents the mean of three biological replicates ± S.D.
Ijms 22 11978 g001
Figure 2. Phenols/lignin content and saccharification yields of 21 days-old calluses: (a) Folin–Ciocalteu’s quantification of total phenols, expressed as mg of GAE (Gallic Acid Equivalents)/g dry weight (DW) ± S.D; (b) quantification of lignin via thioglycolic acid (TGA) derivatization. Bars indicate means ± S.D. of three biological replicates. Different letters above bars indicate statistically significant differences (p < 0.01); (c) saccharification yields expressed as mean values of µg released glucose/mg DW ± S.D.
Ijms 22 11978 g002
Figure 3. Differentially expressed genes (DEGs) between AtMYB4oe lines and WT: Venn diagrams of the number of (a) downregulated and (b) upregulated genes for all comparisons (FDR < 0.05).
Ijms 22 11978 g003
Figure 4. Gene Ontology Expression Analysis: Gene Ontology (a) downregulated and (b) upregulated terms referred to biological processes enriched among core-DEGs.
Ijms 22 11978 g004
Figure 5. Biosynthetic pathway of phenylpropanoids and average expression levels of the relative genes in AtMYB4oe lines vs. WT.
Ijms 22 11978 g005
Figure 6. Biosynthesis of oleic acid and average expression levels of the relative genes in AtMYB4oe lines vs. WT.
Ijms 22 11978 g006
Table 1. Biochemical characterization of WT and AtMYB4oe lines. Polyphenols content detected by HRMS-Orbitrap: values are expressed in ppm = µg/g dry weight, DW. 5-iFQA = 5-isoferuloyl quinic acid; 1,5-DiCQA = 1,5-dicaffeoyl quinic acid (cynarin); 3,4-DiCQA = 3,4-dicaffeoyl quinic acid; 5-FQA = 5-feruloyl quinic acid; 3-FQA = 3-feruloyl quinic acid; 3-CQA = 3-caffeoyl quinic acid (chlorogenic acid, CGA). Antioxidant activities were measured via 2,2-diphenyl-1-picrylhydrazyl (DPPH), 2,2’-azino-bis 3-ethylbenzothiazoline-6-sulfonic acid (ABTS) and Ferric Reducing Antioxidant Power (FRAP) assays. Values are expressed as TEAC: Trolox®-equivalent antioxidant capacity mmol Trolox/kg DW. Each value shown represents the mean values ± S.D. of three biological and two technical replicates. Fatty acids content was detected by GC-FID. Values are expressed as % of total; SFA = saturated fatty acids; MUFA = monounsaturated fatty acids; PUFA = polyunsaturated fatty acids. Different letters denote a significant difference among lines through analysis of variance (ANOVA). Statistical significance was defined as p < 0.05, using the Tukey’s post hoc test for mean separation.
WTL1L18L24
Polyphenols (µg/g DW)5-iFQA21.50 ± 1.33a15.41 ± 0.43b0.11 ± 0.04c4.26 ± 0.12d
1,5-DiCQA (cynarin)3345.79 ± 112.23a532.70 ± 11.55b2.50 ± 0.81c352.98 ± 21.71d
3,4-DiCQA3152.41 ± 26.67a443.88 ± 12.43b103.58 ± 8.23c1615.65 ± 34.56d
5-FQA98.87 ± 11.34a5.56 ± 0.43b0.83 ± 0.011c76.44 ± 11.34d
3-FQA3.09 ± 0.55a2.71 ± 0.91b0.10 ± 0.01c10.20 ± 0.23d
3-CQA (CGA)319.38 ± 22.45a424.66 ± 11.32b97.28 ± 3.56c513.48 ± 13.57d
p-coumaric acid3.50 ± 0.02a3.75 ± 0.91a1.50 ± 0.01b3.85 ± 0.02a
Quercetin3.35 ± 0.02a4.30 ± 0.02b0.55 ± 0.01c4.35 ± 0.02b
Quercetin-glucoside4.00 ± 0.65a5.25 ± 1.23b1.25 ± 0.03c5.40 ± 0.34b
Kaempferol3.55 ± 0.65a4.30 ± 0.91b1.05 ± 0.03c4.55 ± 0.83d
Kaempferol-3-O-glucoside1.15 ± 0.02a1.50 ± 0.03b0.40 ± 0.04c1.60 ± 0.04b
Naringin1.20 ± 0.01a1.75 ± 0.01b0.41 ± 0.03c1.800.03b
Luteolin1.50 ± 0.03a2.35 ± 0.02b0.60 ± 0.04c2.55 ± 0.04d
Myricetin2.55 ± 0.34a2.96 ± 0.32b0.73 ± 0.11c3.04 ± 0.12b
Apigenin0.20 ± 0.03a0.25 ± 0.02b0.01 ± 0.003c0.30 ± 0.01d
Total polyphenols6962.05a1451.33b210.92c2600.46d
Antiox. activity (TEAC)DPPH83.7 ± 0.61a22.17 ± 0.42b16.96 ± 0.63c35.43 ± 5.82d
ABTS71.33 ± 0.20a19.16 ± 0.07b12.54 ± 0.26c23.61 ± 0.22d
FRAP66.81 ± 0.98a30.84 ± 0.21b11.09 ± 0.08c27.90 ± 0.54d
Oil % 11.388.2410.357.25
Fatty acids (%)Palmitic (C16:0)22.29 ± 1.12ab21.71 ± 0.58a24.06 ± 0.35b19.46 ± 0.38c
Stearic (C18:0)2.85 ± 0.31ab3.14 ± 0.54ab2.29 ± 0.07a3.73 ± 0.26b
Oleic (C18:1)3.43 ± 1.91a10.30 ± 0.56b3.49 ± 0.27a12.35 ± 0.16c
Linoleic (C18:2)19.38 ± 3.74a45.82 ± 0.85b41.04 ± 0.61c41.34 ± 0.39c
Linolenic (C18:3)42.60 ± 6.34a10.16 ± 0.38b20.73 ± 0.74c14.46 ± 0.06d
Arachidic (C20:0)0.80 ± 0.08a0.88 ± 0.01a0.84 ± 0.05a1.04 ± 0.05b
Lignoceric (C24:0)2.42 ± 0.30a3.26 ± 1.59a2.41 ± 0.58a2.40 ± 0.68a
Nervonic (C24:1)1.23 ± 0.14a0.18 ± 0.03b0.52 ± 0.47ab0.66 ± 0.12ab
Total SFA%30.54 ± 0.78ab30.29 ± 0.76a32.07 ± 0.43b28.00 ± 0.10c
Total MUFA %4.65 ± 1.777a10.48 ± 0.30b4.02 ± 0.21a13.01 ± 0.28c
Total PUFA %61.98 ± 2.88a55.98 ± 0.80b61.77 ± 0.41a55.81 ± 0.42b
Others %2.833.252.143.18
Table 2. Genes coding for transcription factors identified among the core-DEGs.
Number of Core-DEGs
TF FamilyDownregulatedUpregulated
AP213
bHLH711
bZIP54
C2H216
C3H2-
Dof31
ERF26
FAR112
G2-like13
GRAS37
HB-other2-
HSF11
LBD34
MIKC_MADS42
M-type MADS22
MYB14
MYB_related65
NAC143
NF-YA1-
Nin-like1-
S1Fa-like1-
TALE23
TCP1-
Trihelix11
WOX2-
WRKY96
ZF-HD11
Publisher’s Note: MDPI stays neutral with regard to jurisdictional claims in published maps and institutional affiliations.

