
Insight into Details of the Photosynthetic Light Reactions and Selected Metabolic Changes in Tomato Seedlings Growing under Various Light Spectra

 , , , ,
Abstract
:1. Introduction
2. Results and Discussion
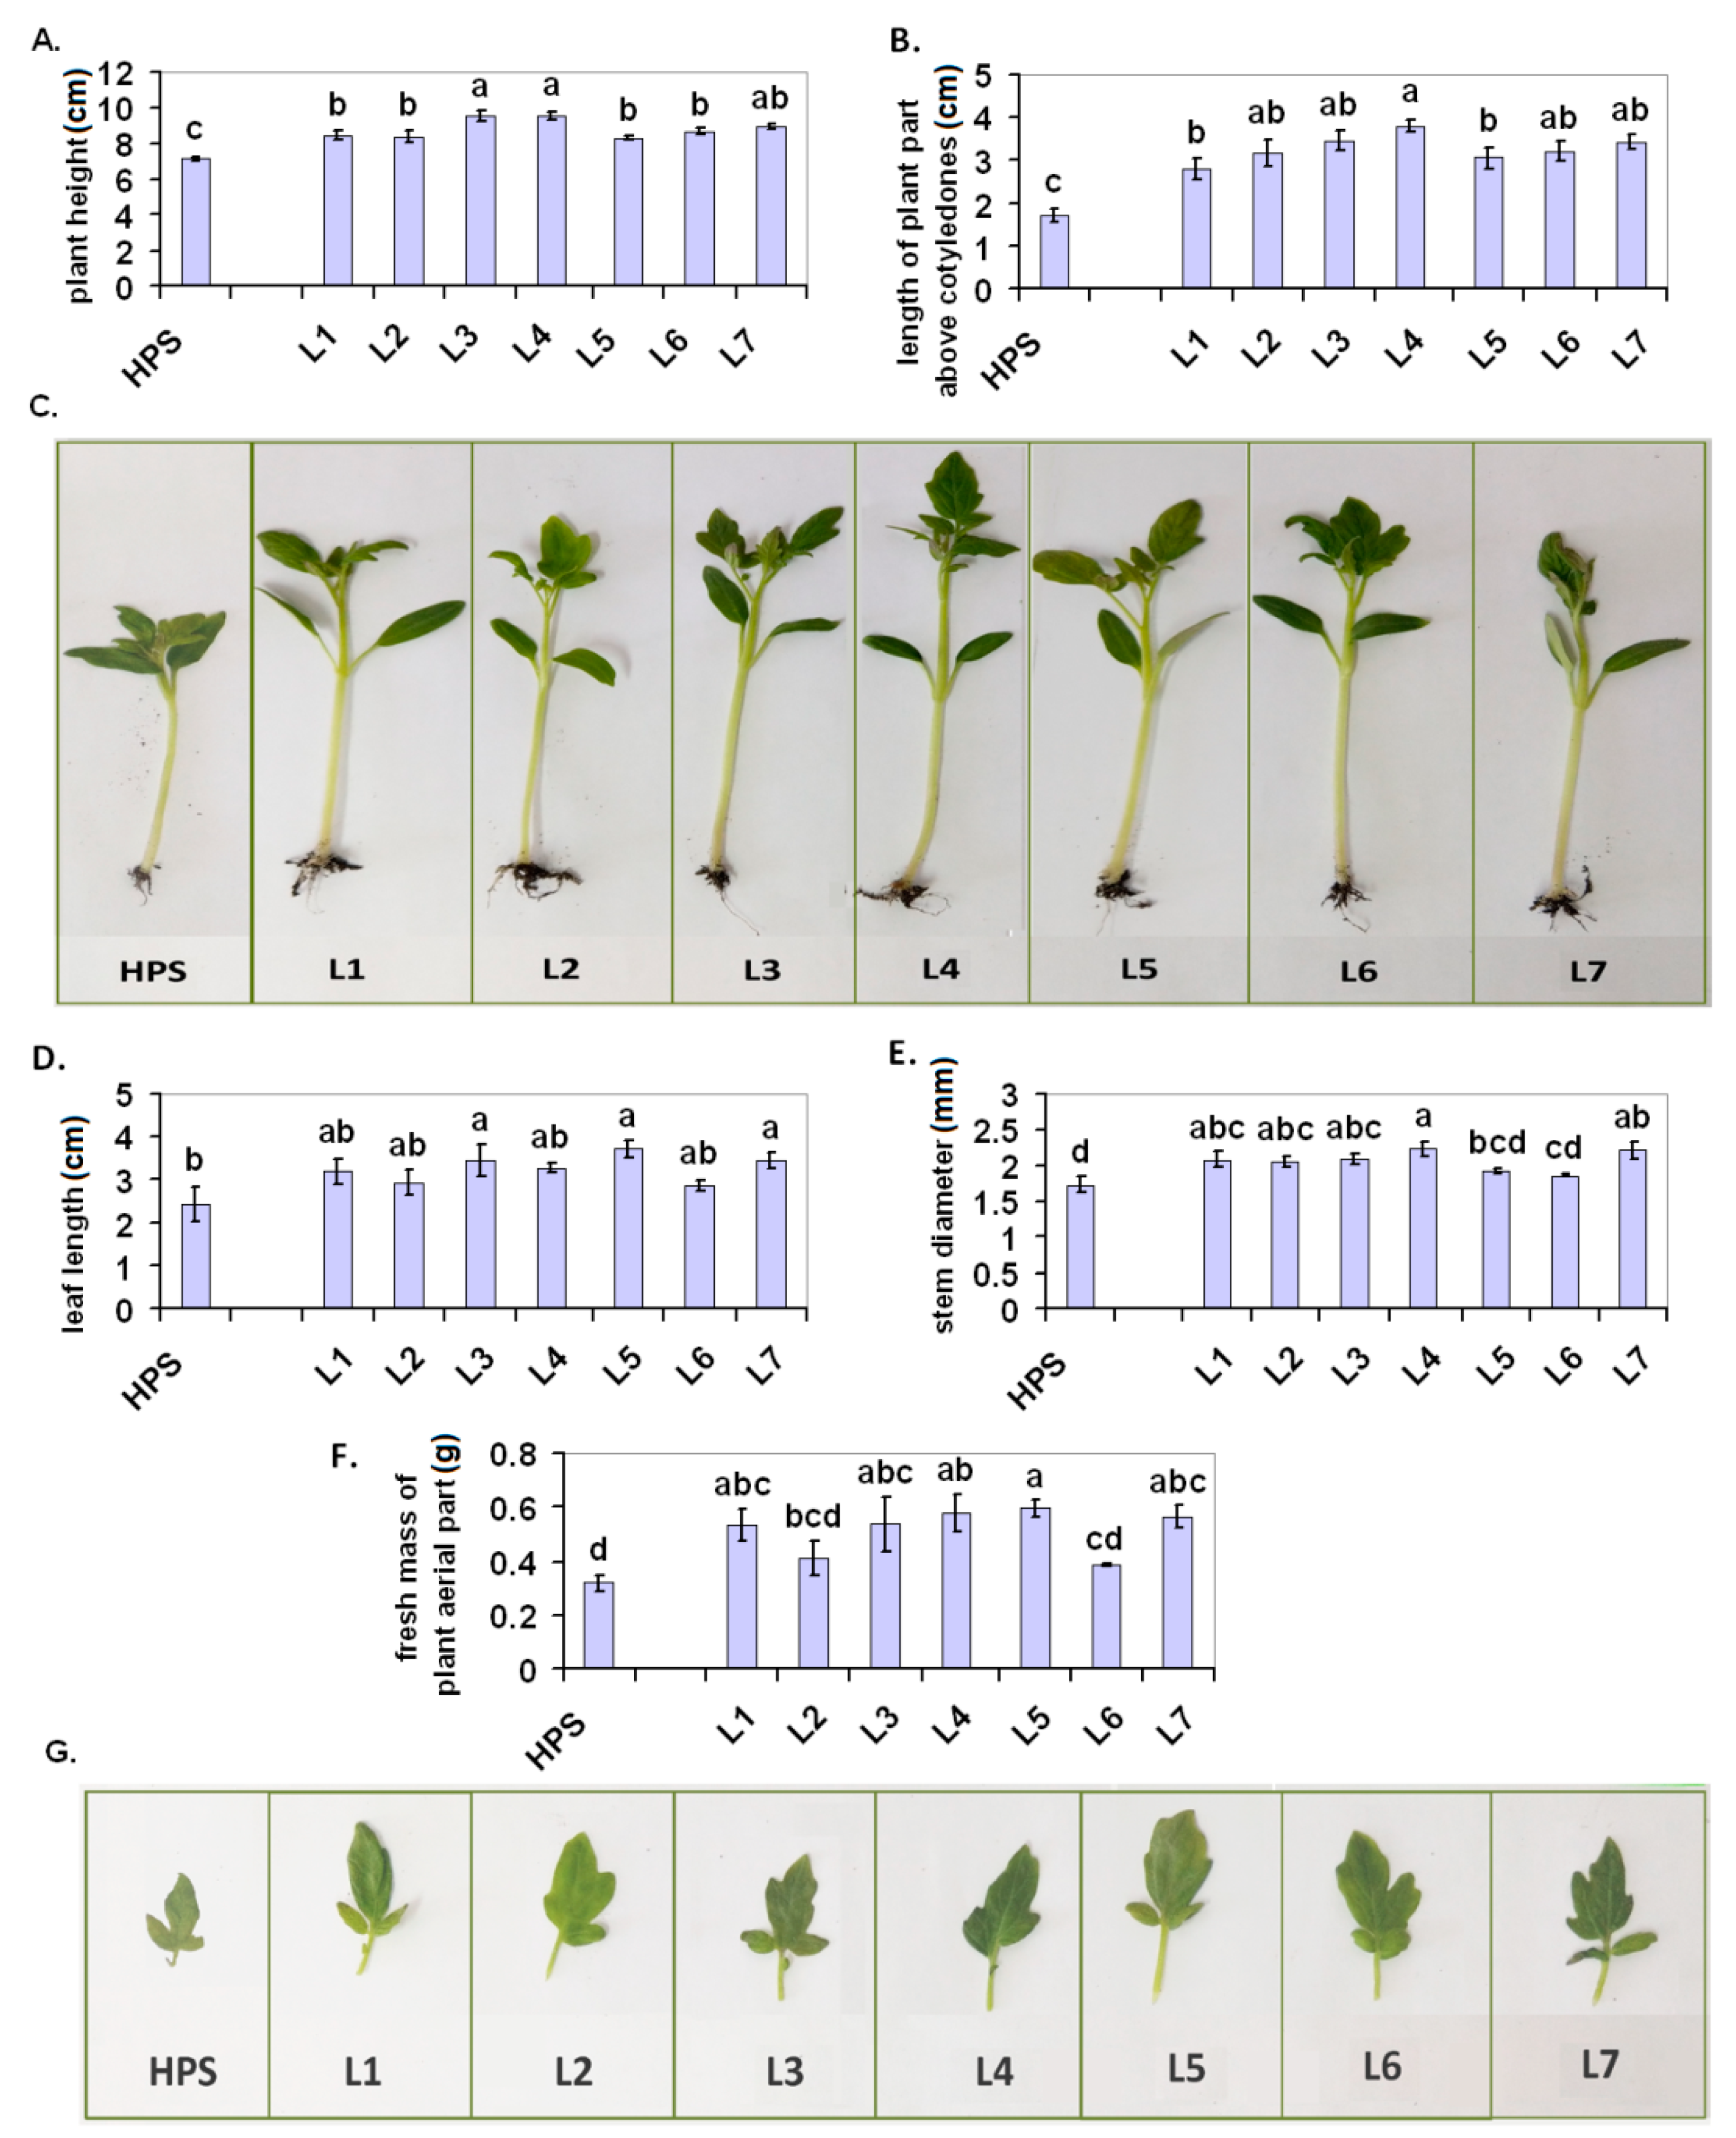
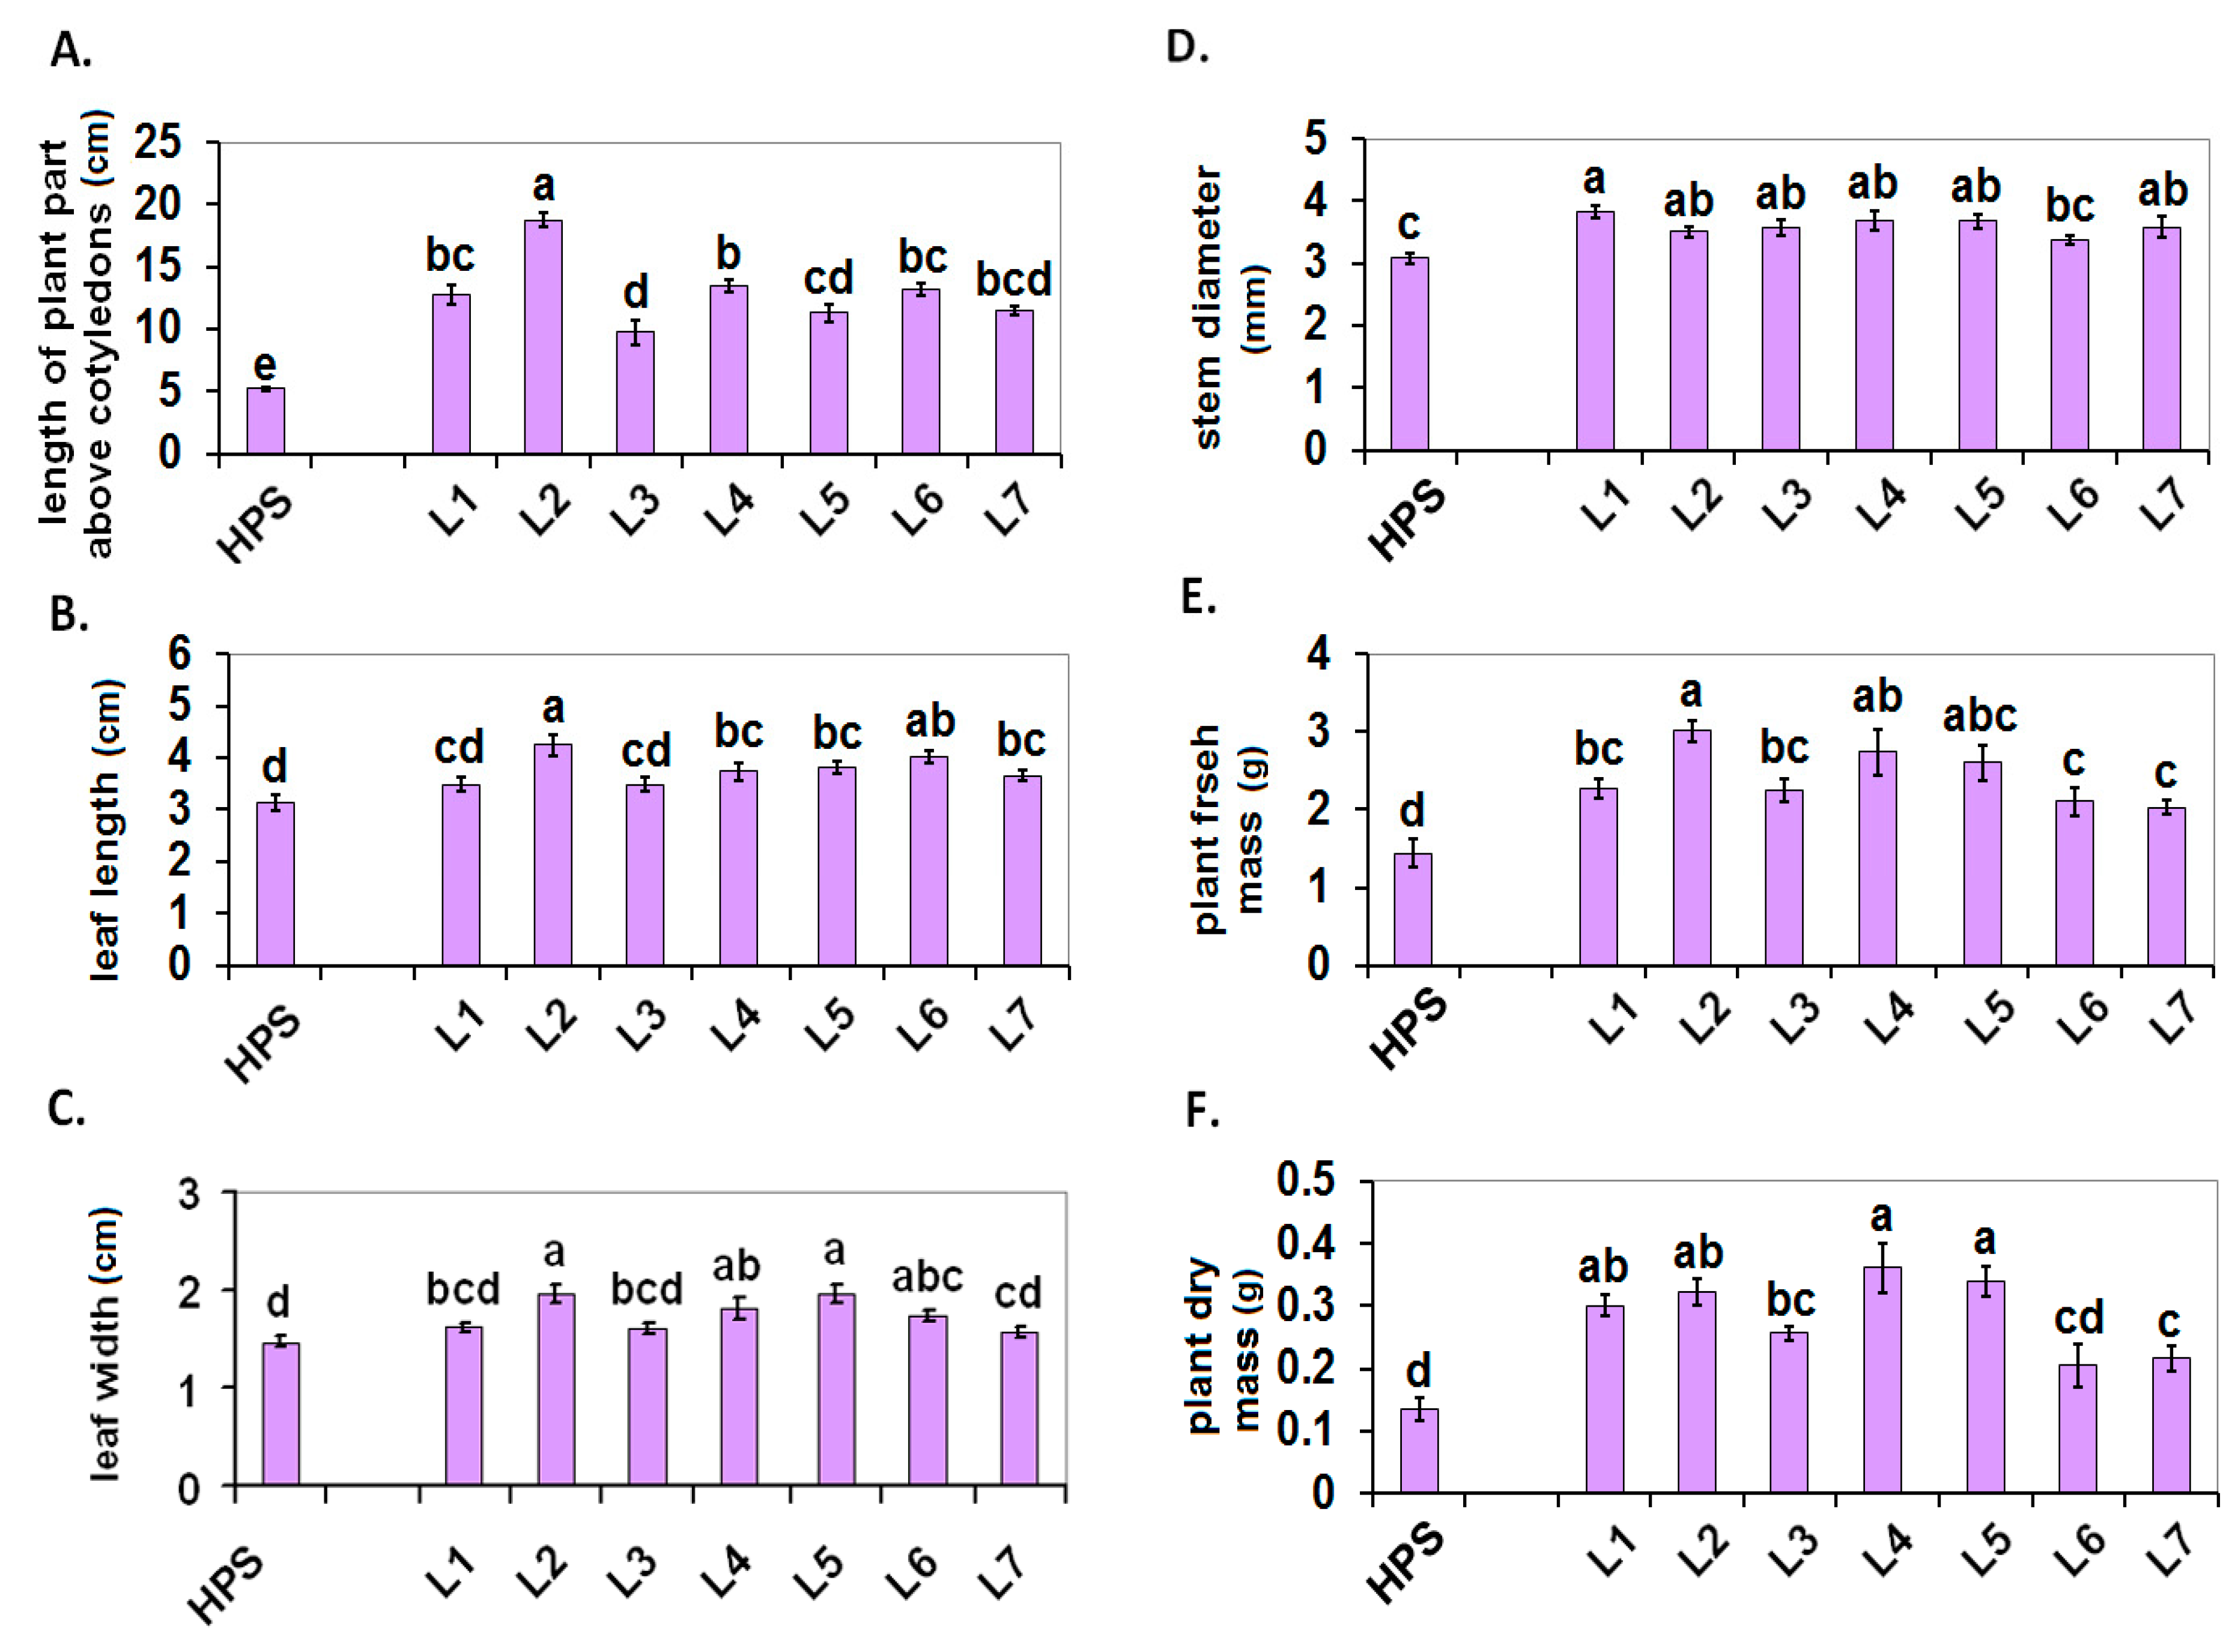
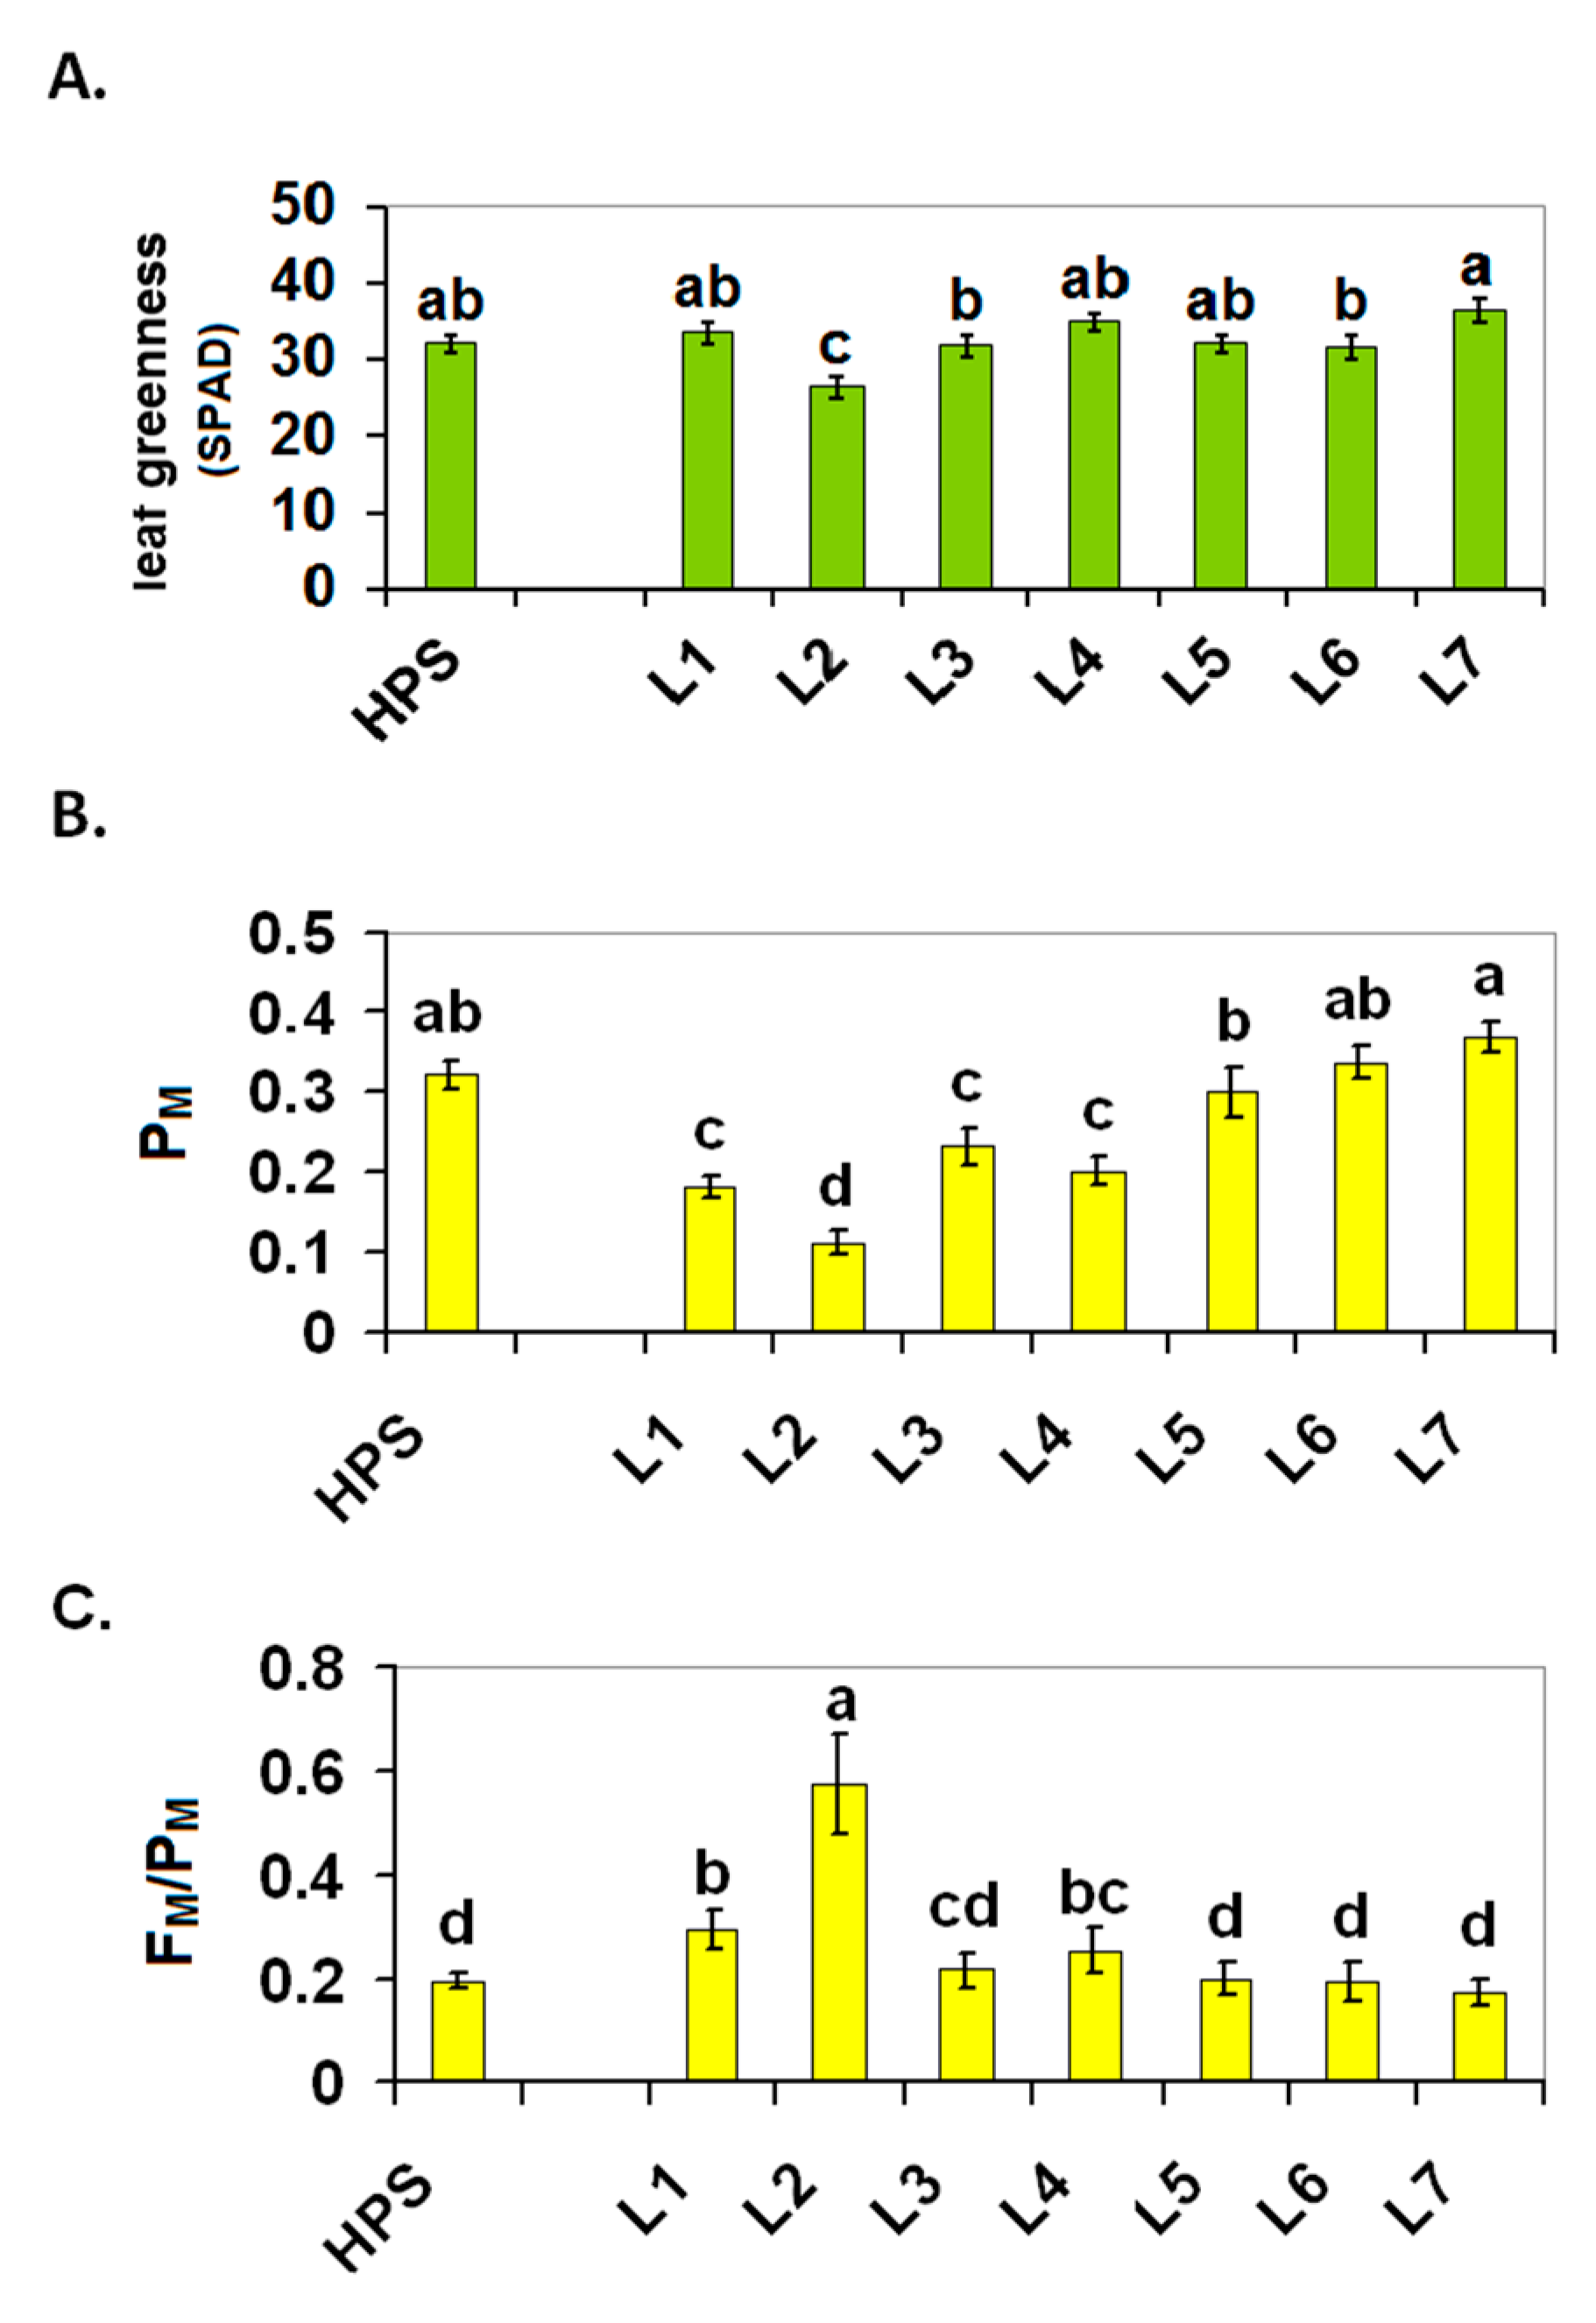
2.1. Plant Growth
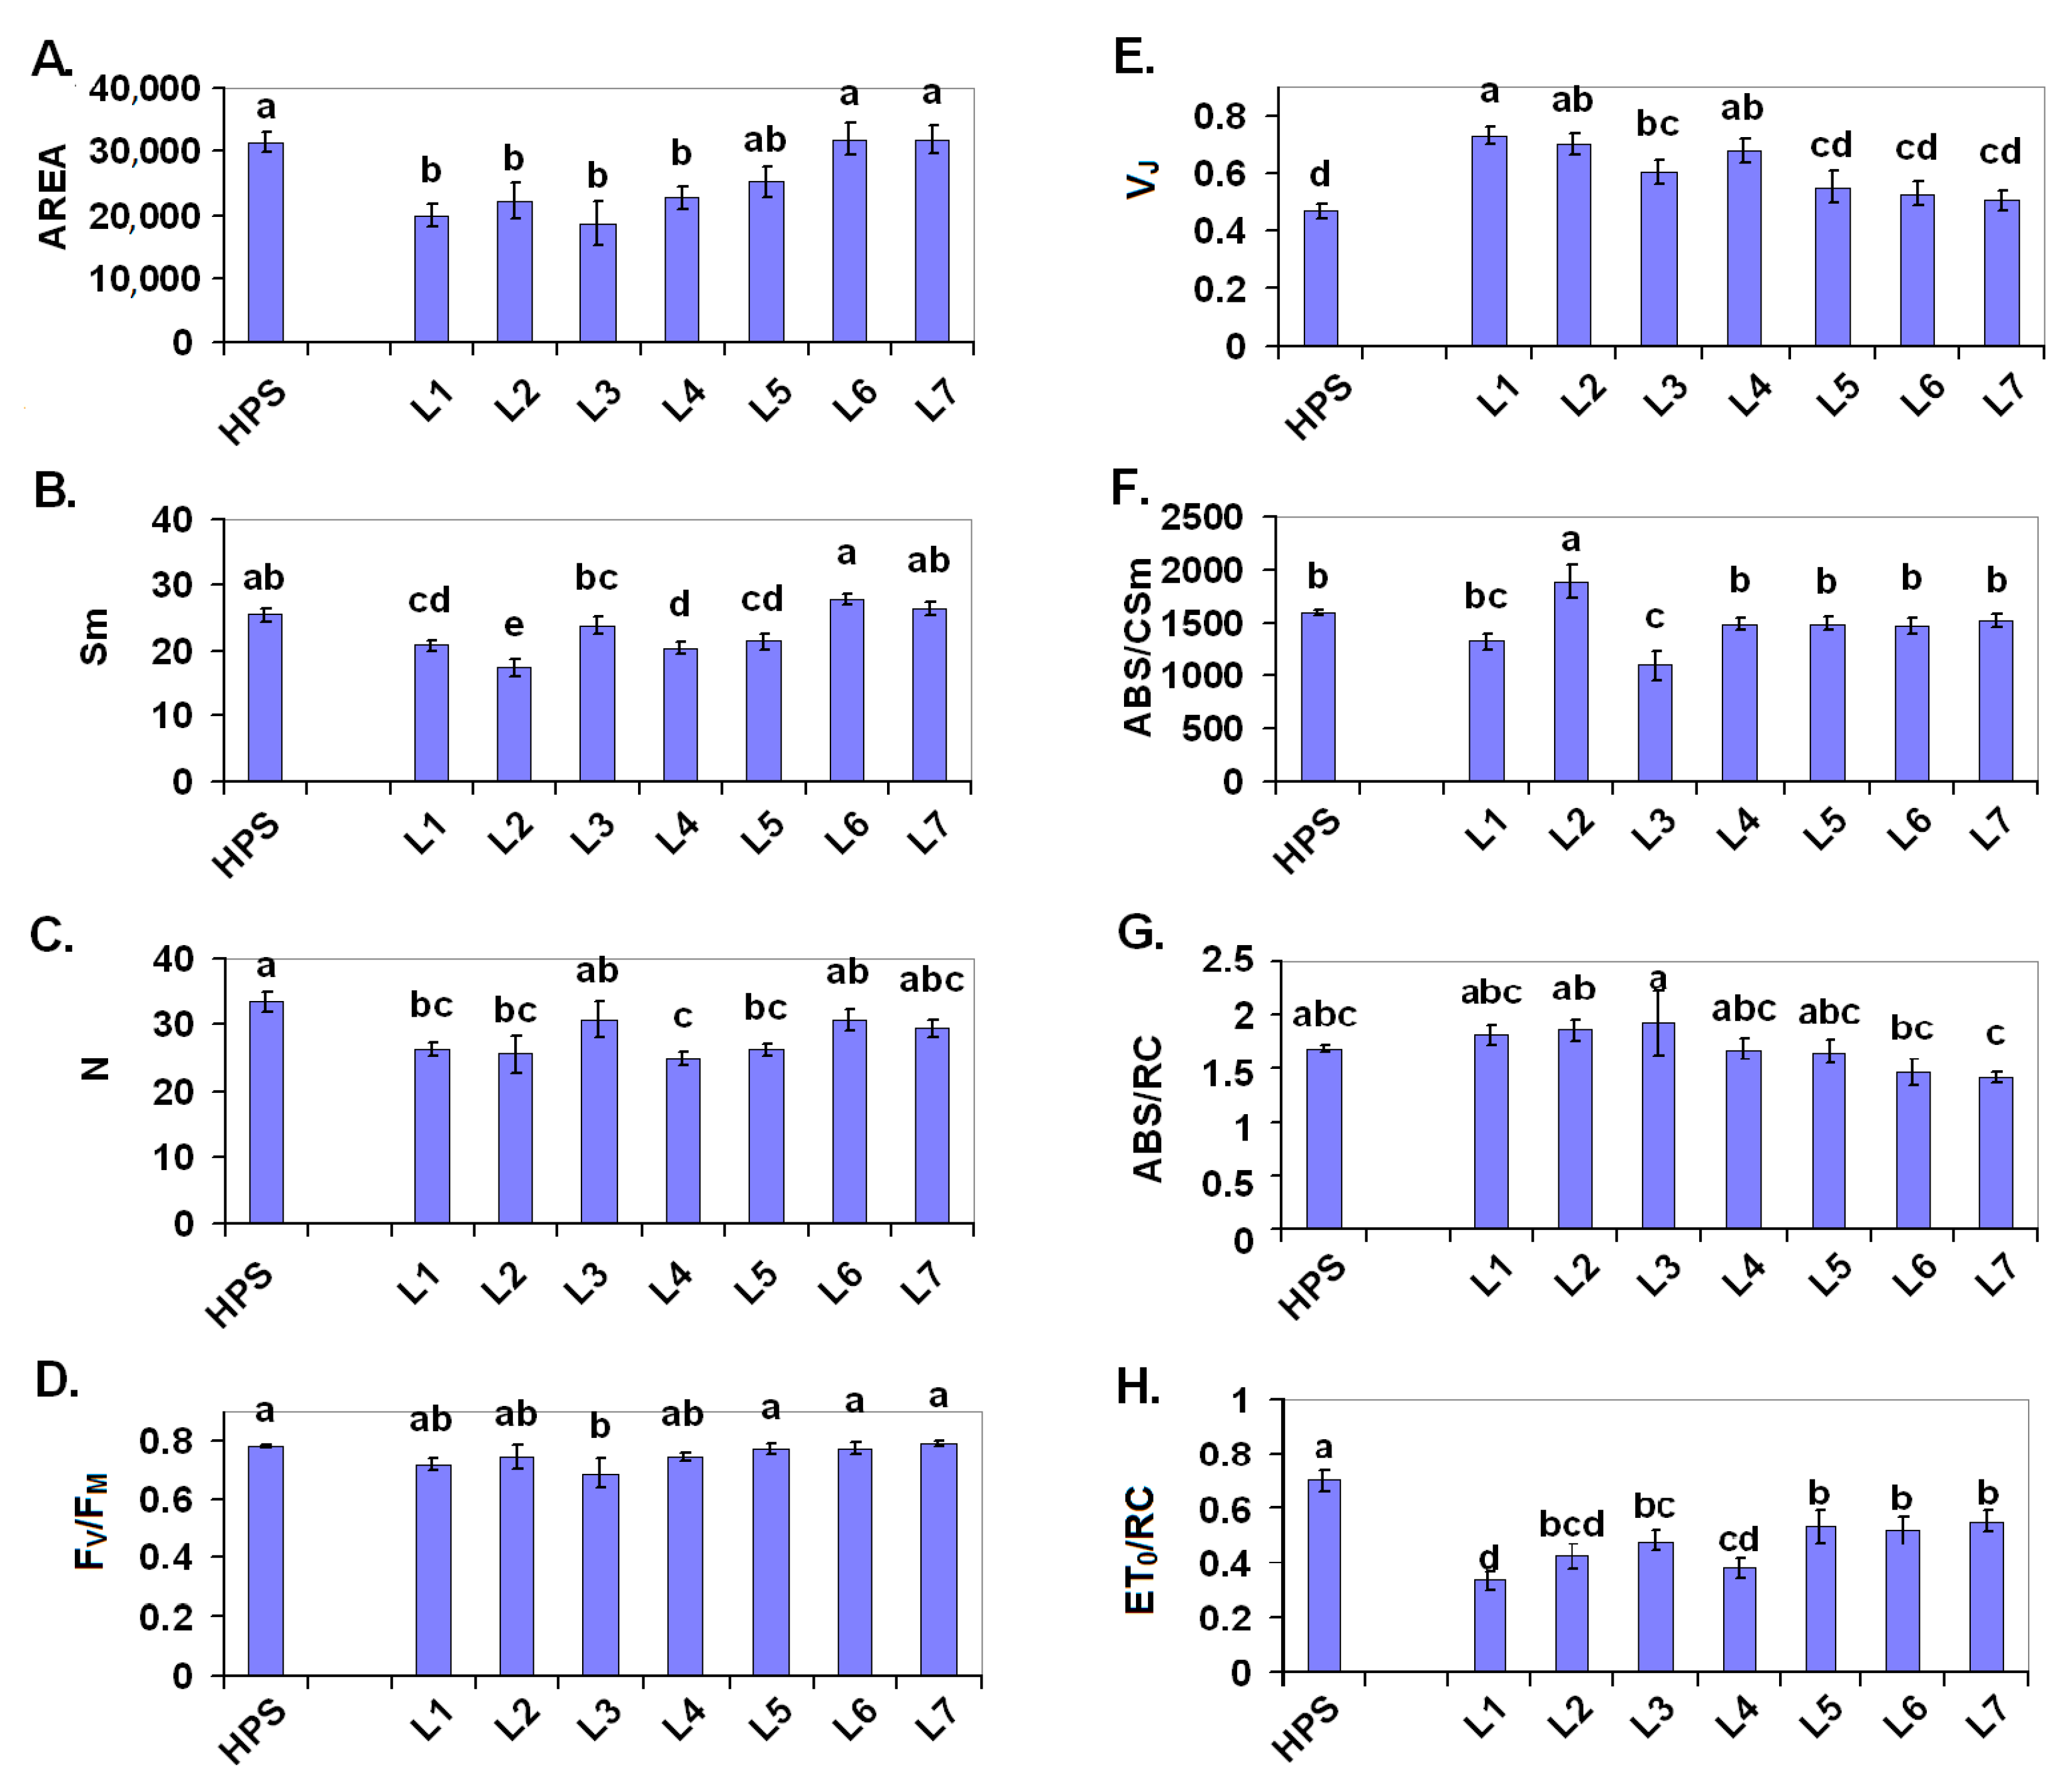
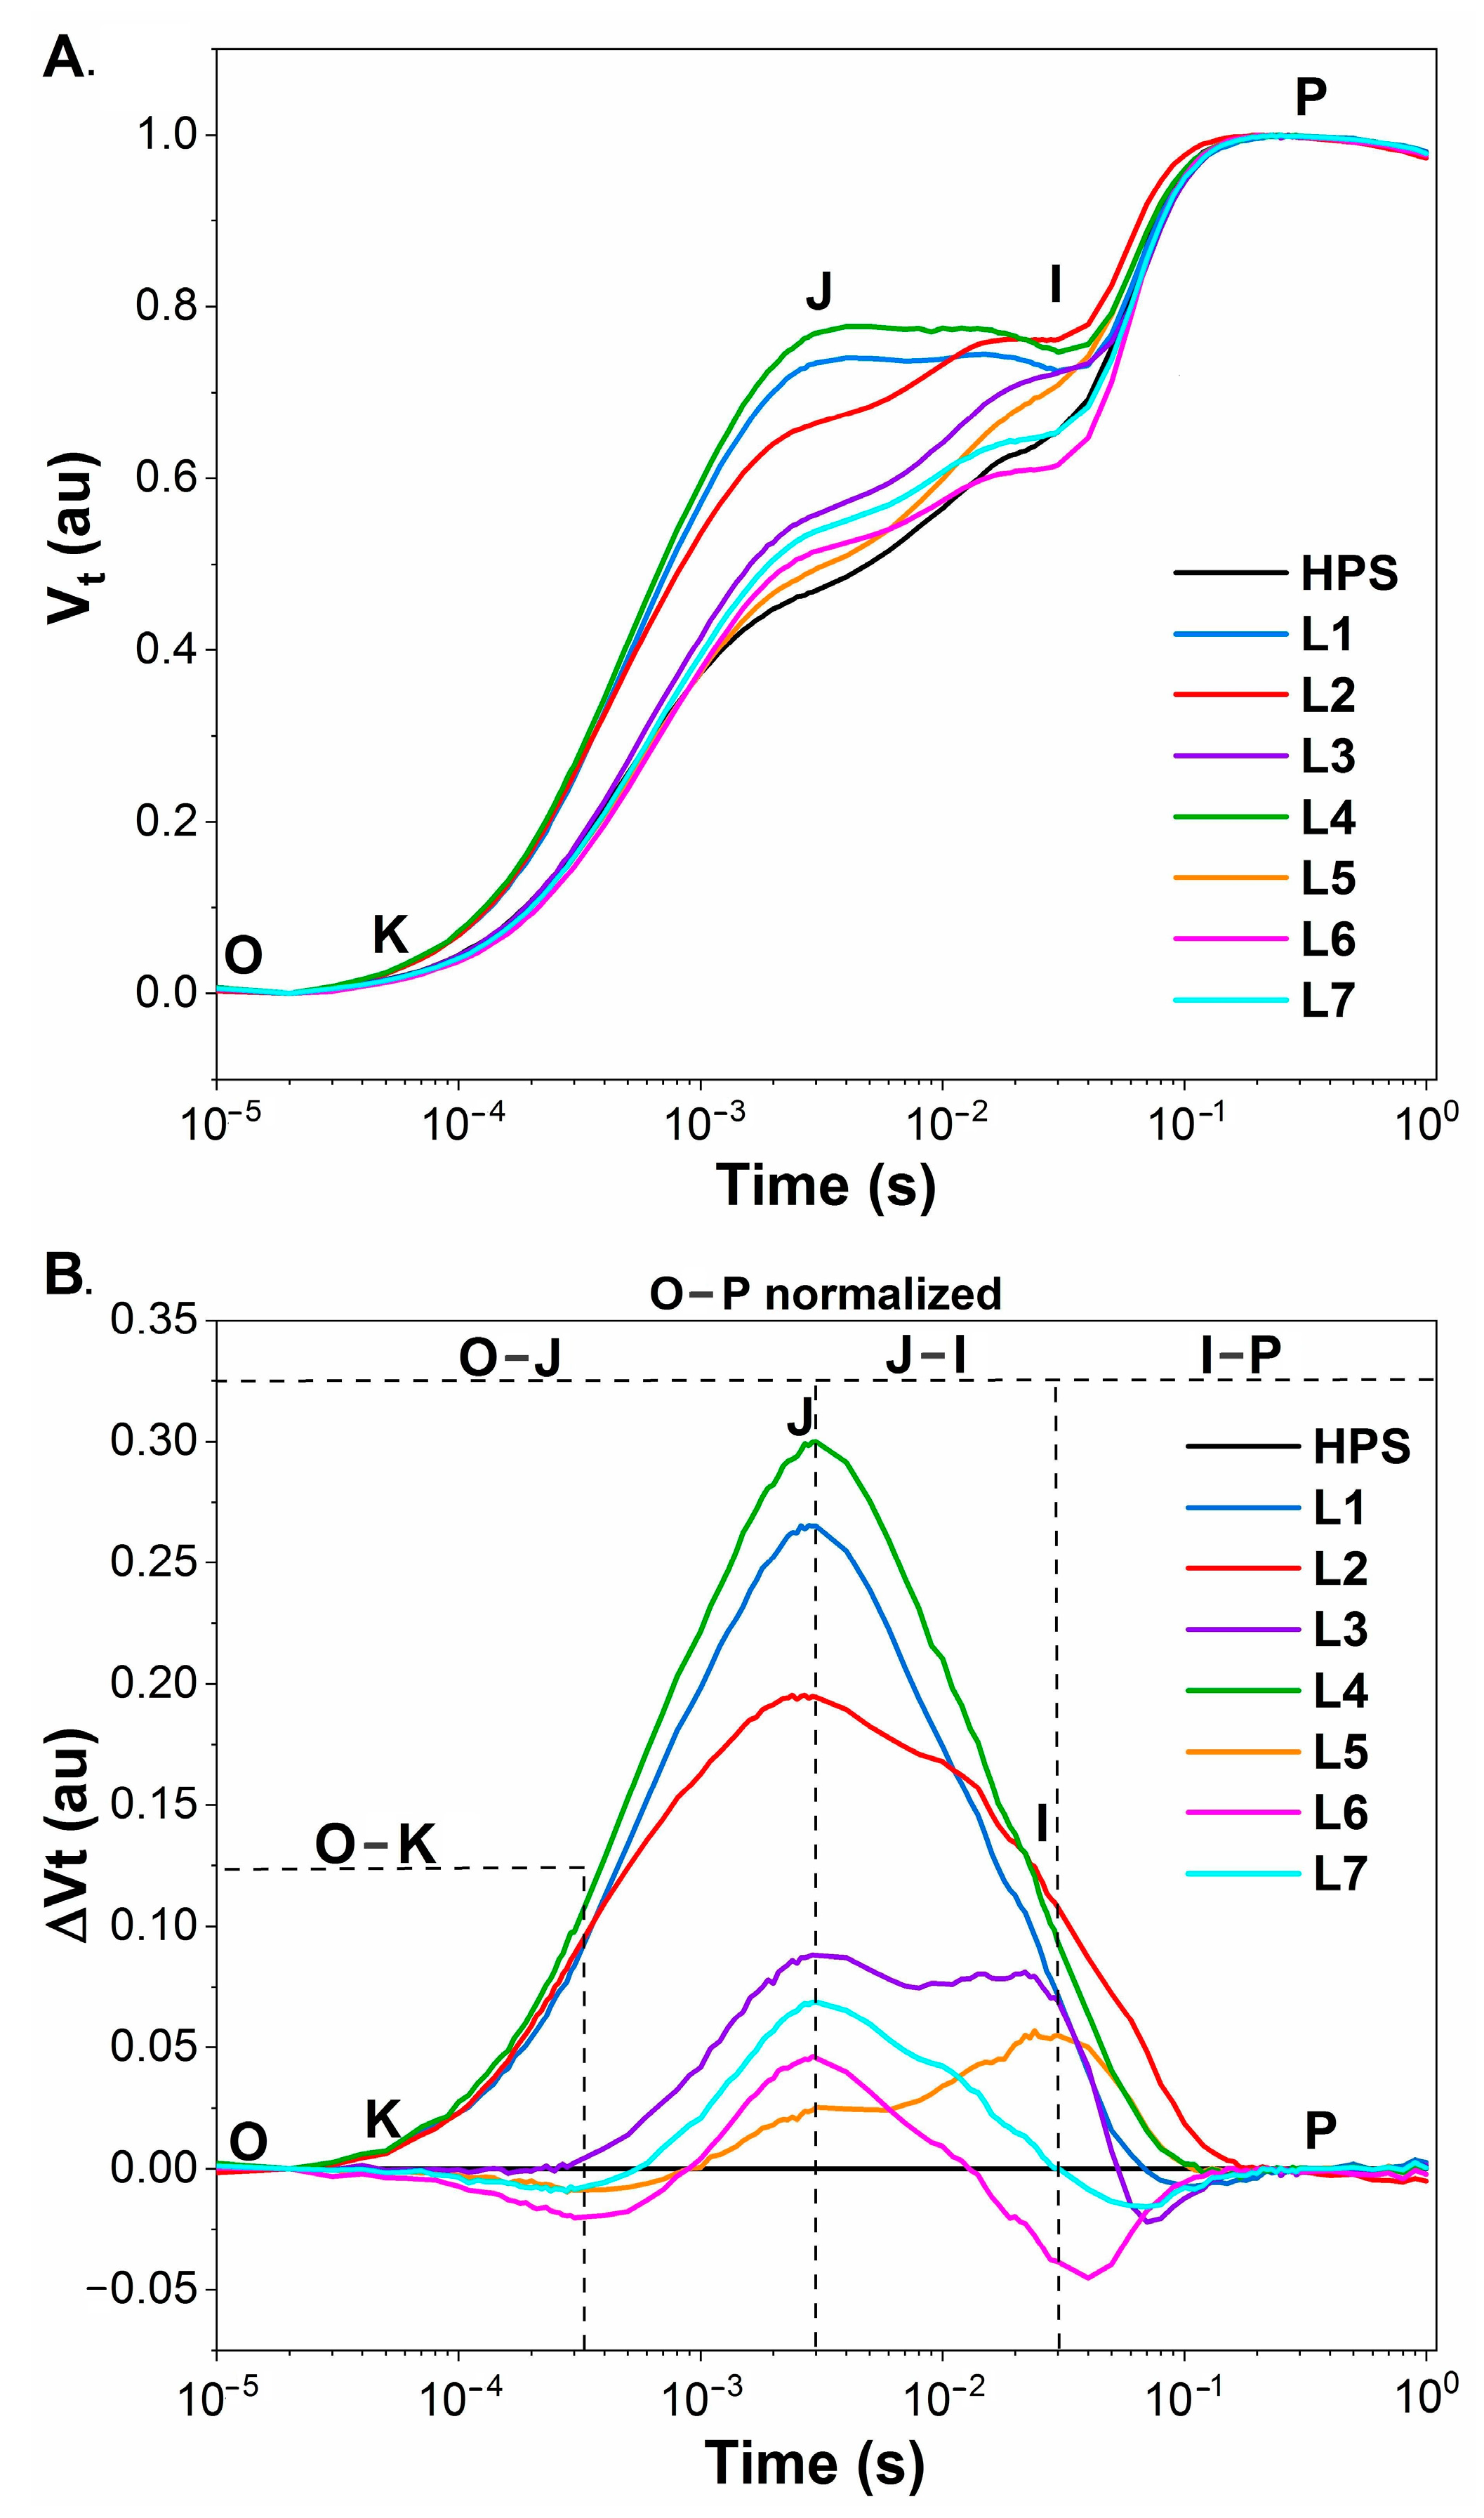
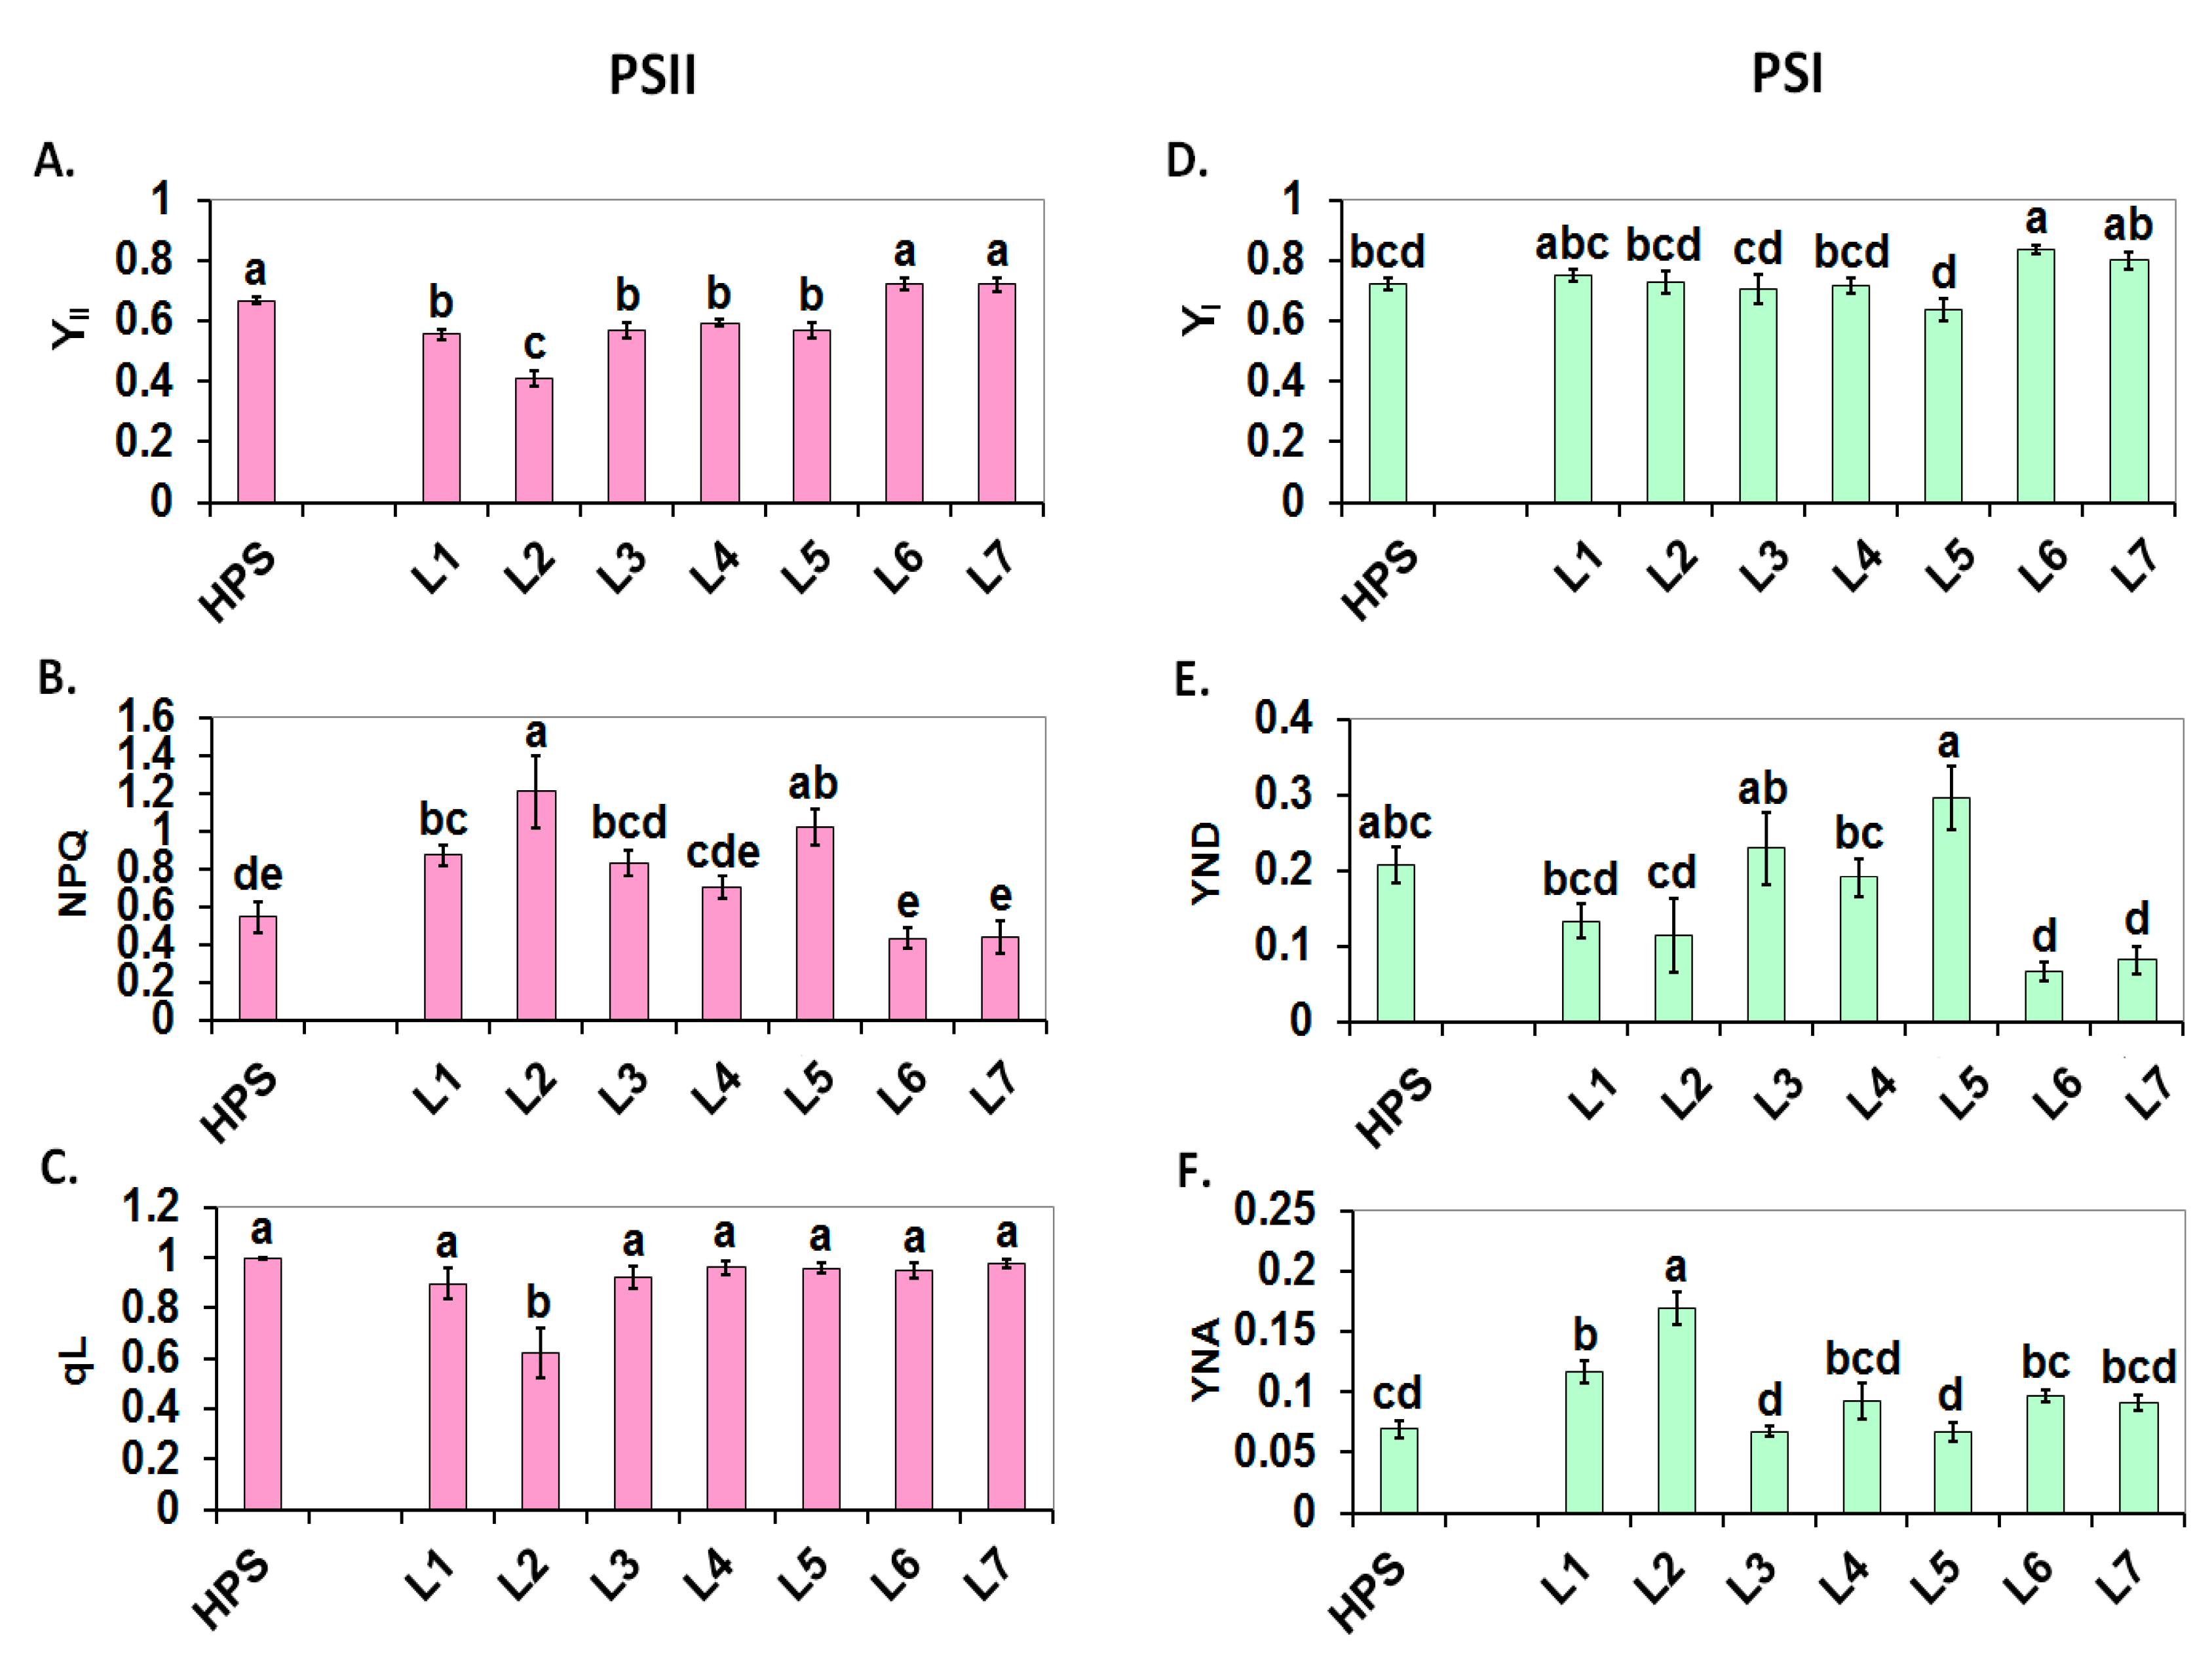
2.2. Photosynthesis
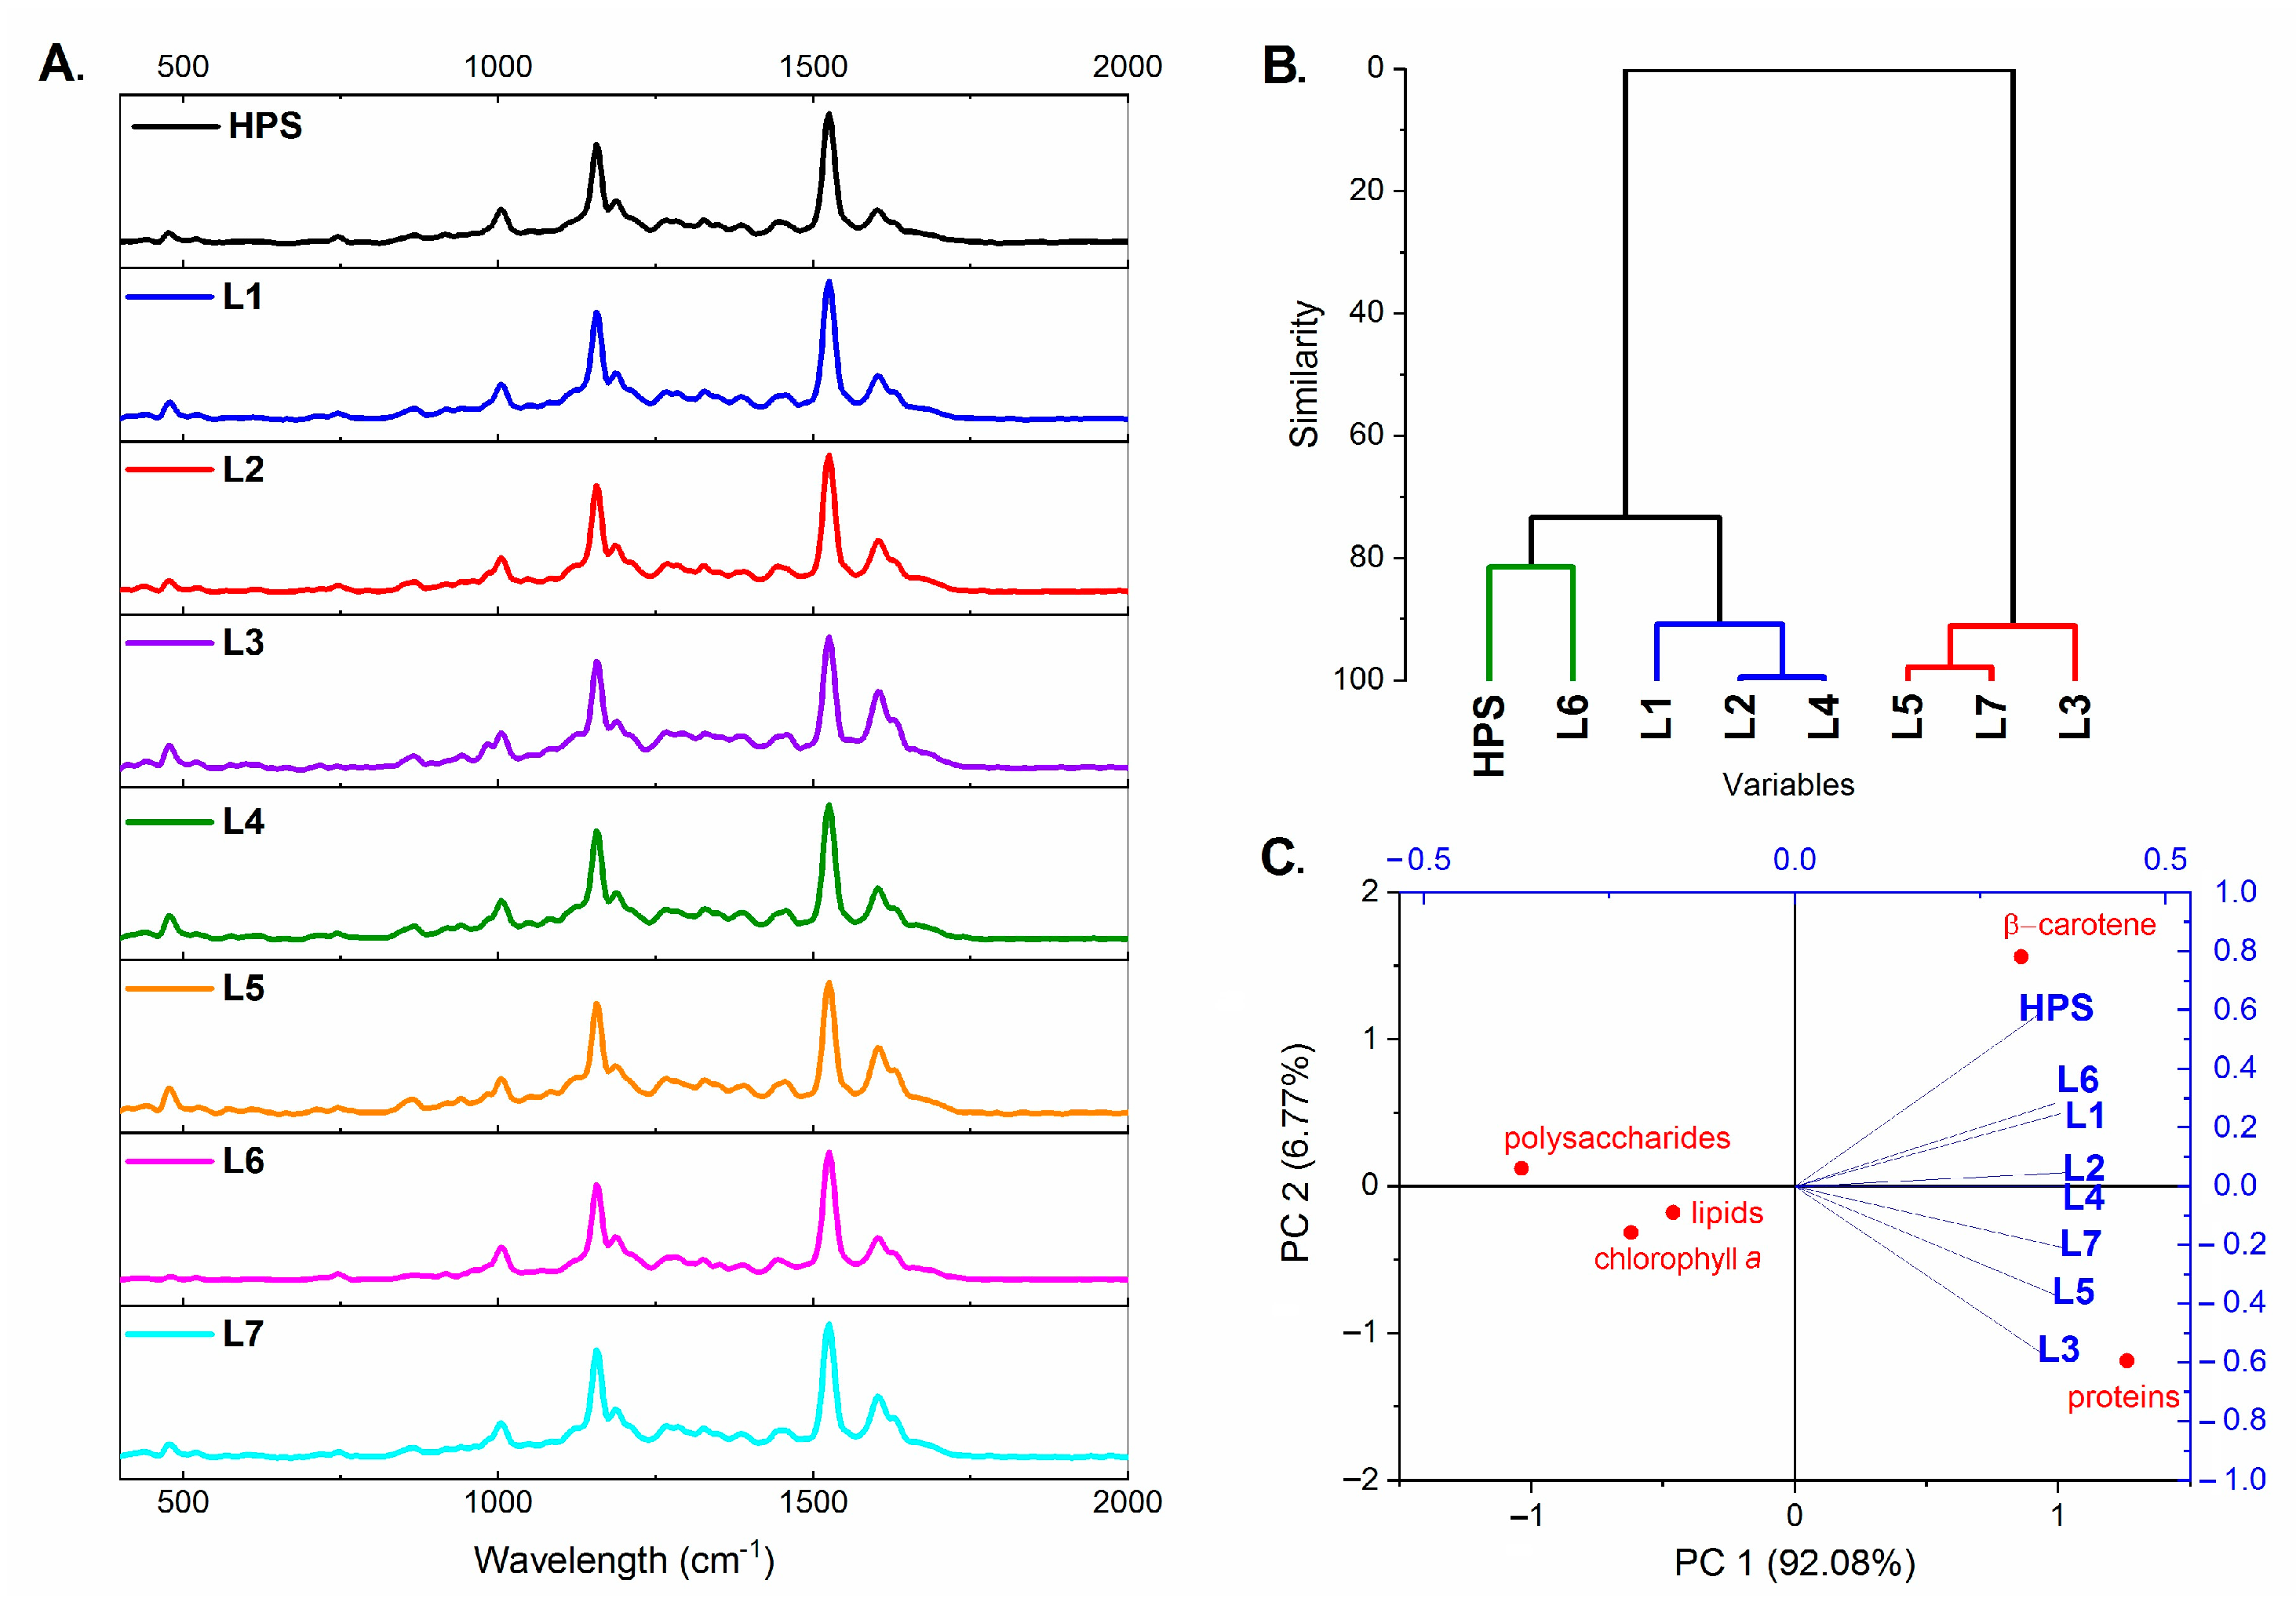
2.3. Plant Metabolic Profile
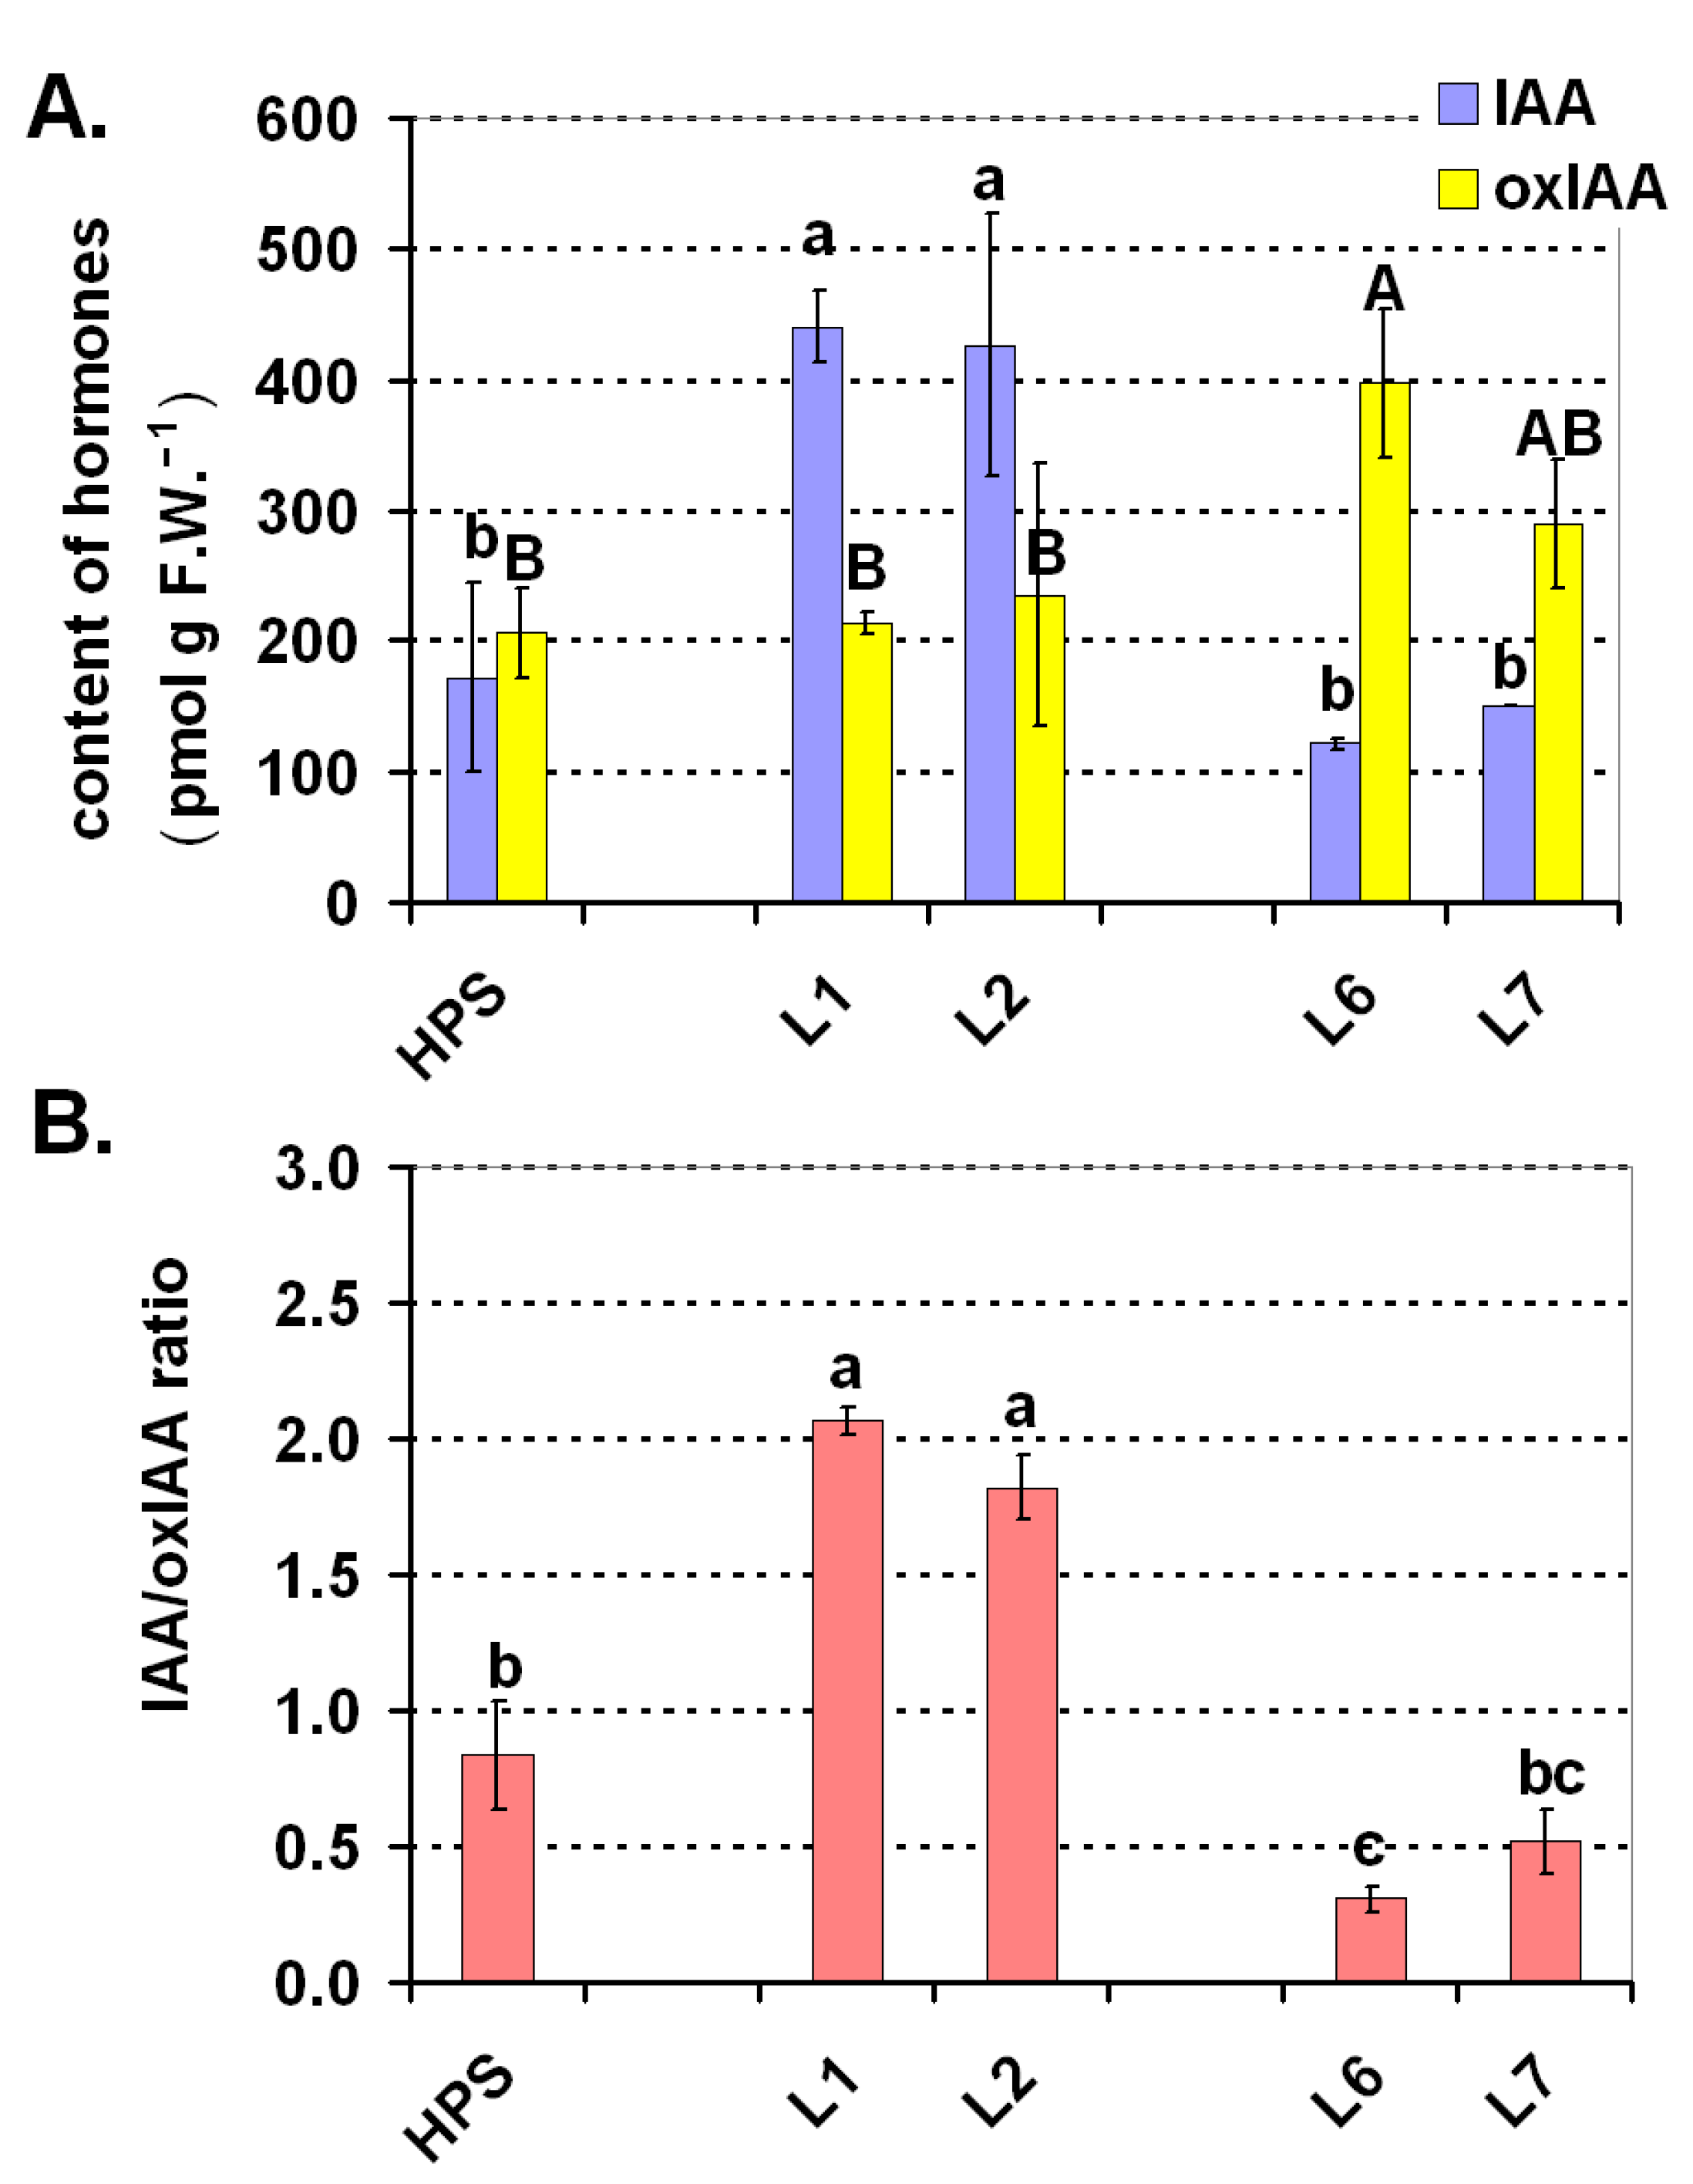
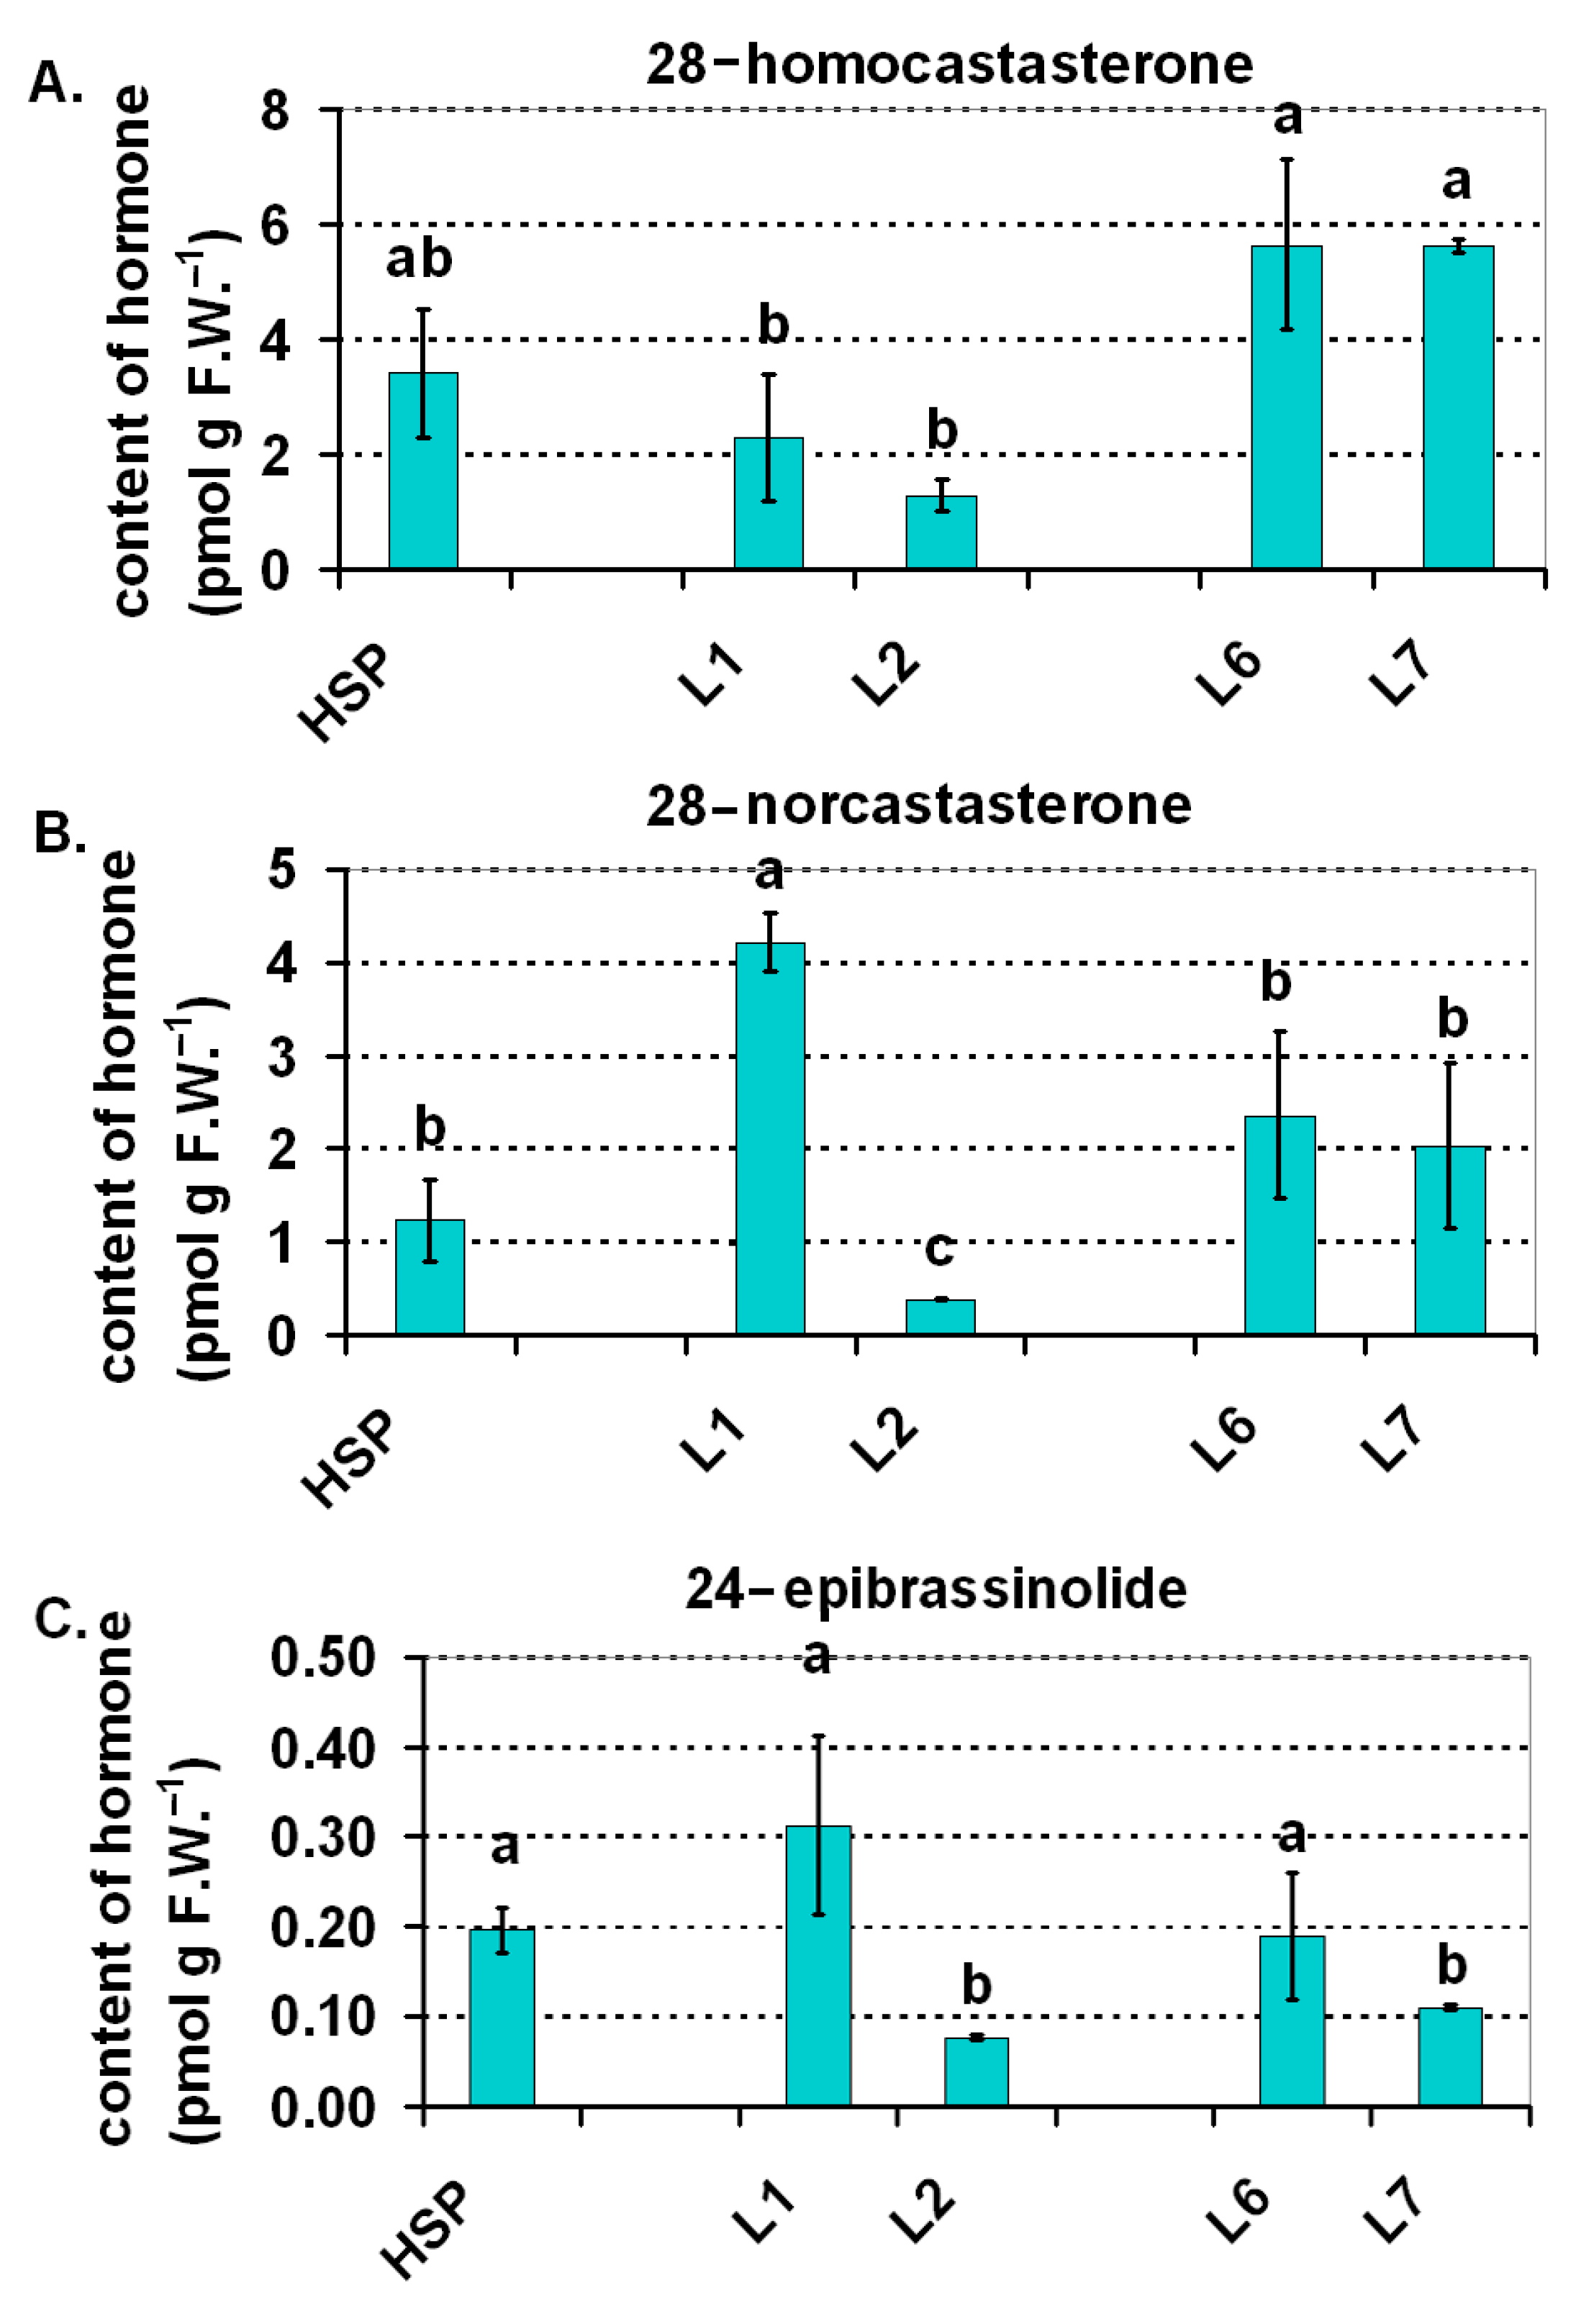
2.4. Balance of the Selected Plant Hormones (Auxins and Brassinosteroids)
3. Materials and Methods
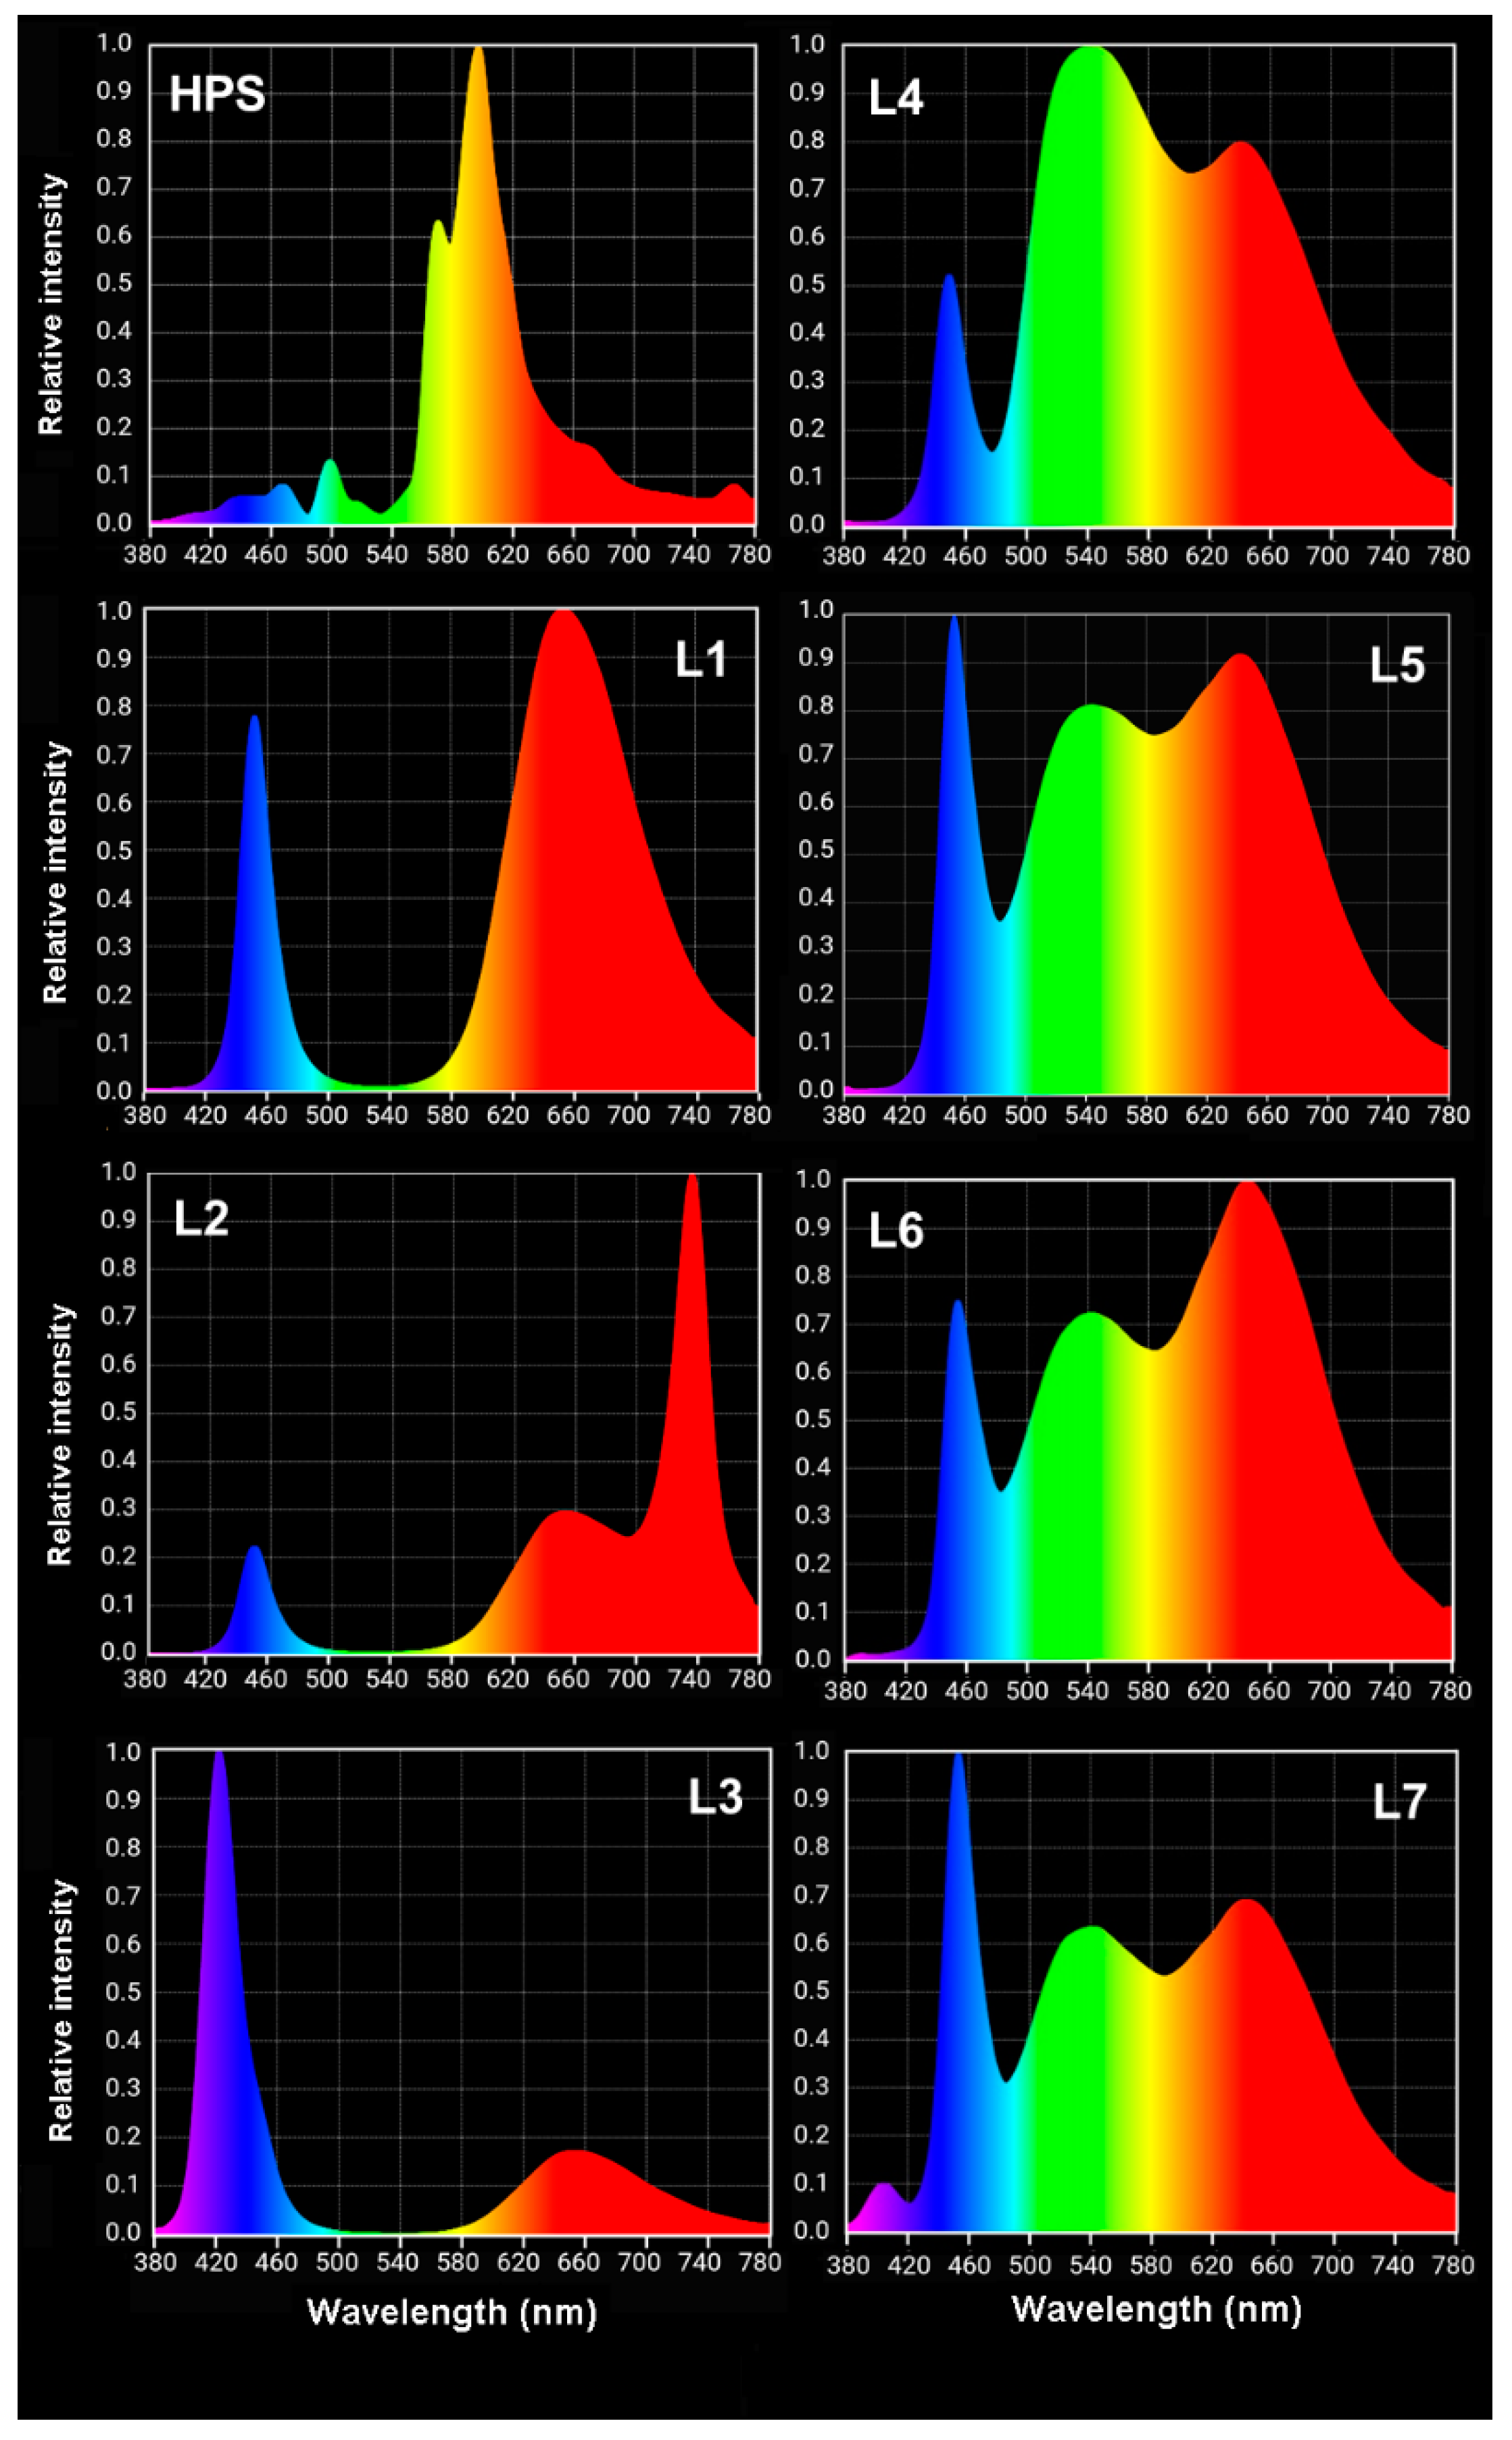
3.1. Plant Material and Experimental Design
3.2. Measurements and Observations
3.2.1. Plant Growth Parameters
3.2.2. Leaf Greenness
3.3. Chlorophyll a Fluorescence Measurements
3.3.1. PSII Photochemistry Measured Using a Plant Efficiency Analyser
3.3.2. PSI and PSII Photochemistry Measured Using a Dual-PAM
3.4. Leaf Gas Exchange
3.5. FT-Raman Studies of the Metabolic Profile
3.6. Analysis of the Phytohormones
3.6.1. Auxins
3.6.2. Brassinosteroids
4. Concluding Remarks
Supplementary Materials
Author Contributions
Funding
Institutional Review Board Statement
Informed Consent Statement
Data Availability Statement
Acknowledgments
Conflicts of Interest
References
- Kargul, J.; Barber, J. Photosynthetic acclimation: Structural reorganisation of light harvesting antenna—Role of redox-dependent phosphorylation of major and minor chlorophyll a/b binding proteins. FEBS J. 2008, 275, 1056–1068. [Google Scholar] [CrossRef] [PubMed] [Green Version]
- Laisk, A.; Oja, V.; Eichelmann, H.; Dall’Osto, L. Action spectra of photosystems II and I and quantum yield of photosynthesis in leaves in State 1. BBA-Bioenerg. 2014, 1837, 315–325. [Google Scholar] [CrossRef] [Green Version]
- Schoettler, M.A.; Toth, S.Z. Photosynthetic complex stoichiometry dynamics in higher plants: Environmental acclimation and photosynthetic flux control. Front. Plant. Sci. 2014, 5, 188. [Google Scholar] [CrossRef]
- Niewiadomska, E.; Pilarska, M. Acclimation to salinity in halophytic ice plant prevents a decline of linear electron transport. Environ. Exp. Bot. 2021, 184, 104401. [Google Scholar] [CrossRef]
- Lin, K.-H.; Huang, M.-Y.; Huang, W.-D.; Hsu, M.-H.; Yang, Z.-W.; Yang, C.-M. The effects of red, blue, and white light-emitting diodes on the growth, development, and edible quality of hydroponically grown lettuce (Lactuca sativa L. var. capitata). Sci. Hortic. 2013, 150, 86–91. [Google Scholar] [CrossRef]
- Paradiso, R.; Meinen, E.; Snel, J.F.H.; Marcelis, L.F.M.; van Ieperen, W.; Hogewoning, S.W. Light use efficiency at different wavelengths in rose plants. Acta Hortic. 2011, 893, 849–855. [Google Scholar] [CrossRef] [Green Version]
- Li, H.; Tang, C.; Xu, Z.; Liu, X.; Han, X. Effects of different light sources on the growth of non-heading Chinese cabbage (Brassica campestris L.). J. Agric. Sci. 2012, 4, 262. [Google Scholar] [CrossRef] [Green Version]
- Goh, C.-H. Phototropins and chloroplast activity in plant blue light signaling. Plant. Signal. Behav. 2009, 4, 693–695. [Google Scholar] [CrossRef] [PubMed] [Green Version]
- Demarsy, E.; Fankhauser, C. Higher plants use LOV to perceive blue light. Curr. Opin. Plant. Biol. 2009, 12, 69–74. [Google Scholar] [CrossRef] [Green Version]
- Chen, X.-l.; Guo, W.-z.; Xue, X.-z.; Wang, L.-c.; Qiao, X.-j. Growth and quality responses of ‘Green Oak Leaf’ lettuce as affected by monochromic or mixed radiation provided by fluorescent lamp (FL) and light-emitting diode (LED). Sci. Hortic. 2014, 172, 168–175. [Google Scholar] [CrossRef]
- Carvalho, S.D.; Folta, K.M. Sequential light programs shape kale (Brassica napus) sprout appearance and alter metabolic and nutrient content. Hortic. Res. 2014, 1, 8. [Google Scholar] [CrossRef] [Green Version]
- Kang, J.H.; KrishnaKumar, S.; Atulba, S.L.S.; Jeong, B.R.; Hwang, S.J. Light intensity and photoperiod influence the growth and development of hydroponically grown leaf lettuce in a closed-type plant factory system. Hort. Environ. Biotechnol. 2013, 54, 501–509. [Google Scholar] [CrossRef]
- Sullivan, J.A.; Deng, X.W. From seed to seed: The role of photoreceptors in Arabidopsis development. Dev. Biol. 2003, 260, 289–297. [Google Scholar] [CrossRef] [Green Version]
- Samuoliene, G.; Urbonaviciute, A.; Brazaityte, A.; Sabajeviene, G.; Sakalauskaite, J.; Duchovskis, P. The impact of LED illumination on antioxidant properties of sprouted seeds. Cent. Eur. J. Biol. 2011, 6, 68–74. [Google Scholar] [CrossRef]
- Samuoliene, G.; Sirtautas, R.; Brazaityte, A.; Duchovskis, P. LED lighting and seasonality effects antioxidant properties of baby leaf lettuce. Food Chem. 2012, 134, 1494–1499. [Google Scholar] [CrossRef]
- Kim, H.-H.; Wheeler, R.M.; Sager, J.C.; Yorio, N.C.; Goins, G.D. Light-emitting diodes as an illumination source for plants: A review of research at Kennedy Space Center. Habitation 2005, 10, 71–78. [Google Scholar] [CrossRef] [PubMed]
- Stutte, G.W.; Edney, S.; Skerritt, T. Photoregulation of bioprotectant content of red leaf lettuce with light-emitting diodes. Hortscience 2009, 44, 79–82. [Google Scholar] [CrossRef] [Green Version]
- Sun, J.D.; Nishio, J.N.; Vogelmann, T.C. Green light drives CO2 fixation deep within leaves. Plant. Cell Physiol. 1998, 39, 1020–1026. [Google Scholar] [CrossRef]
- Zhang, T.; Folta, K.M. Green light signaling and adaptive response. Plant. Signal. Behav. 2012, 7, 75–78. [Google Scholar] [CrossRef] [Green Version]
- Dhingra, A.; Bies, D.H.; Lehner, K.R.; Folta, K.M. Green light adjusts the plastid transcriptome during early photomorphogenic development. Plant. Physiol. 2006, 142, 1256–1266. [Google Scholar] [CrossRef] [Green Version]
- Kim, H.H.; Goins, G.D.; Wheeler, R.M.; Sager, J.C. Green-light supplementation for enhanced lettuce growth under red- and blue-light-emitting diodes. Hortscience 2004, 39, 1617–1622. [Google Scholar] [CrossRef] [PubMed] [Green Version]
- Liu, X.Y.; Chang, T.T.; Guo, S.R.; Xu, Z.G.; Li, J. Effect of different light quality of LED on growth and photosynthetic character in cherry tomato seedling. Acta Hortic. 2011, 907, 325–330. [Google Scholar] [CrossRef]
- Hogewoning, S.W.; Trouwborst, G.; Meinen, E.; van Ieperen, W. Finding the optimal growth-light spectrum for greenhouse crops. Acta Hortic. 2012, 956, 357–363. [Google Scholar] [CrossRef] [Green Version]
- Xiaoying, L.; Shirong, G.; Taotao, C.; Zhigang, X.; Tezuka, T. Regulation of the growth and photosynthesis of cherry tomato seedlings by different light irradiations of light emitting diodes (LED). Afr. J. Biotechnol. 2012, 11, 6169–6177. [Google Scholar] [CrossRef]
- Klamkowski, K.; Treder, W.; Wójcik, K.; Puternicki, A.; Lisak, E. Influence of supplementary lighting on growth and photosynthetic activity of tomato transplants. Infrastruct. Ecol. Rural. Areas 2014, IV, 1377–1385. [Google Scholar]
- Liu, X.Y.; Jiao, X.L.; Chang, T.T.; Guo, S.R.; Xu, Z.G. Photosynthesis and leaf development of cherry tomato seedlings under different LED-based blue and red photon flux ratios. Photosynthetica 2018, 56, 1212–1217. [Google Scholar] [CrossRef]
- Yang, X.; Xu, H.; Shao, L.; Li, T.; Wang, Y.; Wang, R. Response of photosynthetic capacity of tomato leaves to different LED light wavelength. Environ. Exp. Bot. 2018, 150, 161–171. [Google Scholar] [CrossRef]
- Dieleman, J.A.; de Visser, P.H.B.; Meinen, E.; Grit, J.G.; Dueck, T.A. Integrating morphological and physiological responses of tomato plants to light quality to the crop level by 3D modeling. Front. Plant. Sci. 2019, 10, 839. [Google Scholar] [CrossRef] [Green Version]
- Kaiser, E.; Weerheim, K.; Schipper, R.; Dieleman, J.A. Partial replacement of red and blue by green light increases biomass and yield in tomato. Sci. Hortic. 2019, 249, 271–279. [Google Scholar] [CrossRef]
- Paponov, M.; Kechasov, D.; Lacek, J.; Verheul, M.J.; Paponov, I.A. Supplemental light-emitting diode inter-lighting increases tomato fruit growth through enhanced photosynthetic light use efficiency and modulated root activity. Front. Plant. Sci. 2020, 10, 1656. [Google Scholar] [CrossRef]
- Palmitessa, O.D.; Pantaleo, M.A.; Santamaria, P. Applications and development of LEDs as supplementary lighting for tomato at different latitudes. Agronomy 2021, 11, 835. [Google Scholar] [CrossRef]
- Kaiser, E.; Ouzounis, T.; Giday, H.; Schipper, R.; Heuvelink, E.; Marcelis, L.F.M. Adding blue to red supplemental light increases biomass and yield of greenhouse-grown tomatoes, but only to an optimum. Front. Plant. Sci. 2019, 9, 2002. [Google Scholar] [CrossRef] [PubMed] [Green Version]
- Zhang, Y.; Kaiser, E.; Zhang, Y.; Zou, J.; Bian, Z.; Yang, Q.; Li, T. UVA radiation promotes tomato growth through morphological adaptation leading to increased light interception. Environ. Exp. Bot. 2020, 176, 104073. [Google Scholar] [CrossRef]
- Kalaji, M.H.; Łoboda, T. Fluorescencja Chlorofilu W Badaniach Stanu Fizjologicznego Roślin; Wydawnictwo SGGW: Warszawa, Poland, 2009. [Google Scholar]
- Banks, J.M. Continuous excitation chlorophyll fluorescence parameters: A review for practitioners. Tree Physiol. 2017, 37, 1128–1136. [Google Scholar] [CrossRef] [PubMed]
- Kalaji, M.H.; Goltsev, V.N.; Żuk-Gołaszewska, K.; Zivcak, M.; Brestic, M. Chlorophyll Fluorescence: Understanding Crop Performance—Basics and Applications; CRC Press: Boca Raton, FL, USA, 2017. [Google Scholar]
- Meng, L.L.; Song, J.F.; Wen, J.; Zhang, J.; Wei, J.H. Effects of drought stress on fluorescence characteristics of photosystem II in leaves of Plectranthus scutellarioides. Photosynthetica 2016, 54, 414–421. [Google Scholar] [CrossRef]
- Stirbet, A. Excitonic connectivity between photosystem II units: What is it, and how to measure it? Photosynth. Res. 2013, 116, 189–214. [Google Scholar] [CrossRef]
- Srivastava, A.; Guisse, B.; Greppin, H.; Strasser, R.J. Regulation of antenna structure and electron transport in Photosystem II of Pisum sativum under elevated temperature probed by the fast polyphasic chlorophyll a fluorescence transient: OKJIP. BBA-Bioenergetics 1997, 1320, 95–106. [Google Scholar] [CrossRef] [Green Version]
- Kalaji, H.M.; Baba, W.; Gediga, K.; Goltsev, V.; Samborska, I.A.; Cetner, M.D.; Dimitrova, S.; Piszcz, U.; Bielecki, K.; Karmowska, K.; et al. Chlorophyll fluorescence as a tool for nutrient status identification in rapeseed plants. Photosynth. Res. 2018, 136, 329–343. [Google Scholar] [CrossRef] [Green Version]
- Schansker, G.; Toth, S.Z.; Strasser, R.J. Dark recovery of the Chl a fluorescence transient (OJIP) after light adaptation: The qT-component of non-photochemical quenching is related to an activated photosystem I acceptor side. BBA-Bioenerg. 2006, 1757, 787–797. [Google Scholar] [CrossRef] [PubMed] [Green Version]
- Strasser, R.J.; Tsimilli-Michael, M.; Srivastava, A. Analysis of the chlorophyll a fluorescence transient. In Chlorophyll a Fluorescence; Papageorgiou, G.C., Govindjee, Eds.; Springer: Dordrecht, The Netherlands, 2004; pp. 321–362. [Google Scholar] [CrossRef]
- Endo, T.; Kawase, D.; Sato, F. Stromal over-reduction by high-light stress as measured by decreases in P700 oxidation by far-red light and its physiological relevance. Plant. Cell Physiol. 2005, 46, 775–781. [Google Scholar] [CrossRef] [Green Version]
- Bilger, W.; Bjorkman, O. Role of the xanthophyll cycle in photoprotection elucidated by measurements of light-induced absorbency changes, fluorescence and photosynthesis in leaves of Hedera canariensis. Photosynth. Res. 1990, 25, 173–185. [Google Scholar] [CrossRef] [PubMed]
- Shikanai, T. Cyclic electron transport around photosystem I: Genetic approaches. Annu. Rev. Plant. Biol. 2007, 58, 199–217. [Google Scholar] [CrossRef] [PubMed]
- Johnson, G.N. Reprint of: Physiology of PSI cyclic electron transport in higher plants. BBA-Bioenerg. 2011, 1807, 906–911. [Google Scholar] [CrossRef] [PubMed]
- Baranski, R.; Baranska, M.; Schulz, H. Changes in carotenoid content and distribution in living plant tissue can be observed and mapped in situ using NIR-FT-Raman spectroscopy. Planta 2005, 222, 448–457. [Google Scholar] [CrossRef] [PubMed]
- Schulz, H.; Baranska, M.; Baranski, R. Potential of NIR-FT-Raman spectroscopy in natural carotenoid analysis. Biopolymers 2005, 77, 212–221. [Google Scholar] [CrossRef]
- Mandrile, L.; Rotunno, S.; Miozzi, L.; Vaira, A.M.; Giovannozzi, A.M.; Rossi, A.M.; Noris, E. Nondestructive Raman spectroscopy as a tool for early detection and discrimination of the infection of tomato plants by two economically important viruses. Anal. Chem. 2019, 91, 9025–9031. [Google Scholar] [CrossRef] [PubMed]
- Payne, W.Z.; Kurouski, D. Raman-based diagnostics of biotic and abiotic stresses in plants. A review. Front. Plant. Sci. 2021, 11, 616672. [Google Scholar] [CrossRef]
- Zeng, J.; Ping, W.; Sanaeifar, A.; Xu, X.; Luo, W.; Sha, J.; Huang, Z.; Huang, Y.; Liu, X.; Zhan, B.; et al. Quantitative visualization of photosynthetic pigments in tea leaves based on Raman spectroscopy and calibration model transfer. Plant. Methods 2021, 17, 4. [Google Scholar] [CrossRef]
- Sene, C.F.B.; McCann, M.C.; Wilson, R.H.; Grinter, R. Fourier-transform raman and fourier-transform infrared-spectroscopy: An investigation of 5 higher plant cell walls and their components. Plant. Physiol. 1994, 106, 1623–1631. [Google Scholar] [CrossRef] [Green Version]
- Schulte, F.; Lingott, J.; Panne, U.; Kneipp, J. Chemical characterization and classification of pollen. Anal. Chem. 2008, 80, 9551–9556. [Google Scholar] [CrossRef] [PubMed]
- Tschirner, N.; Schenderlein, M.; Brose, K.; Schlodder, E.; Mroginski, M.A.; Hildebrandt, P.; Thomsen, C. Raman excitation profiles of β-carotene-novel insights into the nature of the v1-band. Phys. Status Solidi B 2008, 245, 2225–2228. [Google Scholar] [CrossRef]
- Wu, H.; Volponi, J.V.; Oliver, A.E.; Parikh, A.N.; Simmons, B.A.; Singh, S. In vivo lipidomics using single-cell Raman spectroscopy. Proc. Natl. Acad. Sci. USA 2011, 108, 3809–3814. [Google Scholar] [CrossRef] [PubMed] [Green Version]
- Pěnčík, A.; Simonovik, B.; Petersson, S.V.; Henyková, E.; Simon, S.; Greenham, K.; Zhang, Y.; Kowalczyk, M.; Estelle, M.; Zažímalová, E.; et al. Regulation of auxin homeostasis and gradients in Arabidopsis roots through the formation of the indole-3-acetic acid catabolite 2-oxindole-3-acetic acid. Plant. Cell 2013, 25, 3858–3870. [Google Scholar] [CrossRef] [PubMed] [Green Version]
- Reinecke, D.M.; Bandurski, R.S. Oxidation of indole-3-acetic acid to oxindole-3-acetic acid by an enzyme preparation from Zea mays. Plant. Physiol. 1988, 86, 868–872. [Google Scholar] [CrossRef] [PubMed] [Green Version]
- Liu, X.; Cohen, J.D.; Gardner, G. Low-fluence red light increases the transport and biosynthesis of auxin. Plant. Physiol. 2011, 157, 891–904. [Google Scholar] [CrossRef] [Green Version]
- Rubinstein, B. Auxin and red light in the control of hypocotyl hook opening in beans. Plant. Physiol. 1971, 48, 187–192. [Google Scholar] [CrossRef] [PubMed] [Green Version]
- Folta, K.M.; Maruhnich, S.A. Green light: A signal to slow down or stop. J. Exp. Bot. 2007, 58, 3099–3111. [Google Scholar] [CrossRef]
- Higashide, T.; Narukawa, M.; Shimada, Y.; Soeno, K. Suppression of elongation and growth of tomato seedlings by auxin biosynthesis inhibitors and modeling of the growth and environmental response. Sci. Rep. 2014, 2, 4556. [Google Scholar] [CrossRef] [Green Version]
- Almansa, E.M.; Espin, A.; Maria Chica, R.; Teresa Lao, M. Changes in endogenous auxin concentration in cultivars of tomato seedlings under artificial light. Hortscience 2011, 46, 698–704. [Google Scholar] [CrossRef] [Green Version]
- Grove, M.D.; Spencer, G.F.; Rohwedder, W.K.; Mandava, N.; Worley, J.F.; Warthen, J.D.; Steffens, G.L.; Flippen-Anderson, J.L.; Cook, J.C. Brassinolide, a plant growth-promoting steroid isolated from Brassica napus pollen. Nature 1979, 281, 216–217. [Google Scholar] [CrossRef]
- Sadura, I.; Janeczko, A. Physiological and molecular mechanisms of brassinosteroid-induced tolerance to high and low temperature in plants. Biol. Plant. 2018, 62, 601–616. [Google Scholar] [CrossRef] [Green Version]
- Asahina, M.; Tamaki, Y.; Sakamoto, T.; Shibata, K.; Nomura, T.; Yokota, T. Blue light-promoted rice leaf bending and unrolling are due to up-regulated brassinosteroid biosynthesis genes accompanied by accumulation of castasterone. Phytochemistry 2014, 104, 21–29. [Google Scholar] [CrossRef] [PubMed]
- Kim, B.K.; Fujioka, S.; Takatsuto, S.; Tsujimoto, M.; Choe, S. Castasterone is a likely end product of brassinosteroid biosynthetic pathway in rice. Biochem. Biophys. Res. Commun. 2008, 374, 614–619. [Google Scholar] [CrossRef] [PubMed]
- Sadura, I.; Latowski, D.; Oklestkova, J.; Gruszka, D.; Chyc, M.; Janeczko, A. Molecular dynamics of chloroplast membranes isolated from wild-type barley and a brassinosteroid-deficient mutant acclimated to low and high temperatures. Biomolecules 2021, 11, 27. [Google Scholar] [CrossRef] [PubMed]
- Efimova, M.V.; Kusnetsov, V.V.; Kravtsov, A.K.; Karnachuk, R.A.; Khripach, V.A.; Kuznetsov, V.V. Regulation of the transcription of plastid genes in plants by brassinosteroids. Dokl. Biol. Sci. 2012, 445, 272–275. [Google Scholar] [CrossRef] [PubMed]
- Amann, K.; Lezhneva, L.; Wanner, G.; Herrmann, R.G.; Meurer, J. Accumulation of photosystem ONE1, a member of a novel gene family, is required for accumulation of 4Fe-4S cluster-containing chloroplast complexes and antenna proteins. Plant. Cell 2004, 16, 3084–3097. [Google Scholar] [CrossRef] [Green Version]
- Pramanik, K.; Pradhan, J.; Sahoo, S.K. Role of auxin and gibberellins growth, yield and quality of tomato: A review. J. Pharm. Innov. 2018, 7, 301–305. [Google Scholar]
- Vardhinl, B.V.; Rao, S.S.R. Effect of brassinosteroids on growth and yield of tomato (Lycopersicon esculentum Mill.) under field conditions. J. Plant. Physiol. 2001, 6, 326–328. [Google Scholar]
- Nie, S.; Huang, S.; Wang, S.; Cheng, D.; Liu, J.; Lv, S.; Li, Q.; Wang, X. Enhancing brassinosteroid signaling via overexpression of tomato (Solanum lycopersicum) SlBRI1 improves major agronomic traits. Front. Plant. Sci. 2017, 8, 1386. [Google Scholar] [CrossRef] [Green Version]
- Hansch, F.; Jaspar, H.; von Sivers, L.; Bitterlich, M.; Franken, P.; Kuehn, C. Brassinosteroids and sucrose transport in mycorrhizal tomato plants. Plant. Signal. Behav. 2020, 15, 1714292. [Google Scholar] [CrossRef] [PubMed] [Green Version]
- Skoczowski, A.; Janeczko, A.; Gullner, G.; Tóbias, I.; Kornas, A.; Barna, B. Response of brassinosteroid-treated oilseed rape cotyledons to infection with the wild type and HR-mutant of Pseudomonas syringae or with P. fluorescence. J. Therm. Anal. Calorim. 2011, 104, 131–139. [Google Scholar] [CrossRef]
- Strasser, R.J.; Srivastava, A.; Tsimilli-Michael, M. The fluorescence transient as a tool to characterize and screen photosynthetic samples. In Probing Photosynthesis: Mechanisms, Regulation and Adaptation; Yunus, M., Pathre, U., Mohanty, P., Eds.; Taylor and Francis: London, UK, 2000; pp. 445–483. [Google Scholar]
- Bąba, W.; Kalaji, H.M.; Kompala-Bąba, A.; Goltsev, V. Acclimatization of photosynthetic apparatus of tor grass (Brachypodium pinnatum) during expansion. PLoS ONE 2016, 11, e0156201. [Google Scholar] [CrossRef] [Green Version]
- Kalaji, H.M.; Oukarroum, A.; Alexandrov, V.; Kouzmanova, M.; Brestic, M.; Zivcak, M.; Samborska, I.A.; Cetner, M.D.; Allakhverdiev, S.I.; Goltsev, V. Identification of nutrient deficiency in maize and tomato plants by in vivo chlorophyll a fluorescence measurements. Plant. Physiol. 2014, 81, 16–25. [Google Scholar] [CrossRef] [PubMed]
- Kalaji, H.M.; Schansker, G.; Brestic, M.; Bussotti, F.; Calatayud, A.; Ferroni, L.; Goltsev, V.; Guidi, L.; Jajoo, A.; Li, P.; et al. Frequently asked questions about chlorophyll fluorescence, the sequel. Photosynth. Res. 2016, 132, 13–66. [Google Scholar] [CrossRef] [PubMed] [Green Version]
- Genty, B.; Briantais, J.M.; Baker, N.R. The relationship between the quantum yield of photosynthetic electron transport and quenching of chlorophyll fluorescence. Biochim. Biophys. Acta 1989, 990, 87–92. [Google Scholar] [CrossRef]
- Kramer, D.M.; Johnson, G.; Kiirats, O.; Edwards, G.E. New fluorescence parameters for the determination of Q(A) redox state and excitation energy fluxes. Photosynth. Res. 2004, 79, 209–218. [Google Scholar] [CrossRef] [PubMed]
- Klughammer, C.; Schreiber, U. An improved method, using saturating light pulses, for the determination of photosystem I quantum yield via P700+-absorbance changes at 830 nm. Planta 1994, 192, 261–268. [Google Scholar] [CrossRef]
- Pěnčík, A.; Rolčík, J.; Novák, O.; Magnus, V.; Barták, P.; Buchtík, R.; Salopek-Sondi, B.; Strnad, M. Isolation of novel indole-3-acetic acid conjugates by immunoaffinity extraction. Talanta 2009, 80, 651–655. [Google Scholar] [CrossRef] [PubMed]
- Novák, O.; Hényková, E.; Sairanen, I.; Kowalczyk, M.; Pospíšil, T.; Ljung, K. Tissue-specific profiling of the Arabidopsis thaliana auxin metabolome. Plant. J. 2012, 72, 523–536. [Google Scholar] [CrossRef] [PubMed]
- Oklestkova, J.; Tarkowska, D.; Eyer, L.; Elbert, T.; Marek, A.; Smrzova, Z.; Novak, O.; Franek, M.; Zhabinskii, V.N.; Strnad, M. Immunoaffinity chromatography combined with tandem mass spectrometry: A new tool for the selective capture and analysis of brassinosteroid plant hormones. Talanta 2017, 170, 432–440. [Google Scholar] [CrossRef]
- Tarkowska, D.; Novak, O.; Oklestkova, J.; Strnad, M. The determination of 22 natural brassinosteroids in a minute sample of plant tissue by UHPLC-ESI-MS/MS. Anal. Bioanal. Chem. 2016, 408, 6799–6812. [Google Scholar] [CrossRef] [PubMed]


| Light Sources | PN [µmol (CO2) m−2 s−1] | gs [mol (H2O) m−2 s−1] | Ci [µmol (CO2) mol (air)−1] | WUE [µmol (CO2) mmol−1 (H2O)] |
|---|---|---|---|---|
| HPS | 9.2 ± 2.4 (100%) bc | 0.18 ± 0.05 (100%) b | 226 ± 17 (100%) c | 3.3 ± 0.4 (100%) ab |
| L1 | 8.8 ± 2.3 (−5%) c | 0.21 ± 0.09 (+20%) b | 254 ± 22 (+12%) b | 3.0 ± 0.7 (−10%) abc |
| L2 | 12.5 ± 2.1 (+35%) ab | 0.26 ± 0.07 (+47%) b | 238 ± 17 (+5%) bc | 3.6 ± 0.5 (+7%) a |
| L3 | 9.9 ±1.4 (+8%) bc | 0.28 ± 0.13 (+58%) b | 246 ± 23 (+9%) bc | 3.1 ± 0.7 (−8%) abc |
| L4 | 14.8 ± 5.5 (+60%)a | 0.49 ± 0.29 (+178%) a | 246 ± 12 (+9%) bc | 2.6 ± 0.3 (−23%) cd |
| L5 | 9.0 ± 3.9 (−2%) c | 0.23 ± 0.06 (+28%) b | 253 ± 31 (+12%) b | 2.7 ± 1.0 (−18%) bcd |
| L6 | 8.7 ± 1.5 (−5%) c | 0.18 ± 0.03 (−1%) b | 248 ± 14 (+10%) b | 3.3 ± 0.3 (−2%) ab |
| L7 | 9.0 ± 3.5 (−3%) c | 0.31 ± 0.13 (+73%) b | 280 ±16 (+24%) a | 2.3 ± 0.6 (−32%) d |
| Peak’s Position (Raman Shift, cm−1) | Vibrations |
|---|---|
| 476 | Carbohydrates (starch) |
| 740/1263/1324/1386 | Chlorophyll a |
| 865 | Pectin compounds |
| 865/916/943 | Polysaccharides |
| 1455/1606 | Proteins |
| 1004/1155/1525 | Carotenoids |
| 1186 | β-carotene |
| 1286/1455 | Lipids |
| 1440/1606 | Flavonoid compounds |
| 1263/1625 | Lipids (unsaturated fatty acids) |
Publisher’s Note: MDPI stays neutral with regard to jurisdictional claims in published maps and institutional affiliations. |
© 2021 by the authors. Licensee MDPI, Basel, Switzerland. This article is an open access article distributed under the terms and conditions of the Creative Commons Attribution (CC BY) license (https://creativecommons.org/licenses/by/4.0/).
Share and Cite
Kula-Maximenko, M.; Niewiadomska, E.; Maksymowicz, A.; Ostrowska, A.; Oklestkova, J.; Pěnčík, A.; Janeczko, A. Insight into Details of the Photosynthetic Light Reactions and Selected Metabolic Changes in Tomato Seedlings Growing under Various Light Spectra. Int. J. Mol. Sci. 2021, 22, 11517. https://doi.org/10.3390/ijms222111517
Kula-Maximenko M, Niewiadomska E, Maksymowicz A, Ostrowska A, Oklestkova J, Pěnčík A, Janeczko A. Insight into Details of the Photosynthetic Light Reactions and Selected Metabolic Changes in Tomato Seedlings Growing under Various Light Spectra. International Journal of Molecular Sciences. 2021; 22(21):11517. https://doi.org/10.3390/ijms222111517
Chicago/Turabian StyleKula-Maximenko, Monika, Ewa Niewiadomska, Anna Maksymowicz, Agnieszka Ostrowska, Jana Oklestkova, Aleš Pěnčík, and Anna Janeczko. 2021. "Insight into Details of the Photosynthetic Light Reactions and Selected Metabolic Changes in Tomato Seedlings Growing under Various Light Spectra" International Journal of Molecular Sciences 22, no. 21: 11517. https://doi.org/10.3390/ijms222111517